Microsecond interaural time difference discrimination restored by cochlear implants after neonatal deafness
- Department of Biomedical Sciences, City University of Hong Kong, China
- Neurobiological Research Laboratory, Section for Clinical and Experimental Otology, University Medical Center Freiburg, Germany
- CityU Shenzhen Research Institute, China
Figures
Figure 1
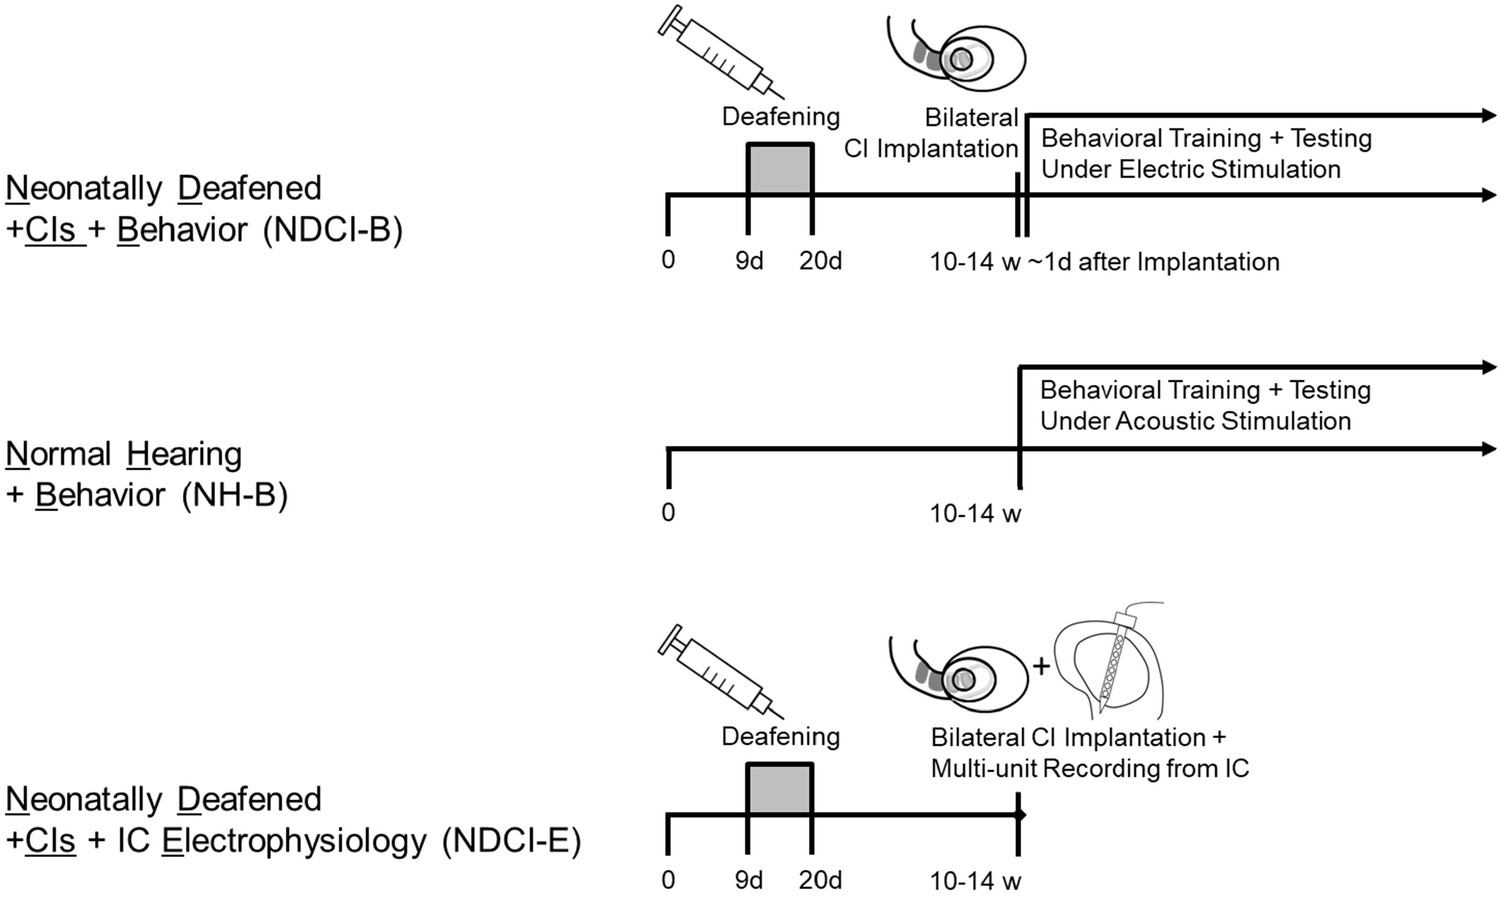
Timeline and experimental treatment of our three cohorts.
NDCI-B and NDCI-E rats were both neonatally deafened by kanamycin and bilaterally implanted as young adults. Around half of them went into a behavioral training and testing (NDCI-B), while the other half were used for multi-unit recordings of IC neurons directly after bilateral CI implantation. NH-B rats were normal hearing and started a behavioral training and testing as young adults. w: weeks. d: days.
Figure 2 with 2 supplements
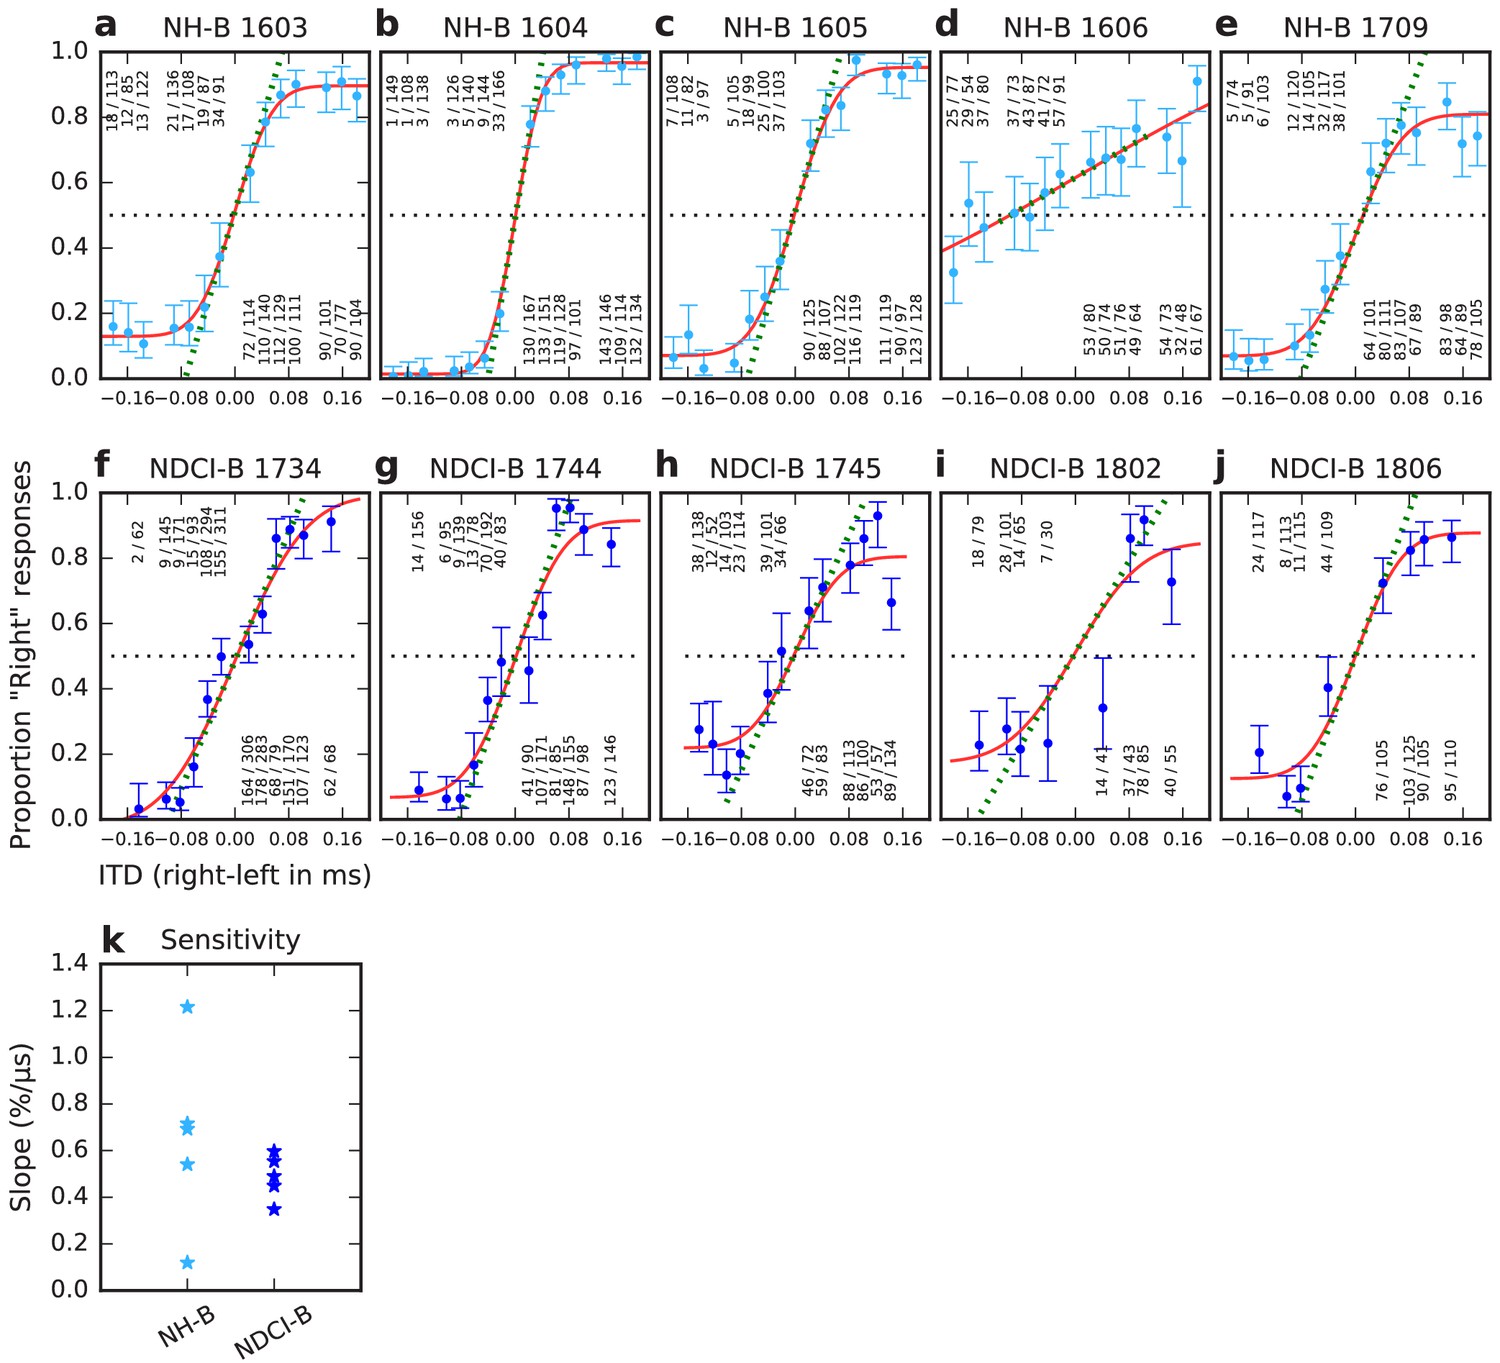
ITD psychometric curves of normal hearing acoustically stimulated (NH-B, a–e) and neonatally deafened CI-stimulated rats (NDCI-B, f–j).
Panel titles show corresponding animal IDs. Y-axis: proportion of responses to the right-hand side. X-axis: Stimulus ITD in ms, with negative values indicating left ear leading. Blue dots: observed proportions of ‘right’ responses for the stimulus ITD given by the x-coordinate. Number fractions shown above or below each dot indicate the absolute number of trials and ‘right’ responses for corresponding ITDs. Blue error bars show Wilson score 95% confidence intervals for the underlying proportion ‘right’ judgments. Red lines show sigmoid psychometric curves fitted to the blue data using maximum likelihood. Green dashed lines show slopes of psychometric curves at x = 0. Slopes serve to quantify the behavioral sensitivity of the animal to ITD. Panel (k) summarizes the ITD sensitivities (psychometric slopes) across the individual animal data shown in (a–j) in units of % change in animals’ ‘right’ judgments per μs change in ITD.
Figure 2—figure supplement 1
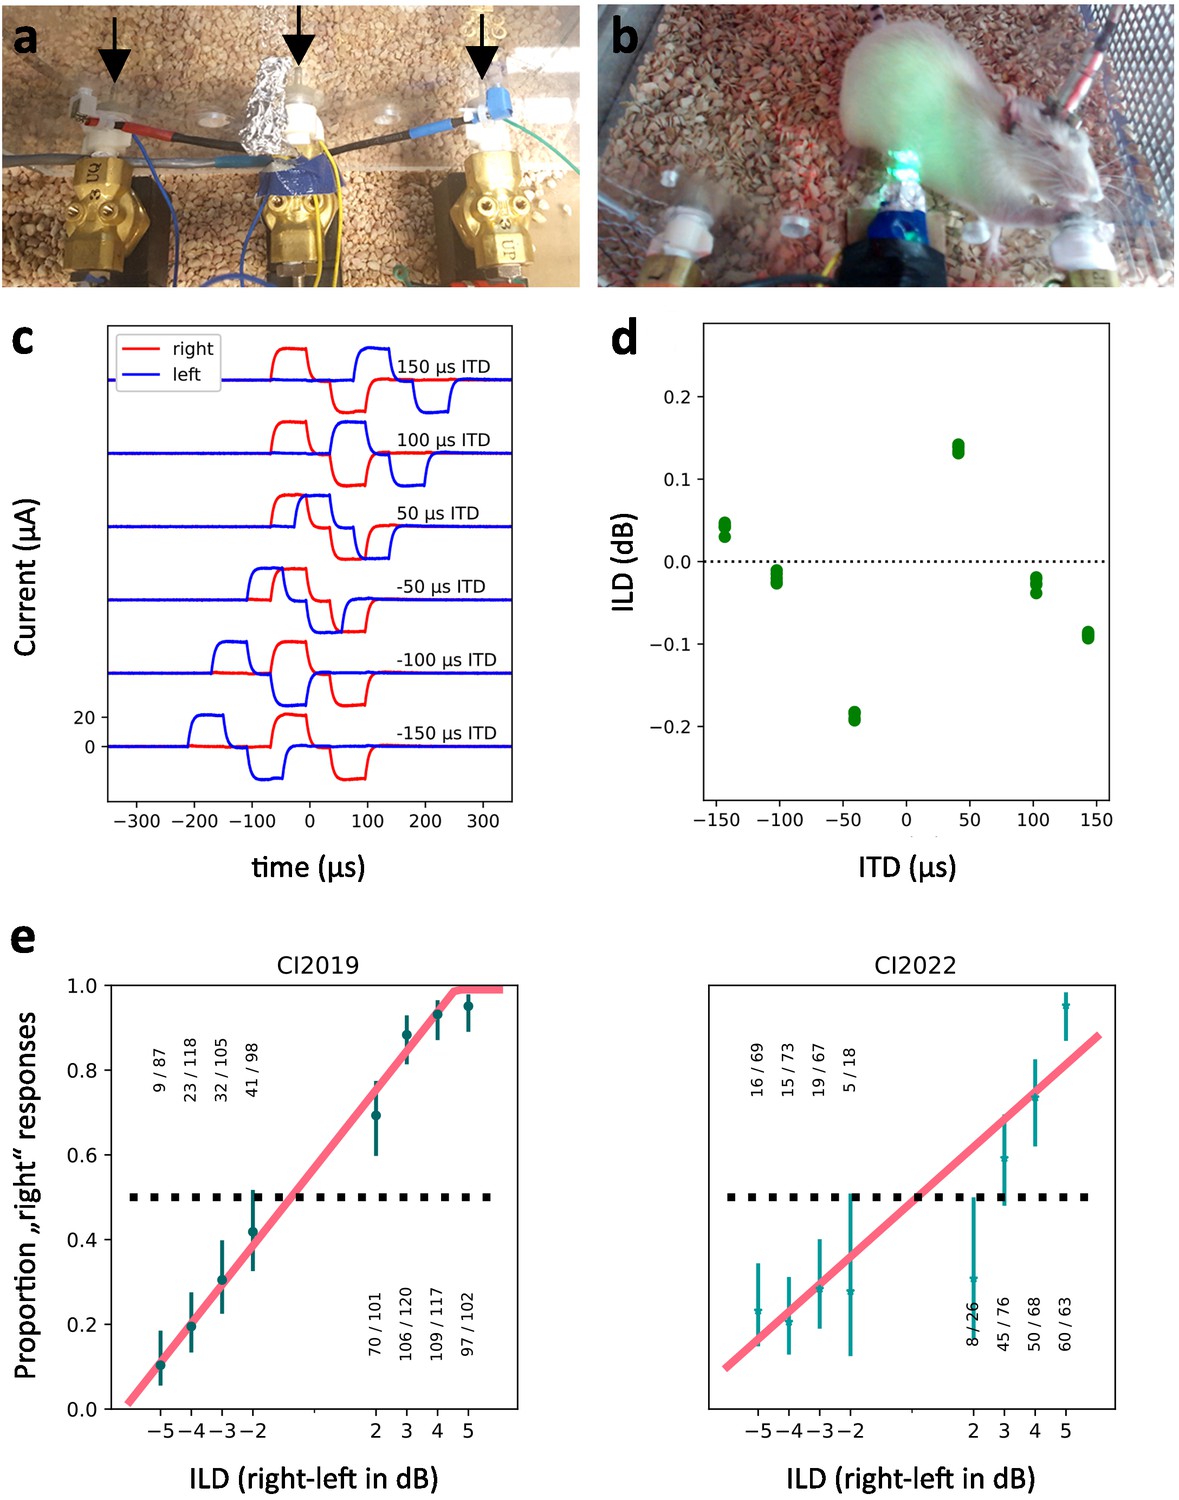
Bilateral electrical intracochlear stimulation of cochlear implanted (CI) rats.
(a) Close-up of the training setup for CI rats. The central ‘start’ and lateral ‘response’ spouts deliver the water reward and are indicated by arrows. (b) CI rat during a testing session, making a response to the left by making contact with the left reward spout. (c) Calibration measurements of stimulus pulses recorded by connecting the stimulator cable to 10 kΩ resistors instead of the in vivo electrodes and recording voltages using a Tektronix MSO 4034B oscilloscope. Recordings of stimulus pulses are shown with ±50, 100, and 150 µs ITDs as indicated. Pulses delivered to the right ear channel are shown in red, and those delivered in the left ear in blue. (d) To measure the size of artifactual, unintended interaural level differences (ILDs) that our system generates, the root mean square (RMS) amplitudes of the stimulus traces shown in (c) were compared. The resulting ILDs for five repeat presentations are shown. One observes very small, artifactual ILDs that are attributable to a tiny amount of capacitive/inductive channel cross-talk in the wires leading from the programmable stimulator to the implants. A current pushed through one wire will induce a tiny current in the wire running parallel to it by magnetic induction. On careful inspection of the traces in Figure 2c, one can see tiny little red bumps coinciding with big blue rising or falling phases and vice versa, which correspond to these induced currents. (Magnetic induction of currents is proportional to rate of change in field strength and hence occurs during rising and falling phases of the current pulses.) The currents measured by the oscilloscope and used here for stimulus calibration are thus a superposition of the direct stimulus current injected into a given channel by the stimulator, plus the very much smaller induced current from the cross-talk from the neighboring channel. The direct current pulses and the cross-talk current pulses can be either in phase or out of phase with each other depending on the ITD, which will lead to either constructive or destructive interference. This creates the small ILDs and accounts for their dependence on ITD. Note that these very small artifactual ILDs cannot account for our behavioral results because they are an order of magnitude below the animals’ typical ILD thresholds (e) and they lack the required systematic relationship with ITD that would be needed if one tried to account for the ITD psychometric function in terms of sensitivity to the tiny artifactual ILDs. The largest ITD-induced ILD is 0.18 dB, or equivalently 2.17%. At 100 μs ITD, where our rats routinely achieve 80% correct or better (compare Figure 2) the ILD is as low as 0.018 dB and does not change sign with the ITD, and would therefore have to be completely uninformative. (e) Behavioral ILD psychometric curves obtained from two additional ND-CI rats (not part of the cohorts introduced in Figure 1). Two rats were neonatally deafened, fitted with CIs as young adults and trained in sound lateralization tasks exactly as described in the methods, except that for these tests, the ITD of the pulses was kept constant at 0 and the relative amplitude of the left and right ear pulses was varied from trial to trial to introduce ILDs. The pyschometrics are plotted using the same conventions as in Figure 2, with the blue error bars showing Wilson confidence intervals for the proportion of right responses at each ILD and the red lines showing bounded linear psychometric functions fit to the data. Note that, to reach levels of performance >75% correct, both animals need ILDs of >2 dB, at least an order of magnitude larger than the largest 0.18 dB artifactual ILD observed.
Figure 2—figure supplement 2

Bilateral psychoacoustics near-field setup for normal hearing (NH) rats.
Note that the setup is identical to that described in Li et al., 2019 and this figure supplement is similar to Figure 1 of that article. (a) NH rat during a testing session, initiating a trial by making contact with the central ‘start’ spout. Steel tube phones are positioned close to each ear, effectively implementing a pair of open stereo headphones. (b) Close-up of the assembly. The central ‘start’ and lateral ‘response’ spouts deliver the water reward and are indicated by arrows. Also visible are the custom ball joints for adjusting the tube phone positions. (c) 3D printed ‘rat acoustical manikin’ with miniature microphones in each ear canal, used for validating the setup. (d) Validation data for acoustic click stimuli as recorded from the microphones inside each ear canal of the 3D printed ‘rat acoustical manikin’ (L: left ear, R: right ear) in response to the ±100 µs interaural time difference (ITD) conditions (top and bottom pair of traces, respectively). (e) Frequency spectra of the sound waveforms recorded by the microphones in each ear for the +100 µs (top) and −100 µs (bottom) conditions. (f) Acoustic interaural level differences (ILDs, y-axes) measured through the ‘rat acoustical manikin’ microphones for the ±100 µs ITD conditions. ILDs were computed as the difference in root mean square (RMS) power of the signals in panel (d). Data were recorded from 10 presentations of each ITD stimulus, and each dot represents one trial (a random amount of scatter along the x-axis was added for ease of visualization). Dotted lines show the reported behavioral thresholds for ferrets (~ ±1.3 dB, Keating et al., 2013b).
Figure 3
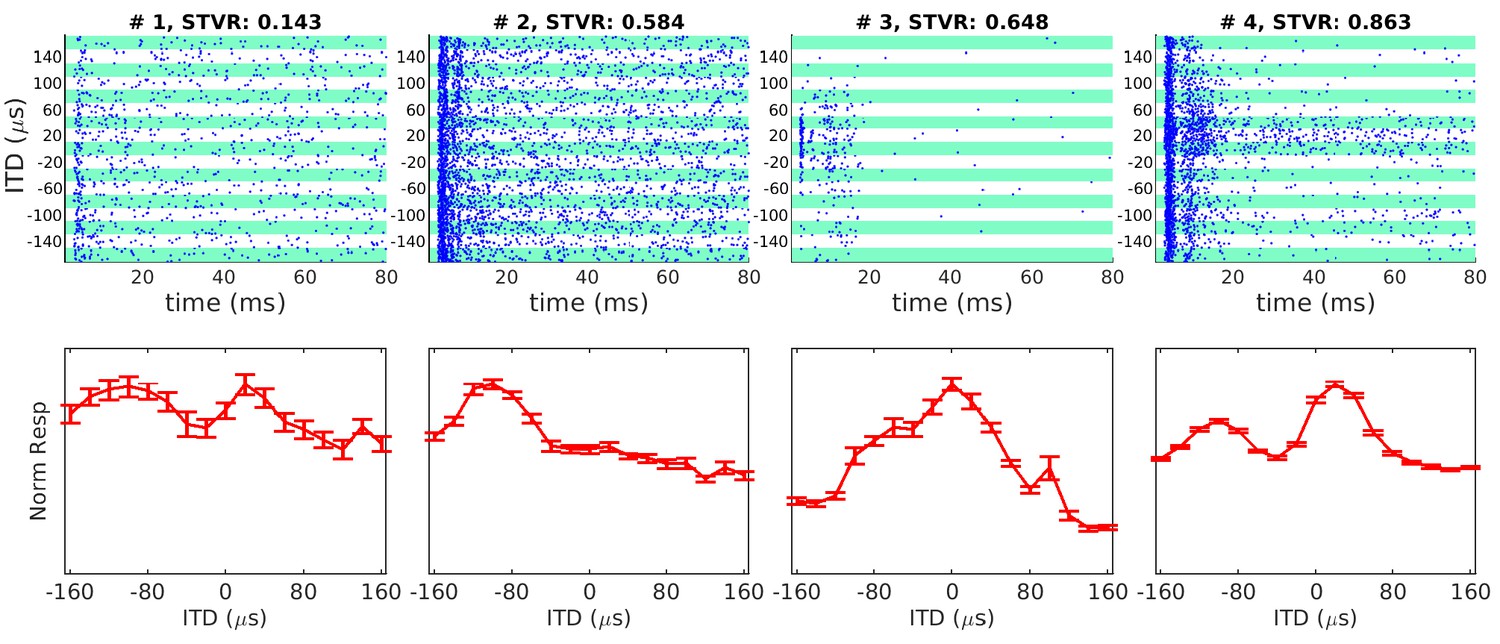
Examples of interaural time difference (ITD) tuning curves of neonatally deafened CI rats (NDCI-E) as a function of ITD.
Dot raster plots are shown above the corresponding ITD tuning curves. The multi-units shown were selected to illustrate some of the variety of ITD tuning curve depths and shapes observed. In the raster plots, each blue dot shows one spike. Alternating white and green bands show responses to n = 30 repeats at each ITD shown. Tuning curve response amplitudes are baseline corrected and normalized relative to the maximum of the mean response across all trials, during a period of 3–80 ms post-stimulus onset. Error bars show SEM. Above each sub-panel we show signal-to-total variance ratio (STVR) values to quantify ITD tuning. Panels are arranged top to bottom by increasing STVR. ITD > 0: ipsilateral ear leading; ITD < 0: contralateral ear leading.
Figure 4

Bar chart shows distributions of interaural time difference (ITD) signal-to-total variance ratio (STVR) values for inferior colliculus (IC) multi-units of neonatally deafened cochlear implanted rats (NDCI-E, red).
STVR value distributions for IC single-unit data recorded by Hancock et al., 2010 for congenitally deaf cats (blue) under cochlear implant stimulation are also shown for comparison and are referred to as SNR in this cat study.
Figure 5
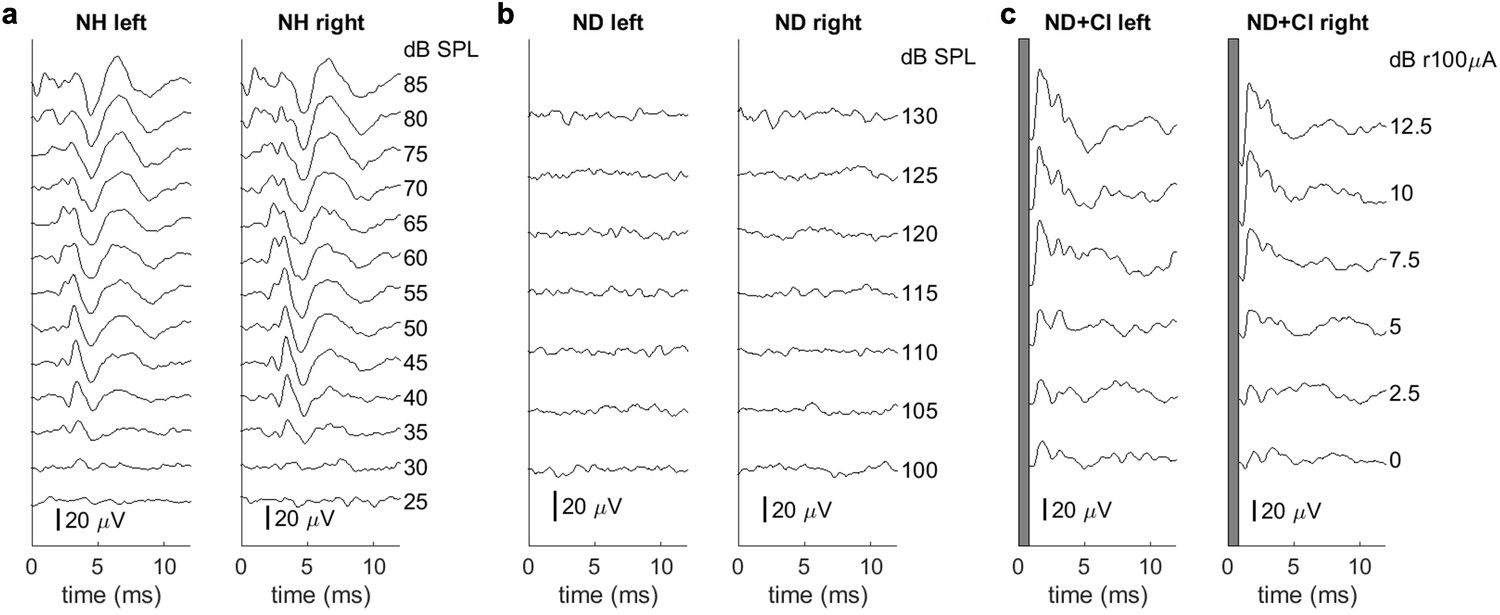
Examples of brainstem recordings to verify normal hearing or loss of hearing function as well as the symmetrical placement of cochlear implants (CIs).
Each recording is from a single animal. Panels (b) and (c) come from the same animal pre- and post-CI implantation. (a) Auditory brainstem responses of an acoustically stimulated normal hearing (NH) rat. ABRs are symmetric for both ears and show clear differentiation. (b) ABRs of a neonatally deafened (ND) rat. No hearing thresholds were detectable up to 130 dB SPL. (c) Electrically evoked ABRs under CI stimulation of a deafened rat. Each sub-panel includes measurements for the left and the right ears, respectively, under acoustic (a, b) or electric stimulation (c). In (c), the first millisecond (electrical stimulus artifact) is blanked out.
Author response image 1
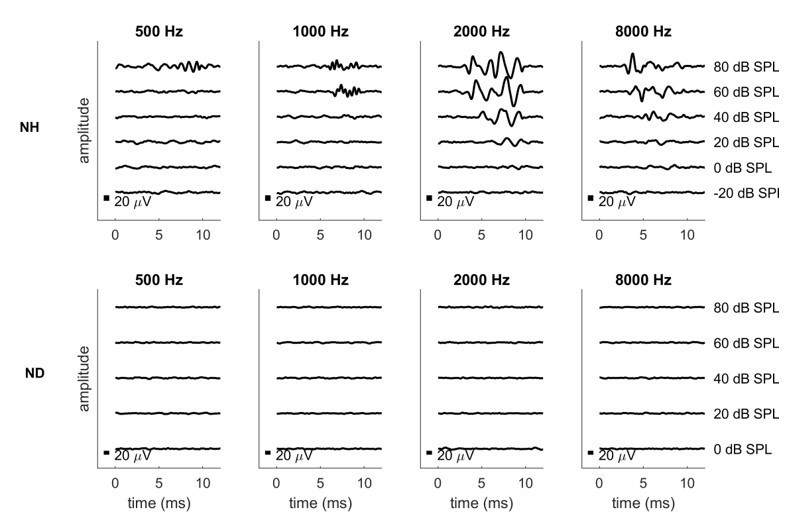
Pure tone ABRs for one normally hearing (NH, top row) and one neonatally deafened (ND, bottom row) animal.
Author response image 2
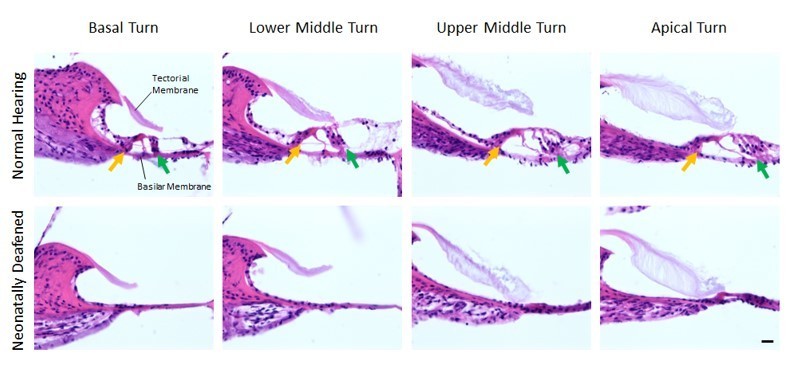
Organs of Corti of 11 weeks old normal hearing (first row) and neonatally deafened (second row) rats.
All four Organs of Corti from base to apex are shown from left to right. While the Organs of Corti of normal hearing rats show three rows of outer hair cells (green arrow) and one row of inner hair cells (orange arrow), they are completely missing in all cochlea turns of the deafened rats. Scale bar: 20 µm.
Videos
Video 1
Neonatally deafened CI rat performing a two-alternative forced choice ITD lateralization task in a custom-made behavior setup.
The animal initiates trials by licking the center ‘start spout’ and responds to binaural pulse trains by licking either the left or right ‘response spout’ to receive drinking water as positive reinforcement if the response is correct or a time out with the flashing light as negative reinforcement if the response is incorrect. Which response was correct was indicated by the ITD stimulus presented on that trial when the animal licks the center spout.
Additional files
Download links
A two-part list of links to download the article, or parts of the article, in various formats.
Downloads (link to download the article as PDF)
Open citations (links to open the citations from this article in various online reference manager services)
Cite this article (links to download the citations from this article in formats compatible with various reference manager tools)
Microsecond interaural time difference discrimination restored by cochlear implants after neonatal deafness
eLife 10:e59300.
https://doi.org/10.7554/eLife.59300


