One-shot analysis of translated mammalian lncRNAs with AHARIBO
- IMMAGINA BioTechnology, Italy
- Department of Biochemistry, Albert Einstein College of Medicine, United States
- Mass Spectrometry Facility, Computational and Integrative Biology (CIBIO), University of Trento, Italy
- Laboratory of Bioinformatics and Computational Genomics, Department of Cellular, Computational and Integrative Biology (CIBIO), University of Trento, Italy
- Laboratory of Translational Genomics, Department of Cellular, Computational and Integrative Biology (CIBIO), University of Trento, Italy
- Department of Physics, University of Trento, Italy
- Institute of Biophysics, CNR Unit at Trento, Italy
Figures
Figure 1 with 3 supplements
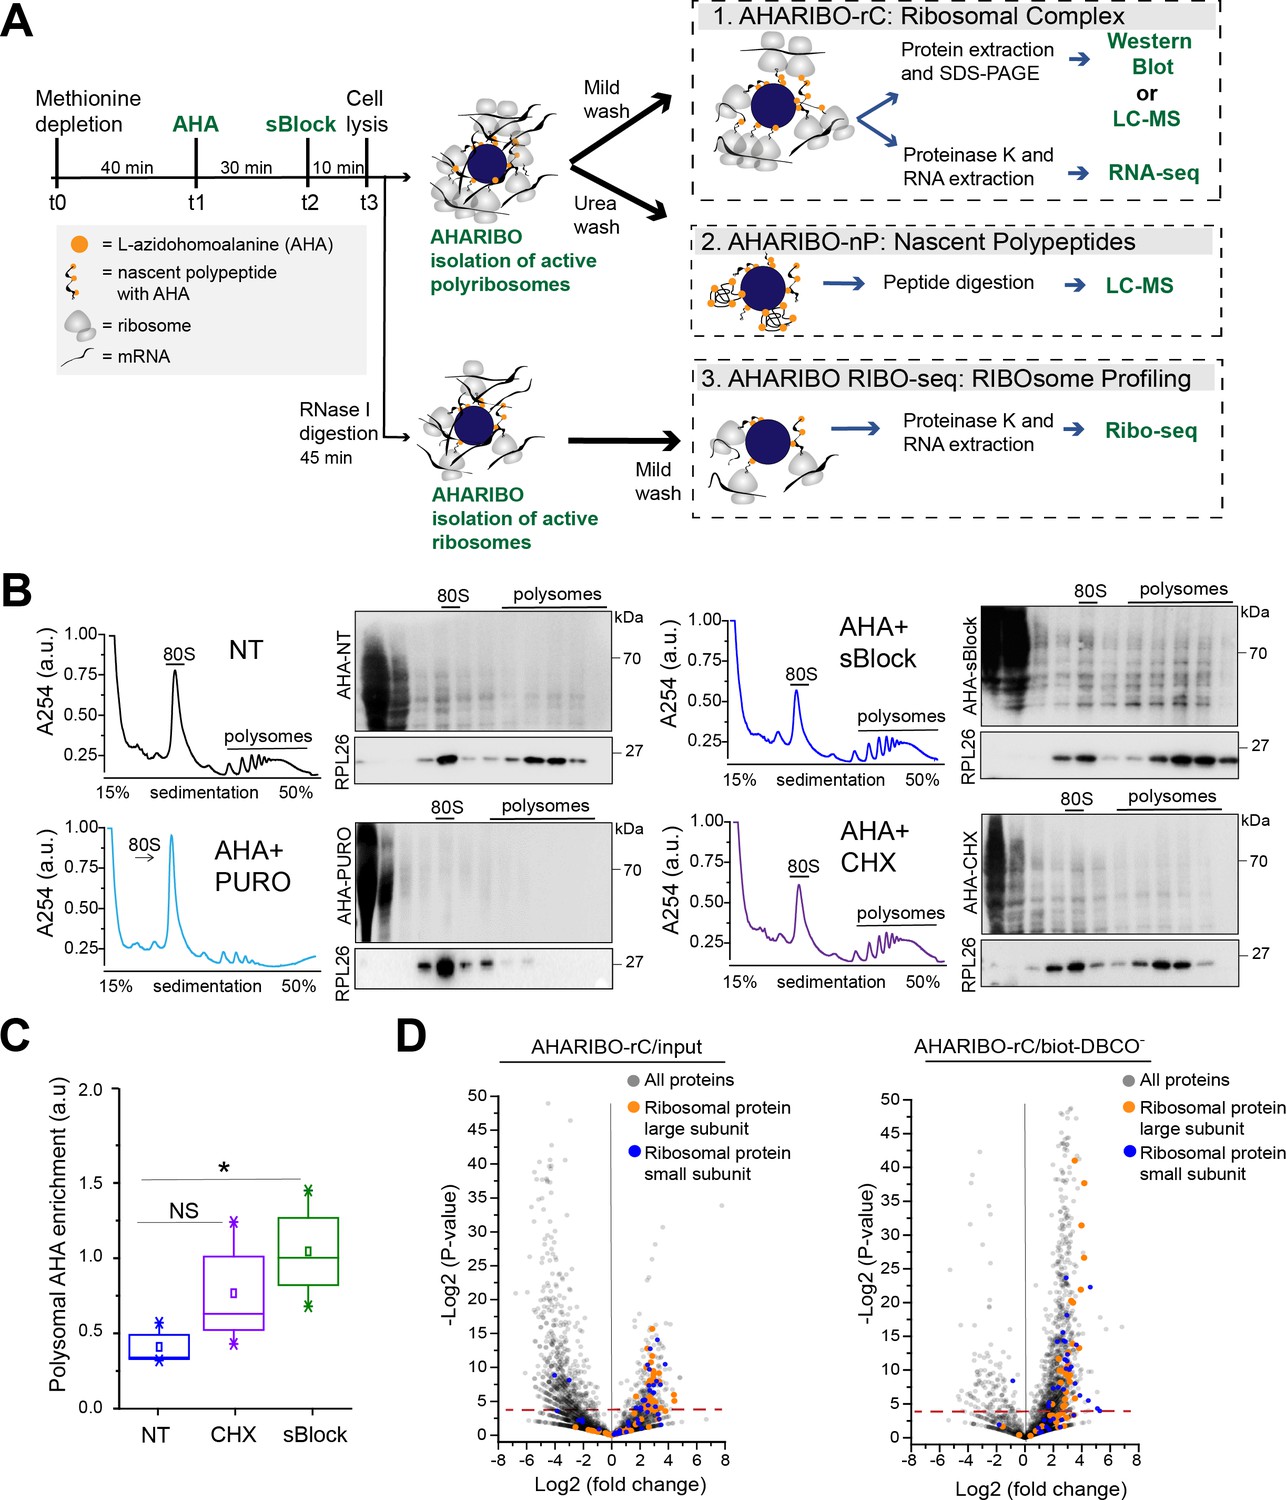
L-Azidohomoalanine (AHA) labeling of nascent peptide chains and ribosome separation.
(A) Schematic representation of AHA-mediated RIBOsome isolation (AHARIBO) workflow. After methionine depletion, AHA incubation, and sBlock treatment, cell lysates can be processed for (1) AHARIBO-rC: isolation of translational complexes (ribosomes, ribosome-associated proteins, nascent peptides, and RNAs); (2) AHARIBO-nP: isolation of de novo synthesized proteome; and (3) AHARIBO RIBO-seq: for ribosome profiling. (B) Polysomal profiles in HeLa cells. On the right of each profile, example of SDS-PAGE of protein extracts from each fraction of the profile. Staining of the membrane was performed by biotin cycloaddition followed by streptavidin-Horseradish peroxidase (HRP). RPL26 protein was used as a marker of the large ribosome subunit. (C) Box plot showing the AHA signal enrichment in the polysomal fractions of the profiles in cells untreated (NT) and treated with either cycloheximide (CHX) or sBlock. Results are shown as the median (±SE) of three independent experiments. NS: not significant. *p-value=0.05 was obtained through an unpaired t-test. (D) Volcano plots of AHARIBO-rC-isolated proteins. Data are compared with input (AHA-containing lysate, left) or with streptavidin-coated beads without biotin-DBCO (right). DBCO: dibenzocyclooctyne. Red line: t-test p-value<0.05.
-
Figure 1—source data 1
A table with the relative abundance of AHARIBO-rC-isolated proteins.
Relative abundance of AHARIBO-rC-isolated proteins. AHARIBO: AHA-mediated RIBOsome isolation.
- https://cdn.elifesciences.org/articles/59303/elife-59303-fig1-data1-v2.xlsx
-
Figure 1—source data 2
Gene Ontology analysis data.
- https://cdn.elifesciences.org/articles/59303/elife-59303-fig1-data2-v2.xlsx
Figure 1—figure supplement 1
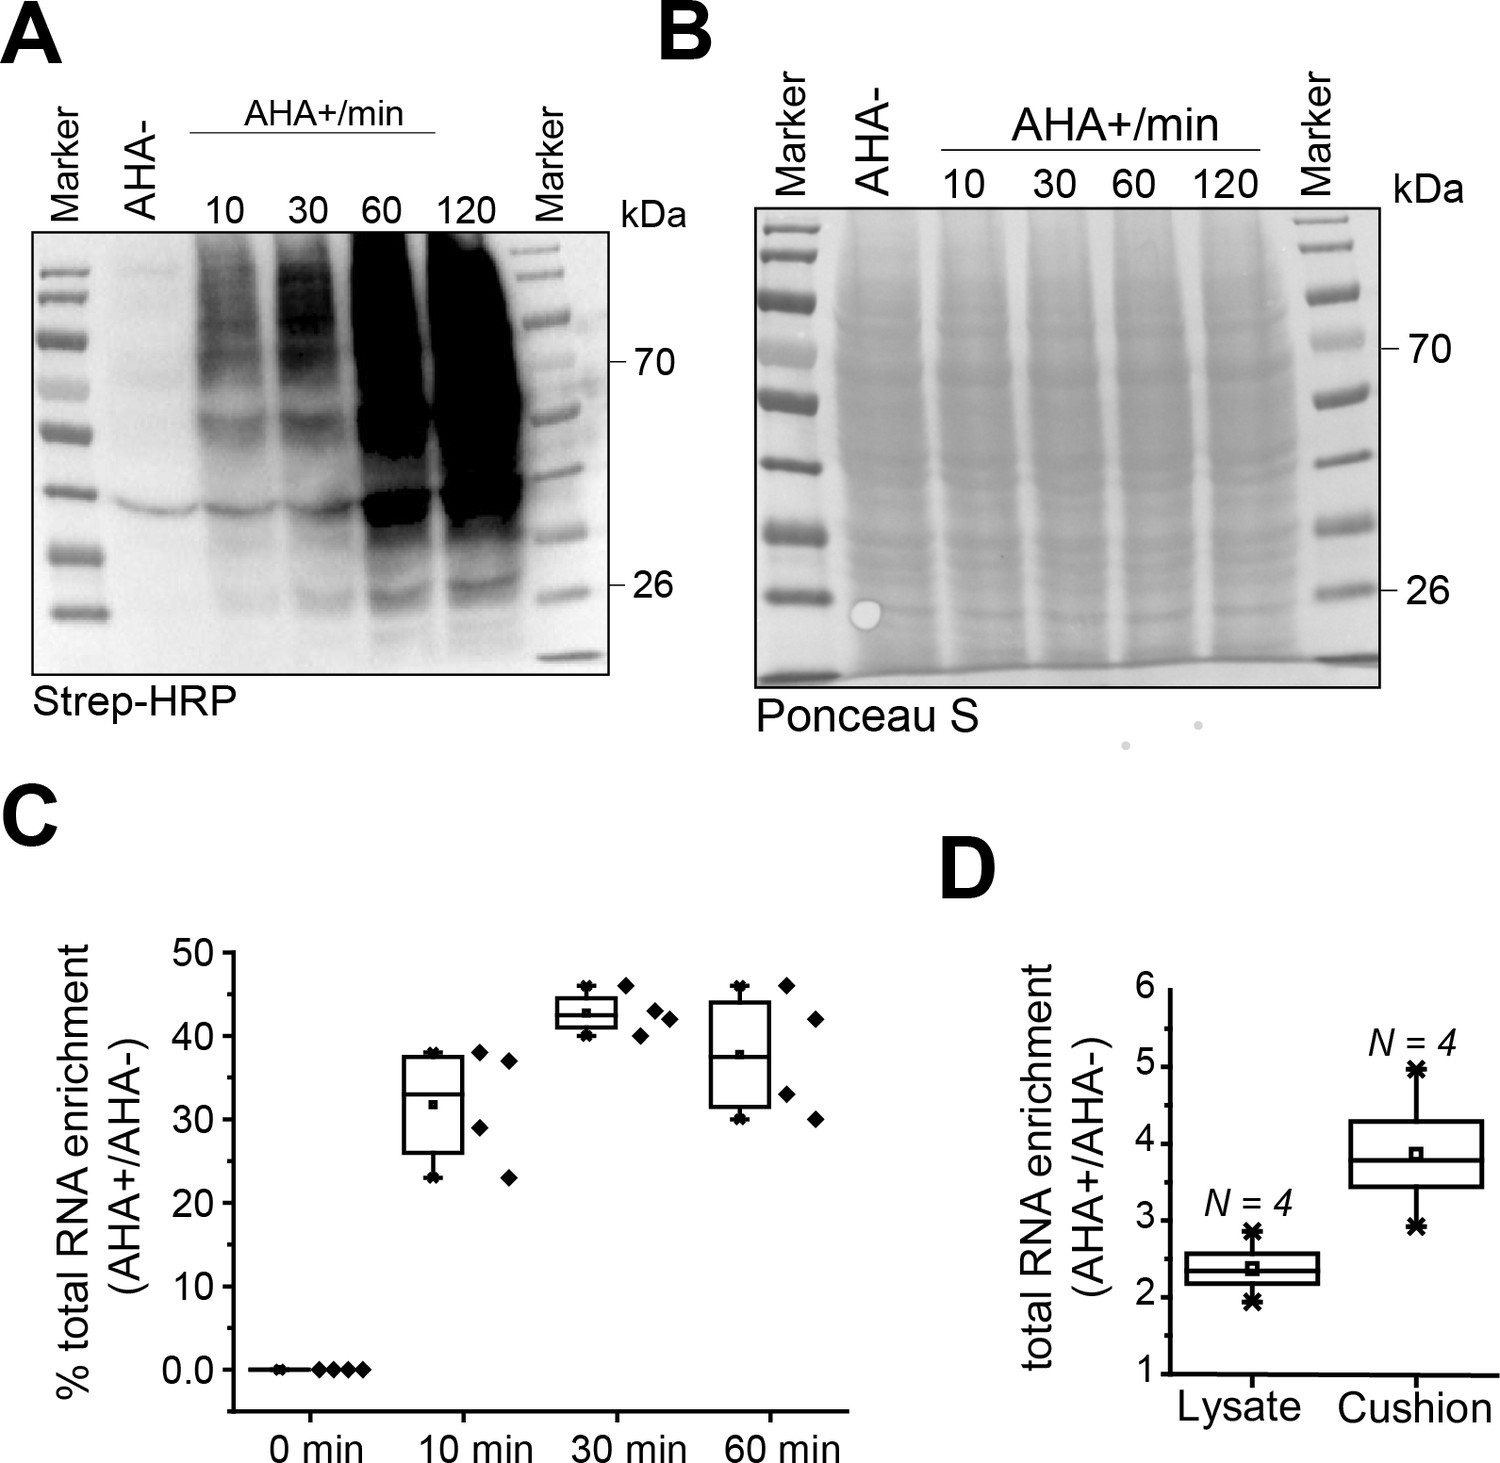
L-Azidohomoalanine (AHA) incorporation, validation of AHA, and RNA capture.
(A) Labeling of nascent peptides in cells treated with AHA (250 µM) at different incubation times (10, 30, 60, and 120 min). After SDS-PAGE of cell extracts, AHA residues were biotinylated by on-membrane cycloaddition based ‘click chemistry’ and detected by streptavidin-HRP. (B) Ponceaus S staining of the membrane reported in (A). (C) RNA enrichment in AHARIBO-rC pulldown at different AHA incubation times (10, 30, and 60 min) compared to control (AHA-) and reported as % of input (1/10 of total RNA). (D) RNA enrichment in AHARIBO-rC pulldown before or after sucrose cushioning compared to control (AHA-).
Figure 1—figure supplement 2
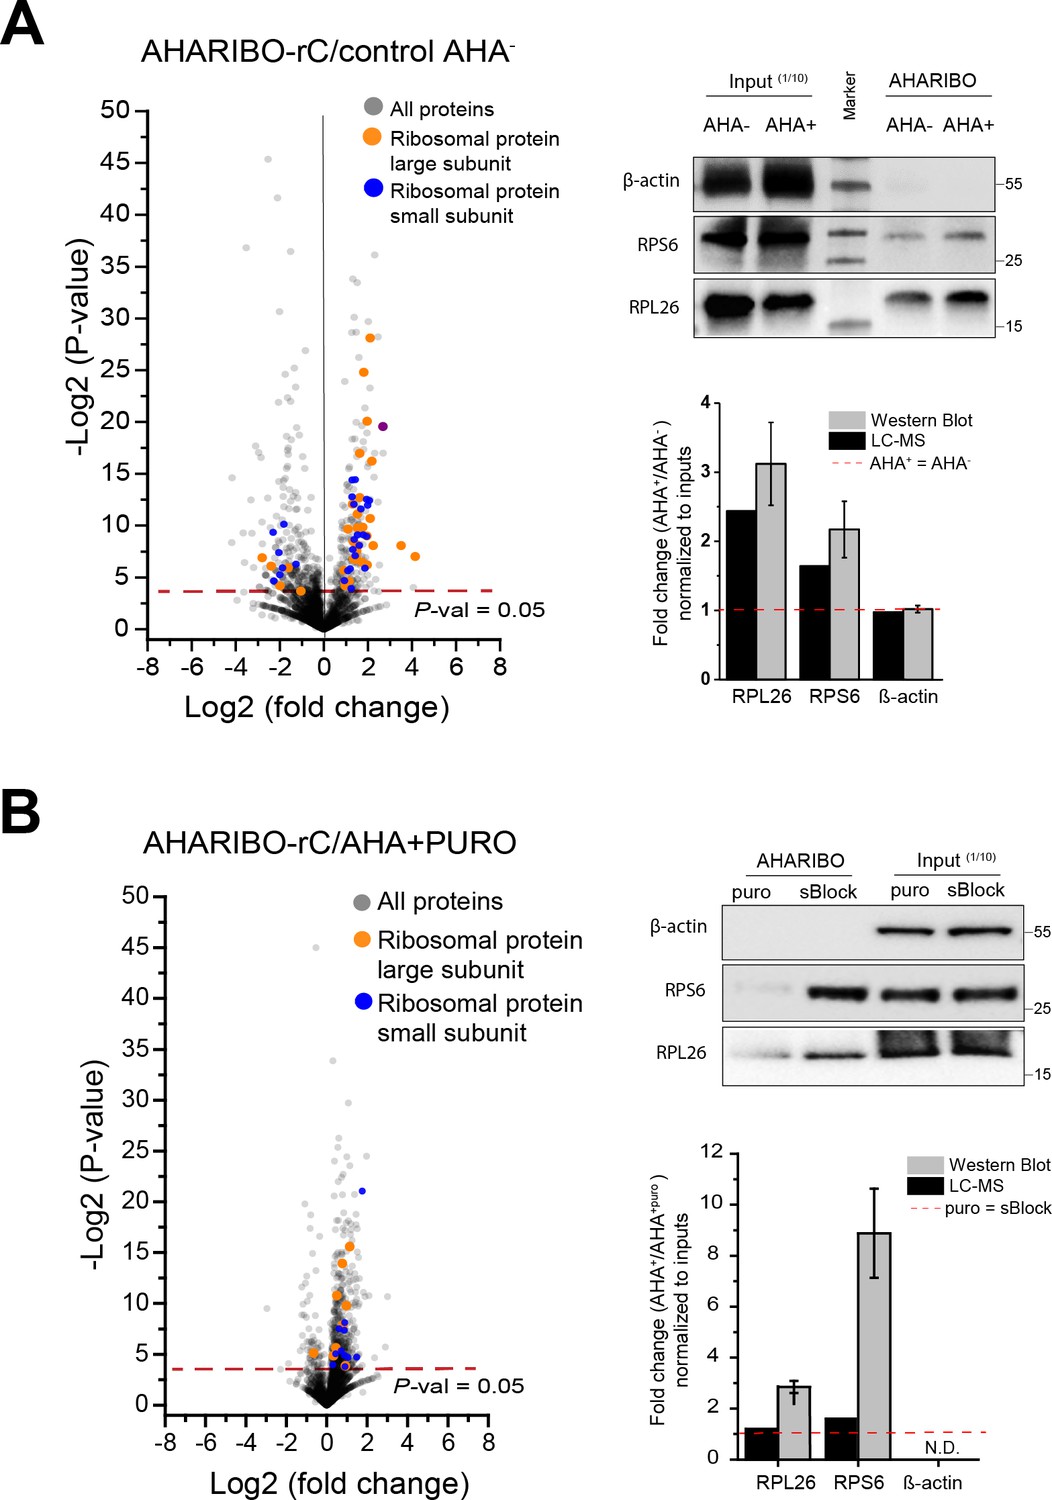
Liquid chromatography-mass spectrometry (LC-MS) analysis of AHARIBO-rC proteins and validation by western blot.
Volcano plots showing the -Log (p-value) versus the relative abundance of AHARIBO-rC-isolated proteins. Data are compared with the non-specific signal derived from streptavidin-coated beads incubated with lysates from control (AHA-, without L-azidohomoalanine) (A) and puromycin-treated cells (without sBlock). Red broken line indicates threshold p-value<0.05. (B) Western blots of RPL26, RPS6, and actin with related quantifications of band intensities are reported on the right of each dot blot. AHARIBO: AHA-mediated RIBOsome isolation.
Figure 1—figure supplement 3
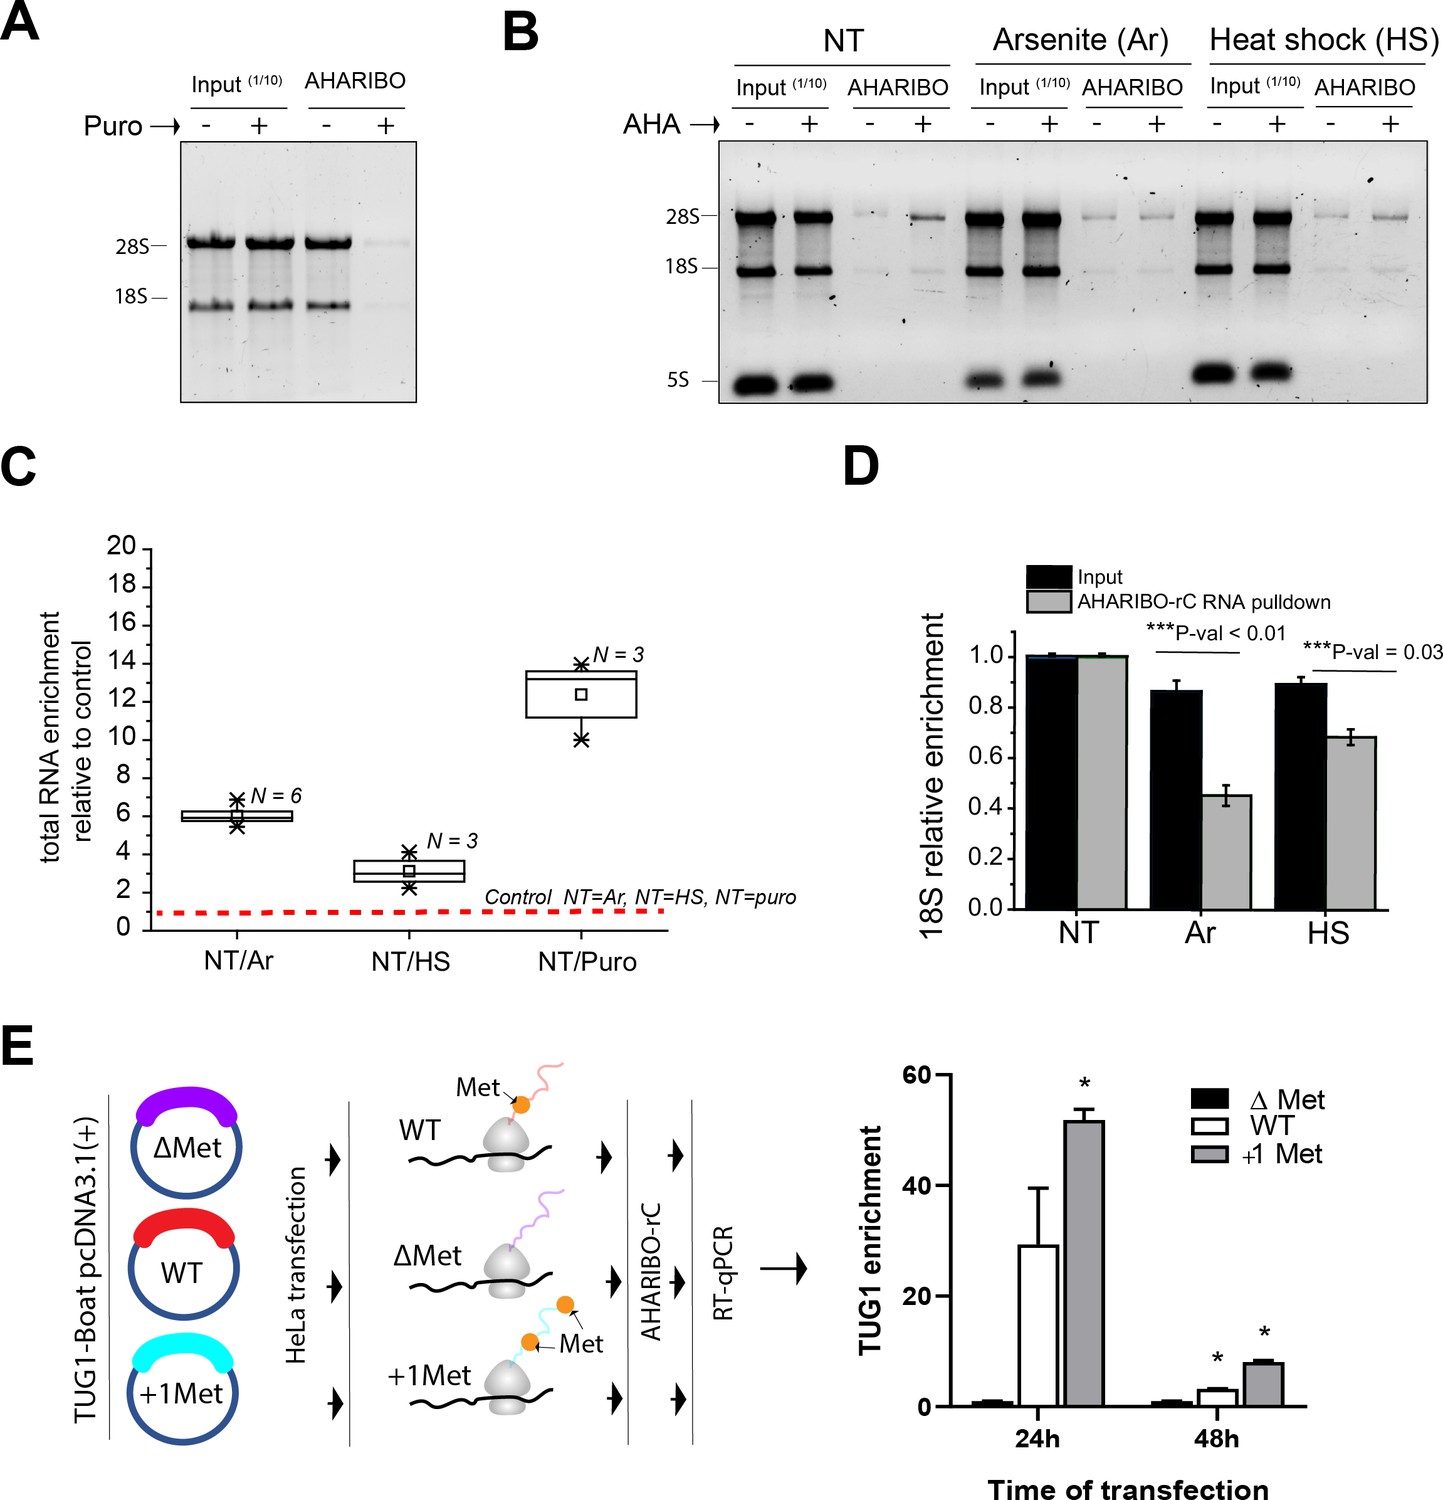
AHARIBO-rC efficiency test and validations.
(A, B) Agarose gel electrophoresis of total RNA extracted from input lysates (1/10 of the total lysate volume) and lysates subjected to AHA-mediated RIBOsome isolation (AHARIBO) pulldown, obtained from cells either treated or not treated with L-azidohomoalanine (AHA), with or without puromycin (50 µM) and with different stress. NT: non-treated cells; Ar: arsenite-treated cells; Puro: puromycin treatment (50 µM). Red broken line indicates no enrichment. (C) Total RNA enrichment after AHARIBO-rC pulldown of lysates obtained from unstimulated cells over cells treated with arsenite and heat shock. For each condition, cells were either treated or not treated with AHA. Signal ratios (AHA+/AHA-) for each pulldown sample were normalized to the respective inputs. NT: non-treated; HS: heat shock-treated (42°C for 10 min); Puro: puromycin treatment (50 µM). Square box indicates mean; stars indicate 1–99% percentile. (D) 18S rRNA qRT-PCR analysis of RNA extracted from lysates subjected to AHARIBO-rC pulldown and input lysates obtained from unstimulated cells or cells subjected to arsenite treatment. For each condition, cells were either treated or not treated with AHA. For each sample, 18S AHA+/AHA- signal ratios were normalized to the input and to the housekeeping gene HPRT1. NT: non-treated; Ar: arsenite. (E) Detection of TUG1-BOAT. Scheme of the experimental setup (left) and RT-pPCR enrichment for FUG1-BOAT transcript (right) among the three different constructs normalized to the input and for two different times of transfection (24 and 48 hr) (*p-value<0.05 compared with ΔMet).
Figure 2 with 1 supplement

AHARIBO-nP and pSILAC.
(A) Workflow for parallel AHARIBo-nP and pSILAC. mESCs: mouse embryonic stem cells; EN: mouse embryonic stem cells differentiated in early neurons. (B) Venn diagram representing the number of differentially expressed proteins (EN/mESCs) identified by AHARIBO-nP and pSILAC (p-value<0.05). (C) Volcano plot for each differentially expressed protein (EN/mESC) of AHARIBO-nP proteome versus -log2(p-value). Red broken line indicates p-value<0.05. Orange and purple dots represent upregulated proteins involved in cytoskeleton organization (GO:0007010) and neurogenesis (GO:0022008), respectively. Blue, green, and magenta dots represent downregulated proteins related to RNA processing (GO:0006396), protein synthesis (GO:0006412), and mouse pluripotency (WP1763). Gray dots represent all other proteins. (D) Schematic representation of combined cell treatments for pSILAC and AHARIBO-nP. (E) Volcano plots displaying for each protein the -log2 t-test p-value against the fold changes of protein turnover (heavy/light) in pSILAC proteome (left) and AHARIBO-nP (right) for double-treated mESCs. GO: gene ontology; AHARIBO: AHA-mediated RIBOsome isolation; pSILAC: pulsed SILAC.
-
Figure 2—source data 1
A table with the pulsed SILAC (pSILAC) proteomic data.
- https://cdn.elifesciences.org/articles/59303/elife-59303-fig2-data1-v2.xlsx
-
Figure 2—source data 2
A table with AHA-mediated RIBOsome isolation (AHARIBO) differentially expressed proteins.
Proteins are considered differentially expressed when adjusted p-values are smaller than 0.05 AHARIBO-nP differentially expressed proteins.
- https://cdn.elifesciences.org/articles/59303/elife-59303-fig2-data2-v2.xlsx
Figure 2—figure supplement 1
Cell differentiation and additional proteomic analysis.
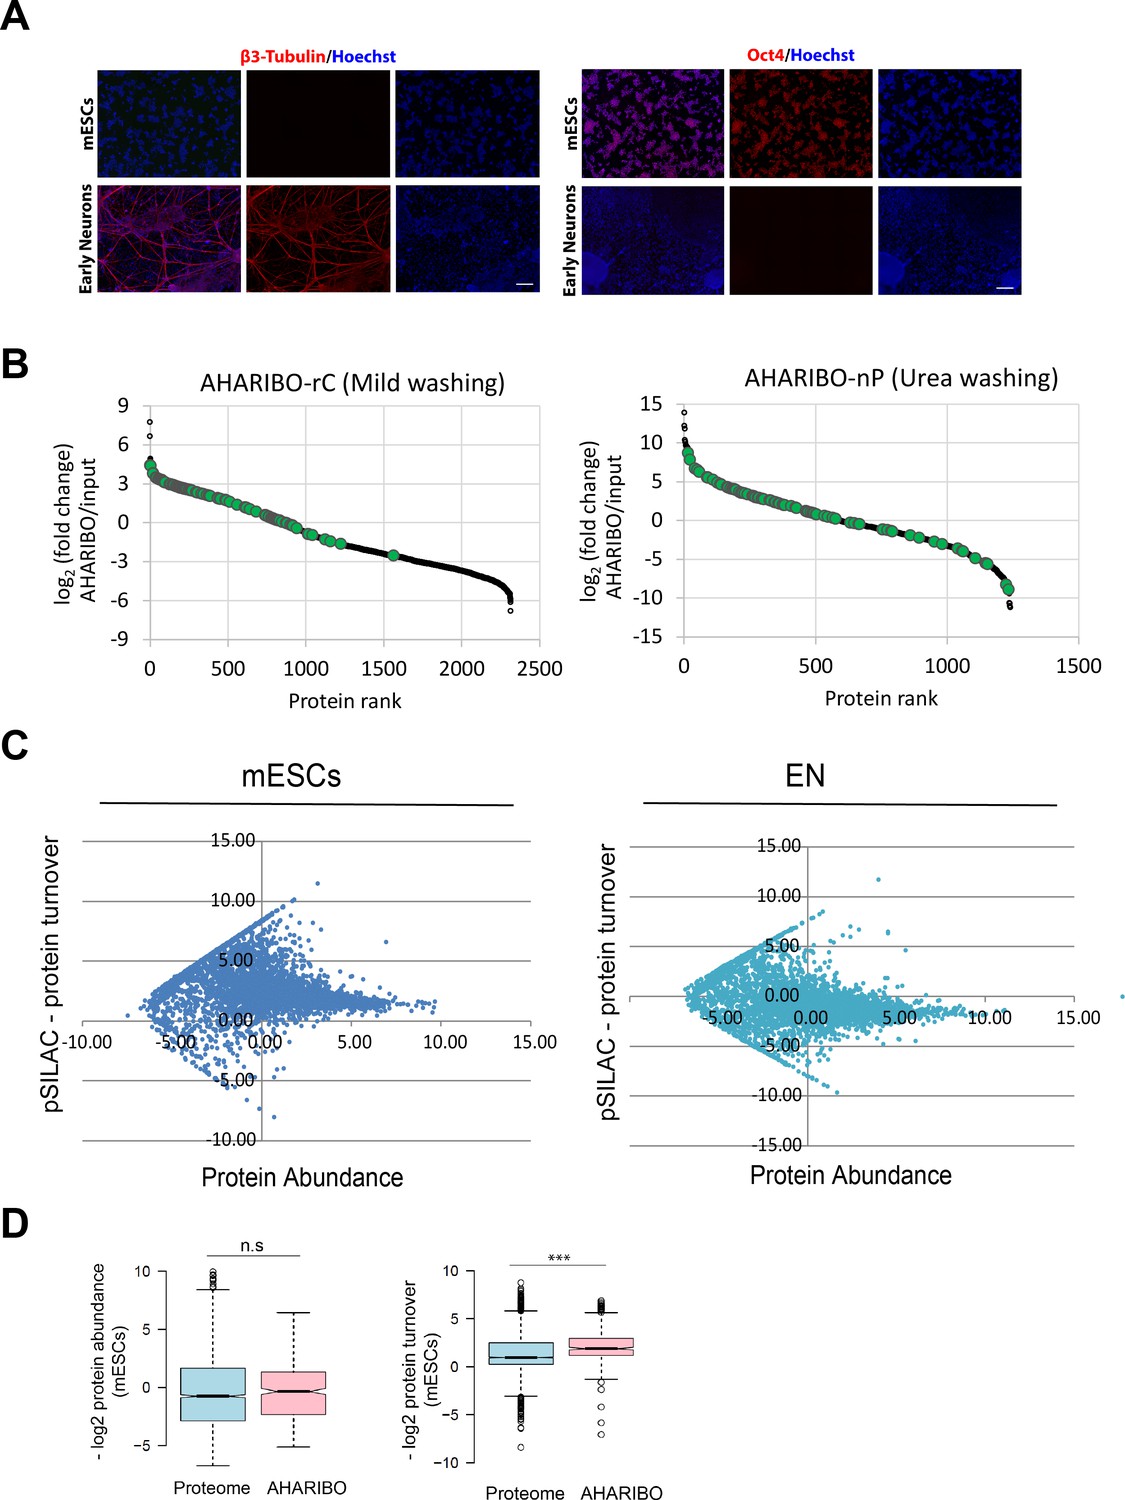
(A) Immunofluorescence for mouse embryonic stem cells (mESCs) (Oct4) and neuronal (β3-tubulin) marker expression on self-renewing mESCs and 15DIV mESC-derived neurons. Scale bar 200 μm. (B) Rank plot of fold change of full proteome (black dots) and ribosomal proteins (green dots) comparing AHA-mediated RIBOsome isolation (AHARIBO) pulldown versus input samples, mild washing (left), and urea washing (right). Since AHARIBO-rC liquid chromatography-mass spectrometry (LC-MS) analysis might cause an underestimation of the de novo synthesized proteome due to the enrichment of abundant ribosomal proteins, newly synthesized proteins bound to dibenzocyclooctyne (DBCO)-conjugate magnetic beads were separated from ribosome subunits by harsh washing conditions (8 M urea) before tryptic digestion and LC-MS analysis. The effectiveness of the washing procedure was confirmed since no evident enrichment of ribosomal proteins in the pulldown was observed. (C) The scatter plots represent protein abundance versus protein turnover in mESCs (left) and early neurons (ENs) (right). (D) Normalized protein abundance (left) and turnover distribution (right) as determined by pulsed SILAC (pSILAC) and AHARIBO. ***p-value<0.001.
Figure 3 with 1 supplement
AHARIBO-rC RNA versus de novo proteome analysis.
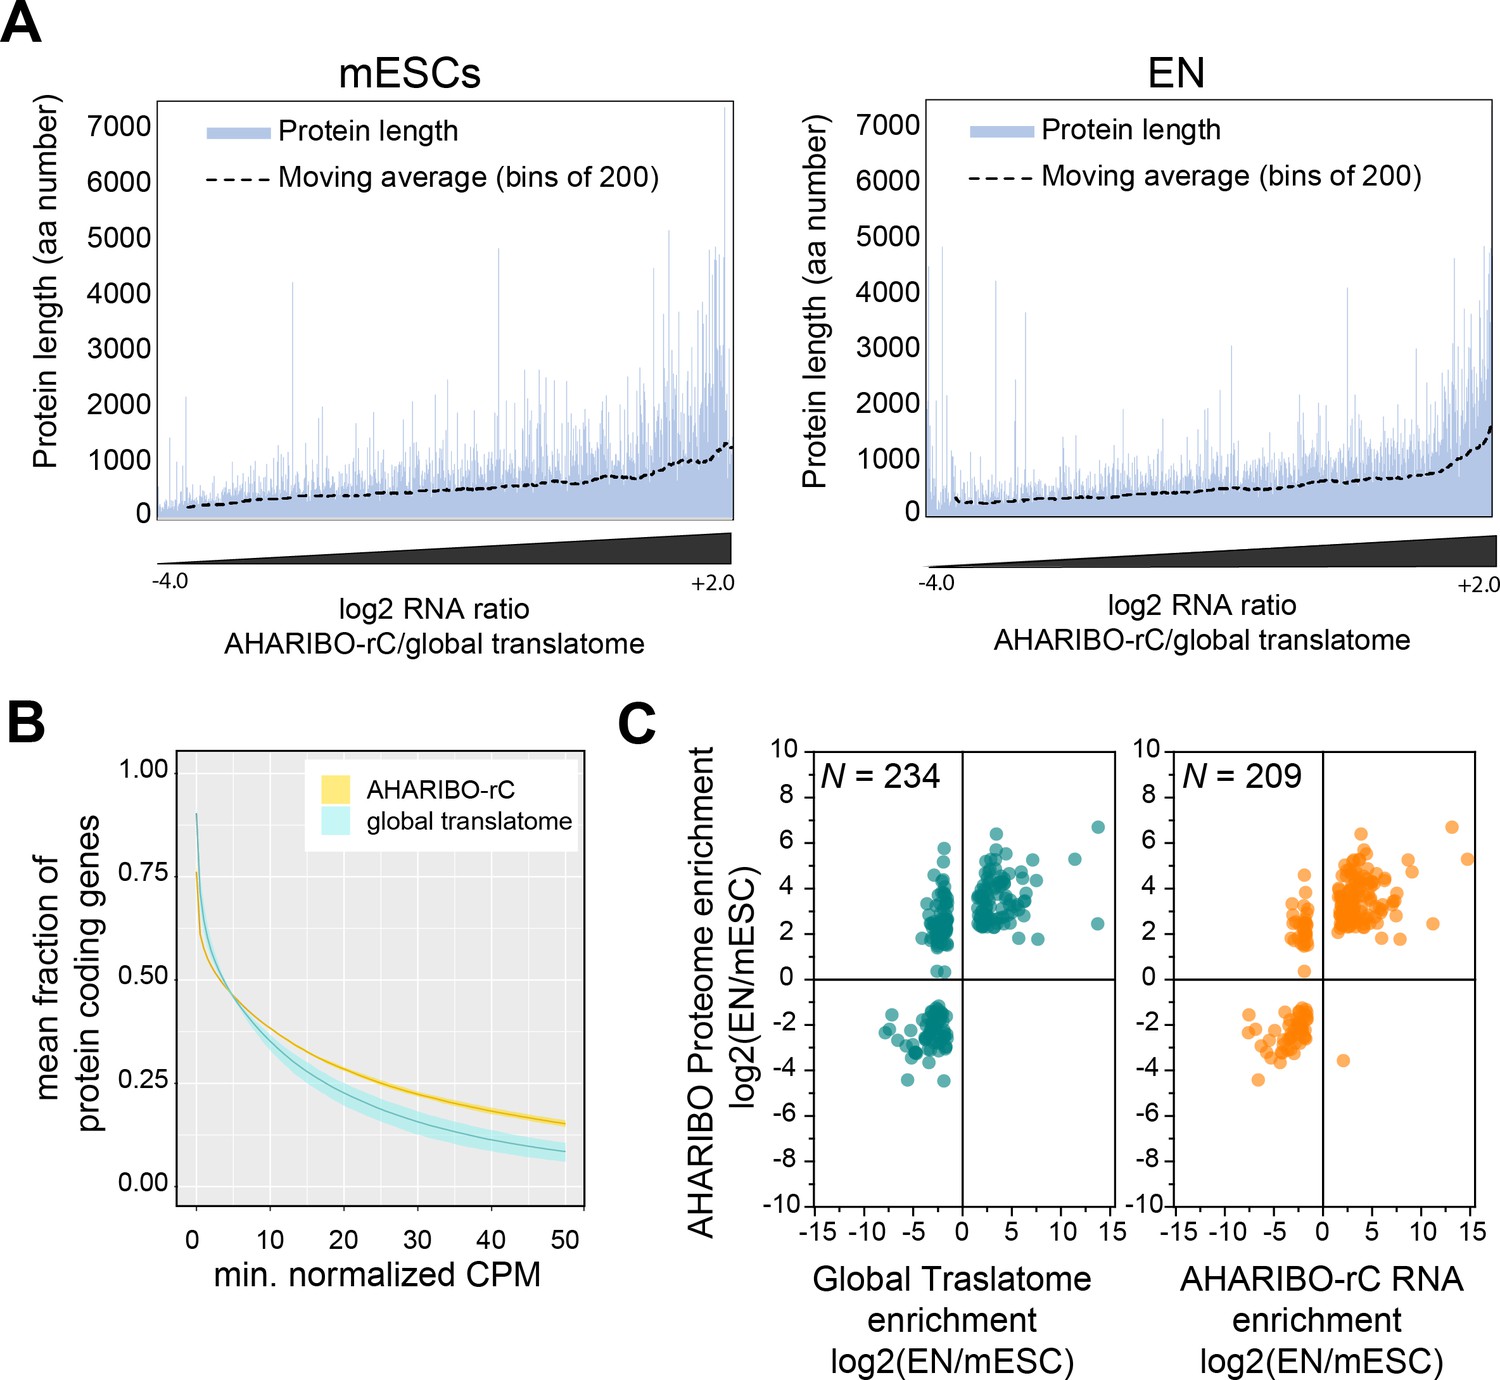
(A) Enrichment of a given transcript obtained with AHA-mediated RIBOsome isolation (AHARIBO) versus global translatome (x-axis) as a function of the theoretical protein length (y-axis) for mouse embryonic stem cells (mESCs) (left) and early neurons (ENs) (right). Each bar represents the number of enriched transcripts with the defined theoretical protein length. (B) Fraction of coding genes expressed above a minimum threshold in EN. The AHARIBO-rC and global translatome group are represented in yellow and cyan, respectively. For each group, the mean (solid line) and SD (shades) of the fractions for a given count per million (CPM) threshold are calculated over all samples (n = 6) in that group. (C) Scatter plot of RNA fold change (global translatome on the left, AHARIBO-rC on the right) compared to protein fold change (AHARIBO-nP) obtained by comparing EN with mESC. N: number of differentially expressed genes (DEGs) with p-value<0.05.
-
Figure 3—source data 1
A table with differentially expressed genes (DEGs) from RNA-seq data comprising logFC, LogCPM, LogFWER, and LogPval.
Genes are considered differentially expressed when both log fold changes are higher/smaller than 1.5/−1.5 and False Discovery Rate (FDR)-adjusted p-values are smaller than 0.01. DEGs from RNA-seq data.
- https://cdn.elifesciences.org/articles/59303/elife-59303-fig3-data1-v2.txt
-
Figure 3—source data 2
A table with RNA and protein differentially expressed genes (DEGs) from AHARIBO-nP, pSILAC, AHARIBO-rC, and global translatome.
Genes are considered differentially expressed when both log fold changes are higher/smaller than 1.5/−1.5 and FDR-adjusted p-values are smaller than 0.01. Proteins are considered differentially expressed when adjusted p-values are smaller than 0.05. RNA and protein DEGs. AHARIBO: AHA-mediated RIBOsome isolation; pSILAC: pulsed SILAC.
- https://cdn.elifesciences.org/articles/59303/elife-59303-fig3-data2-v2.xlsx
Figure 3—figure supplement 1
RNA-seq and protein coding RNA analysis.
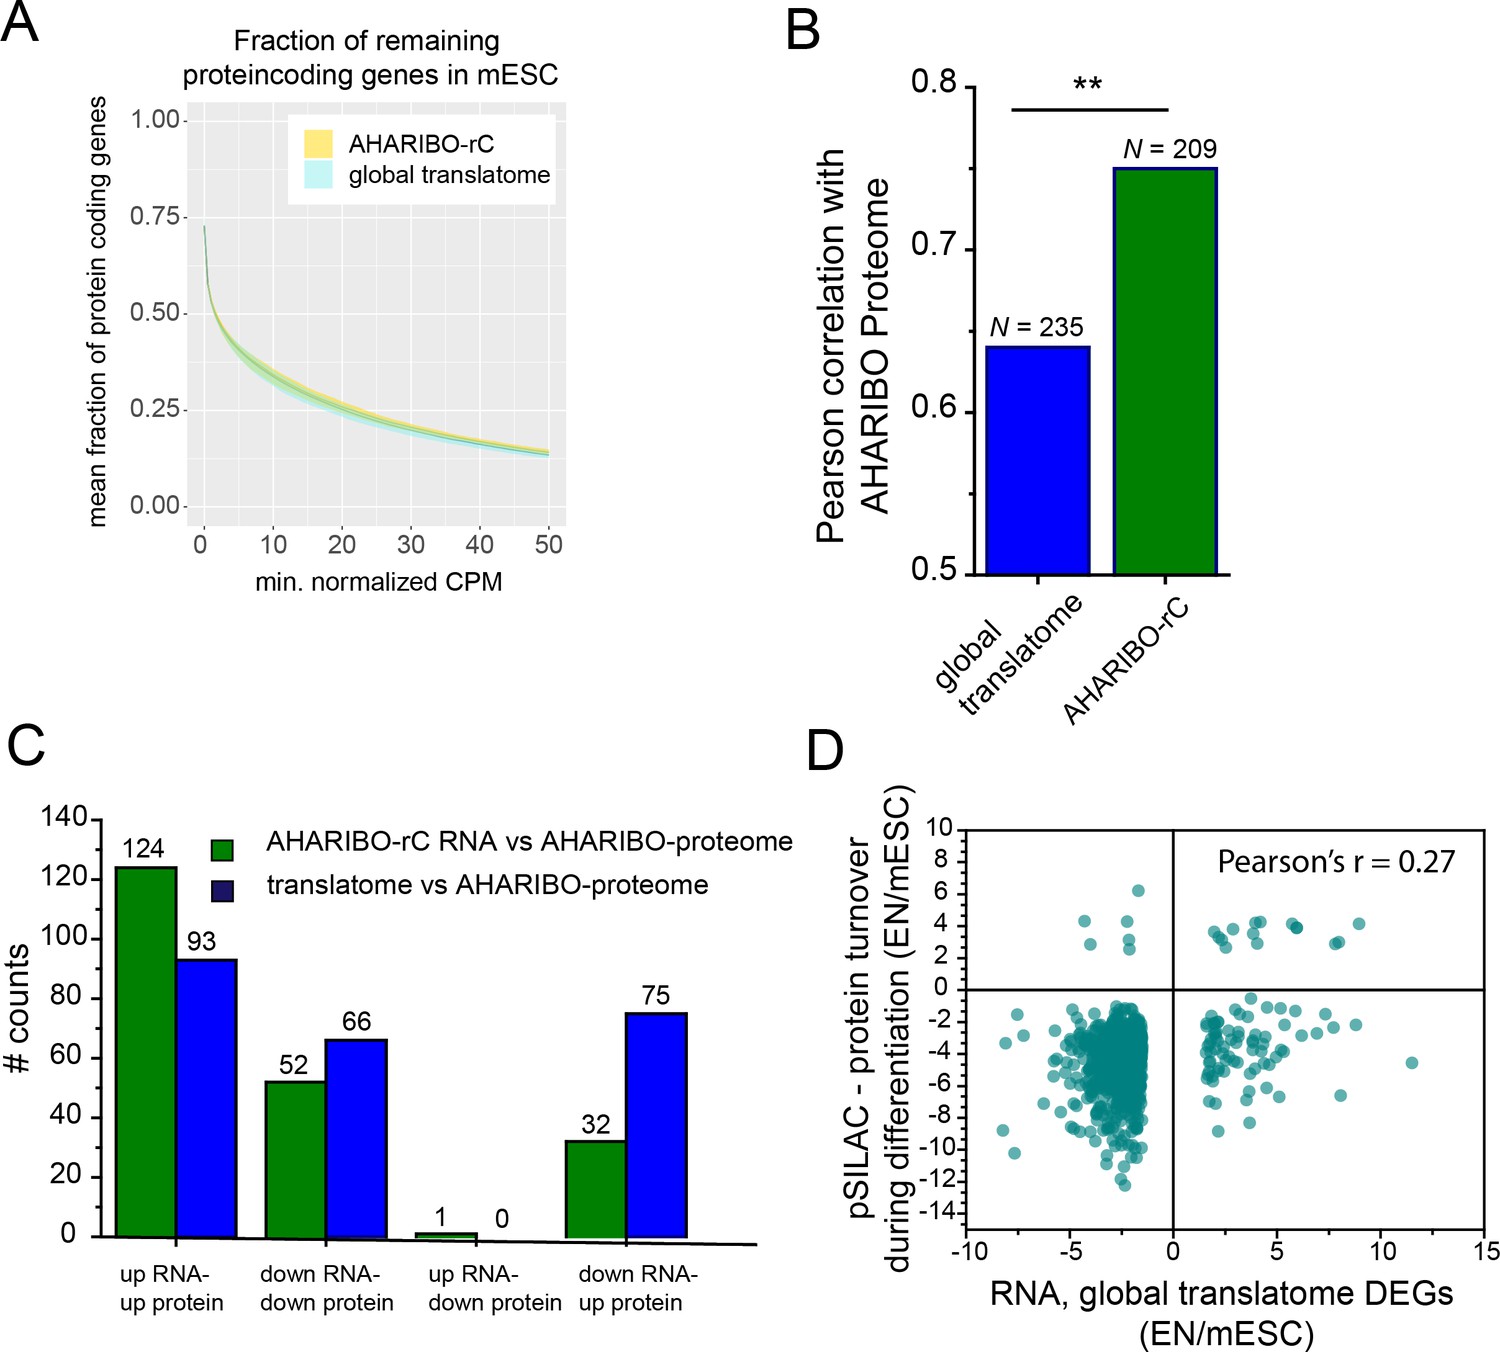
(A) Linear plot illustrating the fraction of coding genes (y-axis) expressed above a minimum threshold (x-axis) in mouse embryonic stem cells (mESCs). The AHARIBO-rC and the global translatome group are respectively represented in yellow and cyan as indicated. For each group, the mean (solid line) and the SD (shades) of the fractions for a given count per million (CPM) threshold are calculated over all samples (n = 6) in that group. (B) Histogram showing Pearson’s correlation analysis of AHARIBO-nP protein fold change (EN/mESC) determined by mass spectrometry versus global translatome and AHARIBO-rC RNA fold change (EN/mESC) determined by RNA-seq. N: number of differentially expressed genes (DEGs). p-value<0.05. (C) Histogram of the number of DEGs (EN/mESCs) up- and downregulated in AHARIBO-rC RNA or global translatome relative to the AHARIBO-nP proteome. (D) Scatter plot of RNA fold change (global translatome) compared to protein turnover (pSILAC). AHARIBO: AHA-mediated RIBOsome isolation; EN: early neurons; pSILAC: pulsed SILAC.
Figure 4 with 3 supplements
The AHA-mediated RIBOsome isolation (AHARIBO) platform can be used to detect ribosome-interacting long non-coding RNAs (lncRNAs).
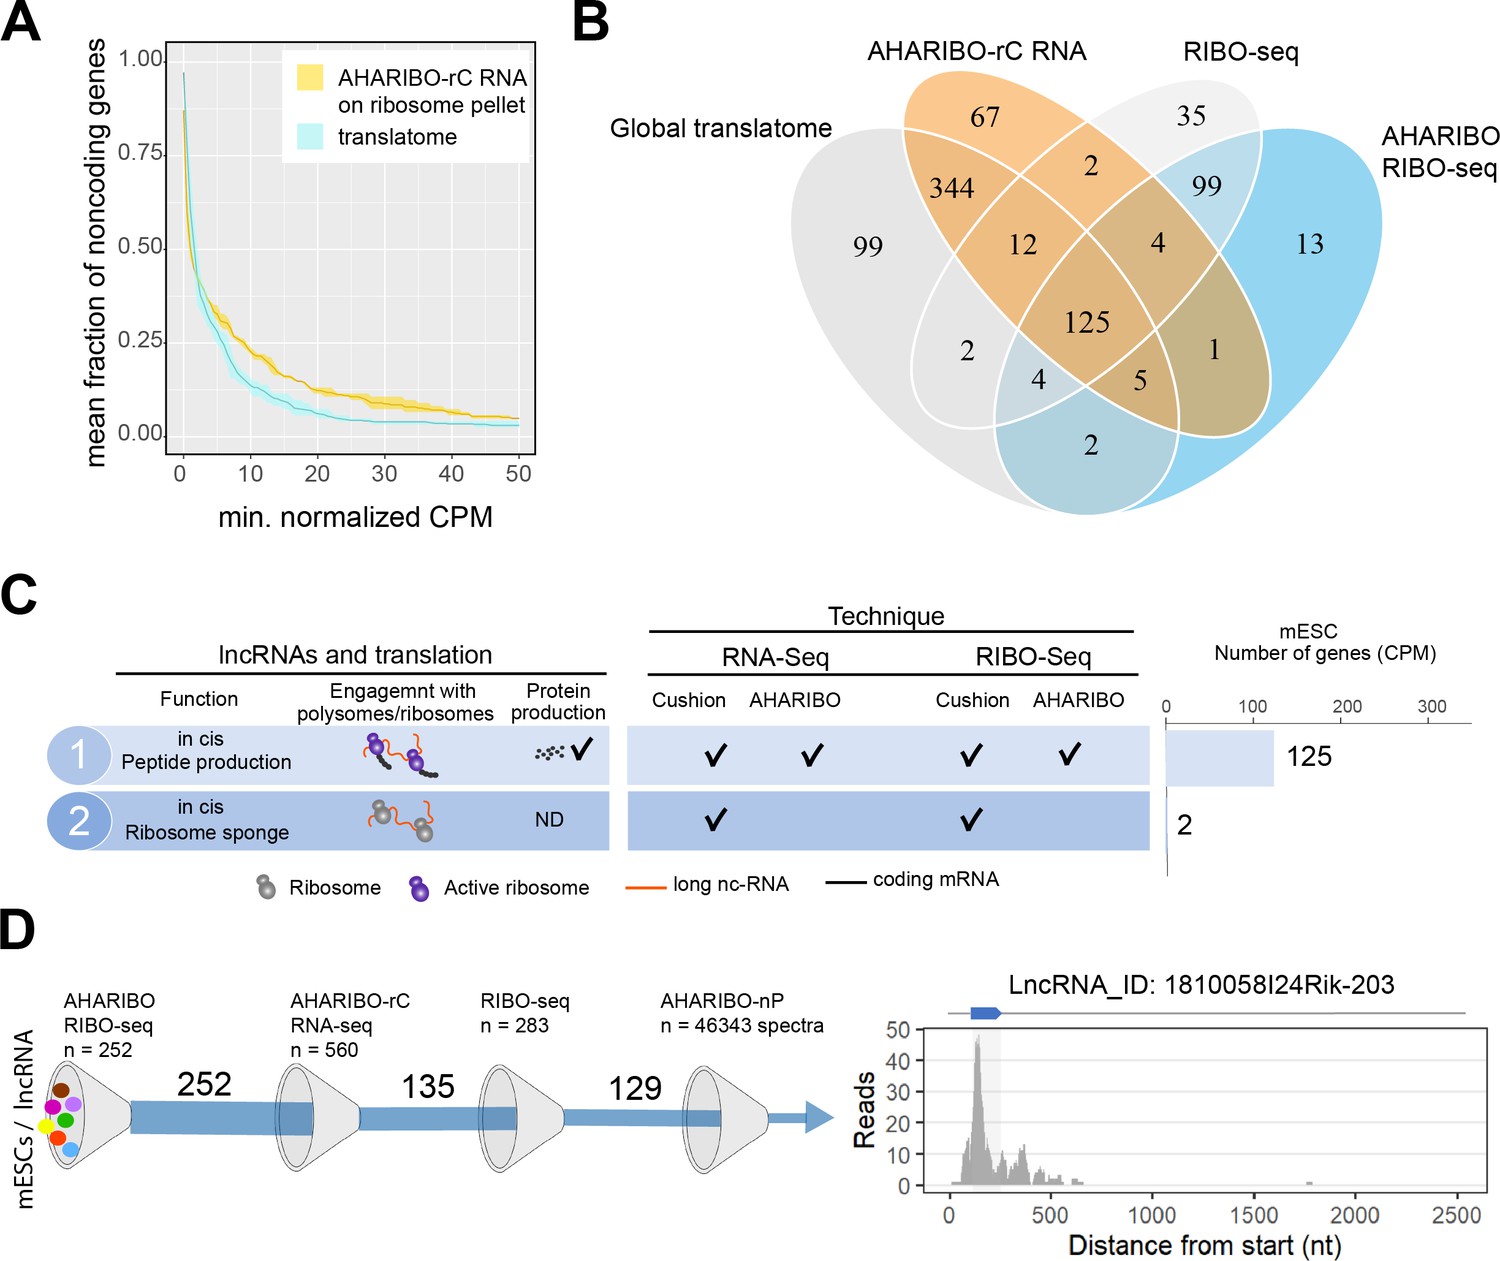
(A) Linear plot illustrating the fraction of non-coding genes expressed above a minimum threshold in early neurons (EN). The AHARIBO-rC and the global translatome group are represented in yellow and cyan, respectively. For each group, the mean (solid line) and the SD (shades) of the fractions for a given count per million (CPM) threshold are calculated over all samples (n = 3) in that group. Expression values are indicated as normalized CPM. AHARIBO-rC was performed on the ribosome pellet after sucrose cushioning. (B) Venn diagram of the number of lncRNAs genes with at least 1 CPM identified by RNA-seq, AHARIBO-rC, RIBO-seq, and AHARIBO RIBO-seq. (C) Classification of lncRNAs interacting with ribosomes and relative detection through the multiple AHARIBO and standard approaches. ND: no detection of protein synthesis. (D) (Left) Schematic representation of the number of mouse embryonic stem cell (mESC) lncRNAs in common between AHARIBO RIBO-seq, AHARIBO-rC RNA, and standard RIBO-seq. These lnRNAs were validated by liquid chromatography-mass spectrometry (LC-MS). (Right) Example of an AHARIBO RIBO-seq ribosome occupancy profile of lncRNA 1810058I24Rik displaying the reads distribution along the entire transcript and the accumulation of reads at the known short open reading frame (shadow area and blue arrow on top).
-
Figure 4—source data 1
A table with the list of long non-coding RNAs (lncRNAs) identified by RNA-seq by RNA-seq in mouse embryonic stem cells (mESCs).
- https://cdn.elifesciences.org/articles/59303/elife-59303-fig4-data1-v2.txt
-
Figure 4—source data 2
A table with the list of long non-coding RNAs (lncRNAs) identified by RIBO-seq in mouse embryonic stem cells (mESCs).
- https://cdn.elifesciences.org/articles/59303/elife-59303-fig4-data2-v2.txt
-
Figure 4—source data 3
A table with the list of matching peptides from AHA-mediated RIBOsome isolation's (AHARIBO) identified long non-coding RNAs (lncRNAs).
- https://cdn.elifesciences.org/articles/59303/elife-59303-fig4-data3-v2.xlsx
Figure 4—figure supplement 1
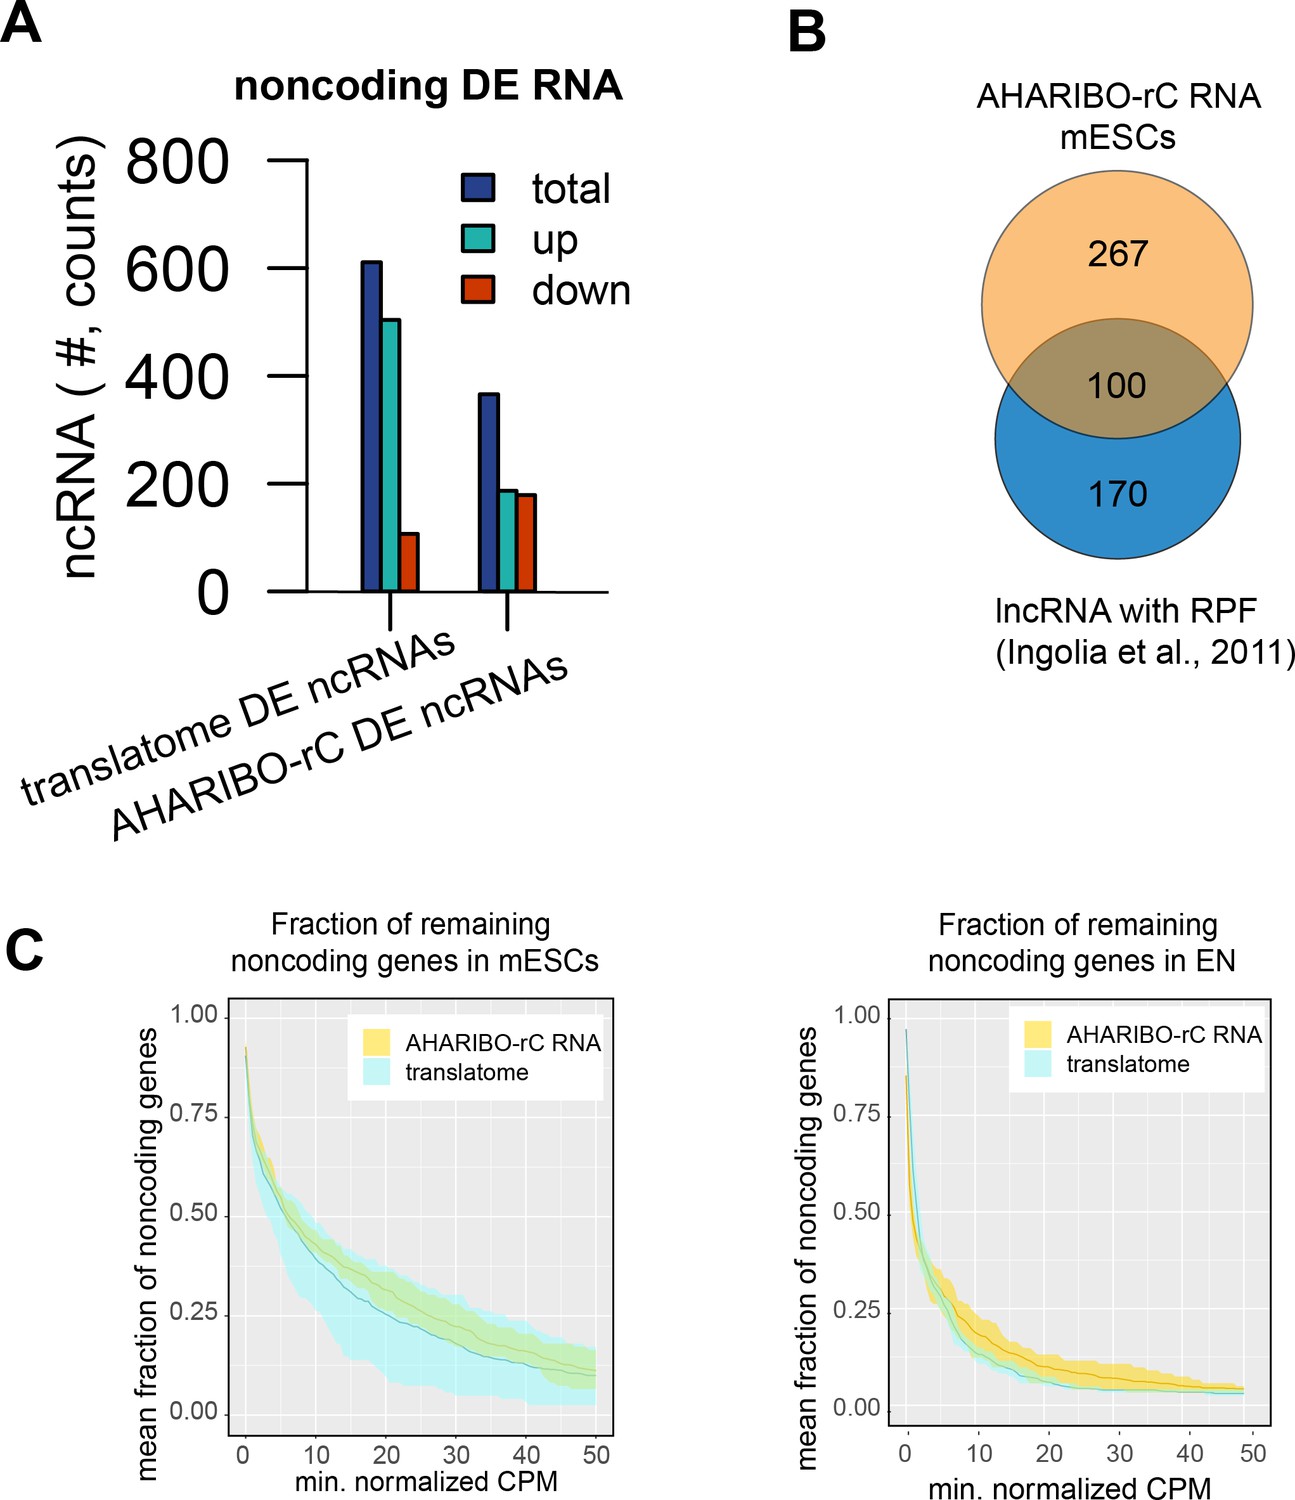
Isolation of long non-coding RNAs (lncRNAs) with AHA-mediated RIBOsome isolation (AHARIBO).
(A) Number of up- and downregulated differentially expressed non-coding RNAs in the global translatome and AHARIBO-rC RNA. DE: differentially expressed; ncRNA: non-coding RNA. (B) Venn diagram representing the number of differentially expressed lncRNAs identified by AHARIBO-rC (orange) and number of lncRNAs with at least 1 count per million (CPM) in Ingolia et al., 2011 (blue). (C) Linear plot illustrating the fraction of non-coding genes (y-axis) expressed above a minimum threshold (x-axis) in mouse embryonic stem cells (mESCs) (left) and early neurons (ENs) (right). The AHARIBO-rC and the global translatome group are respectively represented in yellow and cyan as indicated. For each group, the mean (solid line) and the SD (shades) of the fractions for a given CPM threshold are calculated over all samples (n = 6) in that group.
Figure 4—figure supplement 2

AHA-mediated RIBOsome isolation (AHARIBO) RIBO-seq data.
(A) Percentage of ribosome P-sites mapping to the 5′ UTR, coding sequence (CDS), and 3′ UTR of mRNA from AHARIBO RIBO-seq and standard RIBO-seq data. The percentage length of each mRNA region is indicated on the right-hand y-axis. (B) Data correlation of AHARIBO RIBO-seq and standard RIBO-seq (performed on the input) obtained in mouse embryonic stem cells (mESCs). Results are representative of two independent replicates for each method. (C) Percentage of P-sites according to the three reading frames for the 5′ UTR, 3′ UTR, and CDS for AHARIBO RIBO-seq data, reflecting the codon periodicity along the CDS.
Figure 4—figure supplement 3
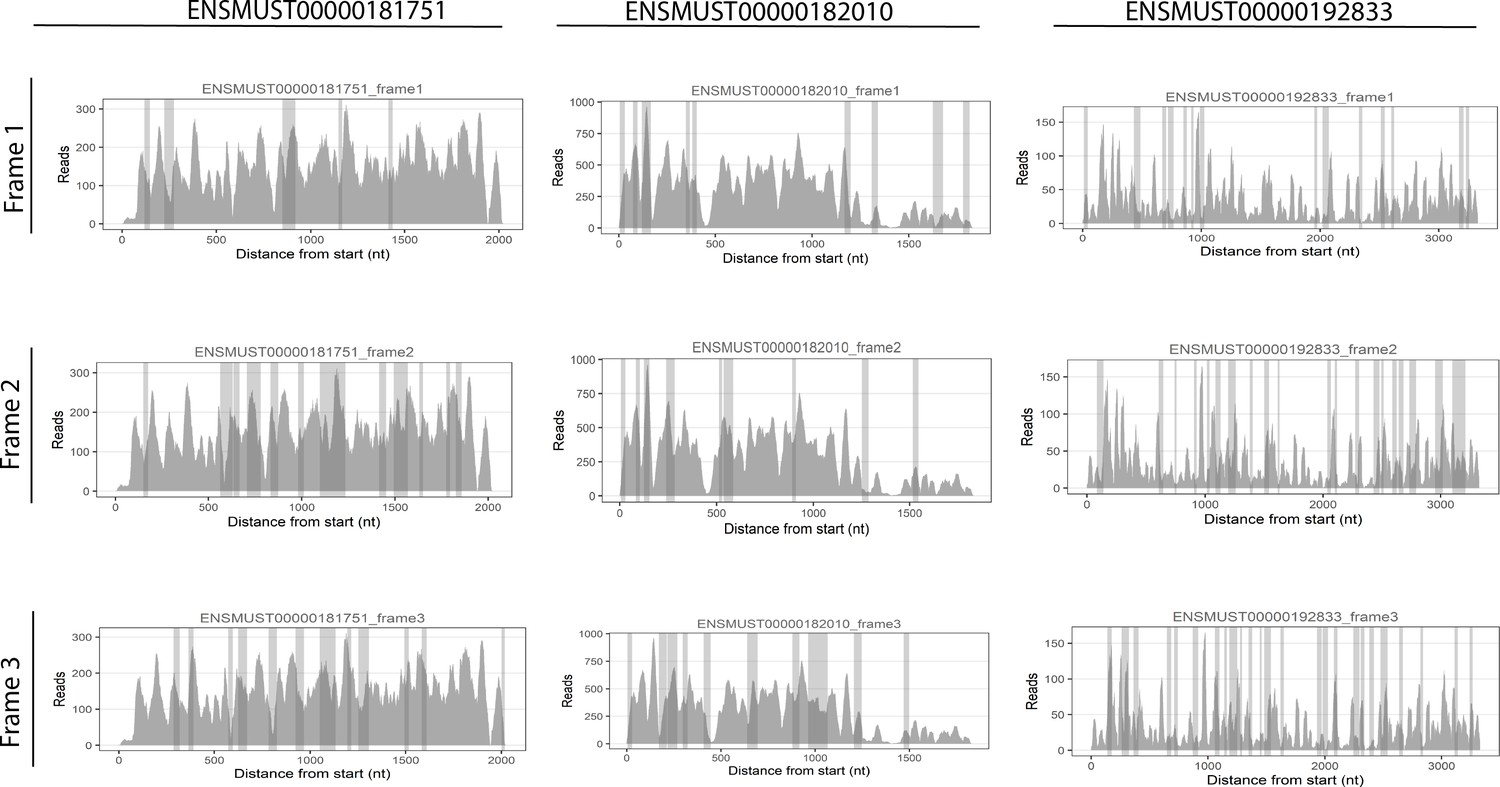
Translated long non-coding RNAs (lncRNAs).
Representative data of three different lncRNAs (from left to right) displaying massive hallmarks of translation along the entire transcript. In silico translation in three different frames (from top to bottom) was performed to predict potential peptide. Shadow area: predicted in silico micropeptides. The lncRNA reported are representative of a list of translated lncRNA identified by the combination of AHA-mediated RIBOsome isolation (AHARIBO) approaches (between brackets the unique peptide or the number of putative peptides predicted): ENSMUST00000051089 (NSFVNDIFER), ENSMUST00000181328 (KIDNQINLPK), ENSMUST00000181149 (KINQLQNMVKDNK), ENSMUST00000099446 (NLMNVINVVKLLHFS), ENSMUST00000180524 (MSPSQLLELKRNQ), ENSMUST00000182499 (VCVALIINICHIMI), ENSMUST00000134140 (NGGGLLMSYVIK), ENSMUST00000180432 (ELAEQPSSALKTSNREQ), ENSMUST00000181251 (QLTDNQRVNQKA), ENSMUST00000179344 (KELQLK), ENSMUST00000181443 (KGPNDISLAQSYLPI), ENSMUST00000071101 (KNNPPPQNAKPK), ENSMUST00000180407 (IELRENLQTY), ENSMUST00000180489 (EISASANLELNGAPSQQ), ENSMUST00000188038 (LALEELR), ENSMUST00000149246 (LLLPGVIK), ENSMUST00000180396 (23), ENSMUST00000181751 (61), ENSMUST00000182010 (43), ENSMUST00000192833 (94), ENSMUST00000200021 (27), ENSMUST00000223012 (86).
Author response image 1
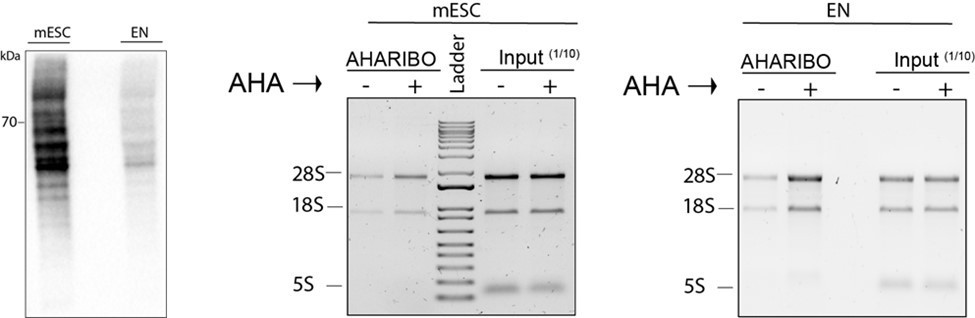
Total protein staining.
Left, total proteins from mESC and early neurons (EN) cell lysates (20 µg total protein for each sample measured by Bradford assay) loaded on a SDS-PAGE and the membrane stained by biotin-cycloaddition followed by streptavidin-HRP. Central and right panel, agarose gel electrophoresis of total RNA extracted from input lysates (1/10 of the total lysate volume) and lysates subjected to AHARIBO pulldown from mESC (left) or EN cells (right) either treated (+) or not (-) treated with AHA.
Author response image 2
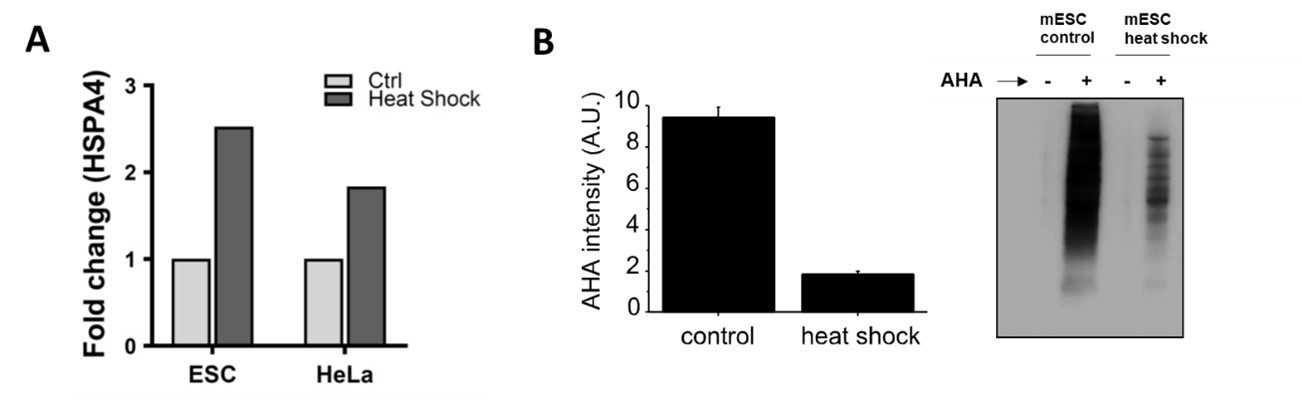
a) HSPA4 fold change (ΔΔct) measured by qPCR in mouse embryonic stem cells and HeLa with or without heat shock (10 min at 42°C).
For each sample, HSPA5 AHA+/AHA- signal ratios were normalized to the control and to the housekeeping gene. b) Left, quantification of AHA content before (control) and after heat shock. On the right, representative image of a SDS-PAGE reporting the total protein content for heat shock (with and without AHA) and not treated sample (with and without AHA). In each lane a total of 1 ug of protein as measured by Bradford assay was loaded. Staining of the membrane was performed by biotin cycloaddition followed by streptavidin-HRP. Experiments were performed in triplicates.
Author response image 3
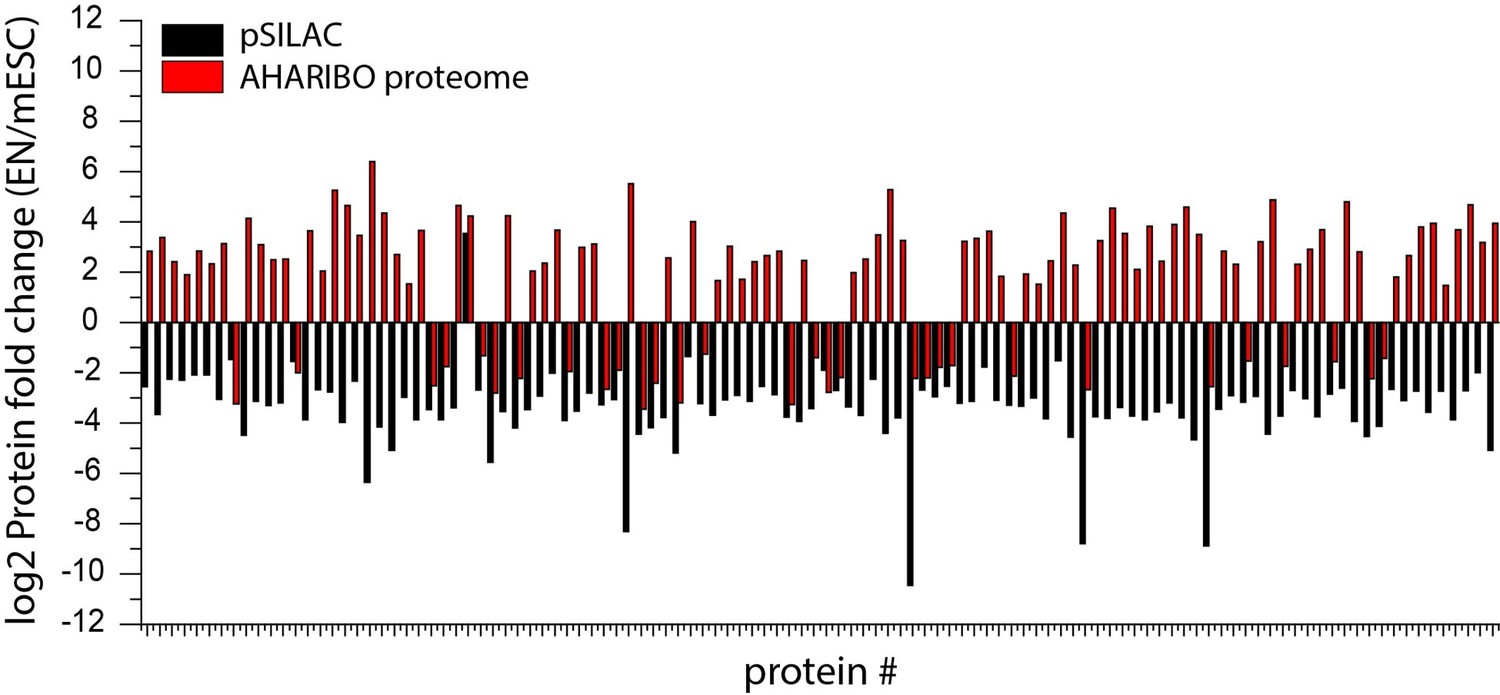
Protein fold change (log2) of differentially expressed proteins during cellular differentiation of mESCs to early neurons.
Comparison between pSILAC(black) and AHARIBO proteome (red).
Author response image 4
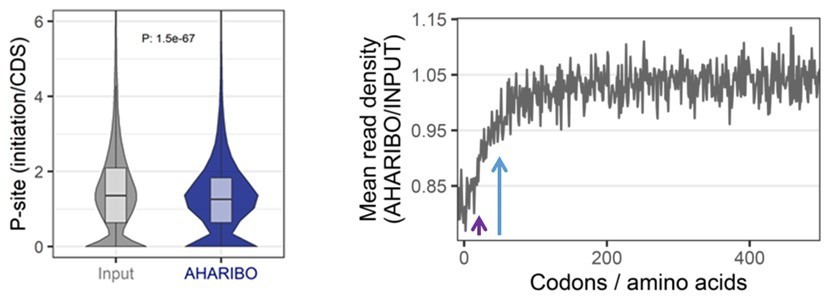
Left, P-site density initiation/CDS ratio for total RIBO-seq (input) and AHARIBO Ribo-seq.
Right, metagene profiles showing the ratio between the AHARIBO density and input read density within the first 450 codons from the start codon. Violet arrow, first 25 codons from the start codon. Blue arrow, first 50 codons from the start codon.
Tables
Key resources table
| Reagent type (species) or resource | Designation | Source or reference | Identifiers | Additional information |
|---|---|---|---|---|
| Cell line (Homo sapiens) | Papillomavirus-related endocervical adenocarcinoma | ATCC | RRID:CVCL_0030 | |
| Cell line (Mus musculus) | 46C embryonic stem cells | ATCC | RRID:CVCL_Y482 | Quattrone A. Lab. (CIBIO) |
| Antibody | Anti-β3-tubulin (mouse monoclonal) | Promega | Cat. #G712A RRID:AB_430874 | (1:2000) |
| Antibody | Anti-Oct4 (mouse monoclonal) | Santa Cruz Biotechnologies | Cat. #SC 5279 RRID:AB_628051 | (1:2000) |
| Antibody | Anti-human RPL26 (rabbit polyclonal) | Abcam | Cat. #ab59567 RRID:AB_945306 | (1:2000) |
| Antibody | Anti-human RPS6 (rabbit polyclonal) | Abcam | Cat. #ab40820 RRID:AB_945319 | (1:2000) |
| Antibody | Anti-human beta actin (rabbit polyclonal) | Abcam | Cat. #ab8227 RRID:AB_2305186 | (1:2000) |
| Recombinant DNA reagent | WT TUG1-BOAT (plasmid) | PMID:32894169 | ||
| Recombinant DNA reagent | Δ TUG1-BOAT (plasmid) | This paper | See 'Materials and methods section: 'TUG1-BOAT ectopic expression and qPCR’ | |
| Recombinant DNA reagent | +1Met TUG1-BOAT (plasmid) | This paper | See 'Materials and methods' section: 'TUG1-BOAT ectopic expression and qPCR’ | |
| Peptide, recombinant protein | Precision Protein StrepTactin-HRP Conjugate | BioRad | Cat. #1610380 | (1:5000) |
| Chemical compound, drug | L-Arginine-13C6,15N4 hydrochloride | Sigma-Aldrich | Cat. #608033 | |
| Chemical compound, drug | L-Lysine-13C6,15N2 hydrochloride | Sigma-Aldrich | Cat. #608041 | |
| Chemical compound, drug | L-Azidohomoalanine (Click-IT AHA) | Invitrogen | Cat. #C10102 | |
| Chemical compound, drug | Dibenzocyclooctyne-PEG4-biotin conjugate | Sigma-Aldrich | Cat. #760749SML1656 | |
| Chemical compound, drug | sBlock | IMMAGINA BioTechnology | Cat. #SM8 | |
| Chemical compound, drug | Puromycin | Sigma-Aldrich | Cat. #P8833 | |
| Chemical compound, drug | Cycloheximide | Sigma-Aldrich | #C4859 | |
| Chemical compound, drug | Lipofectamine 3000 Transfection Reagent | Thermo Fisher Scientific. | Cat. #L3000001 | |
| Chemical compound, drug | Mag-DBCO beads | IMMAGINA BioTechnology | Cat. #MDBCO | |
| Chemical compound, drug | eMagSi-cN beads | IMMAGINA BioTechnology | #018-eMS-001 | |
| commercial assay or kit | SMART-Seq Stranded Kit | Takara | Cat. #634443 | |
| Commercial assay or kit | SuperScript III Reverse Transcriptase | Thermo Fisher | Cat. #18080044 | |
| Commercial assay or kit | Kapa Probe Fast Universal qPCR Kit | Kapa Biosystems | #KK4702 | |
| Software, algorithm | Image analysis | ImageJ | RRID:SCR_003070 | |
| Software, algorithm | Statistical package | edgeR | RRID:SCR_012802 |
Author response table 1
AHARIBO-rC.
UTR regulatory elements enrichment
| Regulatory factor/element | Regulated query genes | Enrichment p-value | BH-corrected p-value |
| Tardbp | 119 ( 11.90 % ) | < 1.0E-07 | < 1.0E-07 |
| Nova2 | 175 ( 17.50 % ) | < 1.0E-07 | < 1.0E-07 |
| Srsf3 | 201 ( 20.10 % ) | < 1.0E-07 | < 1.0E-07 |
| Ezh2 | 159 ( 15.90 % ) | 1.1E-07 | 0.00000034 |
| Ptbp2 | 22 ( 2.20 % ) | 1.9E-07 | 0.00000057 |
| Apobec1 | 21 ( 2.10 % ) | 6.3E-07 | 0.0000019 |
| Mbnl2 | 24 ( 2.40 % ) | 1.26E-05 | 0.00003775 |
| Ago | 21 ( 2.10 % ) | 7.72E-05 | 0.00023166 |
| Srsf2 | 68 ( 6.80 % ) | 0.001378 | 0.00275579 |
| Elavl4 | 2 ( 0.20 % ) | 0.001655 | 0.00331066 |
| Elavl2 | 2 ( 0.20 % ) | 0.003259 | 0.00651716 |
| Elavl1 | 3 ( 0.30 % ) | 0.004874 | 0.00974701 |
| Rbms3 | 1 ( 0.10 % ) | 0.023689 | 0.02368882 |
| Rbm3 | 15 ( 1.50 % ) | 0.036423 | 0.03642291 |
| Rbm8a | 1 ( 0.10 % ) | 0.046817 | 0.04681703 |
Author response table 2
Global translatome.
UTR regulatory elements enrichment
| Regulatory factor/element | Regulated query genes | Enrichment p-value | BH-corrected p-value |
| Tardbp | 96 ( 9.60 % ) | < 1.0E-07 | < 1.0E-07 |
| Nova2 | 139 ( 13.90 % ) | < 1.0E-07 | < 1.0E-07 |
| Srsf3 | 168 ( 16.80 % ) | < 1.0E-07 | < 1.0E-07 |
| Srsf2 | 56 ( 5.60 % ) | 2.95E-06 | 1.77E-05 |
| Apobec1 | 19 ( 1.90 % ) | 9.13E-06 | 3.65E-05 |
| Ptbp2 | 19 ( 1.90 % ) | 1.08E-05 | 4.33E-05 |
| Srsf1 | 59 ( 5.90 % ) | 7.26E-05 | 0.0002177 |
| Elavl2 | 2 ( 0.20 % ) | 0.00325858 | 0.00651716 |
| Elavl1 | 3 ( 0.30 % ) | 0.0048735 | 0.00974701 |
| Ago | 15 ( 1.50 % ) | 0.01949888 | 0.03899777 |
| Rbms3 | 1 ( 0.10 % ) | 0.02368882 | 0.02368882 |
| Rbm8a | 1 ( 0.10 % ) | 0.04681703 | 0.04681703 |
Author response table 3
lncRNA differentially expressed in mESC after heat shock and captured by AHARIBO-rC.
| geneSymbol | logFC | logCPM | PValue |
|---|---|---|---|
| Gm28592 | 4.045326 | -0.18544 | 1.01E-07 |
| Gm26635 | 2.237428 | 0.055059 | 7.37E-08 |
| 1110019D14Rik | -2.13009 | 3.224659 | 4.19E-07 |
| 4930467D21Rik | -2.46151 | 2.567217 | 2.90E-07 |
| Gm26776 | -2.6145 | 0.752226 | 1.83E-07 |
| Malat1 | -2.65273 | 11.84434 | 1.38E-08 |
| AC162181.1 | -2.81543 | 1.301371 | 1.40E-10 |
| Gm30551 | -3.16013 | 0.589125 | 4.86E-09 |
| Gm5432 | -3.70264 | -0.11255 | 1.06E-07 |
| mt-Rnr2 | -4.56884 | 15.37853 | 2.27E-10 |
| 4930440I19Rik | -4.61188 | 0.014935 | 3.90E-07 |
Additional files
Download links
A two-part list of links to download the article, or parts of the article, in various formats.
Downloads (link to download the article as PDF)
Open citations (links to open the citations from this article in various online reference manager services)
Cite this article (links to download the citations from this article in formats compatible with various reference manager tools)
One-shot analysis of translated mammalian lncRNAs with AHARIBO
eLife 10:e59303.
https://doi.org/10.7554/eLife.59303


