Structural rearrangement of amyloid-β upon inhibitor binding suppresses formation of Alzheimer’s disease related oligomers
- JW Goethe-University, Institute of Physical and Theoretical Chemistry, Germany
- JW Goethe-University, Institute for Organic Chemistry and Chemical Biology and Center for Biomolecular Magnetic Resonance, Germany
- University of Duisburg-Essen, Institute of Organic Chemistry, Germany
Figures
Figure 1
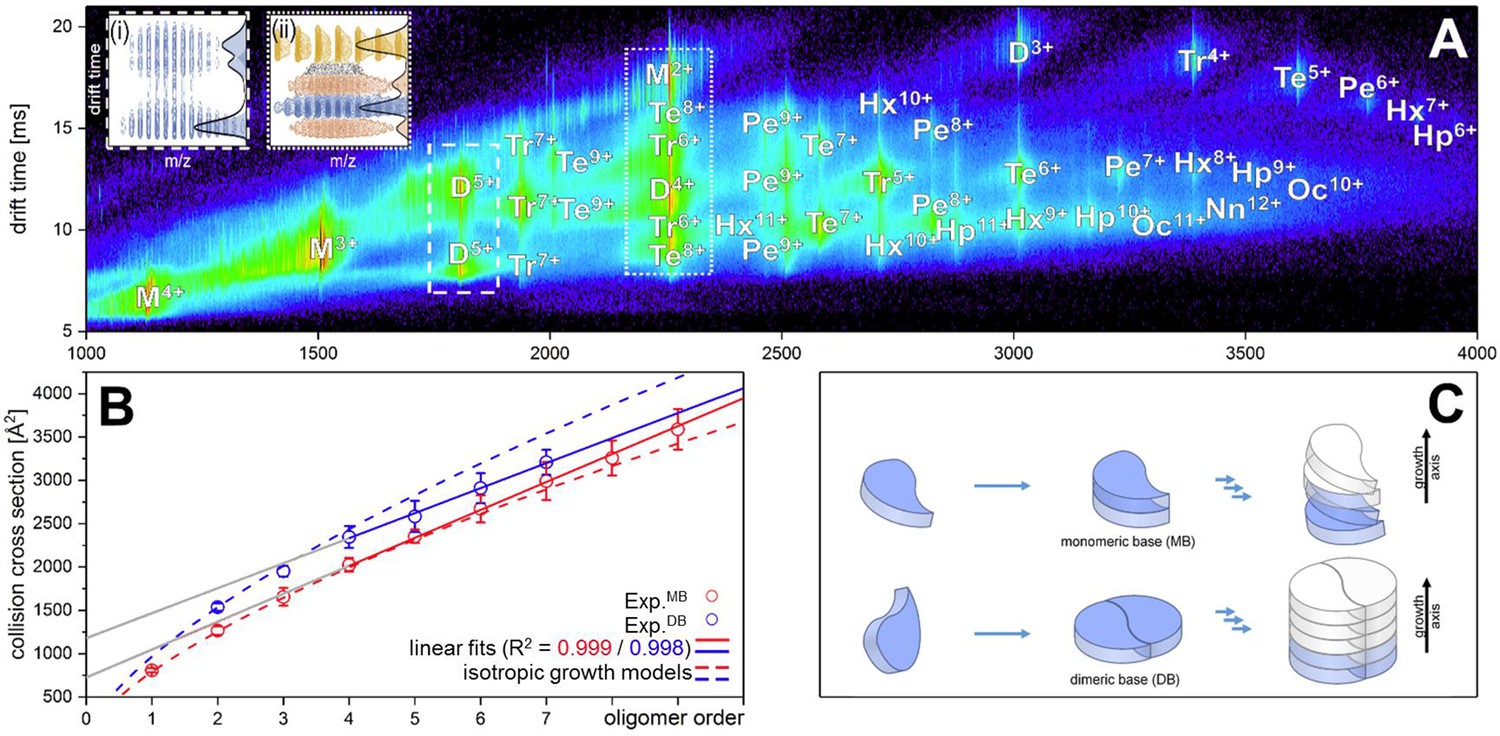
Aβ42forms oligomers with two conformations.
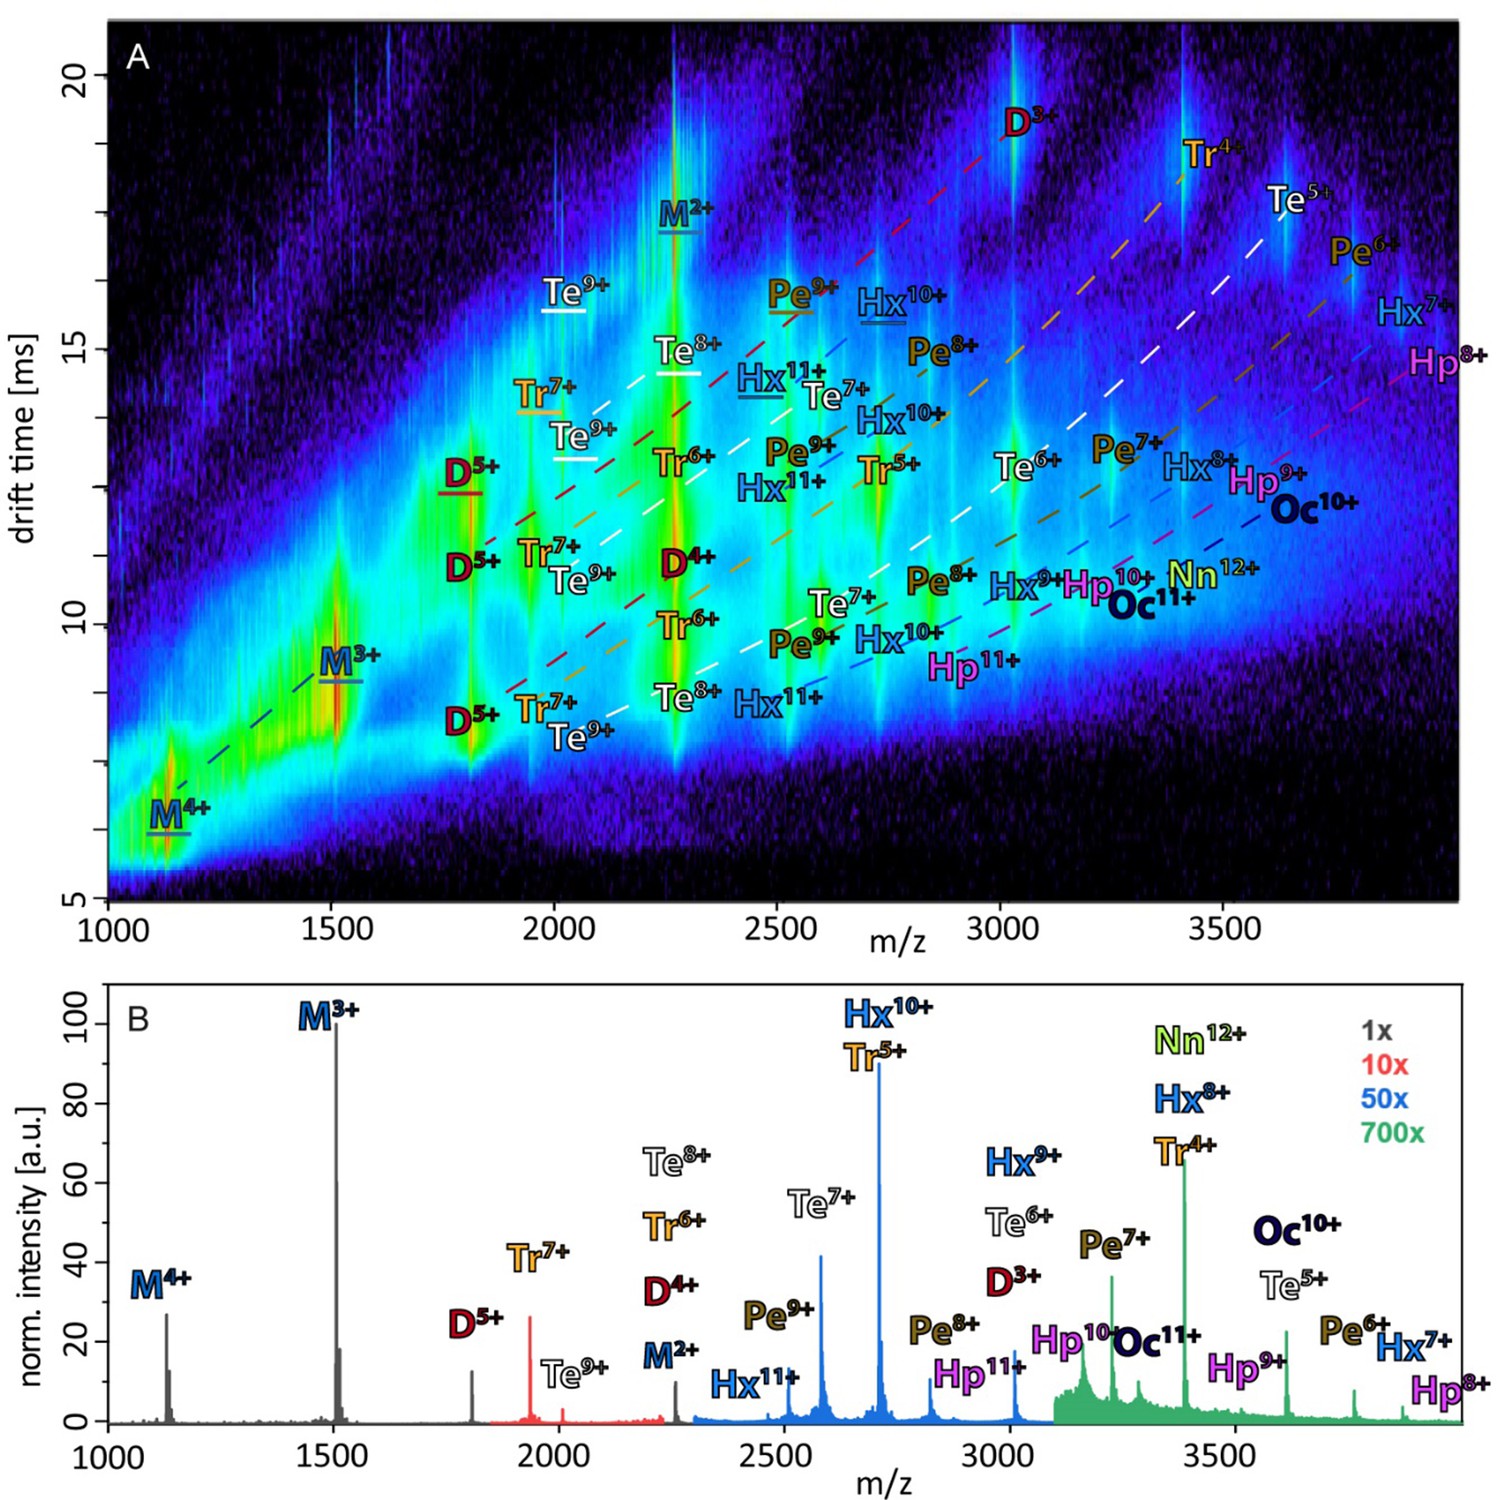
(A) Shows the driftscope spectrum of aggregated Aβ42 polypeptide. Signals corresponding to oligomers up to nonamer in several charge states and several conformations can be seen (detailed description of the peak assignment can be found in Appendix 1—figure 1A). The intensity is decoded logarithmically in a heat map where red denotes a high, and blue a low intensity. The observable oligomers are denoted as follows: M = monomer, D = dimer, Tr = trimer, Te = tetramer, Pe = pentamer, Hx = hexamer, Hp = heptamer, Oc = octamer, Nn = nonamer. The two insets show driftscope zooms of the indicated m/z areas. (i) Shows the driftscope of the 5-times charged Aβ42 dimer at m/z = 1806. The identical isotope distribution of the three peaks unambiguously indicate the presence of three different conformations for the same oligomeric state (blue). The different isotopic distributions in (ii) show that the mass peak of m/z = 2258 consists of overlapping species of several oligomers (the dominating ones are depicted in yellow, orange, blue). For the experimentally determined oligomers in A, the CCS were calculated. (B) depicts the CCS for all oligomers which could be assigned to solution conformations of the respective oligomer (red and blue circles). For comparison, the lines indicate theoretically calculated CCS following an isotropic growth model (dotted lines) or linear growth model (solid lines) (Bleiholder et al., 2011). (C) depicts the proposed process during the first self assembly steps of Aβ42 peptides. The first two monomers can form a planar dimer, which is the base (DB) for further addition of Aβ42 monomers. If no planar dimer is formed, the Aβ42 monomers stack axially onto the monomeric Aβ42 base (MB). This results in two morphologies: A single stranded aggregate with a MB conformation, and a zipper like structure with a DB arrangement for fibril growth.
Figure 2
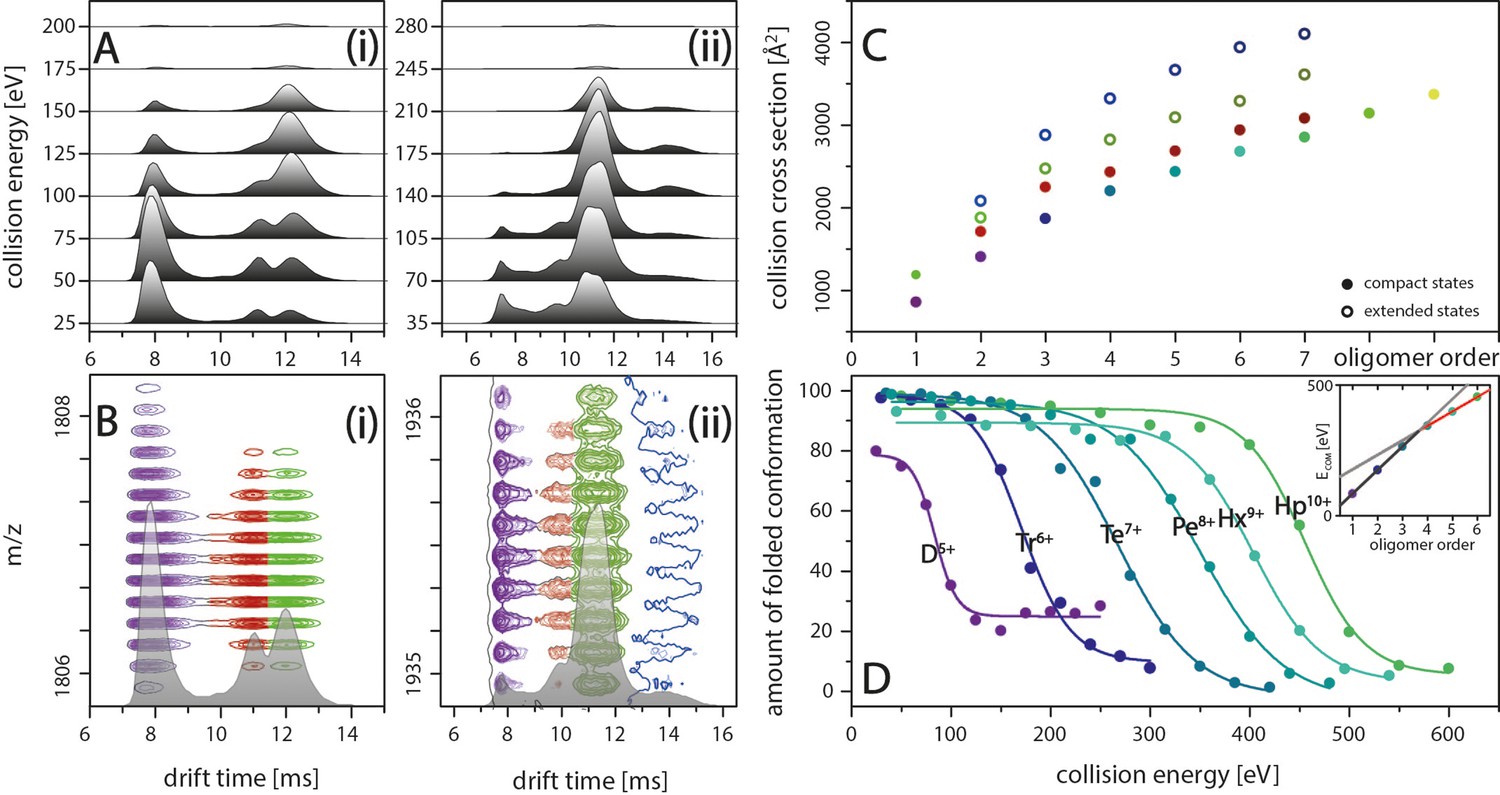
IM spectra of the five-times charged Aβ42 dimer (i) and of the seven-times charged trimer (ii) for different CE.
The structured MB conformation at a drift time of 8 ms shows an unfolding product (drift time above 12 ms), whereas the structured DB conformation (drift time of 11 ms) does not unfold before undergoing collision induced dissociation. (B) Driftscope plots of the five-times charged dimer (i) and the seven-times charged trimer (ii), shown in A. The colors indicate the two dimer structures (purple and red) as well as the unfolding product (green). For the trimer, a second unfolding product is detected (dark blue). (C) Increased lab frame energies can lead to unfolding of both structured conformations for each oligomer: CCS for the four species (two compact and two extended states) for each of the different oligomers, averaged over all charge states. Color code matches with B+D. (D) CIU of the different MB oligomers depending on CE, corrected for the charge states of the oligomers. The stability of the oligomers increases with their size at different rates below and above the tetramer (inset).
Figure 3
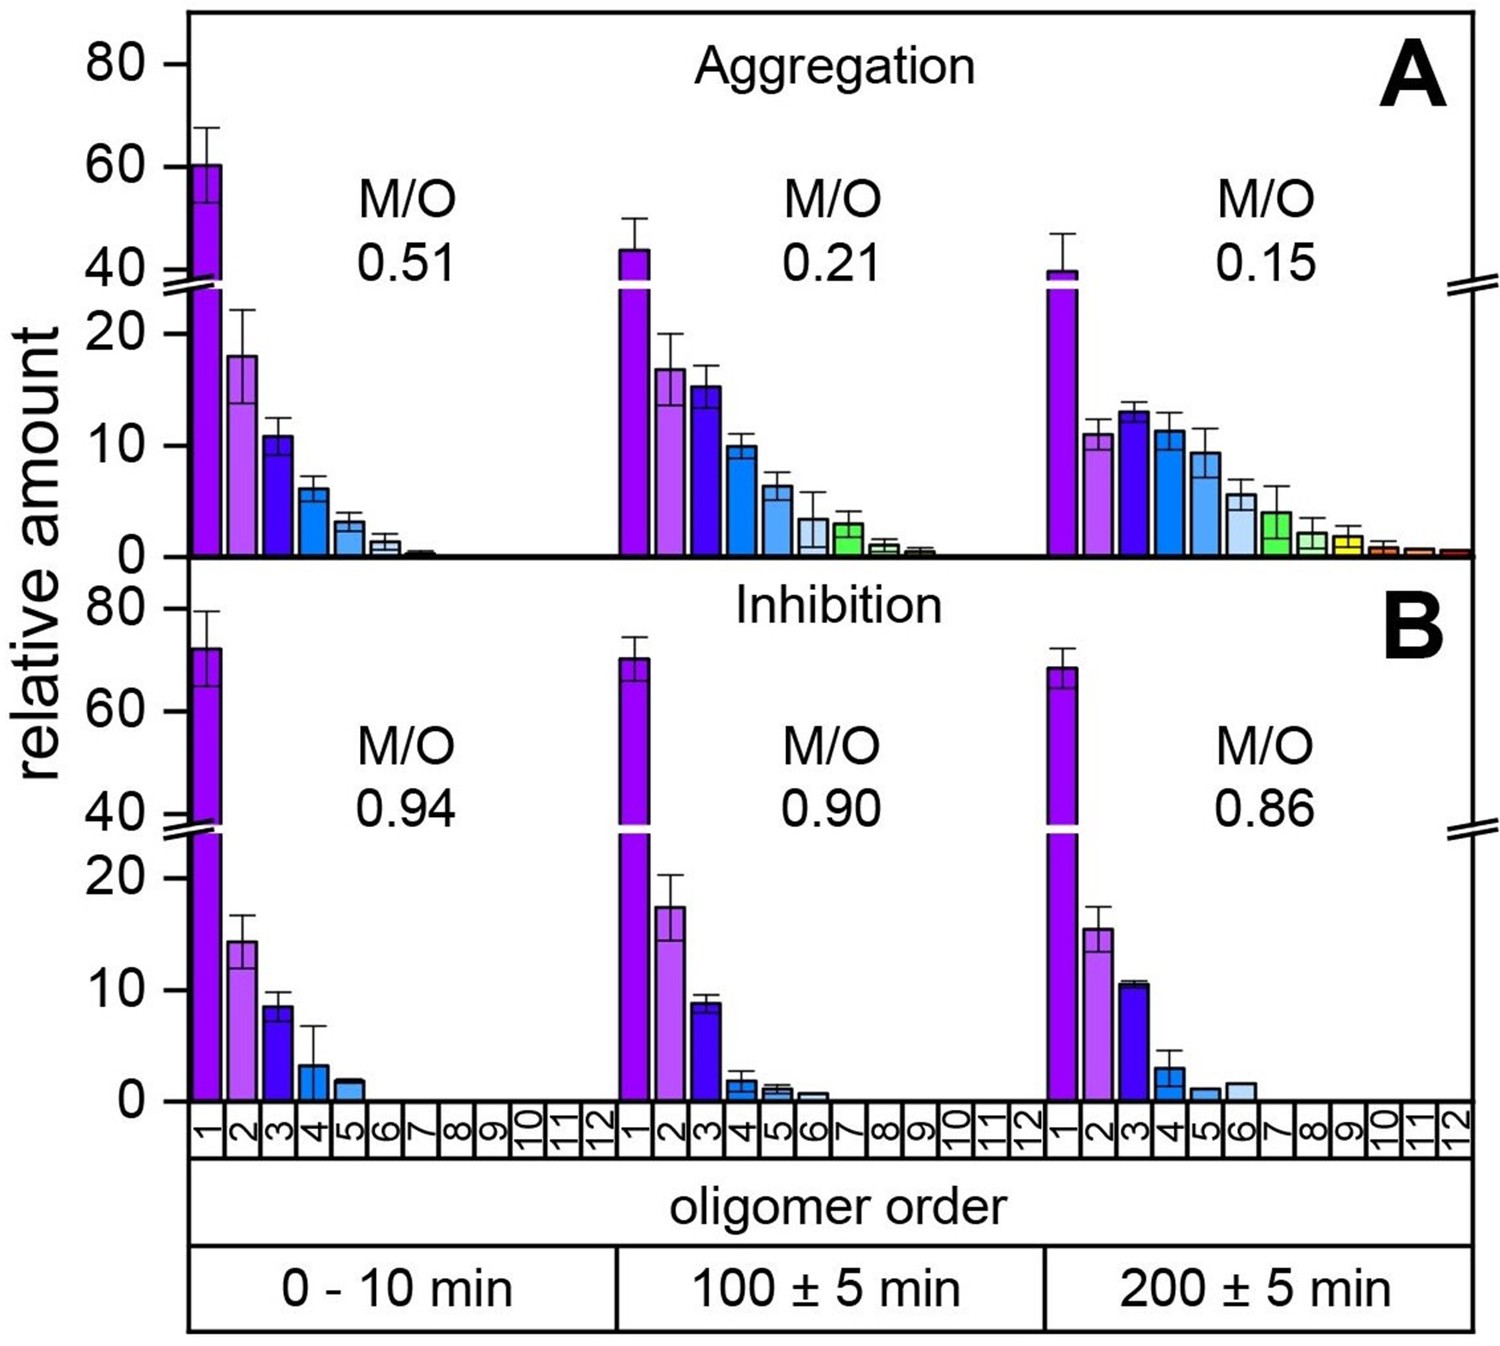
Time-resolved measurements of the oligomerization of Aβ42 incubated at a temperature of 22°C.
The aggregation of the monomerized Aβ42 sample was tracked for 200 min. The signals of the corresponding oligomers were averaged for the period of 10 min. The observable oligomers are indicated in the color code according to Figure 2D. LILBID-MS measurements of the full time period (supplementary data Appendix 1—figure 9) show the time-dependent development of the first Aβ42 oligomers (A), which is hindered in the presence of CLR01 (B). The relative intensity of the distinct oligomers are shown for different time points, normalized to the spectrum's total intensity. The monomer over oligomer ratio (M/O) values reflect the development of the Aβ42 oligomerization.
Figure 4
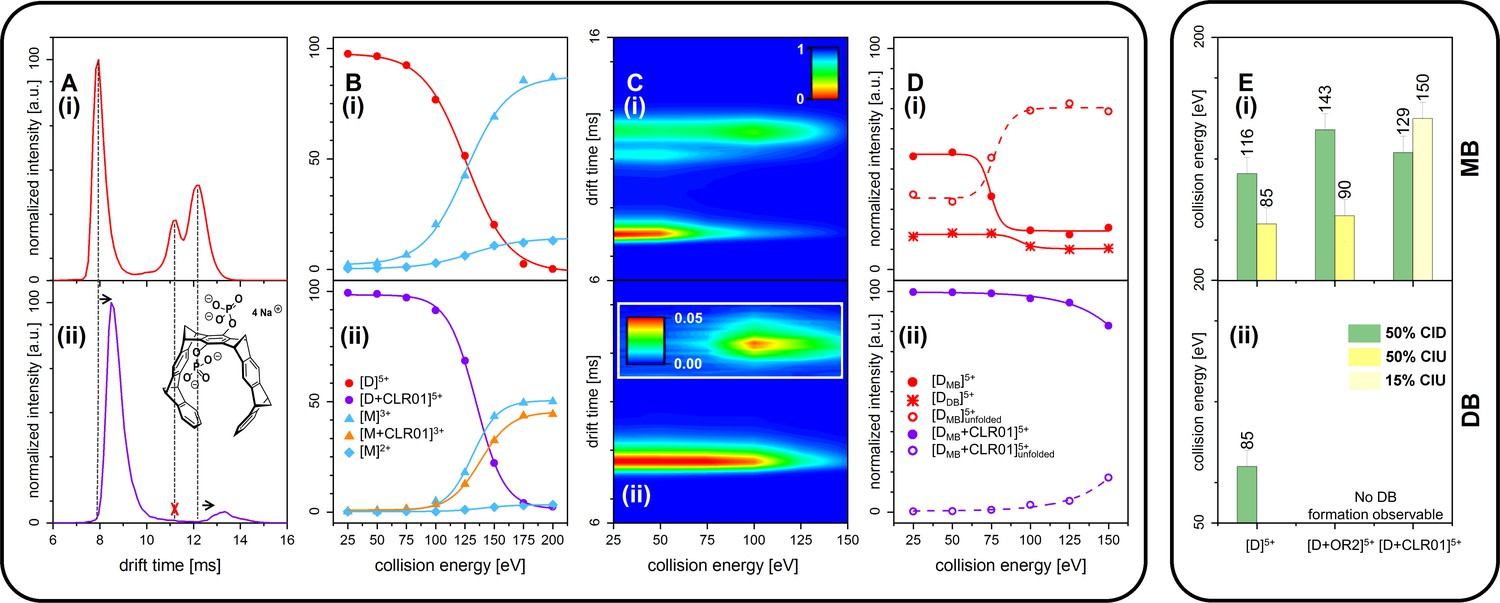
CID and CIU experiments comparing free Aβ42 (top row (i)) and CLR01-bound Aβ42 (bottom row (ii)).
(A) (i) and (ii) show a comparison of the IM spectra of the 5-times charged dimer of pure and CLR01-bound Aβ42, respectively. (B) (i) and (ii) show CID experiments of the D5+ of free and CLR01-bound Aβ42, respectively. (C) (i) and (ii) show a heat map of CIU experiments in dependence of CE increase for D5+ of free and CLR01-bound Aβ42, respectively. In (C) (ii) the signal for the dependence of the drift time on CE for the extended unfolding product of the MB dimer is scaled up by a factor of 20. (D) (i) and (ii) show an intensity plot of the peaks visible in the CIU experiment of C. (E) CE which lead to 50% CIU or CID for D5+ with or without one bound ligand for the MB (i) and DB (ii) conformation. In case of CLR01, the maximally observed amount of CIU product is 15% due to prior CID. Errors given are a conservative estimate of three repeats. Data shown in supplementary data Appendix 1—figure 11.
Figure 5
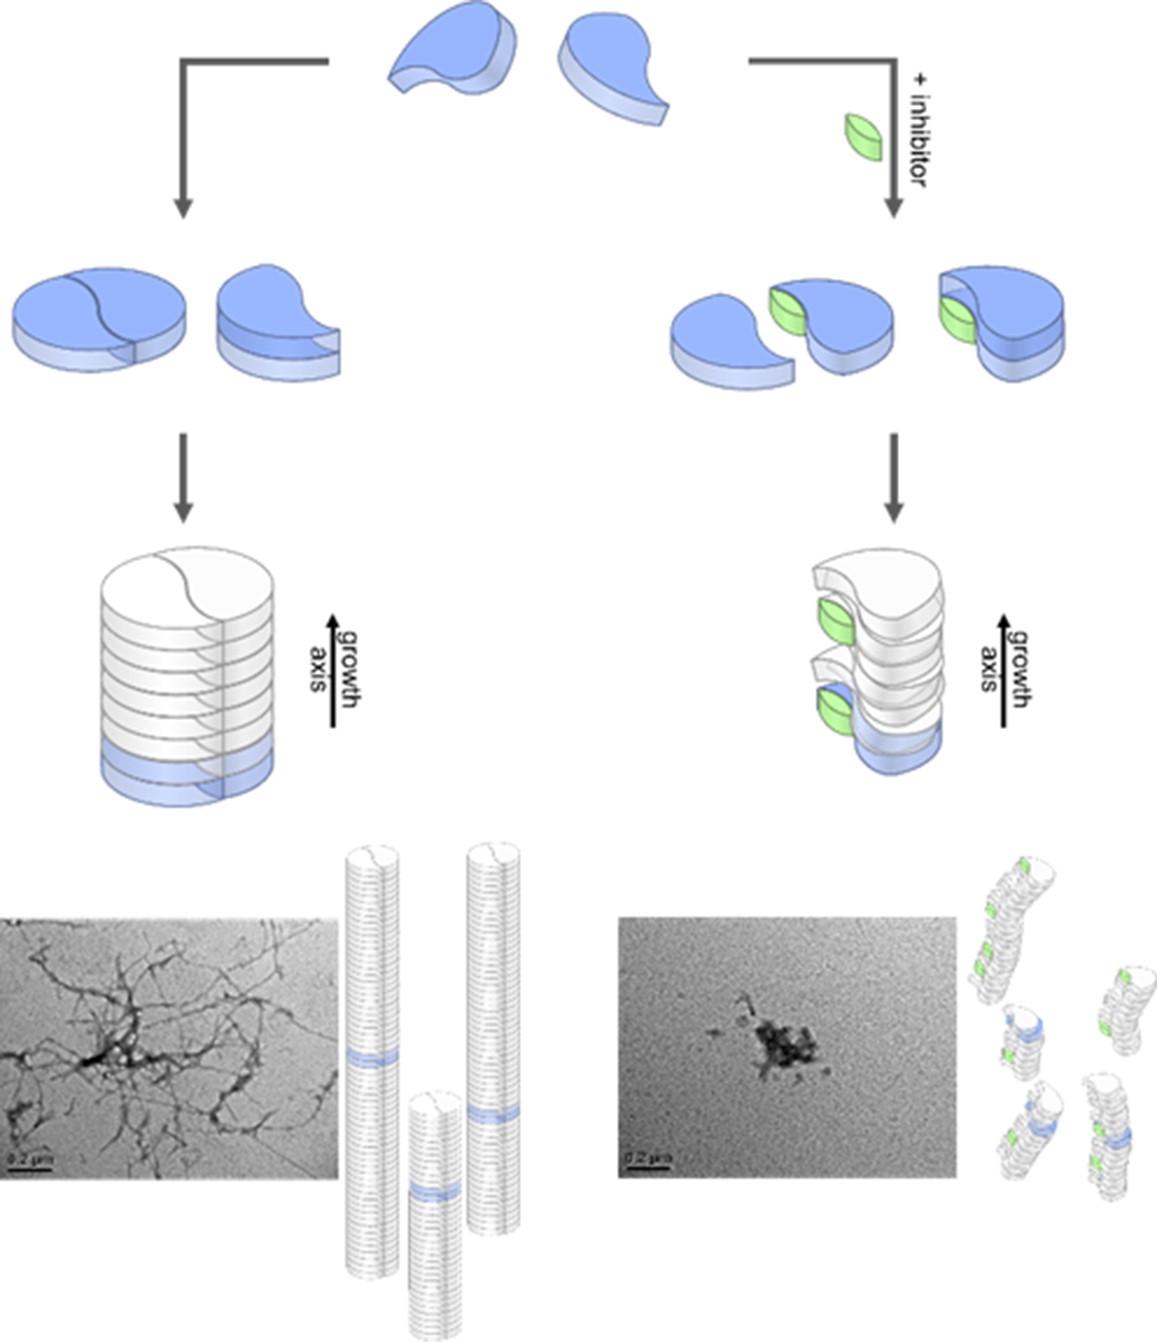
Aggregation pathways and inhibition by the low molecular weight inhibitor CLR01.
Monomeric Aβ42 can oligomerize via two separate ways, either by an axial stacking of monomers which results in amorphous aggregates or by DB stacking which results in fibrils. The pathway involving stacking of dimers is inhibited by CLR01. Inserts show TEM images for free (left image) and CLR01-influenced (right image) Aβ42.
Appendix 1—figure 1
Annotated driftscope spectrum and corresponding mass spectrum.
(A) Annotation of the driftscope spectrum of aggregated Aβ42, shown in Figure 1A. The corresponding mass spectrum is shown in (B). Structured proteins appear in a driftscope plot already at lowest CE. Increase of CE leads to decrease of some of these structures, while new extended structures appear (See as well Figures 2A and 4C, Appendix 1—figure 5). The driftscope in A is measured at a CE of 15V. This is sufficient for the higher charge states of many oligomers to unfold in the gas phase, as seen by the higher drift times (Unfolded oligomers are indicated by a white outline of the annotation, as opposed to the black outlined annotations, which depict those signals, which stem from solution structures). While many peaks overlap in the mass spectrum as well as the driftscope, unambiguous assignment of all species is possible via different means. In some cases identification is based on isotopic resolution (for examples see insets in Figure 1A), unique m/z ratio (such as M3+, D5+, Tr7+,Te7+ etc.) or as they are CIU products of a clearly assigned species. As different charge states of the same oligomeric species fall on characteristic curves in the driftscope (indicated by dashed lines) additional peaks can be assigned, if the other species of this series are already identified.
Appendix 1—figure 2
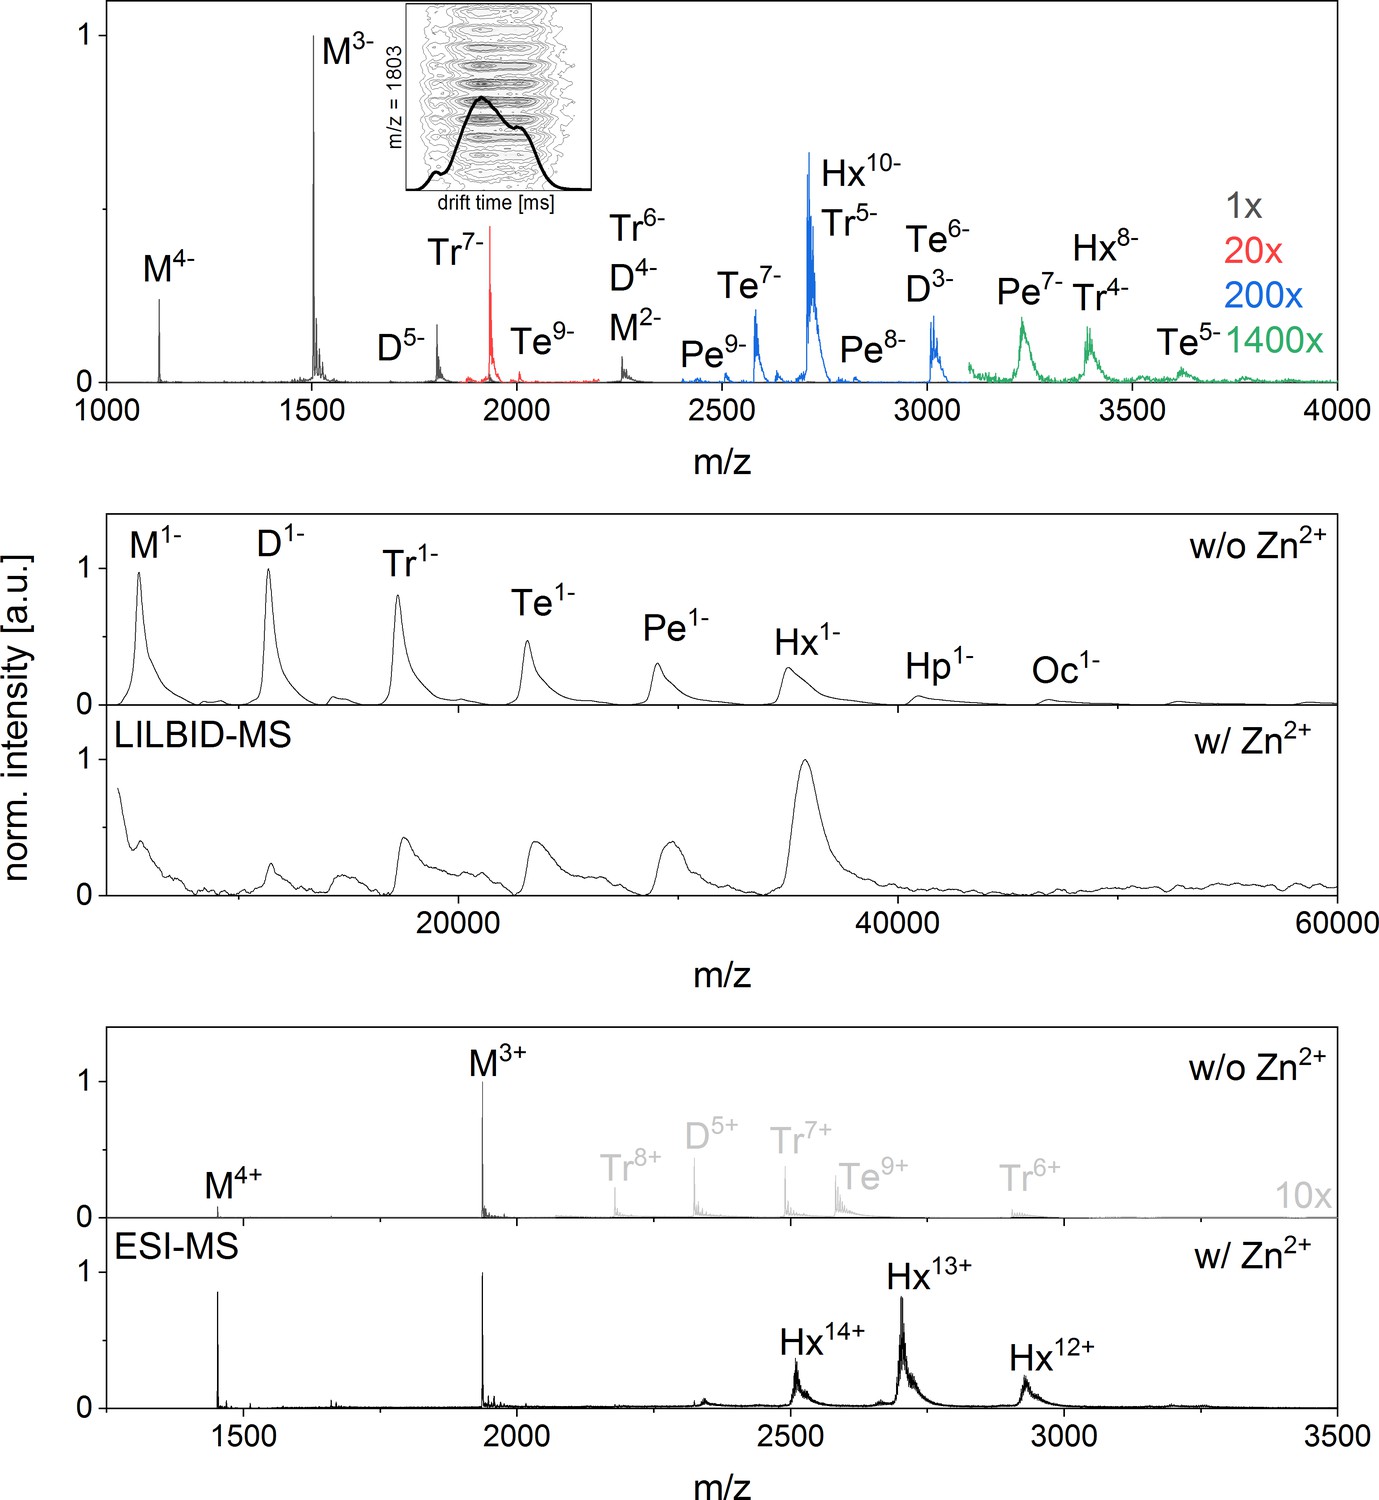
nESI mass spectrum of Aβ42in negative ion mode and LILBID and nESI spectrum of insulin showing a clear formation of a hexamer upon zink addition.
(A) nESI Spectra of Aβ42 in negative mode show similar characteristics to those taken in positive mode (compare Appendix 1—figure 1). Several oligomerization states can be seen, albeit at lower and lower intensity for the higher the oligomeric states (upscaling of the signal intensity was done as indicated in the figure). As the oligomerization of Aβ42 was previously described as a process progressing via hexamers (Bernstein et al., 2005), we briefly explain here, why we support the notion of linear growth. Both MS methods applied here show Aβ42 in different oligomeric states with decreasing intensity for higher oligomeric state and no mass peaks indicating a dominant hexamer. Mass spectra published by Bowers et al. don’t show any dominant hexamers either, but the presence of tetramers and more dominant hexamers is deduced from different features seen in drift scope plots for the same m/z signals (Bernstein et al., 2005). Different drift times for one m/z ratio can be caused by different conformations of one oligomer species or by overlap of different charge states of different oligomers. Therefore for example the three different drift times for a nominal −5/2 charged monomer were interpreted as five times charged dimer, 10 times charged tetramer and 15 times charged hexamer. We reproduced these measurements and could similarly observe different drift times for m/z = 1806 in positive (Figure 2B) and negative ion mode (Inset in A). As our mass spectra show isotopic resolution we can nevertheless show that the alternative interpretation holds true: these drift times belong to different confirmations of only one oligomeric state – the dimer. This is true for all the species discussed in the work of Bowers and coworkers (Bernstein et al., 2005). We therefore see no indication for tetramer or hexamer in the drift time plots of these mass peaks, and only very low intensity higher oligomers in the mass spectra. For comparison we investigated insulin, a protein, which is known to aggregate to a hexamer in the presence of zinc ions (Dodson et al., 1979) B shows LILBID results and C shows nESI results of insulin (10 µM insulin in 50 mM ammonium acetate buffer), both without (i) and with (ii) 1.5-fold excess of zinc respectively. Without zinc some aggregation can be seen with both methods, albeit more of the higher oligomers are retained in the LILBID spectrum, which is similar to our observations for Aβ42 (compare Appendix 1—figure 1 and 9). Upon addition of zinc the oligomer distribution shifts to a dominant hexamer, which is clearly visible in both mass spectra. In contrast the hexamer appears in low intensity only for Aβ42.
Appendix 1—figure 3
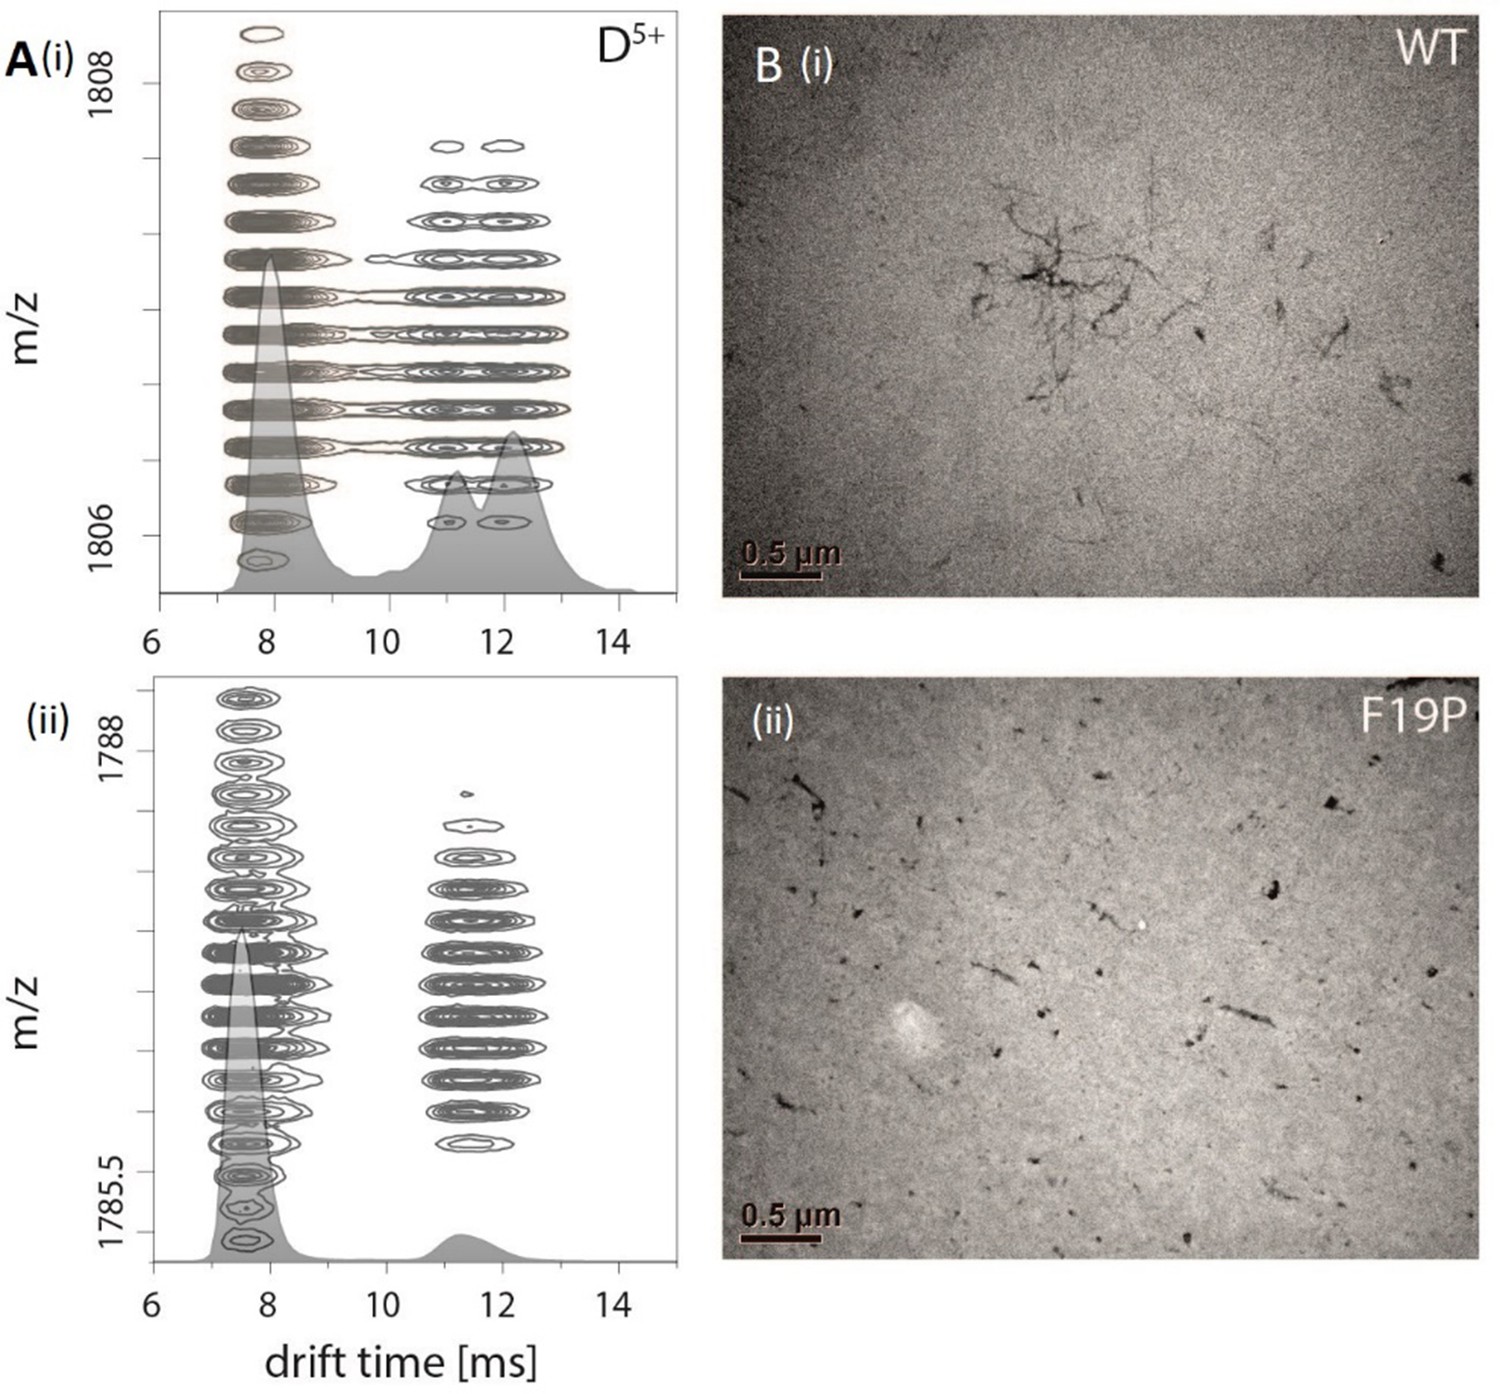
Comparision of Aβ42 wt and mutant F19P.
(A) Comparison of the IM spectrum of the 5-times charged dimeric wildtype Aβ42 (i) with that of the Aβ42 mutant F19P (ii) shows loss of the DB structure for the later one. (B) TEM images of both species show that this goes along with the loss of the characteristic fibrillary structures, which can only be seen for Aβ42 wt.
Appendix 1—figure 4
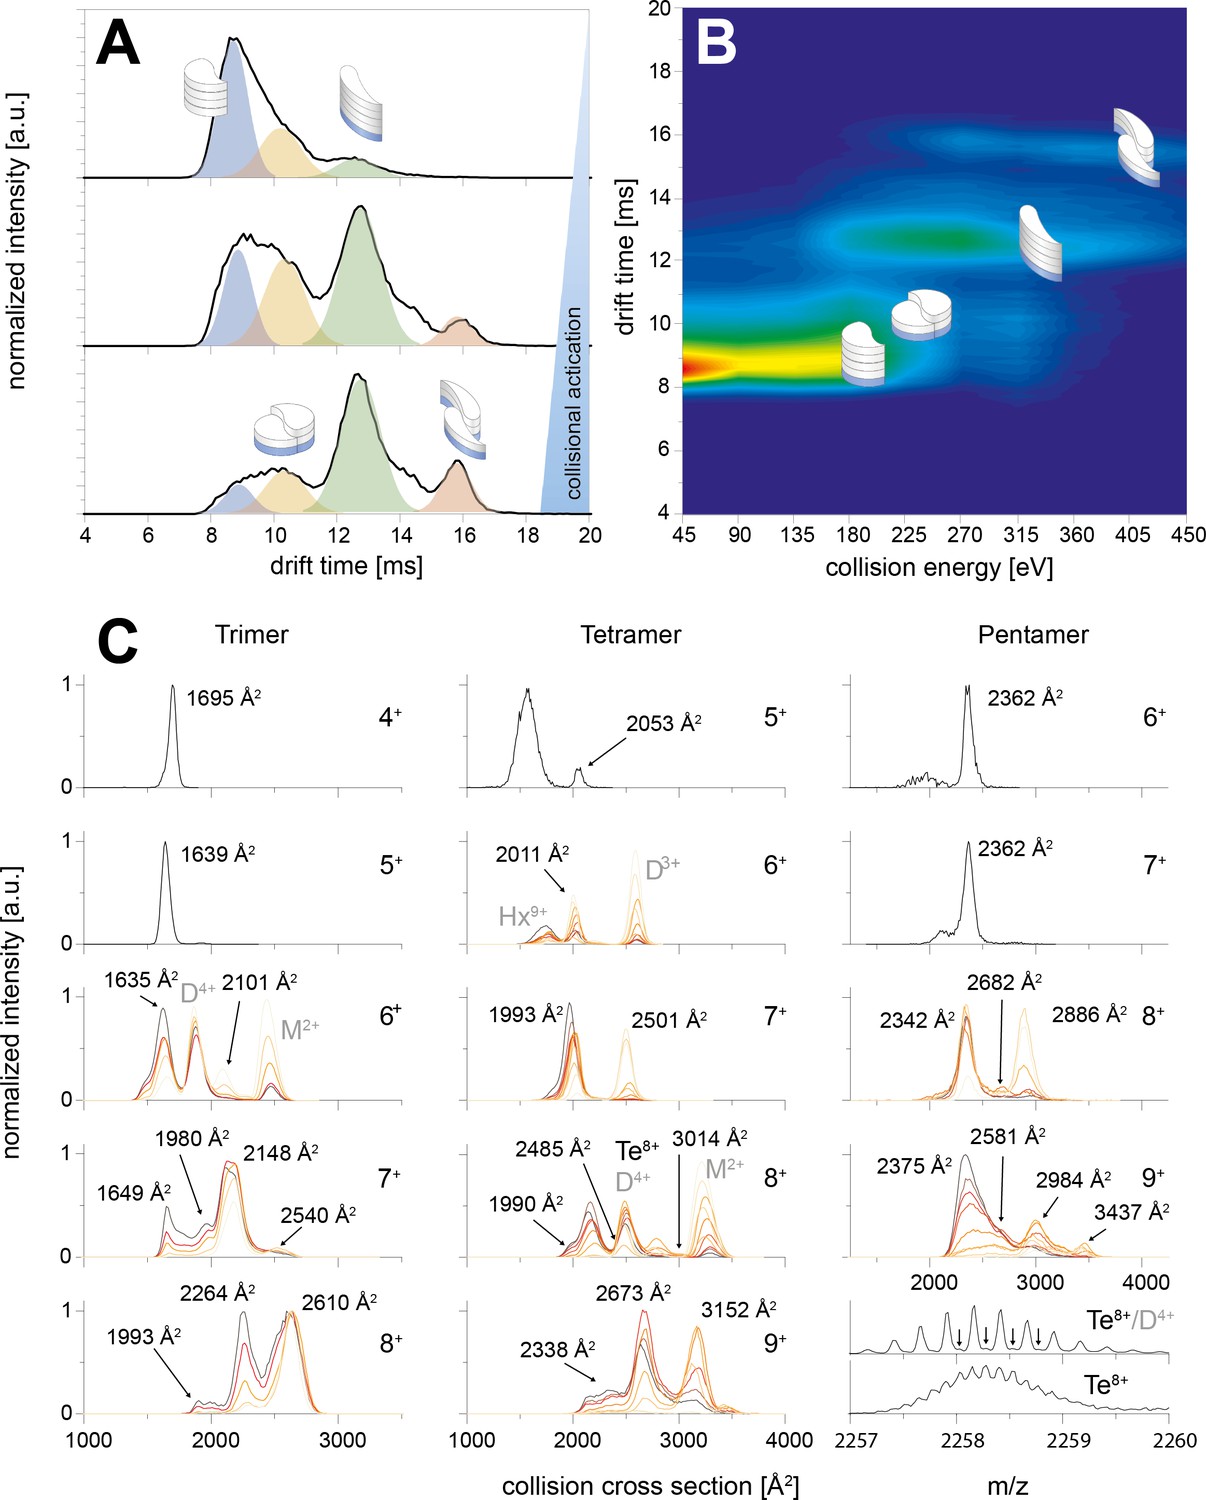
CIU of the trimer, tetramer and pentamer species.
The schemes indicate the different species (folded and unfolded MB and DB structure). A shows three IM spectra for different CEs. In B the spectra of the whole CIU experiment are shown as heat map and also correlated to the four structures (folded and unfolded MB and DB). Similarly C shows IM spectra for trimer, tetramer and pentamer for different charge states. The spectra are overlaid for different CE. In all cases the smaller conformers pick up less charges in the ESI process, allowing to observe the two conformations (MB and DB) only for medium and higher charge states. For the lowest charge states the lab frame energies achieved with CE ramping are not sufficient for CIU. MB oligomers with medium charge states undergo unfolding prior to CID. The collisional energy experienced by the oligomers of higher charge states leads to unfolding and then dissociation for DB and MB species. The CCS values of the relevant species are indicated in the respective plots; where other species overlap (such as the dimer and tetramer species in the 4-times charged dimer spectra) they are indicated as well.
Appendix 1—figure 5
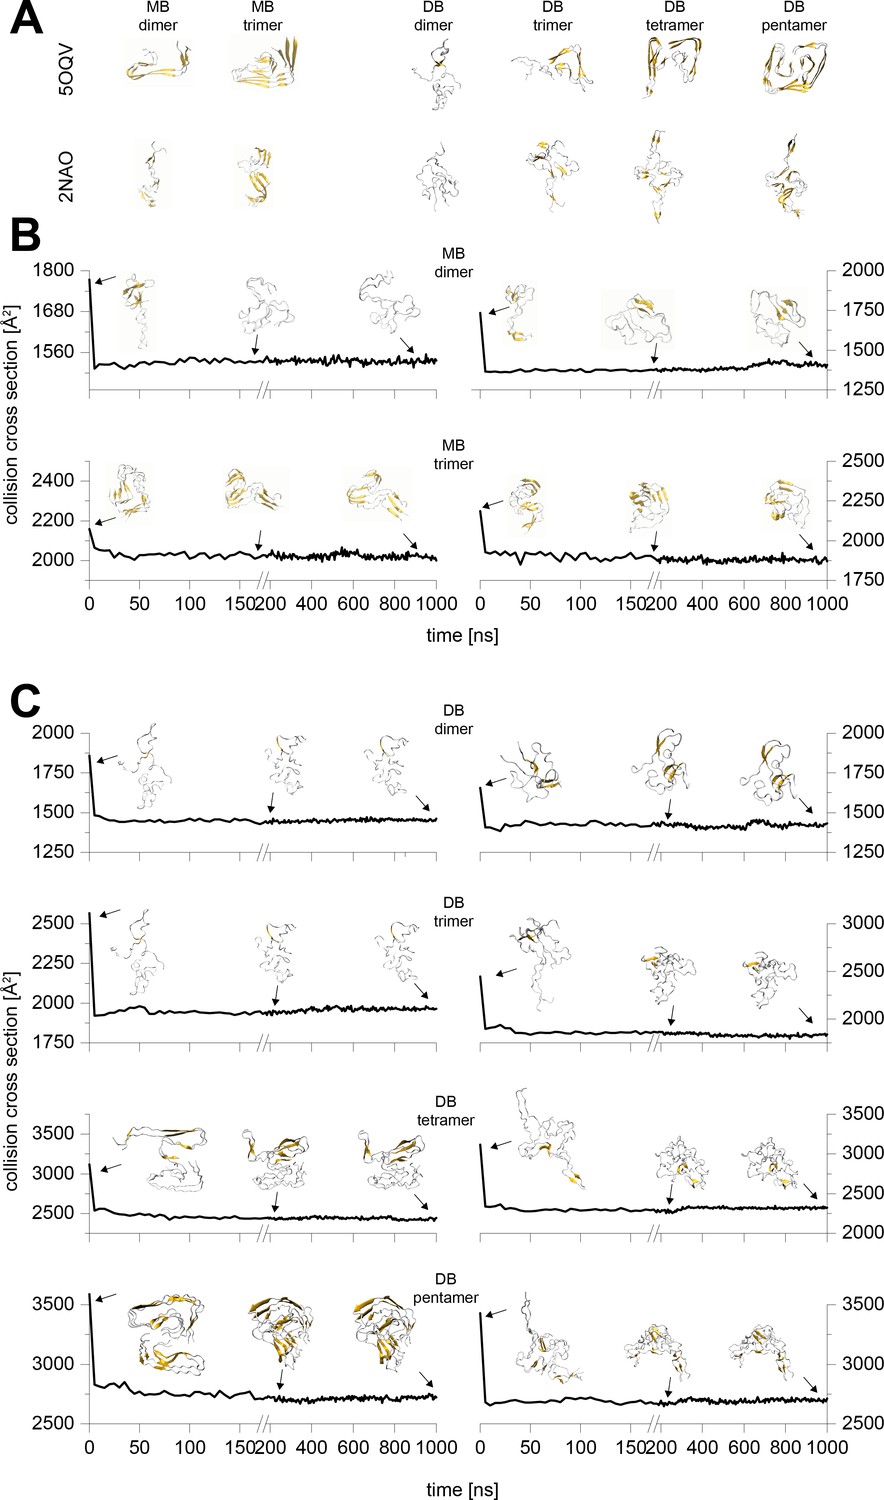
Typical results from the MD simulations of different Aβ42 oligomers cropped out of the PDB structures 5OQV and 2NAO.
A shows the respective structure after 10 ns simulation in water. These structures were sent to vacuum simulations. B and C depict the change of the structure's CCS during simulation in vacuum for 1 µs. The insets show exemplary structures after 0 ns, 200 ns and 1000 ns of simulation. The CCS of the 200 and 1000 ns vacuum structures differ by 2% at most, which is below the resolution of the IM-MS. Hence all the remaining calculations were performed to 200 ns.
Appendix 1—figure 6
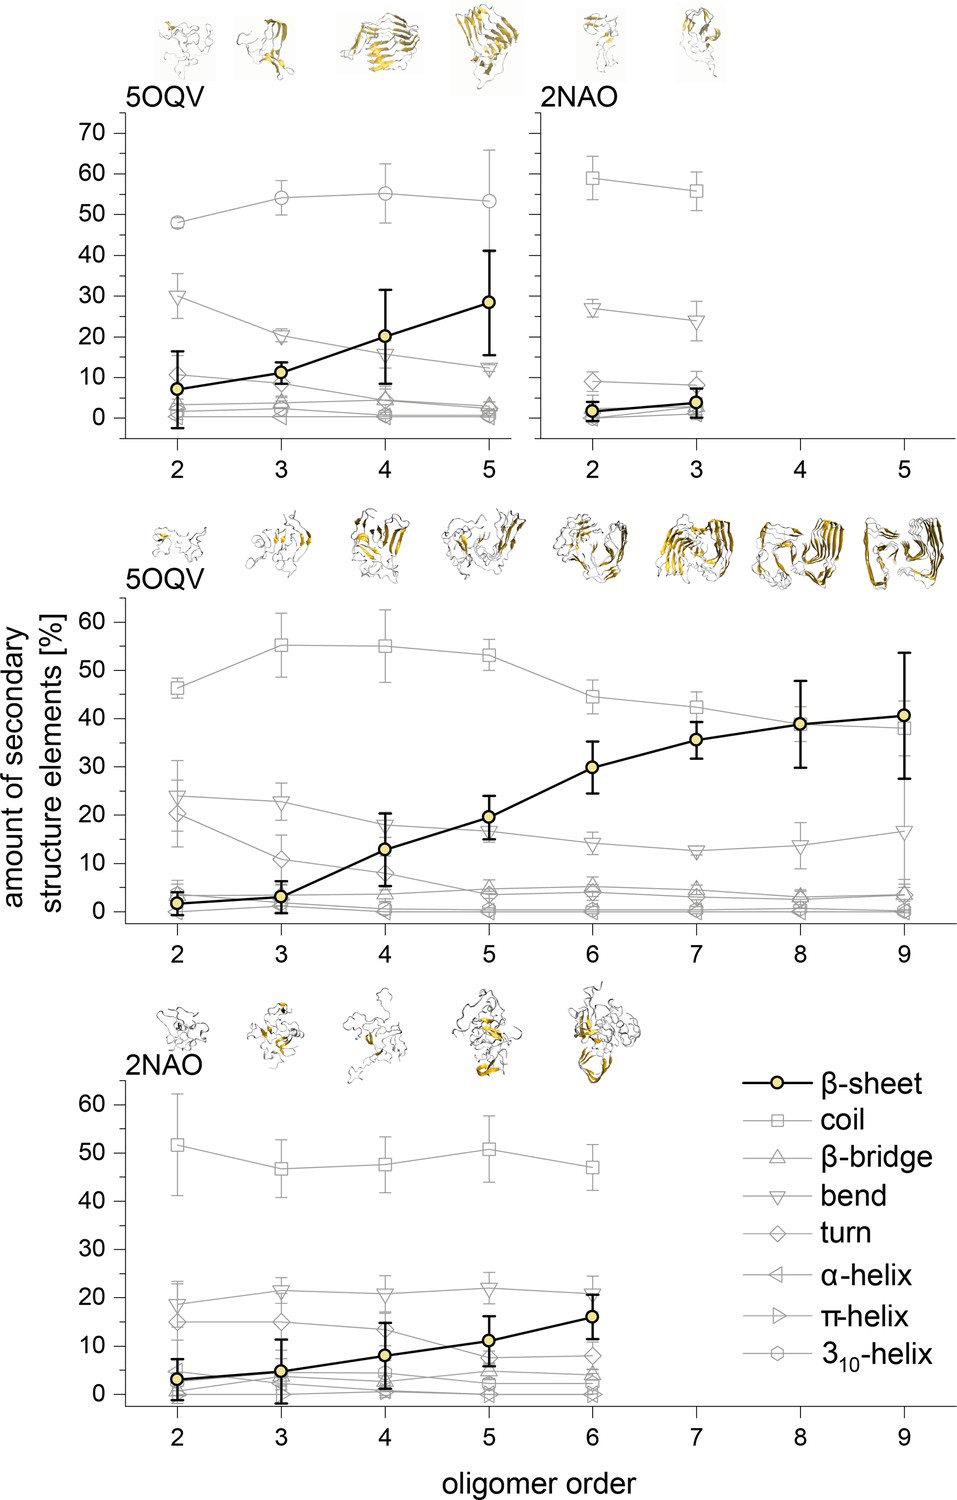
Development of the different structural elements of the Aβ42 oligomers as calculated using the DSSP algorithm for MB oligomers (top) and DB oligomers (middle and bottom).
In all cases the most striking feature is the development of the β-sheet motive for the higher oligomers. The structures above show these motives in gold for the different representative Aβ42 oligomers.
Appendix 1—figure 7
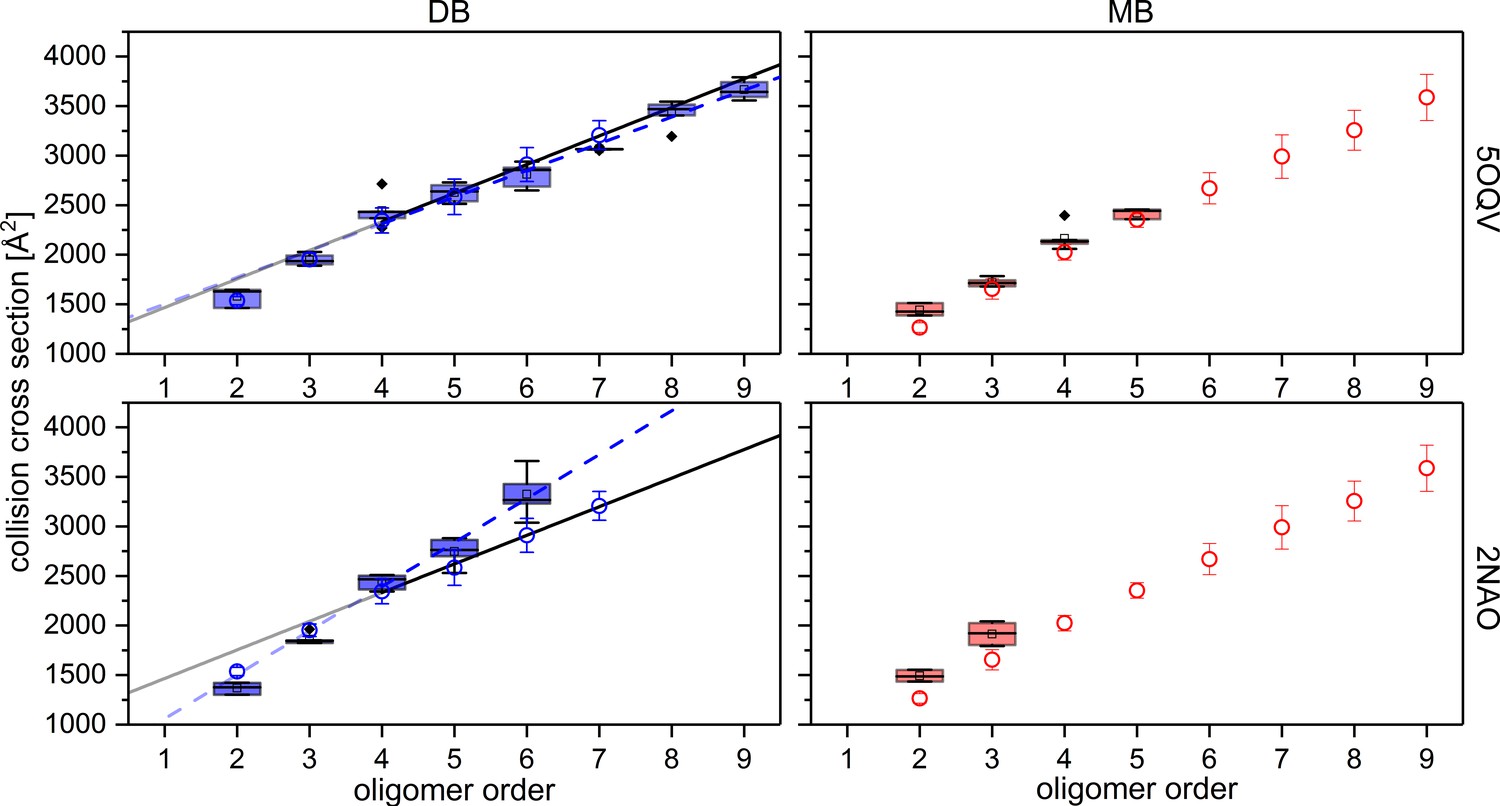
Comparison of experimental CCS values (blue circles for DB conformation on the left and red circles for MB conformation on the right) to CCS values of MD simulated PDB structures (box plots, using a minimum of five calculated structures) of Aβ42 oligomers.
For comparison the structures detected with cryo-EM by Gremer, et al. (PDB 5OQV) and with solid-state NMR by Wälti, et al. (PDB 2NAO) were used for MD simulations and CCS calculations as illustrated above (Gremer et al., 2017; Wälti et al., 2016). Linear fits for oligomers from tetramer on, demonstrate the difference between experimental (solid) and theoretical (dashed) CCS of the DB conformation. The structure of PDB 5OQV (upper plots) matches our experimentally determined CCS values best.
Appendix 1—figure 8
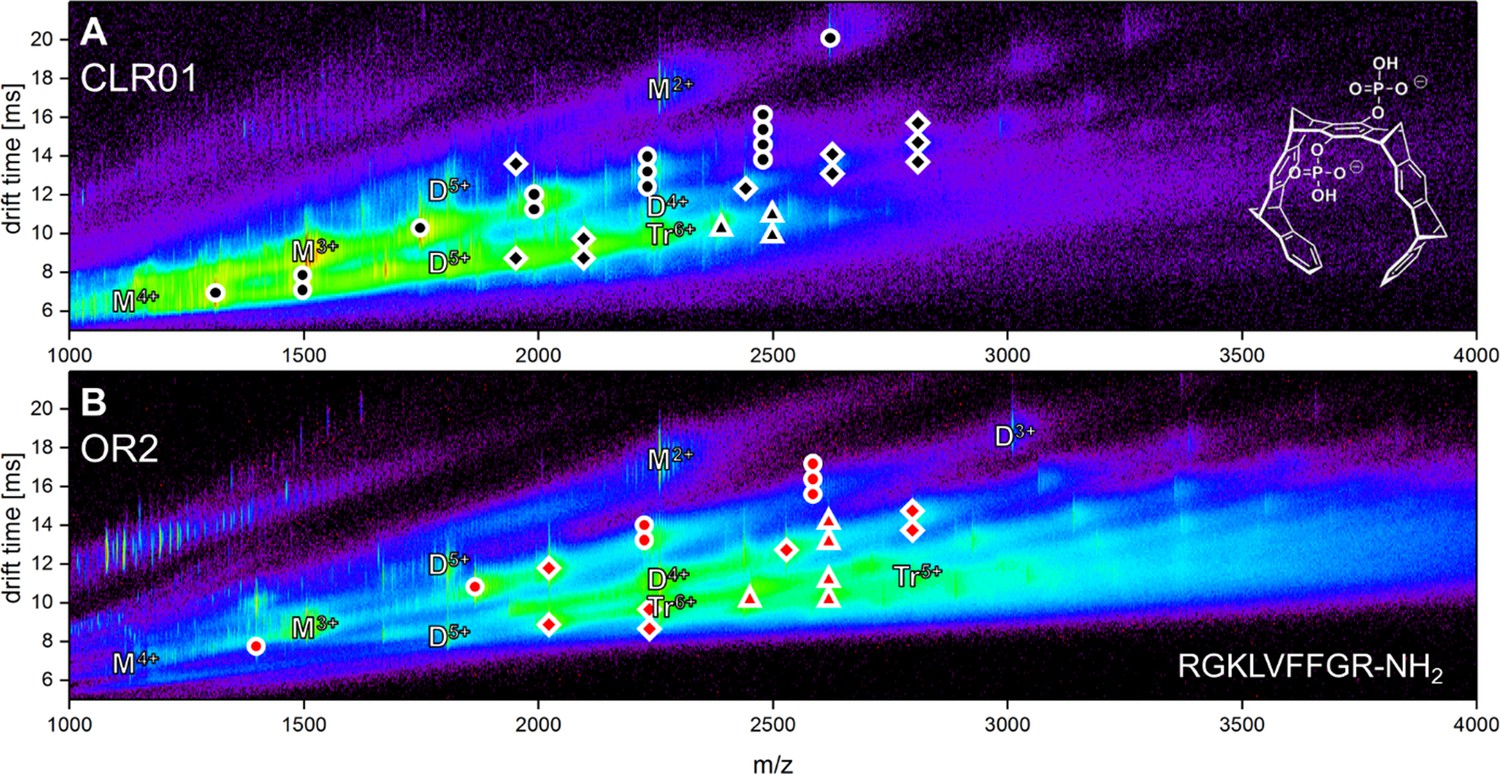
Driftscope of Aβ42 interacting with the two ligands CLR01 (A) and OR2 (B).
The marker indicates an interaction of an Aβ42 oligomer with up to four copies of the respective molecule. Higher binding events are not indicated (ligand interaction with: circle = monomer, square = dimer, triangle = trimer).
Appendix 1—figure 9
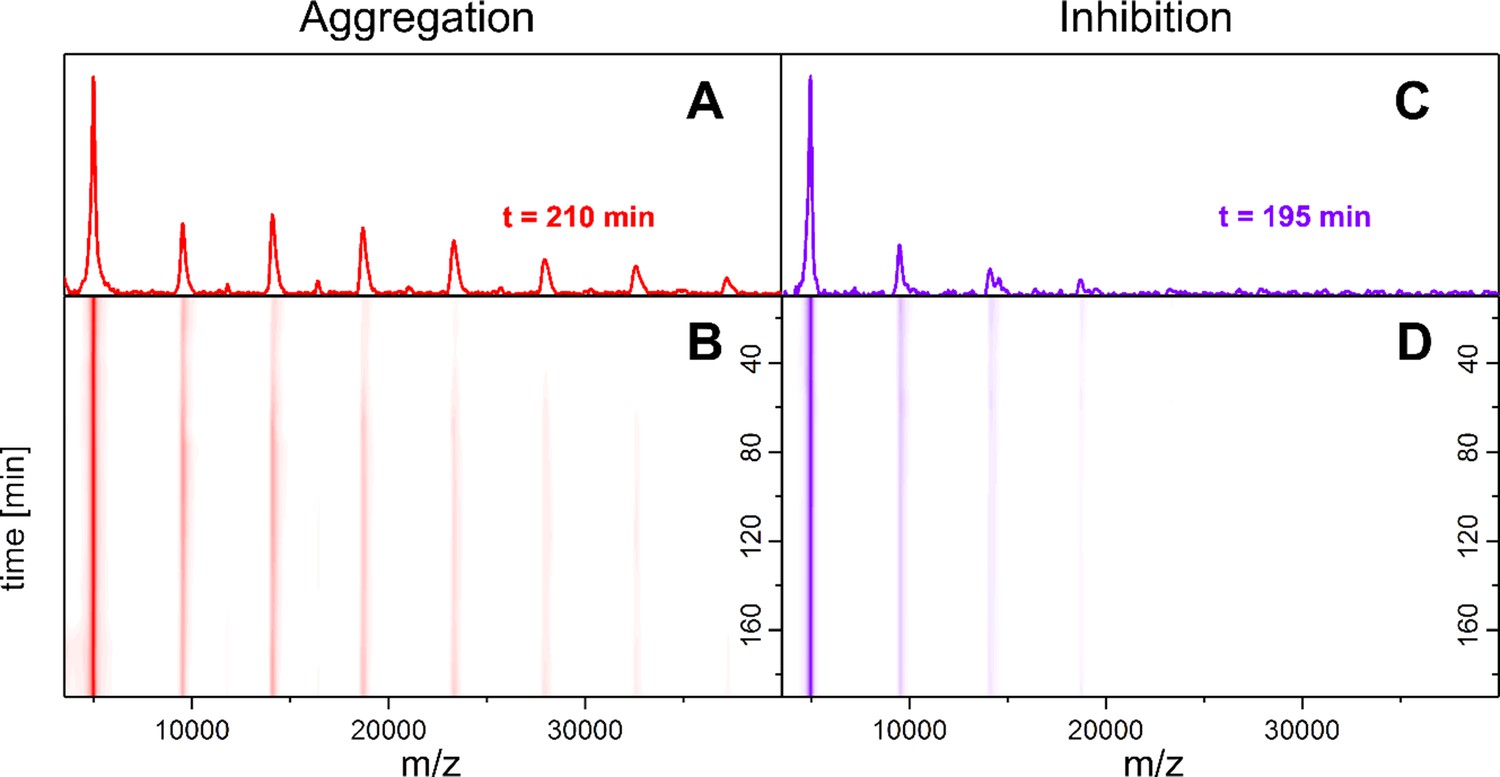
Time-resolved measurements of the oligomerization of Aβ42 incubated at 22°C.
LILBID-MS detects the development of the first oligomers (A, B), which is hindered by the presence of CLR01 (C, D). A and C depict spectra recorded after 200 ± 10 min of Aβ42 incubation in the absence and presence of CLR01 respectively. B and D show the time-course of the appearance of Aβ42 oligomers. Without CLR01 (B) oligomers increase in size. CLR01 inhibits this aggregation (D).
Appendix 1—figure 10
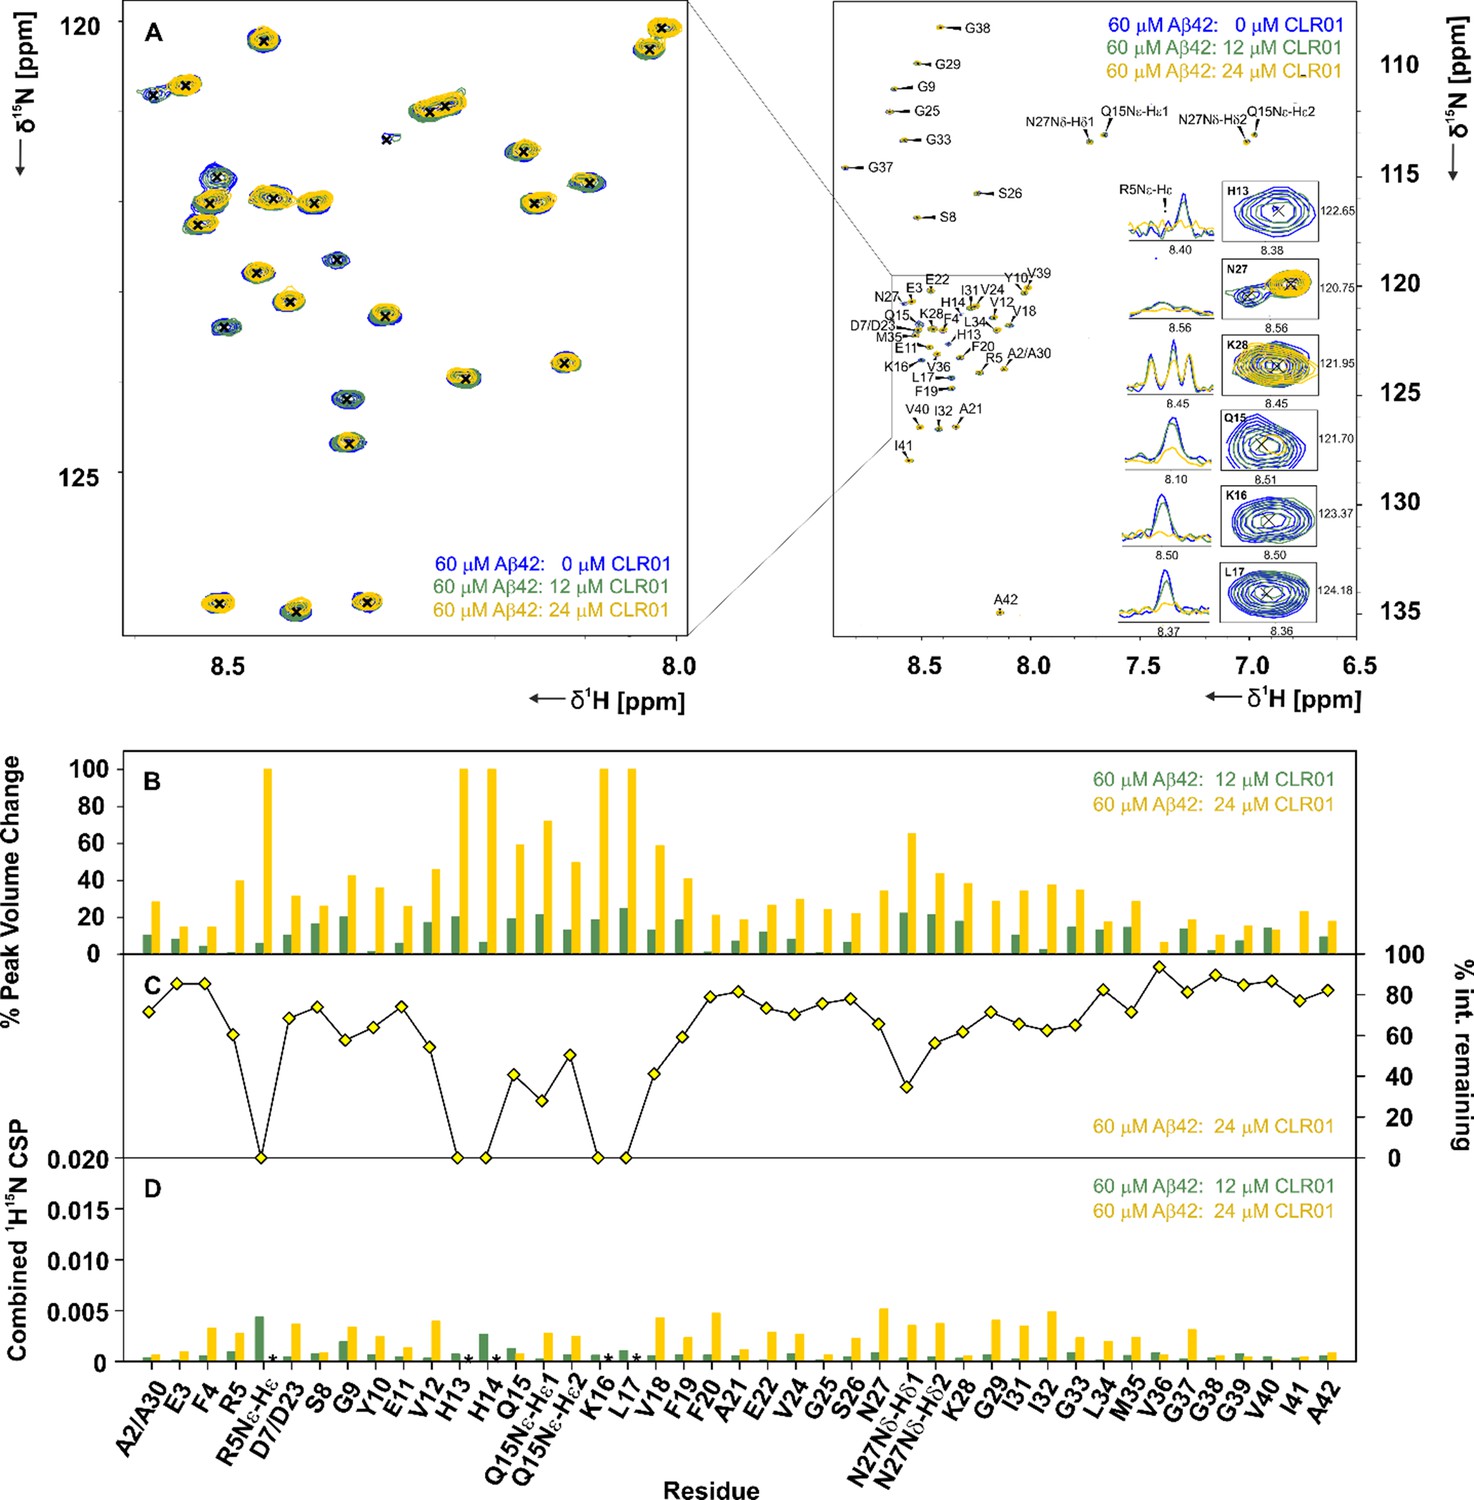
CLR01 interacts with Aβ42in specific areas.
(A) A 2D-{1H, 15N}-HSQC overlay of 60 µM Aβ42 measured at 600 MHz and 278 K in the presence of 12 µM and 24 µM CLR01, depicted in green and yellow respectively. The spectra were recorded at 600 MHz and 278.5 K in 15 mM sodium phosphate, 55 mM NaCl, pH 7.2, 10% D2O. An external reference containing 0.3 mM DSS was used for calibration. Inset (A), enlarged on the left, depicts the 2D-{1H, 15N}-HSQC overlay focusing on the interacting region, including residues H13, Q15, K16, L17, N27, and K28, and the respective 1D-1H projections of a set of 2D-{1H, 15N}-HSQC peaks of Aβ42 after addition of 0 µL, 12 µL and 24 µL CLR01. (B) Illustrates the % peak volume change of residues of Aβ42 in the absence of CLR01, versus Aβ42 with 12 µM and 24 µM CLR01 respectively. (C) The % intensity remaining for 60 µM Aβ42: 24 µM CLR01 versus 60 µM Aβ42 plotted according to residue. (D) Spectral differences were mapped in the CSP chart according to the equation:CSP=((0.1·δ15Nref-0.1·δ15N)2+(δ1Href-δ1H)2)0.5. The combined chemical shift perturbation is shown for 60 µM Aβ42 alone versus 60 µM Aβ42: 12 µM and 24 µM CLR01 respectively. CSPs not depicted due to the disappearance of peaks are denoted by an asterisk.
Appendix 1—figure 11

Effect of ramping the CE on CID and CIU events of the 5-times charged dimer of free Aβ42 (A and B) and CLR01 bound Aβ42 (C and D).
The energies necessary to dissociate or unfold 50% of the species are given, where applicable. In the case of CLR01 bound Aβ42 50% unfolding is not achieved prior to dissociation. The areas shaded in red represent the 90% confidence region of three consecutive measurements.
Appendix 1—figure 12
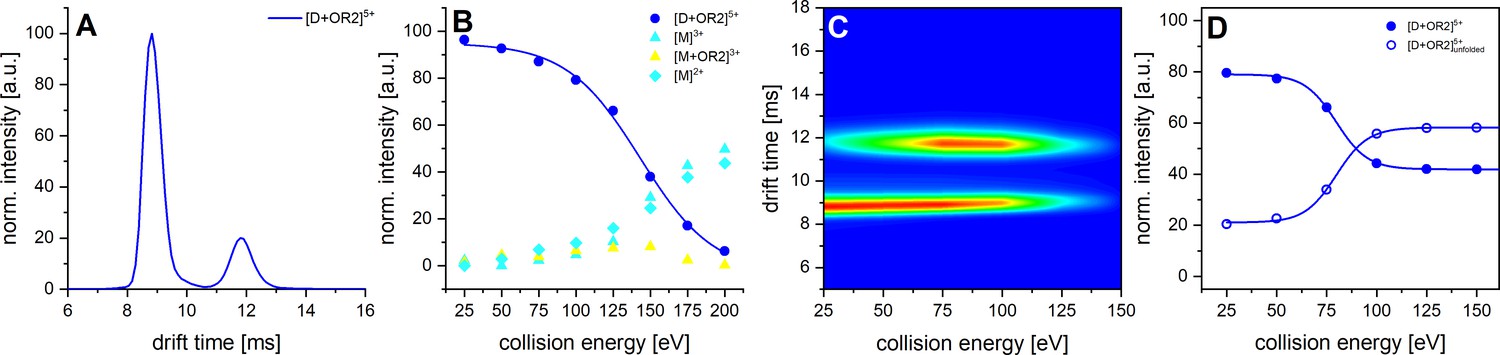
CID and CIU experiments of Aβ42 with OR2.
A shows the IM spectrum of the 5-times charged dimer of OR2 bound Aβ42. The signal of the folded and unfolded MB species are visible, while no signal can be observed for a DB conformation. B shows the observed CID in dependence of CE increase. C depicts a heat map of the CIU experiment of the 5-times charged dimer peak of OR2 bound Aβ42. D shows an intensity plot of the peaks visible in the CIU experiment of B.
Appendix 1—figure 13
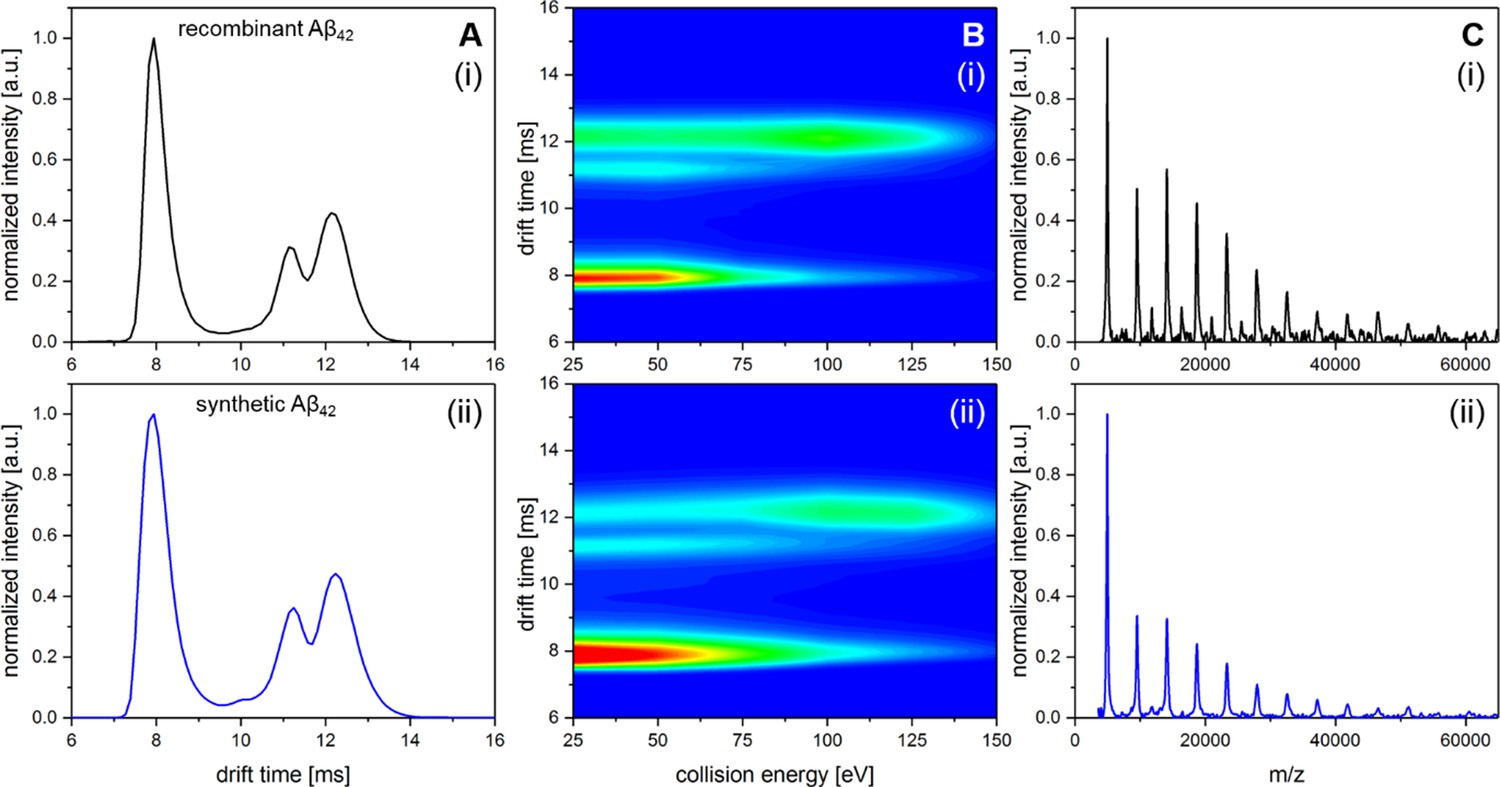
Comparison of recombinant Aβ42 and Aβ42 synthesized via Fmoc chemistry.
A shows IM spectra of the D5+ signal for recombinant (i) and synthetic (ii) peptide. In both cases all signals in the respective IM spectra appear at the identical drift times. B shows heat maps of the CIU experiment for recombinant (i) and synthetic (ii) peptide. Only a slight difference in signal intensity between the compact and the unfolded MB dimer can be observed. However, the ratio where 50% of dimeric Aβ42 is unfolded appears in both cases to be at about 85 eV. C shows LILBID spectra for recombinant (i) and synthetic (ii) peptide incubated at 22°C for 200 min. Intensity differences of the oligomers between (i) and (ii) are on the level of reproducibility of the experiments.
Appendix 1—figure 14
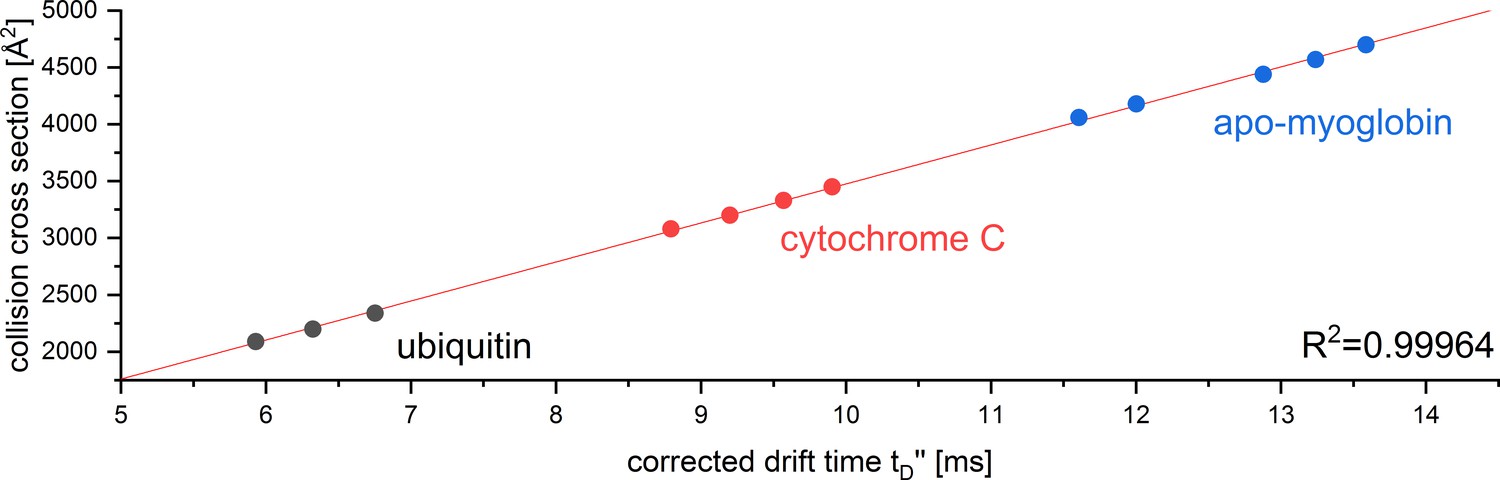
CCS calibration curve for the reference proteins used to determine the CCS of Aβ42 oligomers in positive ion mode.
The calibration was performed under denaturing conditions according to Ruotolo et al., 2008. The corrected drift time was plotted against the reference CCS obtained from Bush Lab CCS database.
Additional files
Download links
A two-part list of links to download the article, or parts of the article, in various formats.
Downloads (link to download the article as PDF)
Open citations (links to open the citations from this article in various online reference manager services)
Cite this article (links to download the citations from this article in formats compatible with various reference manager tools)
Structural rearrangement of amyloid-β upon inhibitor binding suppresses formation of Alzheimer’s disease related oligomers
eLife 9:e59306.
https://doi.org/10.7554/eLife.59306


