A novel checkpoint pathway controls actomyosin ring constriction trigger in fission yeast
- Instituto de Biología Funcional y Genómica, CSIC/Universidad de Salamanca and Departamento de Microbiología y Genética, Universidad de Salamanca, Spain
Figures
Figure 1 with 2 supplements
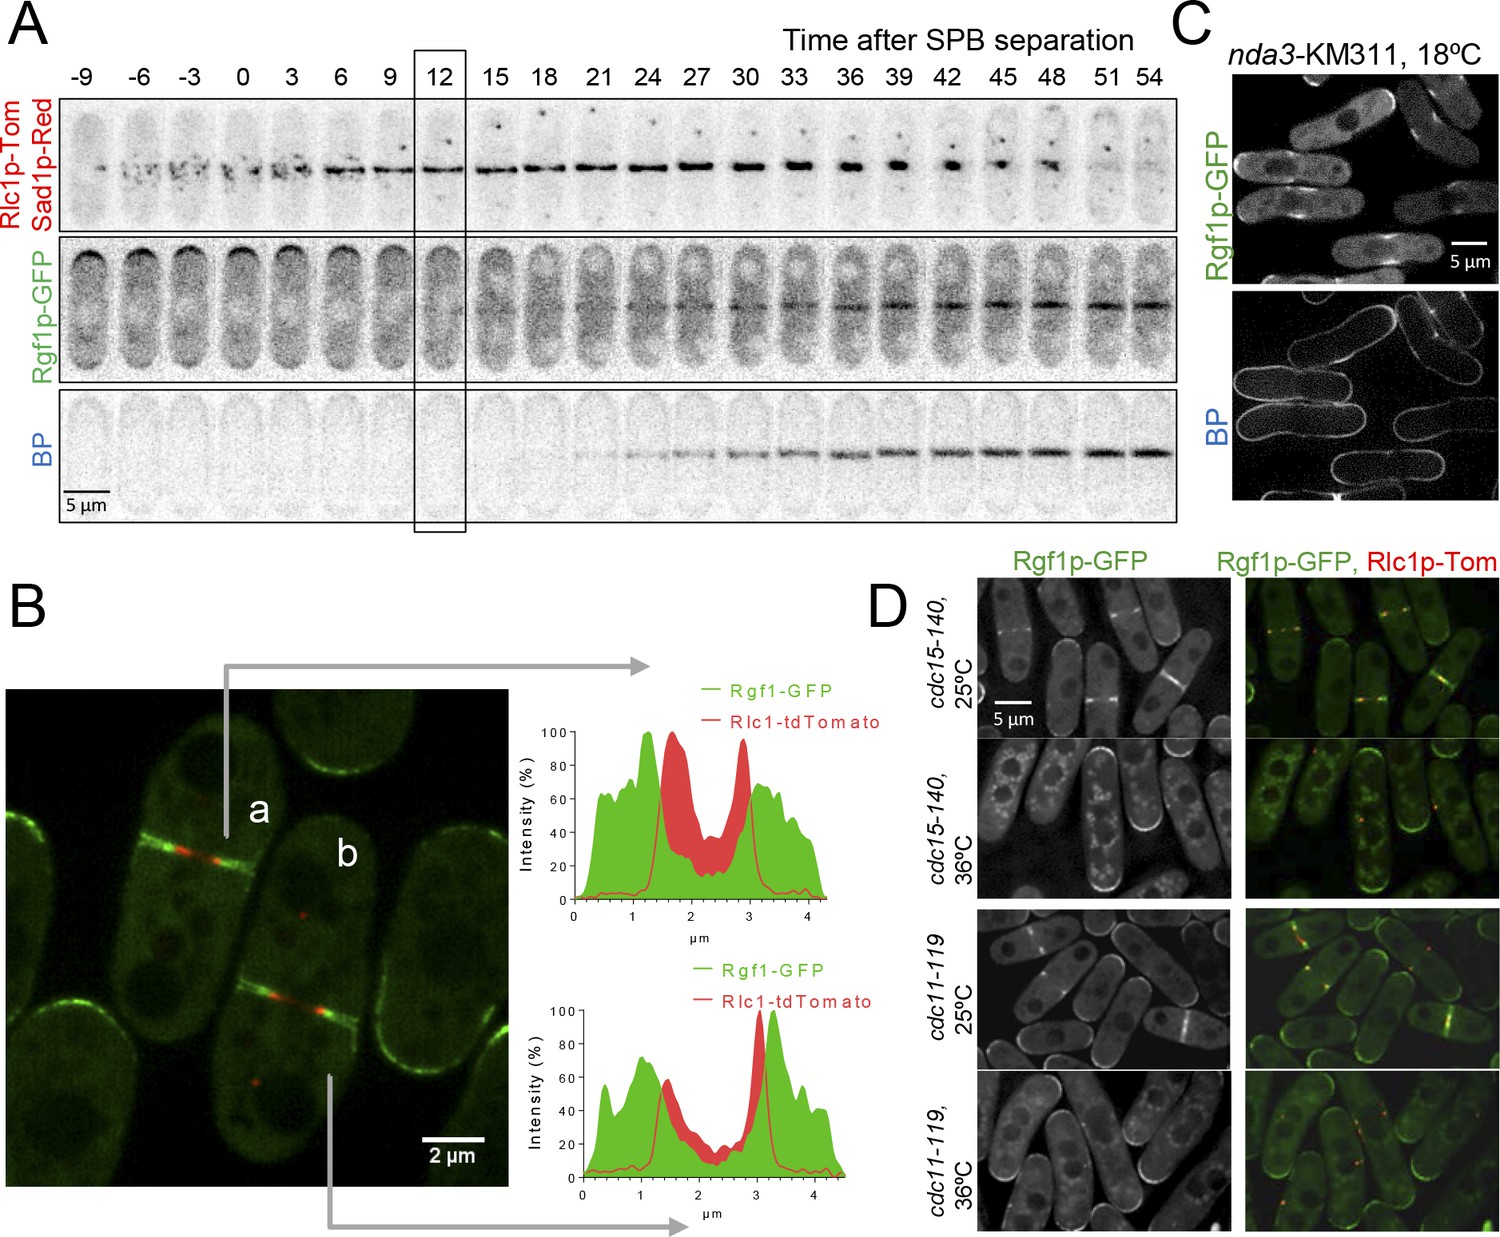
Rgf1p localizes to the contractile acto-myosin ring (AR) during cytokinesis.
(A) Time series of fluorescence micrographs (maximum intensity projections of seven sections, inverted grayscale) of a single cell expressing three fluorescent fusion proteins: Sad1p-DsRed to label SPBs; Rlc1p-tdTom to label the ring; and Rgf1p-GFP. Blankophor (BP) 5 µg/ml was used to mark the septum. (B) Maximum projection of super-resolution images of the same cells as above showing the merged image of the localization of the SPBs (red), Rgf1p (green), and Rlc1p (red). The profile of green and red fluorescence intensity on a line across the division site is shown for cells a, and b, on the right panels. Scale bar 2 μm. (C) Cell images of nda3-KM311 strain expressing Rgf1p-GFP incubated at 18°C for 8 hr before imaging. Cells were stained with BP right before imaging. (D) Maximum projection images of cdc15-140 and cdc11-119 cells expressing Rgf1p-GFP and Rlc1p-tdTom. Cells grown at 25°C were transferred 3 hr at 36°C and the images were taken before and after the shift.
Figure 1—figure supplement 1
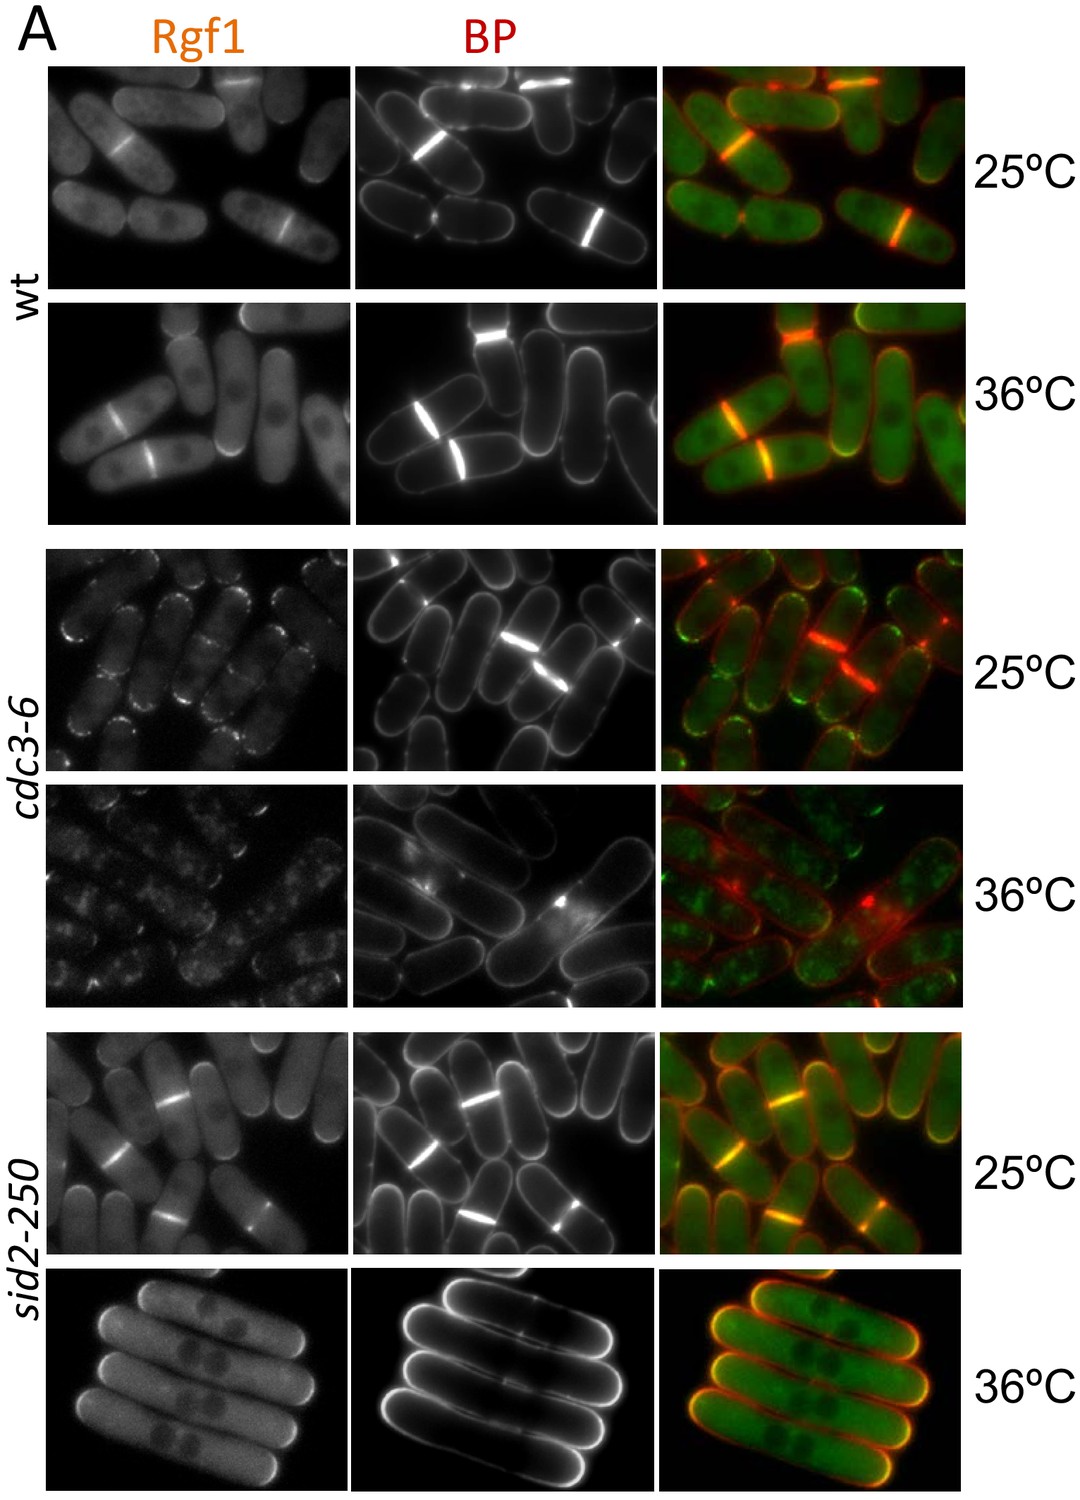
Rgf1p localization in CAR mutants.
Wild type, cdc3-6 and sid2-250 cells expressing Rgf1p-GFP endogenously were incubated at 25°C or 36°C for 4 hr, treated with Blankophor (BP) to visualize the septum and imaged for GFP and BP fluorescence.
Figure 1—figure supplement 2
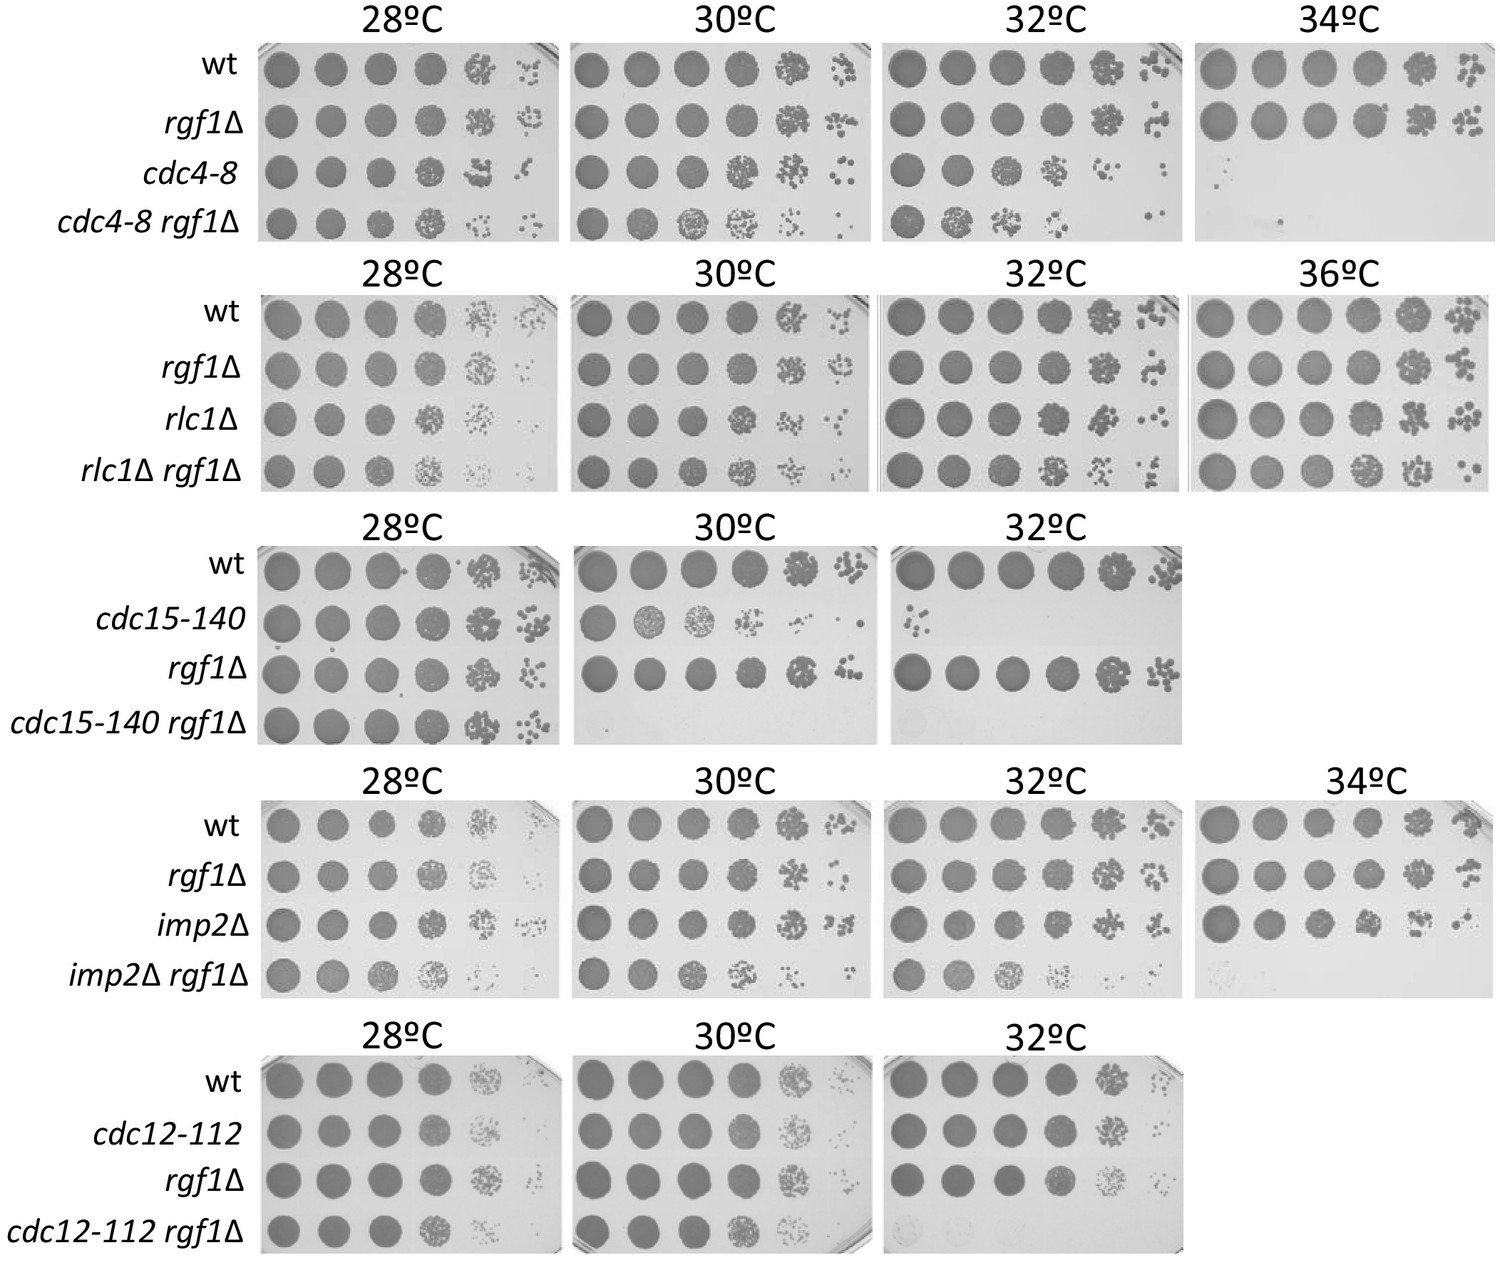
Genetic interactions between Rgf1 null mutants and CAR mutants.
Serial dilutions (1:5) of the indicated strains were spotted on rich YES plates and incubated at 28°C, 30°C, 32°C, 34°C, and 36°C. Colony formation was analyzed after 3 days.
Figure 2 with 2 supplements
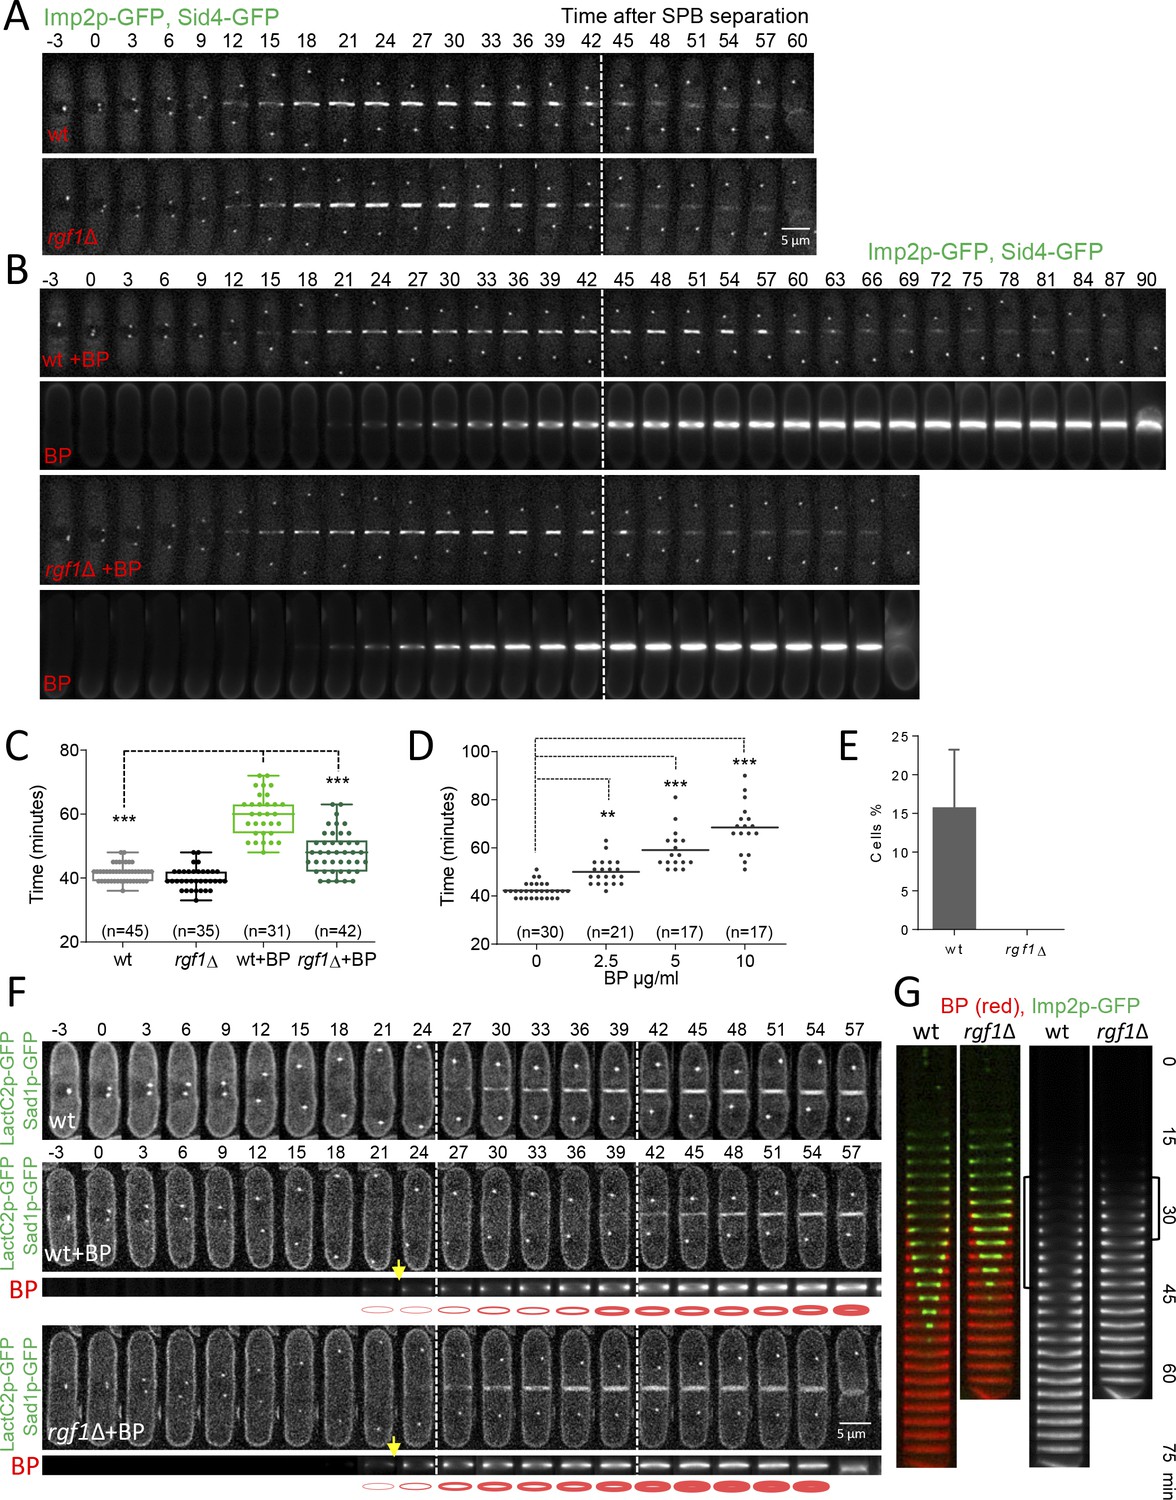
Blankophor (BP) prevents normal cytokinesis.
(A, B) Timing of cytokinesis from SPB separation to the end of actomyosin ring contraction. Time-lapse series of wild type and rgf1Δ cells expressing Imp2p-GFP (AR marker) and Sid4p-GFP (mitotic marker). Cells grown at 28°C were imaged w/o Blankophor (A) or with Blankophor (5 µg/ml) added just before the time-lapse analysis (B). Images shown are maximum-intensity projections of z stacks. (C) Quantification of (A and B) is shown. Boxes represents the IQR, whiskers are the Tukey’s range and the line inside the box is the median. Asterisks indicate the statistical significance of the difference between the two genotypes and the two conditions. Statistical significance was calculated by ANOVA followed by Šídák’s multiple comparisons test (n.s. p>0.05; ***p<0.0001). (D) Blankophor (BP) slows down cytokinesis. Cells grown at 28°C were imaged during a time–lapse experiment in the presence of different concentrations of BP. Quantification of the timing of cytokinesis in individual cells of each BP condition is shown. Statistics were performed as in C, comparing each condition with untreated wild type cells (n.s. p>0.05; **p<0.005; ***p<0.0001). (E) The percentage of wild type and rgf1Δ cells treated with 5 µg/ml of BP, where the ring contraction is completely blocked. The data plotted here is the averaged of three independent experiments, with >20 cells for each strain, and the error bars represent the SD of the mean. (F) PM behavior during cytokinesis in BP treated cells. Wild type and rgf1Δ expressing Sad1p-GFP (SPB marker) and LactC2–GFP (PM marker) were treated with BP and time-lapse-imaged every 3 min. (t = 0 indicates SPB separation) (lower panels). BP fluorescence images are shown in the lower panels. Wild-type cells w/o BP are shown in the upper panel. (G) Kymographs showing the progression of Imp2-GFP and septum ingression as in (A) in wild type and rgf1Δ cells treated with BP.
-
Figure 2—source data 1
Timing of cytokinesis in minutes from SPB separation to the end of actomyosin ring contraction.
- https://cdn.elifesciences.org/articles/59333/elife-59333-fig2-data1-v2.xlsx
Figure 2—figure supplement 1
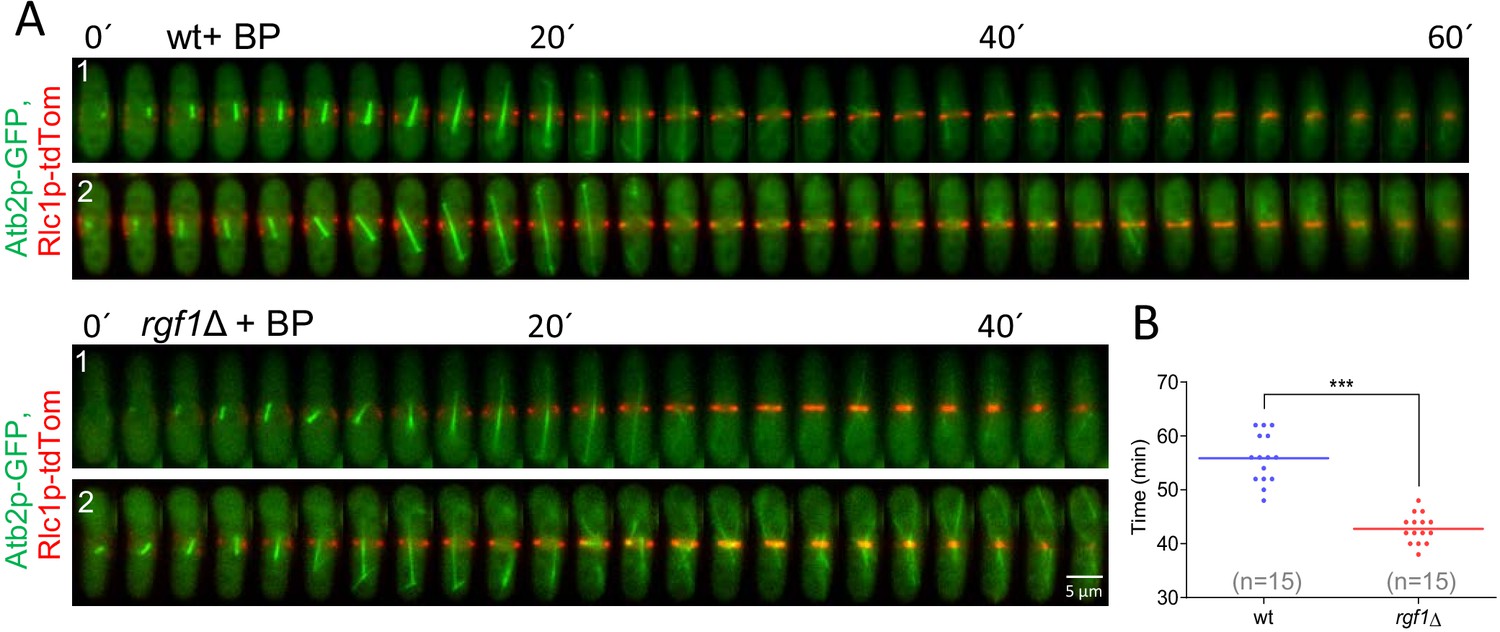
Timing of cytokinesis in wild type and rgf1Δ cells treated with BP.
(A) Time-lapse series of wild type and rgf1Δ cells expressing Rlc1p-tdTomato as a contractile ring marker and Atb2-GFP as a cell cycle stage marker. Cells grown at 28°C were imaged in the presence of Blankophor (5 µg/ml). (B) Quantitation of the timing of cytokinesis (from spindle formation until ring closure) in wild type (n = 15) and rgf1Δ (n = 15) individual cells shown in A.
-
Figure 2—figure supplement 1—source data 1
Timing of cytokinesis in minutes from spindle formation until ring closure.
- https://cdn.elifesciences.org/articles/59333/elife-59333-fig2-figsupp1-data1-v2.xlsx
Figure 2—figure supplement 2
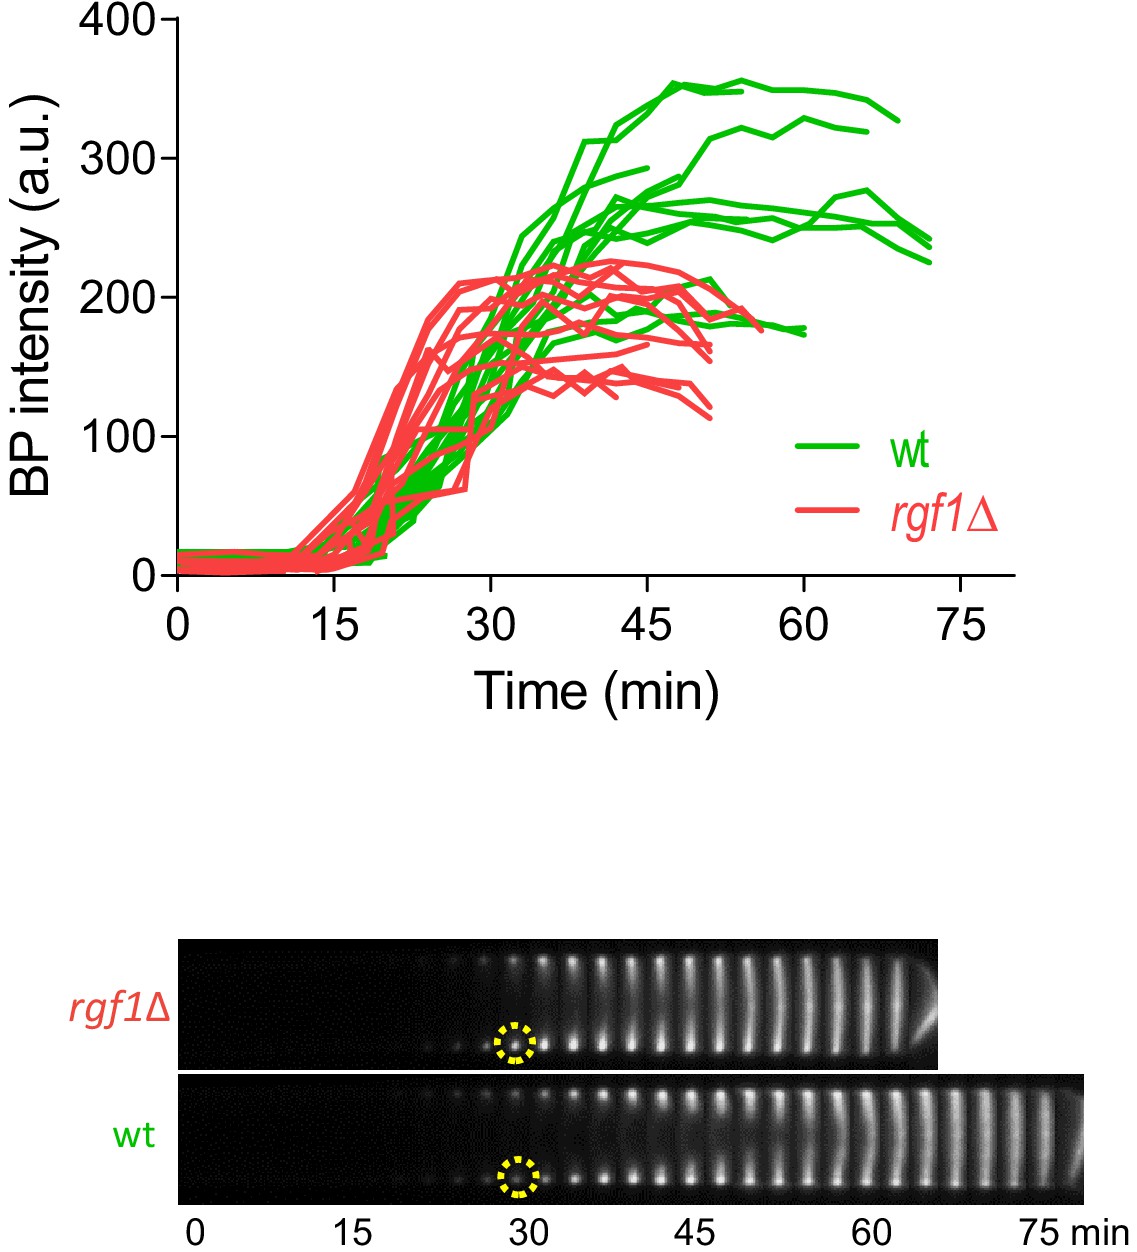
Septum synthesis is not halted after BP treatment.
Kymographs showing the progression of the septum of wild type and rgf1Δ cells treated with BP (5 µg/ml) and time-lapse-imaged every 3 min (t = 0 indicates SPB separation, not shown). The graph represents BP fluorescence intensity in the septum area over time and was measured as the average fluorescence within a circle of constant diameter in the border of the cell (dotted circle). Each line represents a single septum.
-
Figure 2—figure supplement 2—source data 1
BP fluorescence intensity in the septum border over time, with time 0 at SPB separation.
- https://cdn.elifesciences.org/articles/59333/elife-59333-fig2-figsupp2-data1-v2.xlsx
Figure 3 with 1 supplement
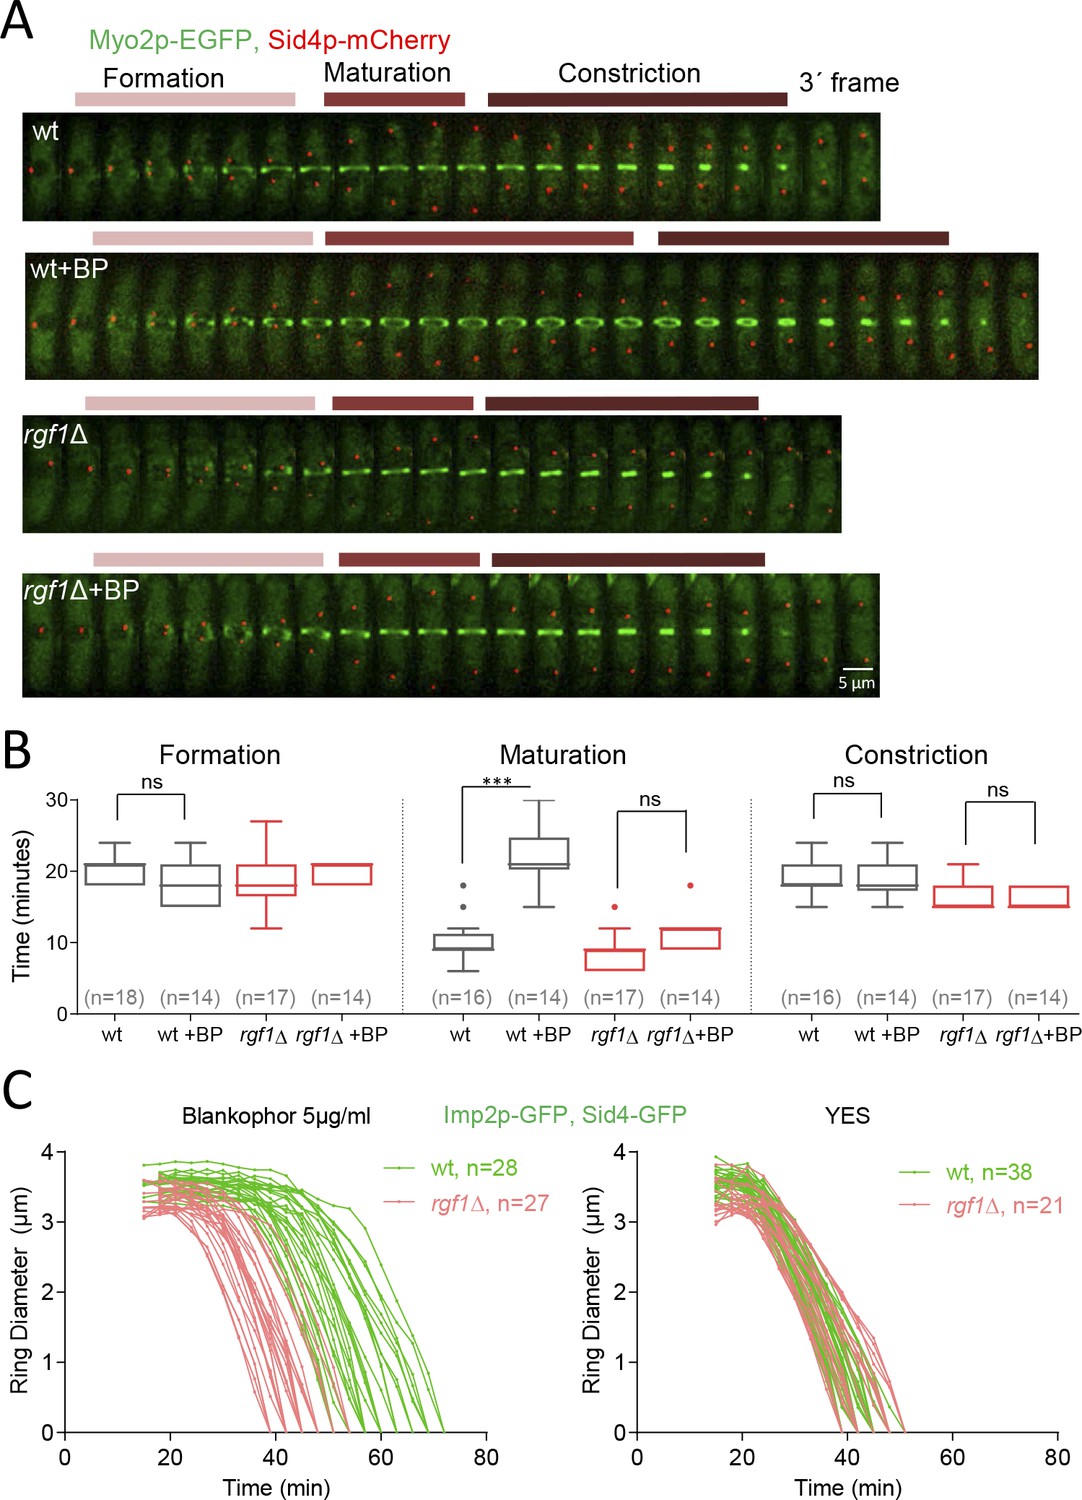
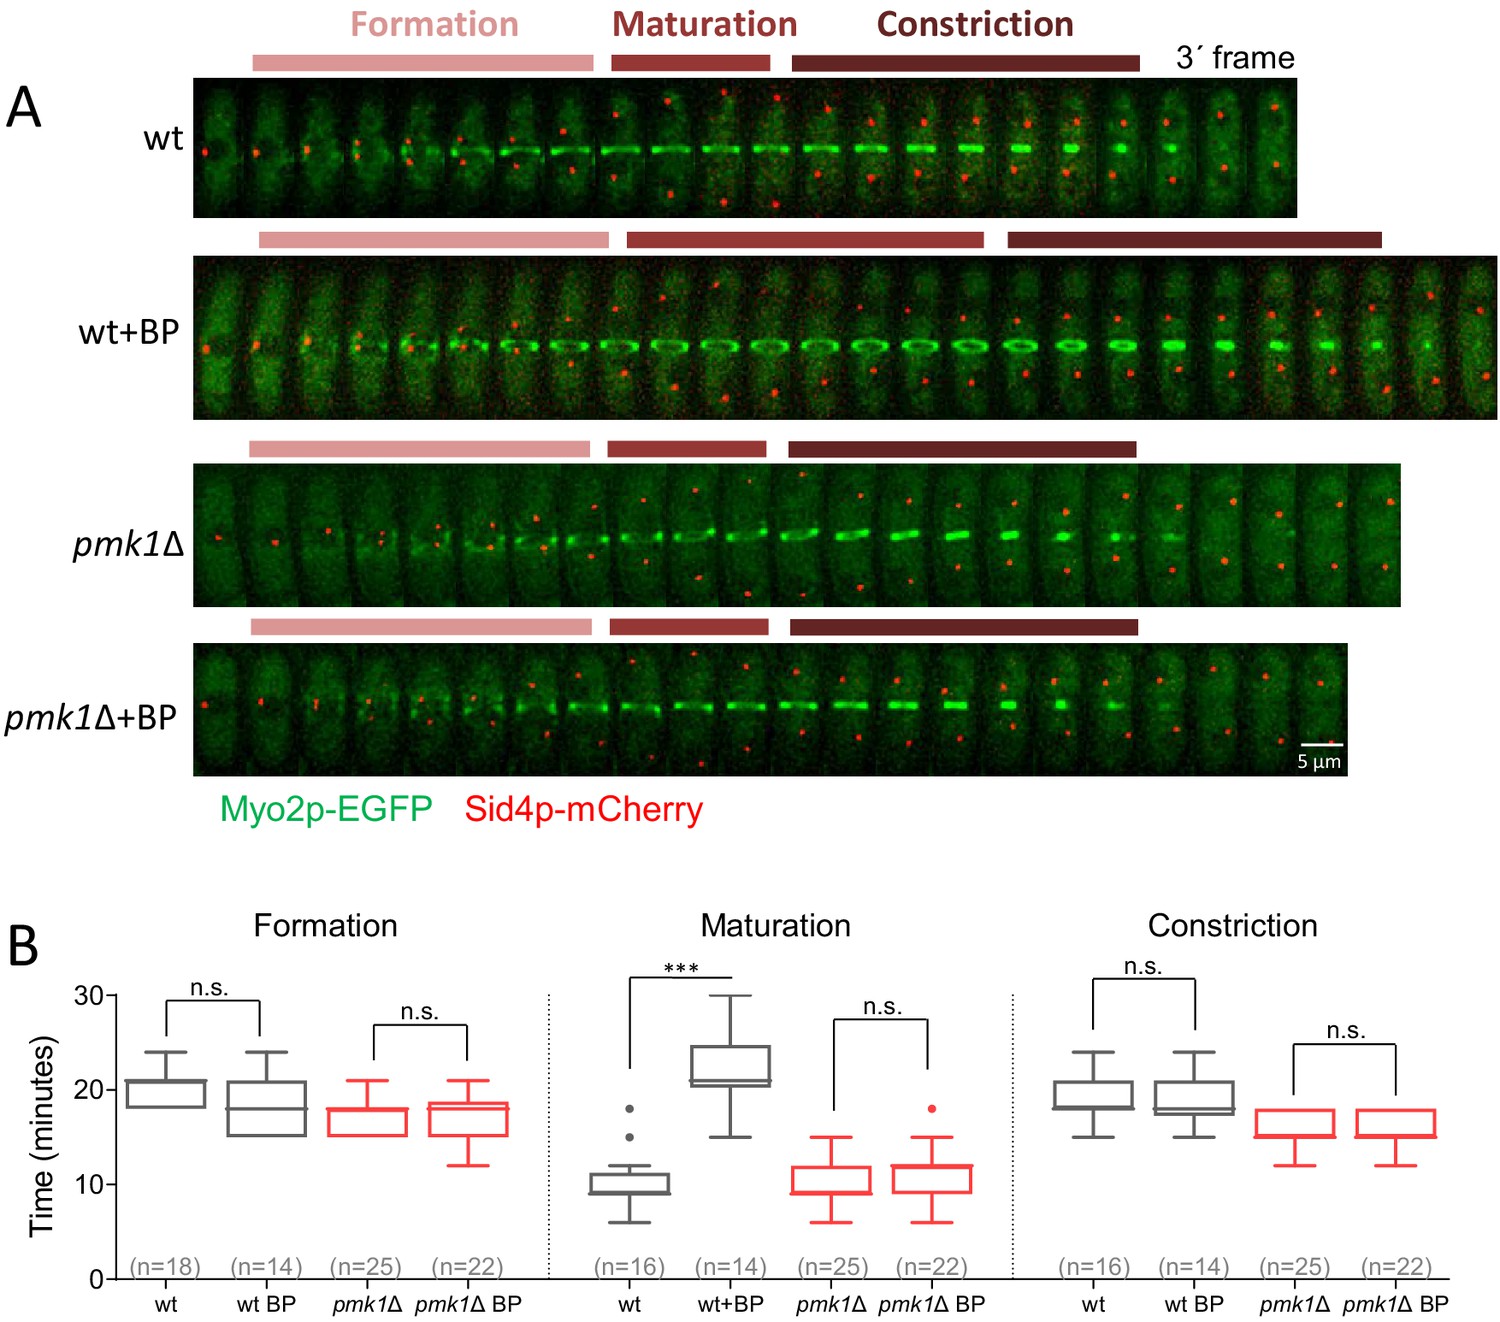
Rgf1p delays the onset of ring constriction in cell wall stressed cells.
(A) Time lapse series of wild type and rgf1Δ cells expressing Myo2p-EGFP (AR marker) and Sid4p-mCherry (SPB marker). Cells were grown at 28°C and BP (5 µg/ml) was added before imaging, indicated in the panel. The images shown are maximum-intensity projections of z stacks. Scale bars represent 3 mm. (B) The time taken for various steps in cytokinesis (coalescence of nodes into a ring, dwell time before contraction, and contraction). Quantification of (A) was shown. Asterisks indicate the statistical significance of the difference between the two conditions. Statistical significance was calculated by ANOVA followed by Šídák’s multiple comparisons test (n.s. p>0.05; ***p<0.0001). (C) Time course of the constriction of the CAR of wild type and rgf1Δ cells marked with Imp2p-GFP/Sad1p-GFP, in the presence (5 µg/ml) (right) or its absence (left) of BP, measured as the ring diameter over time, with time 0 min at SPB separation. The graphs show the diameters of each ring.
-
Figure 3—source data 1
Time in minutes taken for various steps in cytokinesis.
- https://cdn.elifesciences.org/articles/59333/elife-59333-fig3-data1-v2.xlsx
Figure 3—figure supplement 1
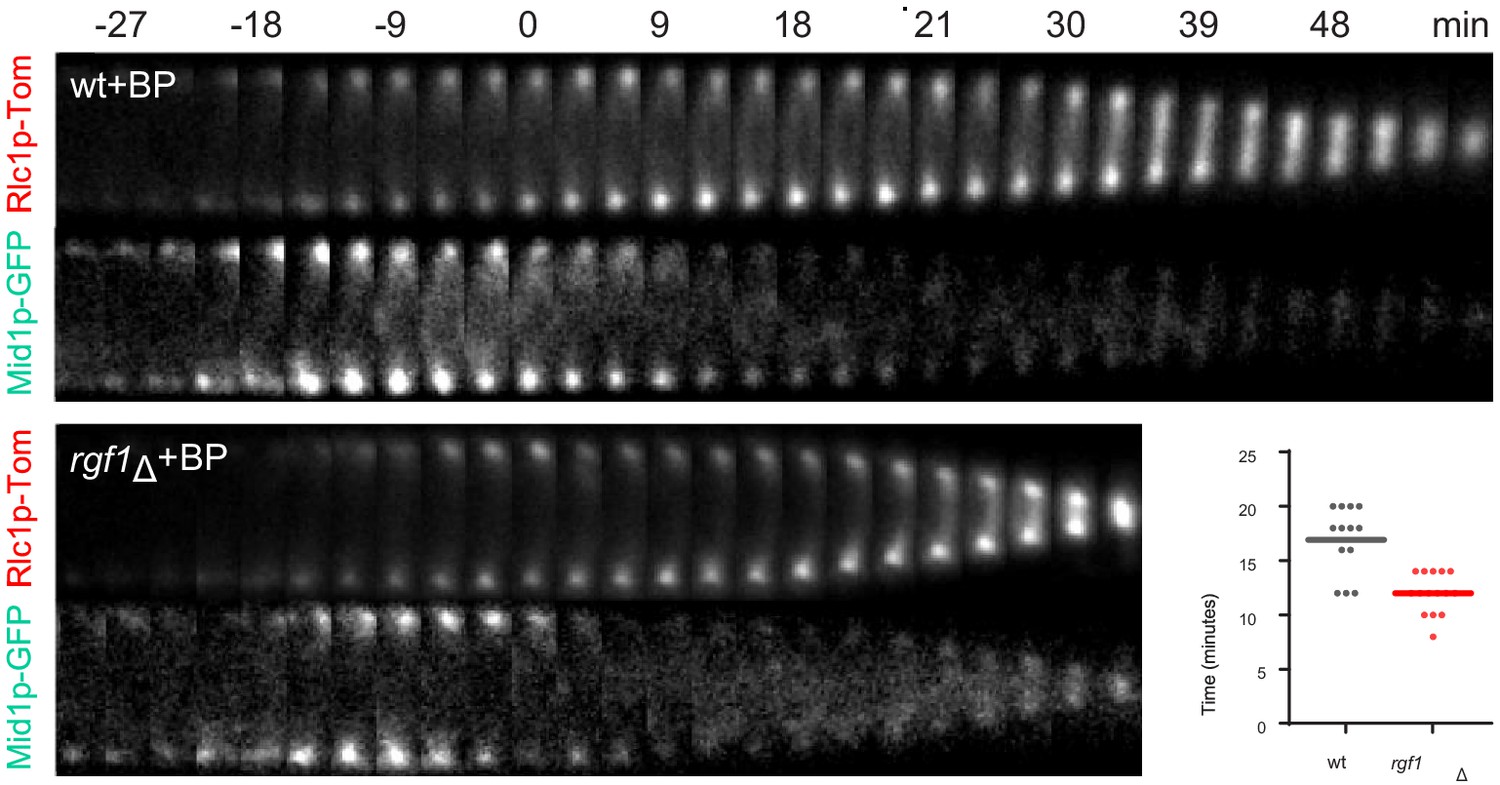
Mid1p-EGFP dissociated prematurely from the ring in rgf1Δ cells.
Kymographs of Rlc1p-tdTom and Mid1p-GFP in wild type and rgf1Δ cells treated with BP (5 µg/ml) and time-lapse-imaged every 3 min. (t = 0 indicates BP septum signal appearance, not shown). Quantitation of the timing of Mid1p-GFP disappearance from the ring (from BP septum signal) in wild type (n = 13) and rgf1Δ (n = 15) individual cells.
-
Figure 3—figure supplement 1—source data 1
Timing of Mid1-GFP disappearance from the ring .
- https://cdn.elifesciences.org/articles/59333/elife-59333-fig3-figsupp1-data1-v2.xlsx
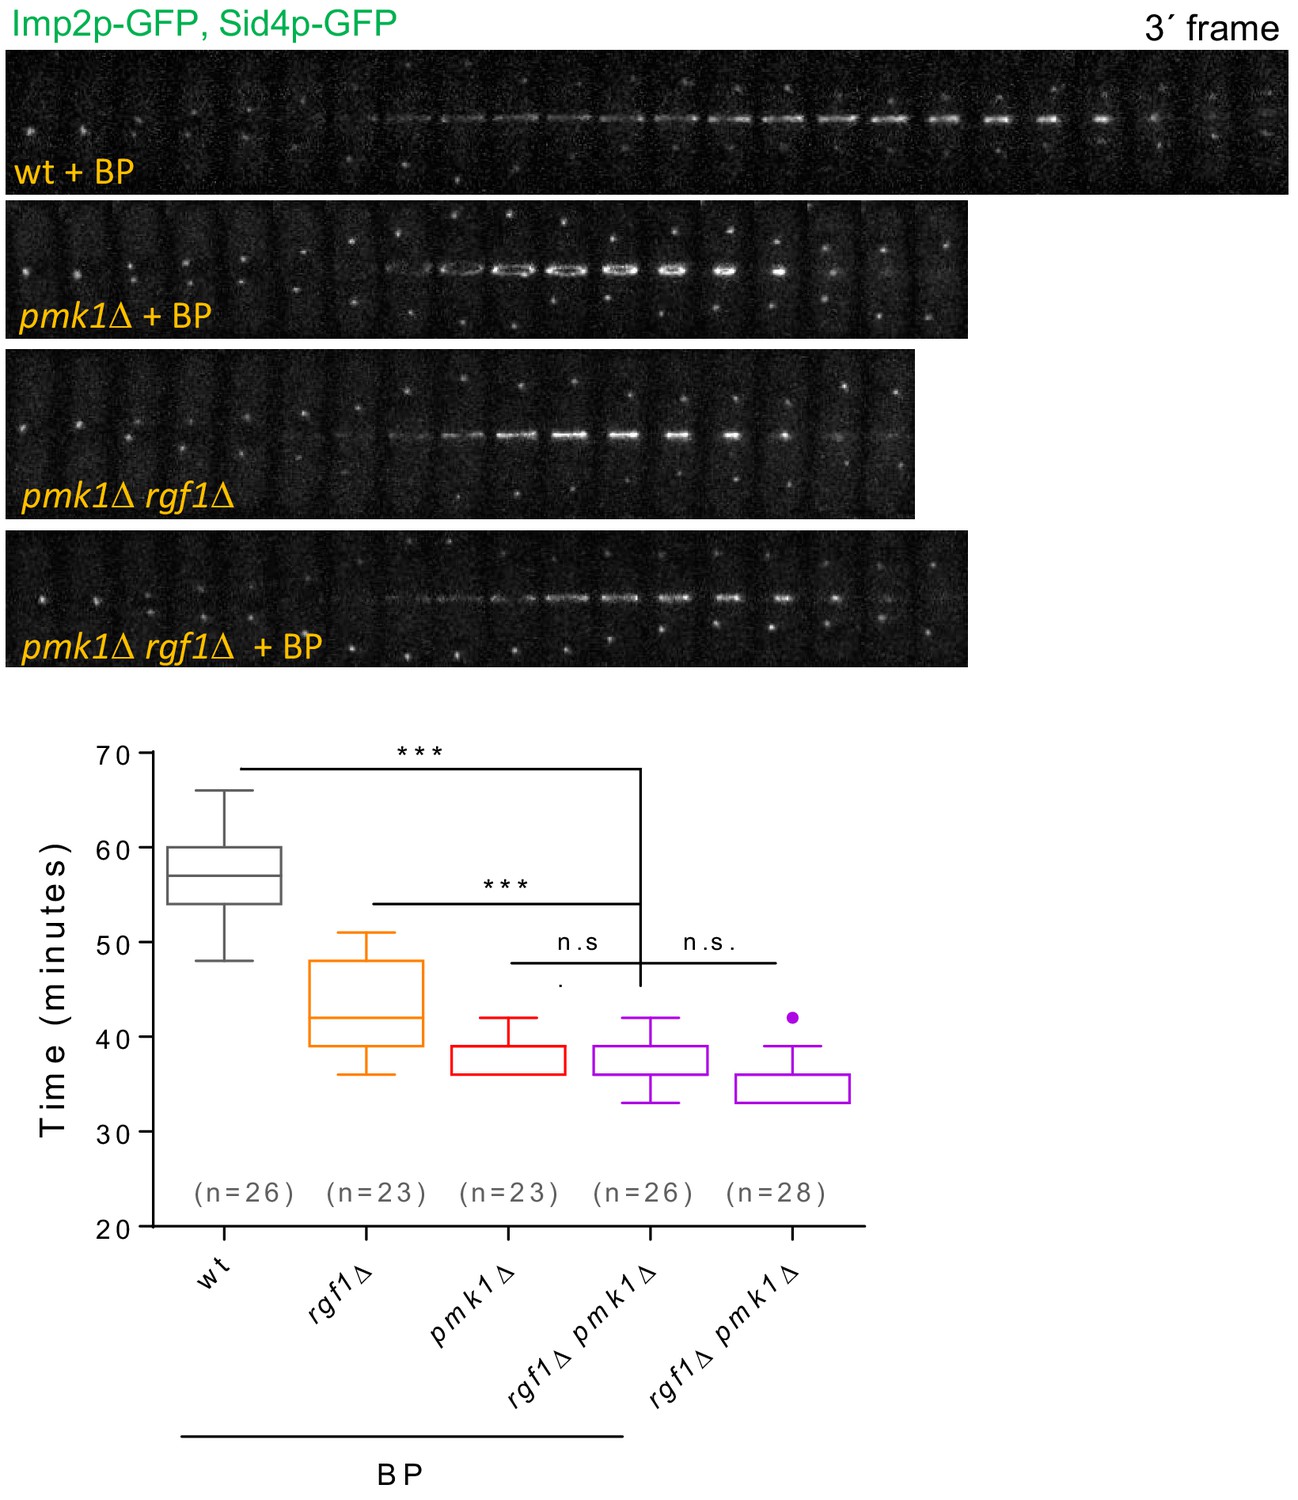
Figure 4 with 5 supplements
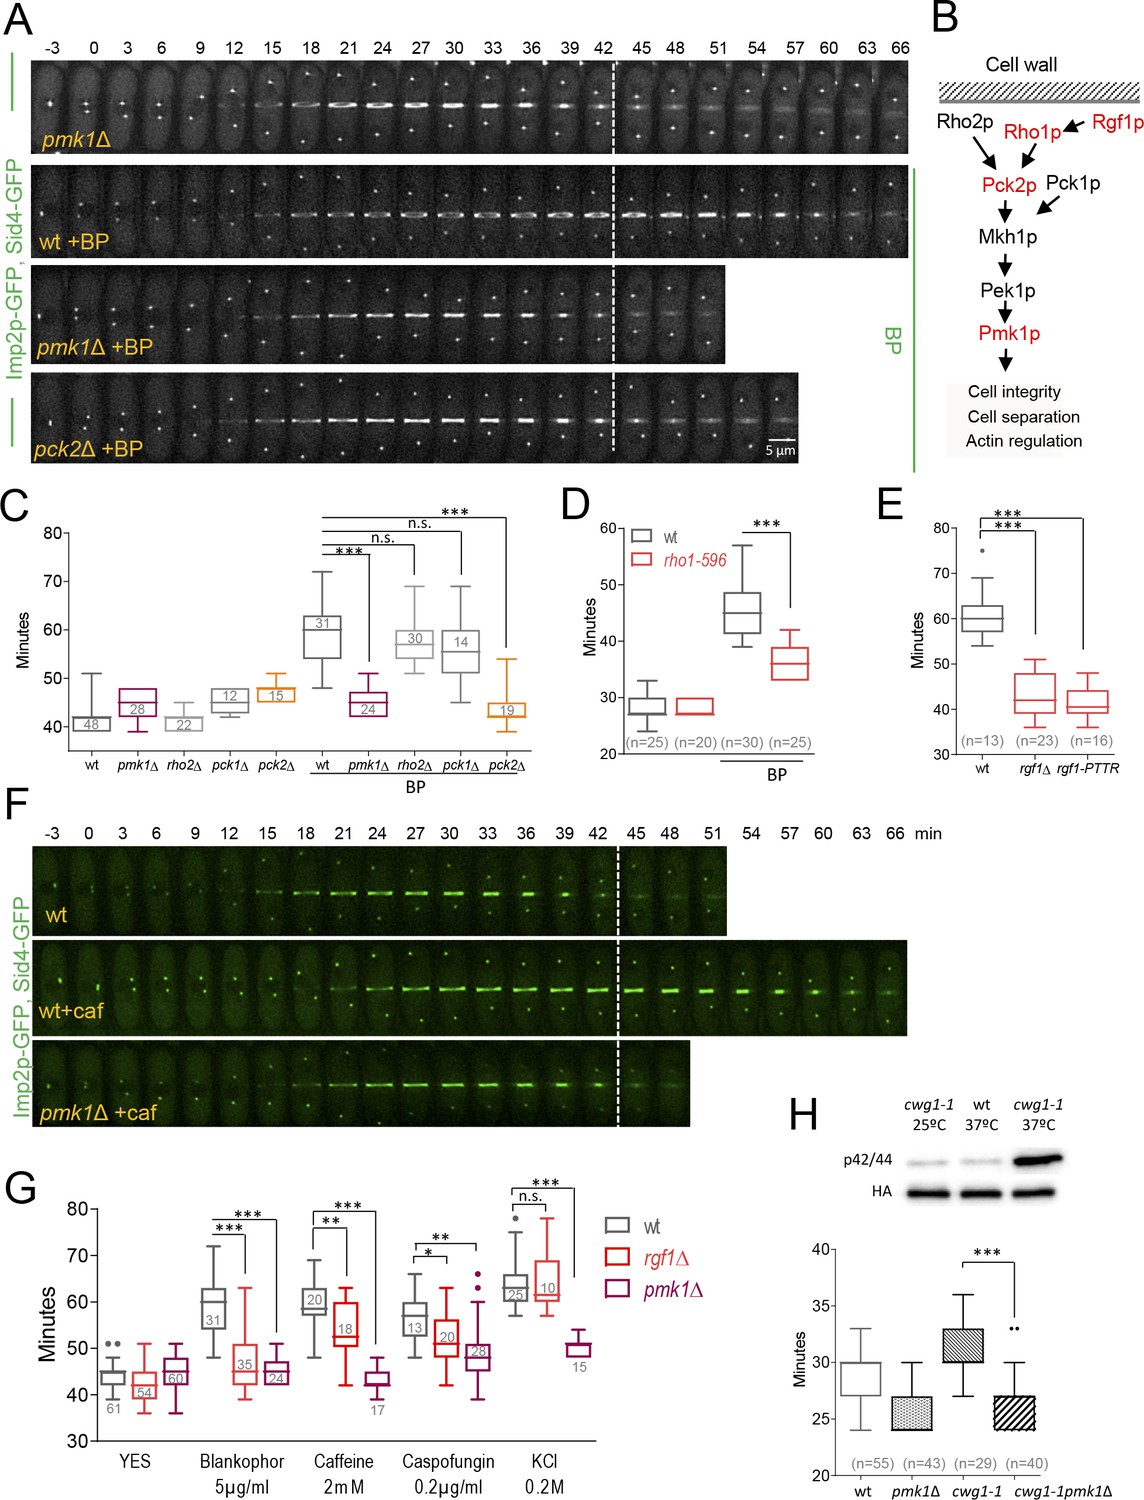
Cell wall stress-induced cytokinesis delay depends on Rho1p and on the cell integrity pathway (CIP).
(A) A time-lapse series of wild type, pmk1Δ and pck2Δ cells expressing Imp2p-GFP (AR marker) and Sid4p-GFP (mitotic marker). Cells were grown at 28°C, and BP (5 µg/ml) was added before imaging when indicated in the panel. The images shown are maximum-intensity projections of z stacks. (B) Scheme of the Pmk1p mitogen-activated protein kinase (MAPK) pathway (CIP). (C) Quantitation of the timing of cytokinesis (from SPB separation to the end of CAR contraction) in wild type, pmk1Δ, rho2Δ, pck1Δ and pck2Δ cells expressing Imp2p-GFP and Sid4p-GFP. Cells were grown at 28°C and a time-lapse analysis was carried out in the presence or the absence of BP (5 µg/ml) added before imaging. Asterisks indicate the statistical significance of the difference between the two conditions. Statistical significance was calculated by ANOVA followed by Šídák’s multiple comparisons test (n.s. p>0.05; ***p<0.0001). (D) Quantitation of the timing of cytokinesis in wild type and rho1-596 cells expressing Imp2p-GFP/Sid4p-GFP. Cells were grown at 25°C and shifted to 36°C 1 hr before time-lapse imaging at 36°C. BP (5 µg/ml) was added immediately before imaging. (t = 0 indicates SPB separation). Asterisks indicate the statistical significance of the difference between the two conditions. Statistical significance was calculated by Student’s t test (***p<0.0001). (E) Quantitation of the timing of cytokinesis in wild type, rgf1Δ, and rgf1-PTTR cells expressing Imp2p-GFP/Sid4p-GFP. Cells were grown at 28°C and a time-lapsed analysis was carried out in the presence of BP (5 µg/ml), added before imaging. Asterisks indicate the statistical significance of the difference between the two conditions. Statistical significance was calculated by ANOVA followed by Fisher’s LSD test (***p<0.0001). (F) Time-lapse series of wild type and pmk1Δ cells expressing Imp2p-GFP/Sid4p-GFP. Cells were grown at 28°C and caffeine (2 mM) was added before imaging when indicated. Images shown are maximum-intensity projections of z stacks. (G) Quantitation of the timing of cytokinesis in wild type, rgf1Δ, and pmk1Δ cells expressing Imp2p-GFP/Sid4p-GFP as in C, in the presence or the absence of BP (5 µg/ml), caffeine (2 mM), caspofungin (0.2 µg/ml), and KCl (0.2M) added before imaging. Statistical significance was calculated by ANOVA followed by Fisher’s LSD test (n.s. p>0.05; *p<0.05; **p<0.005; ***p<0.0001). (H) Upper panel, the wild-type strain and cwg1-1 mutant, both carrying a HA6H-tagged chromosomal version of pmk1+, were grown in YES medium at 25°C and shifted to 37°C for 3 hr. Activated and total Pmk1p were detected with anti-phospho p44/42 and anti-HA antibodies, respectively. Lower panel, quantitation of the timing of cytokinesis in wild type, pmk1Δ, cwg1-1 and cwg1-1pmk1Δ cells expressing Imp2p-GFP/Sid4p-GFP. Cells were grown at 25°C and shifted to 36°C 1.5 hr before time-lapse imaging at 36°C. Asterisks indicate the statistical significance of the difference between strains. Statistical significance was calculated by Student’s t test (****p<0.0001).
-
Figure 4—source data 1
Timing of cytokinesis in minutes from SPB separation to the end of actomyosin ring contraction.
- https://cdn.elifesciences.org/articles/59333/elife-59333-fig4-data1-v2.xlsx
Figure 4—figure supplement 1
Pmk1p delays the onset of ring constriction in cells treated with BP.
(A) Time lapse series of wild type and pck1Δ cells expressing Myo2p-EGFP and Sid4p-mCherry. Cells were grown at 28°C and BP (5 µg/ml) was added before imaging when indicated in the panel. Images shown are maximum-intensity projections of z stacks. (B) The time taken for various steps in cytokinesis (coalescence of nodes into a ring, dwell time before contraction and contraction). Quantification of (A) is shown. Boxes represents the IQR, whiskers are the Tukey’s range and the line inside the box is the median. Asterisks indicate the statistical significance of the difference between the two conditions. Statistical significance was calculated by ANOVA followed by Šídák’s multiple comparisons test (n.s. p>0.05; ***p<0.0001).
-
Figure 4—figure supplement 1—source data 1
Time in minutes taken for various steps in cytokinesis.
- https://cdn.elifesciences.org/articles/59333/elife-59333-fig4-figsupp1-data1-v2.xlsx
Figure 4—figure supplement 2
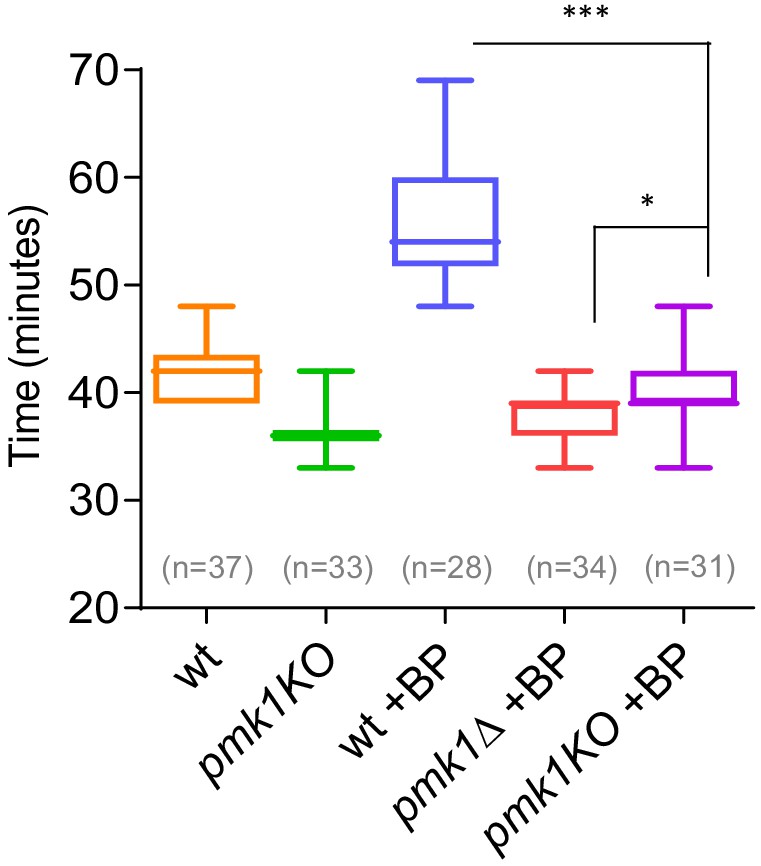
Timing of cytokinesis in pmk1-KO cells treated with BP.
Quantitation of the timing of cytokinesis in wild type, pmk1Δ and pmk1-KO cells expressing Imp2p-GFP/Sid4p-GFP. Cells were grown at 28°C and a time-lapse was carried out with or w/o BP (5 µg/ml), added before imaging. Statistical significance was calculated by ANOVA followed by Šídák’s multiple comparisons test (n.s. p>0.05; *p<0.05; ***p<0.0001).
-
Figure 4—figure supplement 2—source data 1
Timing of cytokinesis in minutes from SPB separation to the end of actomyosin ring contraction.
- https://cdn.elifesciences.org/articles/59333/elife-59333-fig4-figsupp2-data1-v2.xlsx
Figure 4—figure supplement 3
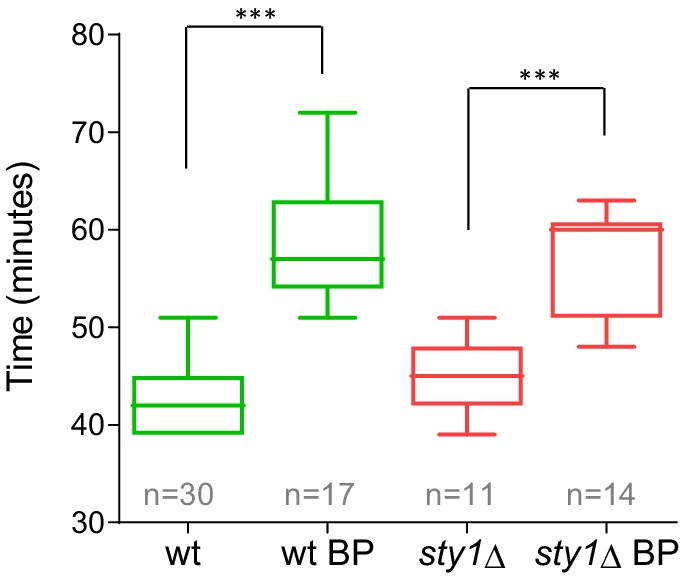
Timing of cytokinesis in sty1Δ cells treated with BP.
Quantitation of the timing of cytokinesis (from SPB separation to the end of AR contraction) in sty1Δ and wild-type cells expressing Imp2p-GFP (CAR marker) and Sid4p-GFP (mitotic marker). Cells were grown at 28°C and a time lapse was done in the presence or the absence of BP (5 µg/ml) added before imaging. Asterisks indicate the statistical significance of the difference between the two conditions. Statistical significance was calculated by ANOVA followed by Fisher’s LSD test (***p<0.0001).
-
Figure 4—figure supplement 3—source data 1
Timing of cytokinesis in minutes from SPB separation to the end of actomyosin ring contraction.
- https://cdn.elifesciences.org/articles/59333/elife-59333-fig4-figsupp3-data1-v2.xlsx
Figure 4—figure supplement 4
Timing of cytokinesis in rgf1Δ pmk1Δ cells treated with BP.
Time-lapse representative series and quantitation of the timing of cytokinesis (from SPB separation to the end of CAR contraction) in wild type, rgf1Δ, pmk1Δ and rgf1Δ pmk1Δ cells expressing Imp2p-GFP and Sid4p-GFP. Cells were grown at 28°C and a time-lapse analysis was carried out in the presence or the absence of BP (5 µg/ml) when indicated. Asterisks indicate the statistical significance of the difference between the two conditions. Statistical significance was calculated by ANOVA followed by Šídák’s multiple comparisons test (n.s. p>0.05; ***p<0.0001).
-
Figure 4—figure supplement 4—source data 1
Timing of cytokinesis in minutes from SPB separation to the end of actomyosin ring contraction.
- https://cdn.elifesciences.org/articles/59333/elife-59333-fig4-figsupp4-data1-v2.xlsx
Figure 4—figure supplement 5
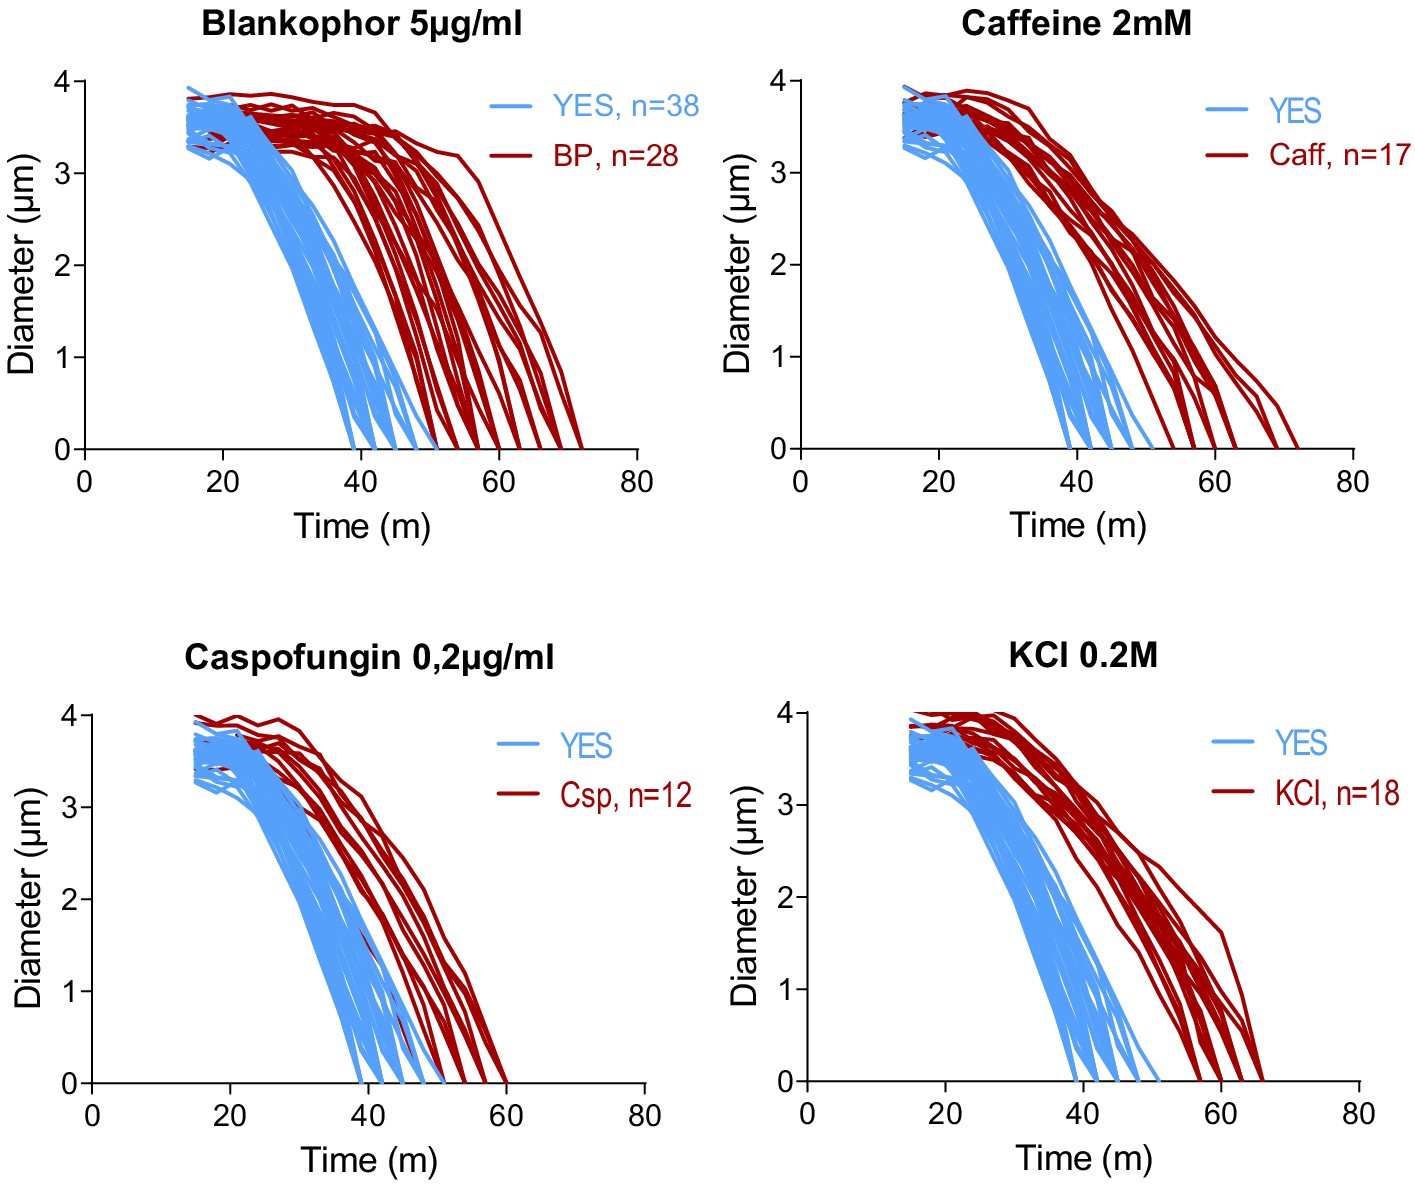
Contractile ring constriction in wild-type cells treated with BP, caffeine, caspofungin, and KCl.
Time course of the constriction of the contractile ring of wild-type cells expressing Imp2p-GFP/Sad1p-GFP, in the presence of the stress indicated (red) or without stress (blue), measured as the ring diameter. (t = 0 was SPB separation).
-
Figure 4—figure supplement 5—source data 1
Ring diameter in µm over time, with time 0 min at SPB separation.
- https://cdn.elifesciences.org/articles/59333/elife-59333-fig4-figsupp5-data1-v2.xlsx
Figure 5
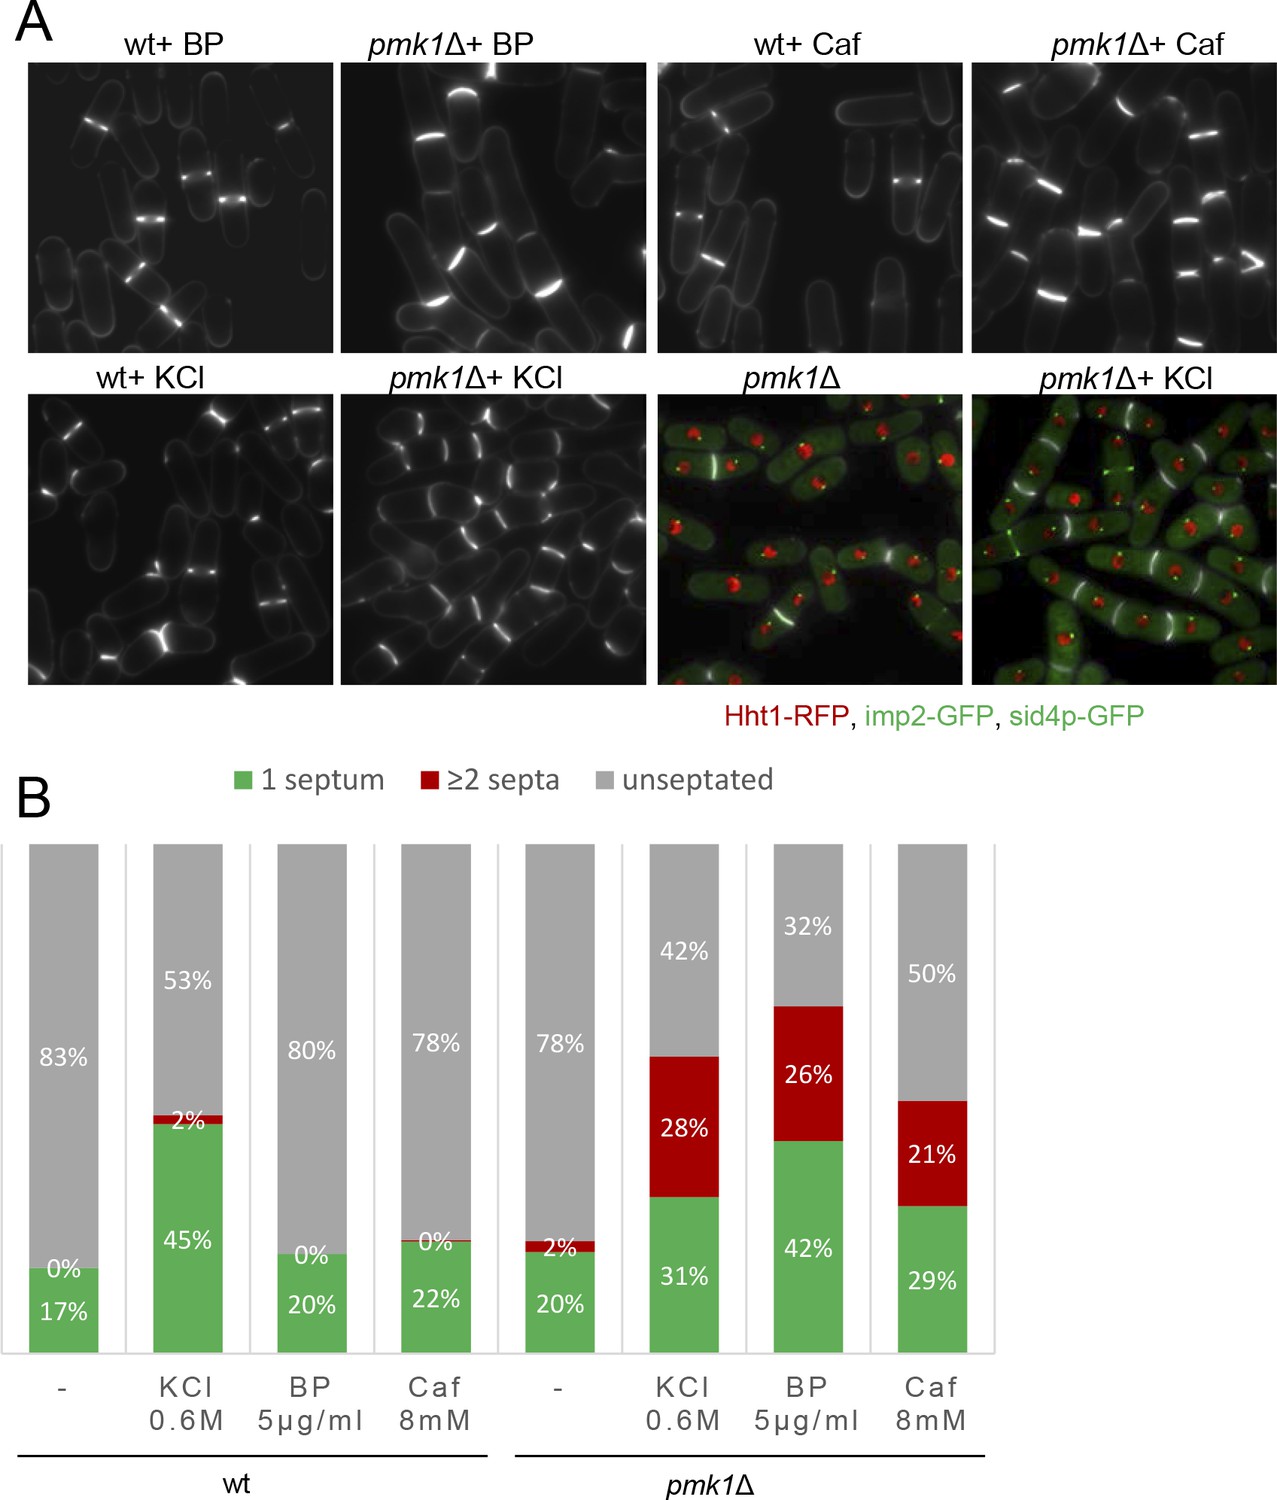
Mild cell wall stress conditions induce cell separation defects in pmk1Δ cells.
(A) Asynchronous cultures of exponentially growing wild type and pmk1Δ cells were treated for 16 hr with KCl (0.6M), BP (5 µg/m) and caffeine (8 mM) at 31°C and then stained with BP to visualize the septum. In the lower panels, the septa, the nucleus, the SPBs and the AR were visualized in wild type and pmk1Δ cells expressing Hht1p-RFP (histone H3, h3.1), Imp2-GFP (AR marker) and Sid4p-GFP (SPB marker) and stained with BP right before imaging, before or after KCl treatment. (B) Quantification of A is shown. The number of cells with one septum, ≥2 septa and unseptated cells was quantitated in live cells with or w/o treatment as indicated. Two hundred cells of each strain and condition were analyzed.
Figure 6 with 3 supplements
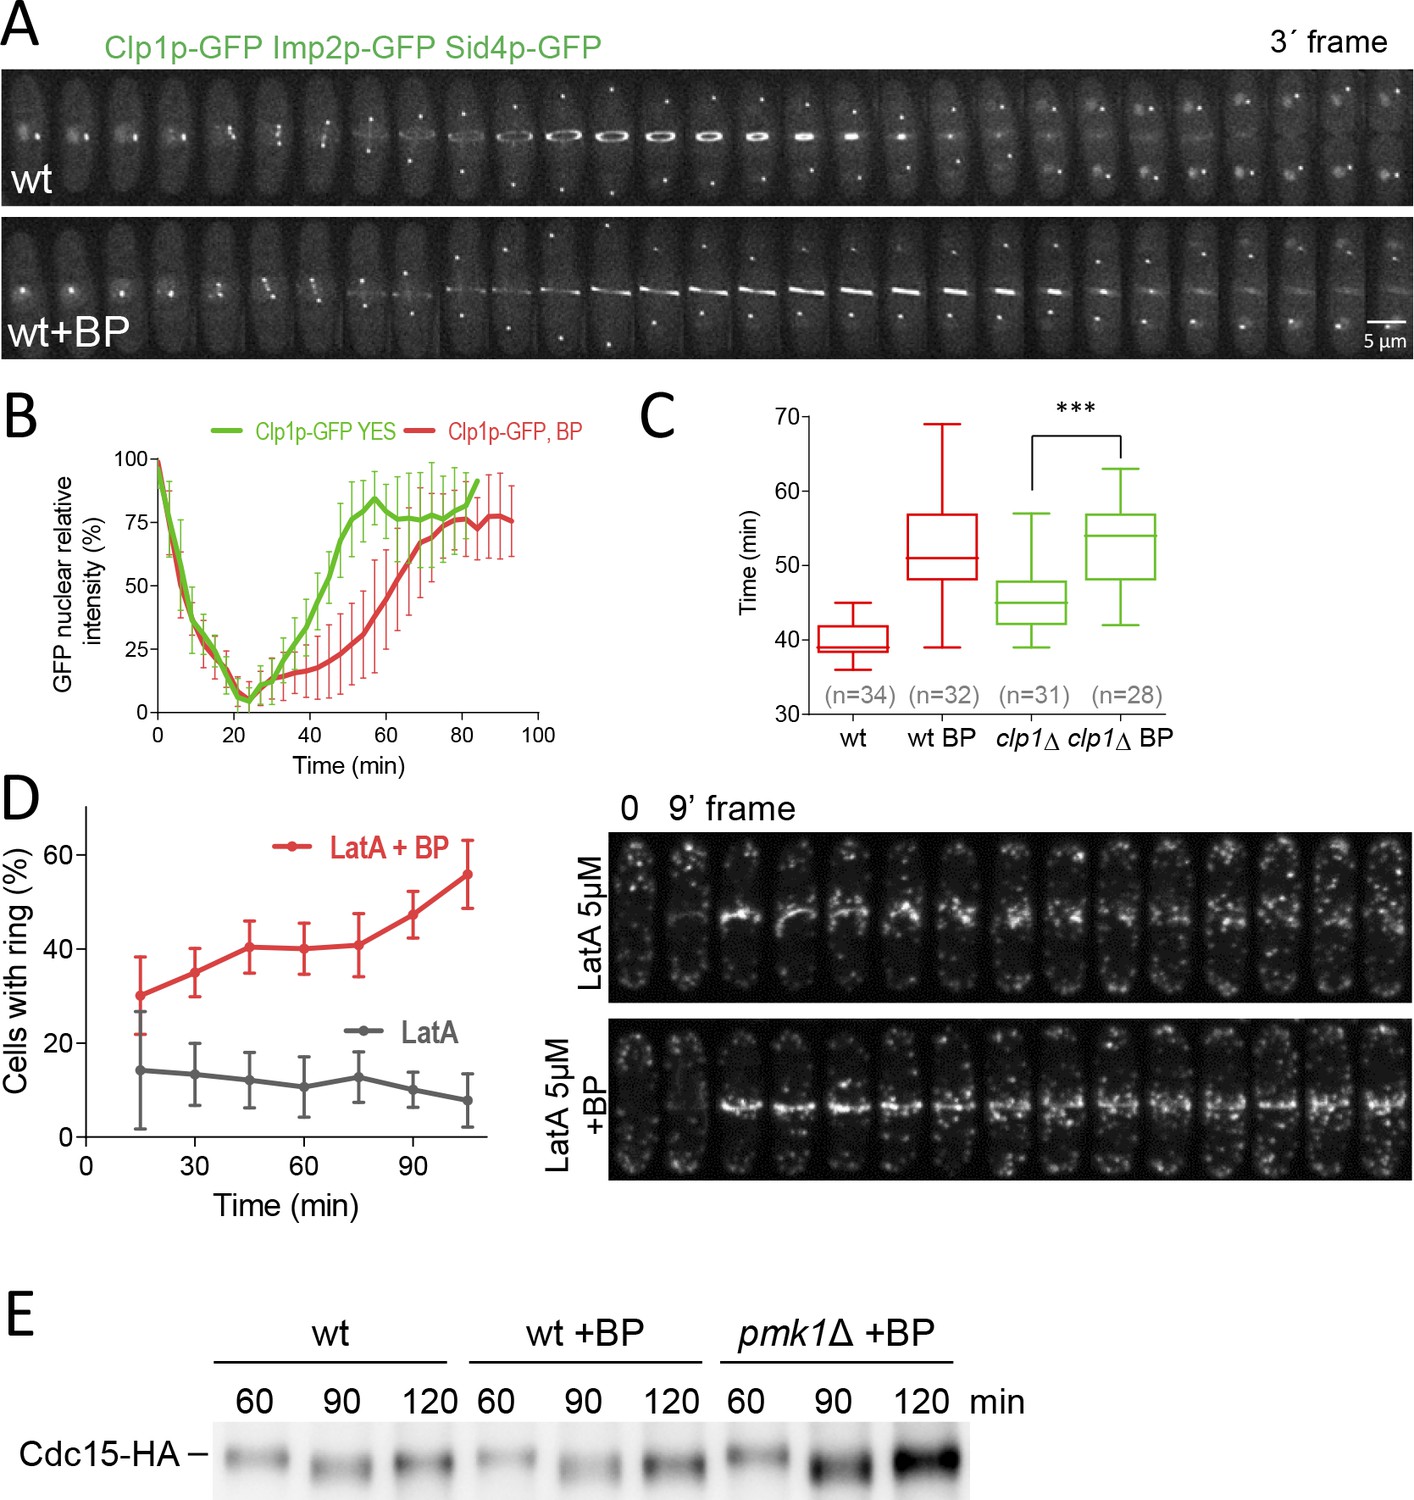
Dynamics of Clp1p-GFP and actin after cell wall stress.
(A) Time-lapse images of Clp1-GFP cells expressing Imp2p-GFP and Sid4p-GFP were collected every 3 min using a DeltaVision microscope microscope. At each time point and position, seven slices were captured with a step size of 0.6 µm. Relative nuclear intensity of GFP over time, starting at SPB separation, is shown in B. (C) Quantitation of the timing of cytokinesis in wild type and clp1Δ cells expressing Imp2p-GFP/Sid4p-GFP. Cells were grown at 28°C and a time-lapse was carried out with or w/o BP (5 µg/ml), added before imaging. Statistical significance was calculated by ANOVA followed by Fisher’s LSD test (***p<0.0001) (D) Wild-type cells expressing Life-act-GFP (Huang et al., 2012) grown to log phase at 28°C were treated with a low dose of LatA (5 µM) or with LatA (5 µM) and BP (10 µg/ml) and imaged during a time-lapse (left). The graph shows the percentage of cells with actomyosin rings. Note that in the cells treated with BP the LA-GFP rings are maintained for a prolonged period of time. (E) Protein extracts from Cdc15-HA synchronous cultures, treated or not with BP (1 mg/ml). Early-log phase cells were synchronized by adding HU (12.5 mM) for 4 hr, and then released to fresh medium with or w/o BP. At the indicated times after release, samples were analyzed by western blot using anti-HA antibodies.
-
Figure 6—source data 1
Relative nuclear intensity of GFP over time, starting at SPB separation.
- https://cdn.elifesciences.org/articles/59333/elife-59333-fig6-data1-v2.xlsx
Figure 6—figure supplement 1

Timing of cytokinesis in myp2Δ, rlc1Δ, and adf1-1 mutant cells.
Quantitation of the timing of cytokinesis in wild-type and mutant cells expressing Imp2p-GFP and Sid4p-GFP were grown and a time-lapse was done under the conditions established for each mutant. myp2Δ and rlc1Δ cells were grown at 28°C and a time-lapse was done in the presence or absence of BP (5 µg/ml). adf1-1 cells were grown at 25°C and shifted to 31°C 1 hr before time-lapse imaging in the presence or absence of BP (5 µg/ml). Asterisks indicate the statistical significance of the difference between strains. Statistical significance was calculated by ANOVA followed by Šídák’s multiple comparisons test (n.s. p>0.05; **p<0.005; ***p<0.0001).
-
Figure 6—figure supplement 1—source data 1
Timing of cytokinesis in minutes from SPB separation to the end of actomyosin ring contraction @31ºC.
- https://cdn.elifesciences.org/articles/59333/elife-59333-fig6-figsupp1-data1-v2.xlsx
Figure 6—figure supplement 2
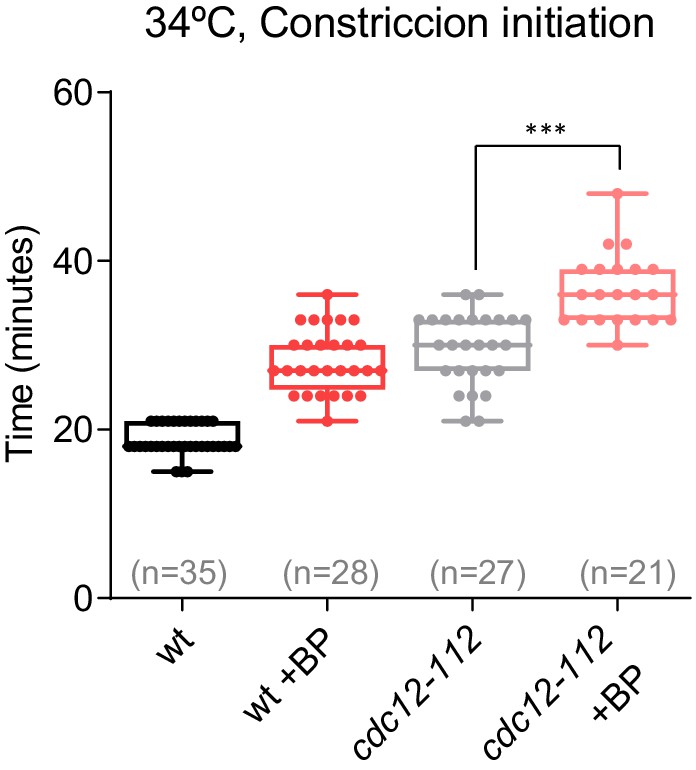
Constriction initiation in cdc12-112 cells.
Time taken for the initiation of constriction in wild-type and cdc12-112 cells grown at 28°C and shifted to 34°C 1 hr before time-lapse imaging in the presence or absence of BP (t = 0 is SPB separation). Asterisks indicate the statistical significance of the difference between strains. Statistical significance was calculated by ANOVA followed by Šídák’s multiple comparisons test (n.s. p>0.05; **p<0.005; ***p<0.0001).
-
Figure 6—figure supplement 2—source data 1
Time in minutes from SPB separation to the initiation of ring constriction @34ºC.
- https://cdn.elifesciences.org/articles/59333/elife-59333-fig6-figsupp2-data1-v2.xlsx
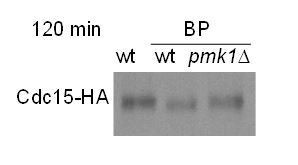
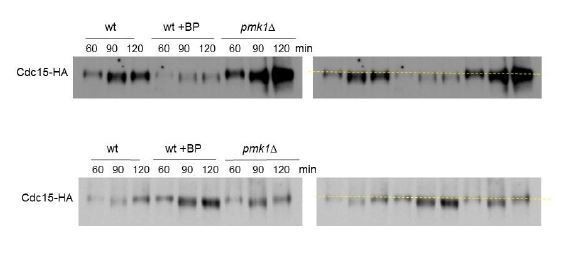
Figure 6—figure supplement 3
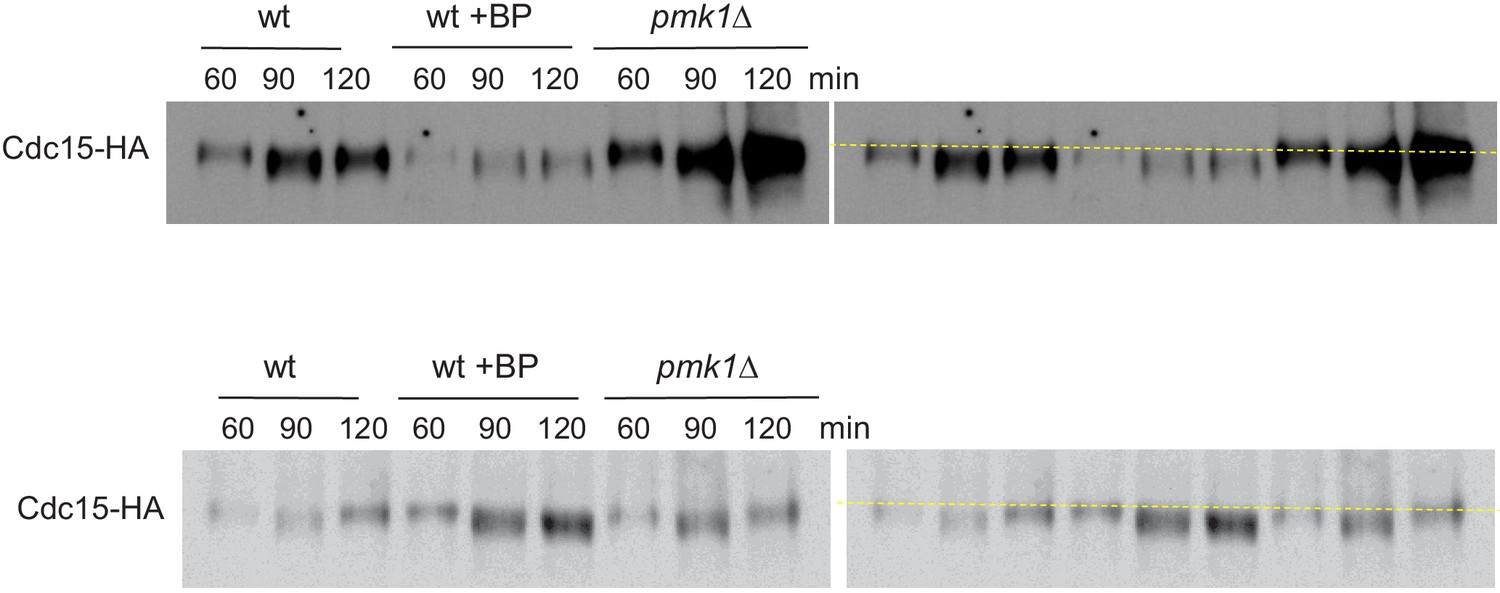
Cdc15p mobility shift in cells treated with BP.
Protein extracts from Cdc15-HA synchronous cultures, treated or not with BP (1 mg/ml). Early-log phase cells were synchronized by adding HU (12.5 mM) for 4 hr, and then released to fresh medium with or w/o BP. At the indicated times after release, samples were analyzed by western blot using anti-HA antibodies. Each western represents a different experiment.
Figure 7 with 1 supplement
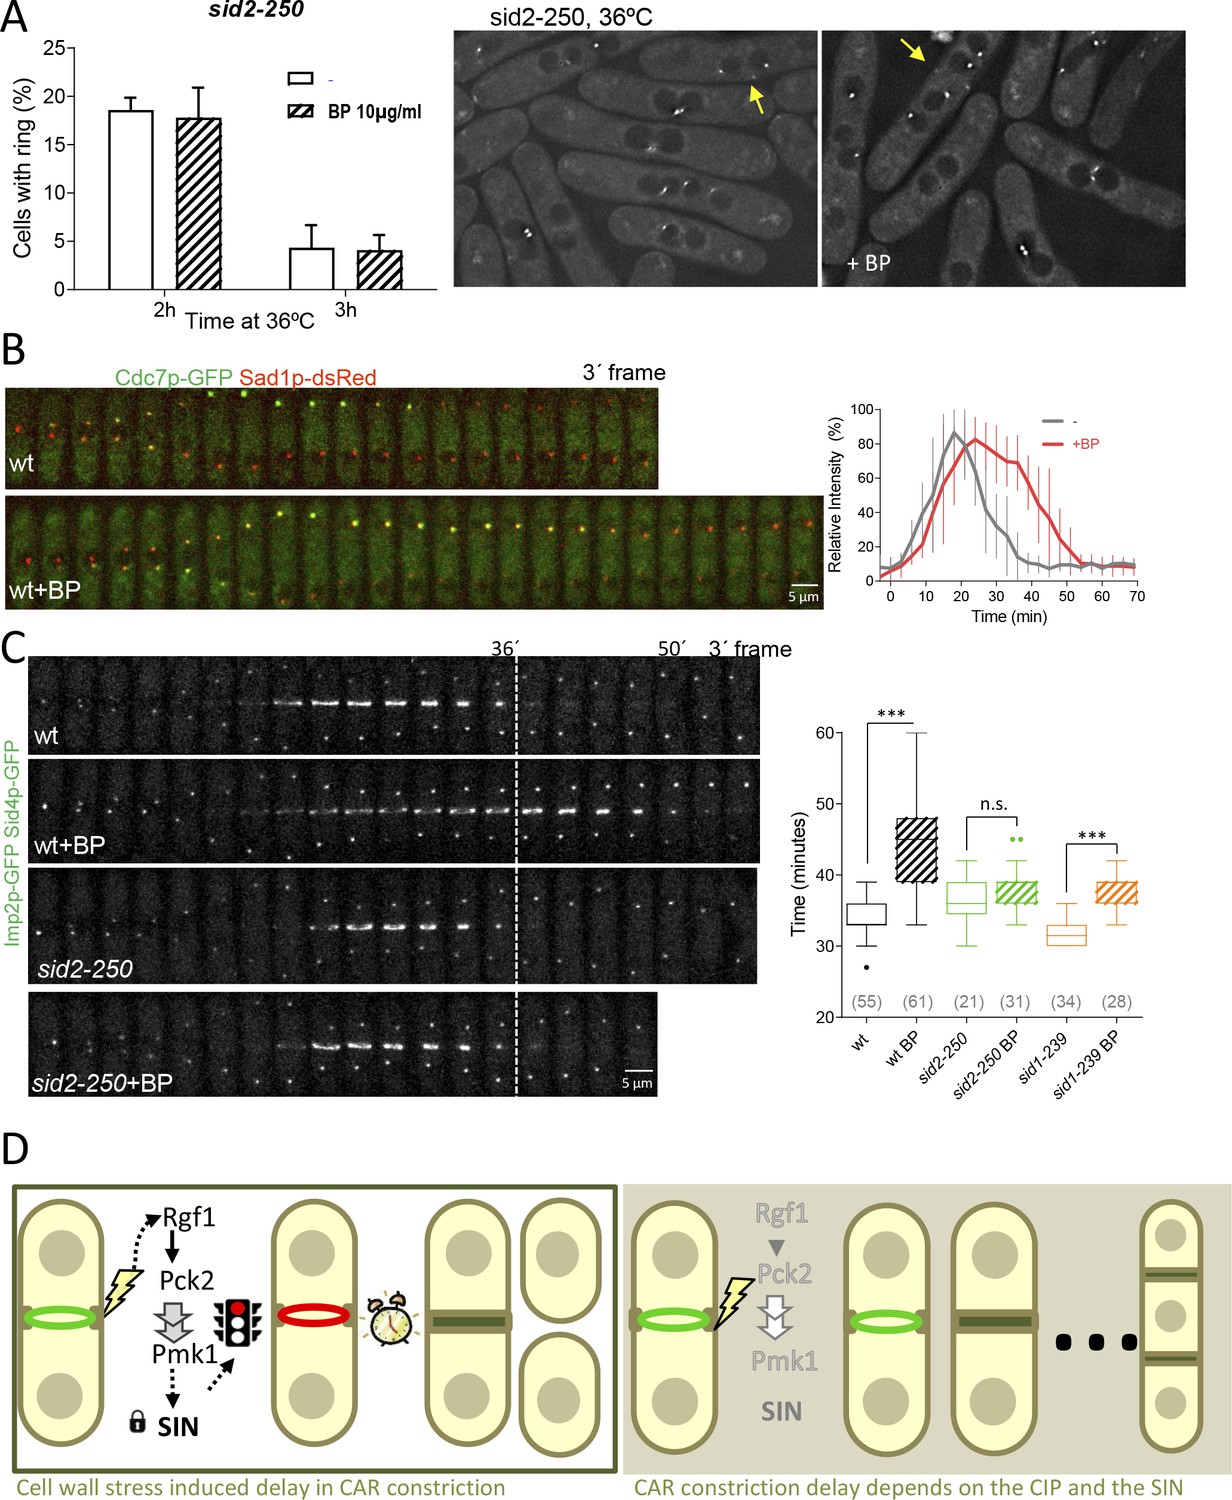
SIN signaling is required for cell wall stress dependent delay.
(A) The graph shows quantitative data for sid2-250 cells expressing Imp2p-GFP/Sid4p-GFP and grown to exponential phase at 25°C. Cultures were shifted to 36°C and imaged after 2 and 3 hr. Thirty minutes before imaging half of the cells were treated with BP (10 µg/ml) (right panels). (B) A time series of the maximum intensity projections of fluorescence micrographs of cells expressing (green) Cdc7p–EGFP and (red) Sad1p–tdTomato at 28°C. Cells were imaged w/o BP (top panel) (n = 11) or with BP (5 µg/ml) added (lower panel) (n = 12) using a spinning-disk confocal microscope. Measurements of Cdc7p–EGFP intensity on the brighter SPB over time in cells with BP (red) or w/o BP (grey) shown in A, with time 0 being SPB separation. (C) Time lapse series of wild type and sid2-250 cells expressing Imp2p-GFP and Sid4p-GFP. Cells were grown at 25°C and shifted to 32°C 1 hr before time-lapse imaging at 32°C. BP (5 µg/ml) was added immediately before imaging. (t = 0 indicates SPB separation). Quantitation of the timing of cytokinesis of strains and conditions shown in C. Asterisks indicate the statistical significance of the difference between the two conditions. Statistical significance was calculated by ANOVA followed by Šídák’s multiple comparisons test (n.s. p>0.05; ***p<0.0001). (D) Model for CIP-mediated CAR contraction delay caused by cell wall stress in fission yeast cytokinesis. Typically, rgf1+ and pmk1+ cells undergo a cytokinesis arrest in the presence of mild cell wall stress. In this context, Pmk1p signal maintains CRs stability in a SIN dependent manner. However, when the signal is blocked in deletion mutants of the CIP components or when the SIN kinase Sid2p is not fully active, the ring is prematurely closed. Persistent cell wall stress leads to the formation of multiseptated cells. Thus, the CIP-mediated signal is transmitted to the SIN that stabilizes AR before constriction and enable proper CAR performance.
-
Figure 7—source data 1
Percentage of cells with actomyosin rings over time, shifted to 36ºC at time 0h.
- https://cdn.elifesciences.org/articles/59333/elife-59333-fig7-data1-v2.xlsx
Figure 7—figure supplement 1

Cell wall stress delays Sid2p silencing in wild-type cells but not in rgf1Δ cells.
(A) Time-lapse series of a representative Sid2p-GFP cell (n = 29) or Sid2p-GFP rgf1Δ cells (n = 23) treated with BP. (B) Quantitation of the arrival and release of Sid2p at the septum; time 0 is considered as the SPB separation of the cells in A. Statistical significance was calculated by ANOVA followed by Šídák’s multiple comparisons test (n.s. p>0.05; ***p<0.0001). (C) Still images captured every 3 min taken from a movie of a representative Cdc7p-GFP Imp2p-GFP cell, or Cdc7p-GFP Imp2p-GFP rgf1Δ cell treated with BP (5 µg/ml).
-
Figure 7—figure supplement 1—source data 1
Time in minutes of the arrival and release of Sid2-GFP at the septum.
- https://cdn.elifesciences.org/articles/59333/elife-59333-fig7-figsupp1-data1-v2.xlsx
Author response image 1
Author response image 2
Author response image 3
Author response image 4
Author response image 5
Author response image 6

Author response image 7
Videos
Video 1
Cytokinesis delay under BP treatment.
Video 2
Contractile ring blockage under BP treatment.
Video 3
pmk1Δ cells do not delay cytokinesis under BP treatment.
Video 4
pmk1Δ cells do not delay cytokinesis under Caf treatment.
Video 5
Contractile rings become more stable under BP treatment.
Tables
Table 1
Contractile ring parameters.
| Genotypes | Formation | Maturation time (min) | Constriction time (min) | Constriction rate (nm/min) |
|---|---|---|---|---|
| Wild-type | 21.1 ± 2.1 | 9.80 ± 3.2 | 18.9 ± 2.6 | 154 ± 21 |
| Wild-type + BP | 18.6 ± 2.9 | 22.1 ± 4.0 | 18.9 ± 2.7 | 158 ± 31 |
| rgf1Δ | 18.4 ± 3.3 | 8.08 ± 2.5 | 16.8 ± 2.1 | 148 ± 25 |
| rgf1Δ + BP | 20.1 ± 1.4 | 11.4 ± 2.4 | 16.1 ± 1.5 | 175 ± 30 |
| pmk1Δ | 17.4 ± 1.9 | 9.79 ± 2.1 | 16.1 ± 1.7 | 175 ± 16 |
| pmk1Δ + BP | 17.1 ± 2.8 | 10.9 ± 3.1 | 16.0 ± 1.9 | 187 ± 15 |
-
Mean ± SD.
Table 2
Contractile ring parameters in wild-type cells under stresses.
| YES | BP(5 µg/ml) | Caffeine(2 mM) | Caspofungin (0.2 µg/ml) | KCl (0.2 M) | |
|---|---|---|---|---|---|
| Mean Time Constriction Onset (min) | 21 ± 2 | 38 ± 5 | 27 ± 3 | 27 ± 3 | 27 ± 3 |
| Mean constriction Rate (nm/min) | 154 ± 21 | 158 ± 31 | 97 ± 17 | 114 ± 13 | 95 ± 17 |
Key resources table
| Reagent type (species) or resource | Designation | Source or reference | Identifiers | Additional information |
|---|---|---|---|---|
| Antibody | Anti-phospho-p42/44 (Rabbit polyclonal) | Cell Signaling | Cat#: 9101, RRID:AB_331646 | WB (1:2500) |
| Antibody | Anti-HA (Mouse monoclonal) | Roche | Cat# 11666606001, RRID:AB_514506 | WB (1:5000) |
| Antibody | HRP anti-mouse (Goat polyclonal) | Bio-Rad | Cat#: 170–6516, RRID:AB_11125547 | WB (1:10000) |
| Antibody | HRP anti-rabbit (Goat polyclonal) | Bio-Rad | Cat#: 170–5046, RRID:AB_11125757 | WB (1:15000) |
| Chemical compound, drug | Blankophor | Bayer | Blankophor BA 267% | |
| Chemical compound, drug | KCl | Merck | Cat#: 104936 | |
| Chemical compound, drug | Caffeine | Sigma-Aldrich | Cat#: W222402 | |
| Chemical compound, drug | Caspofungin | Sigma-Aldrich | Cat#: SML0425 | |
| Chemical compound, drug | Latrunculin A | Sigma-Aldrich | Cat#: L5163 | |
| Chemical compound, drug | Hydroxyurea | Sigma-Aldrich | Cat#: H8627 | |
| Chemical compound, drug | Soybean lectin | Sigma Aldrich | Cat#: L2650 | |
| Commercial assay, kit | Ni-NTA | Novagen | Cat#: 70666 | |
| Software, algorithm | GraphPad Prism | GraphPad Prism (https://graphpad.com) | RRID:SCR_015807 | |
| Software, algorithm | ImageJ | ImageJ (http://imagej.nih.gov/ij/) | RRID:SCR_003070 | |
| Other | μ-Slide eight well | Ibidi | Cat#: 80826 |
Table 3
S. pombe strains used in this work.
| Strains | Genotypes |
|---|---|
| YS5261 | h-rgf1::kanMX6, leu1-32::rgf1-EnvyGFP, sid4-mcherry:hph, rlc1-tdTomato:nat, ura4D18 |
| SM440 | h+ leu1-32::rgf1-GFP:leu1+, nda3-KM311, rgf1::nat, leu1-32 |
| TE519 | h- cdc15-140, rlc1-tdTomato:natMX6, rgf1::his3+, leu1-32::rgf1-GFP:leu1+ |
| TE348 | h-cdc11-119, rlc1-tdTomato:natMX6, rgf1::kanMX6, leu1-32::rgf1-GFP:leu1+ |
| PG40 | h- rgf1::his3+, his3D1, ura4D18, leu1-32::rgf1-GFP:leu1+, ade6M210 |
| NG319 | h+ cdc3-6, rgf1::his3+, his3D1, leu1-32::rgf1-GFP:leu1+ |
| TE149 | h-sid2-250, leu1-32::rgf1-GFP:leu1+, rgf1::natMX6 |
| SM213a | h+ leu1-32, ura4d18 |
| SM341 | h+ rgf1::natMX6, leu1-32, ura4D18 |
| YS864 | h+ cdc4-8, leu1-32 |
| TE377 | h+ cdc4-8, rgf1::kanMX6, leu1-32 |
| YS862 | h-rlc1::kanMX6, ura4D18, leu1-32, ade6M210 |
| TE389 | h+ rlc1::kanMX6, rgf1::nat, ura4D18, leu1-32, ade6M210 |
| YS586b | h-cdc15-140, leu1-32 |
| NG203 | h-cdc15-140, rgf1::kanMX6 |
| TE246 | h+imp2::ura4+, leu1-32, ade6M210 |
| TE454 | h+ imp2::ura4+, rgf1::natMX6, leu1-32 |
| YS865 | h+ cdc12-112 |
| TE251 | h- cdc12-112, rgf1::natMX6 |
| TE478 | h-imp2-GFP:kanMX6, leu1:sid4-GFP, ura4D18, leu1-32 |
| TE495 | h-rgf1::natMX6, imp2-GFP:kanMX6, leu1:sid4-GFP, ura4D18, leu1-32 |
| TE249c | h+ leu1::GFP-atb2:ura4+, rlc1-tdTomato:natMX6, leu1-32, ura4D18, his3D1 |
| TE257 | h+leu1::GFP-atb2:ura4+, rlc1-tdTomato:natMX6, rgf1::kanMX6, leu1-32, ura4D18 |
| TE470 | h+LactC2-GFP:natMX6, sad1-GFP:kanMX6, leu1-32, ura4D18, ade6M210 |
| TE472 | h+LactC2-GFP:natMX6, sad1-GFP:kanMX6, rgf1::natMX6, leu1-32, ura4D18, ade6M210 |
| TE399 | h+ mEGFP-myo2:kanMX6, sid4-mCherry:hph, leu1-32, ura4D18 |
| TE402 | h+ mEGFP-myo2:kanMX6, sid4-mCherry:hph, rgf1::natMX6, leu1-32, ura4D18 |
| TE450 | h+ sad1-GFP:kanMX6, imp2-GFP:kanMX6, ura4D18 |
| TE452 | h+sad1-GFP:kanMX6, imp2-GFP:kanMX6, rgf1::natMX6, ura4D18 |
| TE491 | h-pmk1::ura4+, imp2-GFP:kanMX6, leu1:sid4-GFP, ura4D18, leu1-32 |
| TE585 | h-pmk1::ura4+, mEGFP-myo2:kanMX6, sid4-mcherry:hph, ura4D18 |
| TE545 | h-sty1::ura4+, imp2-GFP:kanMX6, leu1:sid4-GFP, ura4D18, leu1-32 |
| TE500 | h-pck2::kanMX6, imp2-GFP:kanMX6, leu1:sid4-GFP, ura4D18, leu1-32 |
| TE493 | h-pck1::kanMX6, imp2-GFP:kanMX6, leu1:sid4-GFP, ura4D18, leu1-32 |
| TE418 | h-rho2::natMX6, imp2-GFP:kanMX6, leu1:sid4-GFP, ura4D18, leu1-32 |
| TE580 | h-rho1-596:natMX6, imp2-GFP:kanMX6, leu1:sid4-GFP, ura4D18, leu1-32 |
| RC34 | h-leu1-32::rgf1-PTTR-GFP:leu1+, rlc1-tdTomato:natMX6, rgf1::kanMX6, sid4-mCherry:hph, leu1-32 |
| TE562 | h-cwg1-1, imp2-GFP:kanMX6, leu1:sid4-GFP, ura4D18, leu1-32 |
| TE564 | h-cwg1-1, pmk1::ura4+, imp2-GFP:kanMX6, leu1:sid4-GFP, ura4D18, leu1-32 |
| TE551a | h- pmk1::kanMX6, leu1-32, ura4D18, ade6M210 |
| TE541 | h- pmk1::ura4+, hht1-RFP:kanMX6, imp2-GFP:kanMX6, leu1:sid4-GFP, ura4D18 |
| TE552 | h- myp2::ura4+, imp2-GFP:kanMX6, leu1:sid4-GFP, ura4D18, leu1-32 |
| TE615 | h-rlc1::kanMX6, imp2-GFP:kan, leu1:sid4-GFP, ura4D18, leu1-32 |
| TE513 | h+ cdc7-GFP:ura4+, sad1:dsRed:natMX6, ura4D18 |
| YS826 | h+ sid2-GFP:ura4+, leu1-32, ade6M210, ura4D18 |
| TE427 | h+ sid2-GFP:ura4+, rgf1::natMX6, leu1-32, ade6M210, ura4D18 |
| TE413 | h+ cdc7-GFP:ura4+, imp2-GFP:kanMX6 |
| TE414 | h+cdc7-GFP:ura4+, imp2-GFP:kanMX6, rgf1::natMX6 |
| TE527 | h+ clp1-GFP:kanMX6, imp2-GFP:kanMX6, leu1:sid4-GFP, leu1-32 |
| TE507 | h- clp1::kanMX6, imp2-GFP:kanMX6, leu1:sid4-GFP, leu1-32 |
| EM352d | h- pact1-LA:GFP:leu, ura4D18, leu1-32 |
| RC8 | h-sid2-250, imp2-GFP:kanMX6, sfi1-GFP:kanMX6 |
| TE611 | h-sid1-239, imp2-GFP:kanMX6, leu1:sid4-GFP, leu1-32 |
| YS5154 | h-adf1-1, imp2-GFP:kanMX6, leu1:sid4-GFP, ura4D18, leu1-32 |
| TE592 | h-cdc12-112, imp2-GFP:kanMX6, leu1:sid4-GFP, ura4D18, leu1-32 |
| TE591 | h-pmk1:: kanMX6, pmk1(K52E)−3 HA:leu1+, imp2-GFP:kanMX6, sfi1-GFP:kanMX6, leu1-32 |
| PG323 | h-pmk1-HA6h:ura4+, his3D1, leu1-32 |
| YS5432 | h-cwg1-1:natMX6, pmk1-HA6h:ura4+ |
| TE261a | h-cdc15-HA:kanMX6, ura4D18, leu1-32 |
| TE646 | h-pmk1::ura4+, cdc15-HA:kanMX6, ura4D18 |
| TE350 | h-mid1-GFP:kanMX6, rlc1-tdTomato:natMX6, leu1-32, ura4D18, his3D1 |
| TE353 | h-mid1-GFP:kanMX6, rlc1-tdTomato:natMX6, rgf1::his3+, leu1-32, ura4D18, his3D1 |
| TE587 | h-rgf1::natMX6, pmk1::ura4+, imp2-GFP:kanMX6, leu1:sid4-GFP, ura4D18, leu1-32 |
-
All strains were generated in this study except for strains with labela from P. Perez (IBFG, University of Salamanca), labelb from H. Valdivieso (IBFG, University of Salamanca), labelc from J.C. Ribas (IBFG, University of Salamanca), labeld from M. Balasubramanian (University of Warwick).
Additional files
Download links
A two-part list of links to download the article, or parts of the article, in various formats.
Downloads (link to download the article as PDF)
Open citations (links to open the citations from this article in various online reference manager services)
Cite this article (links to download the citations from this article in formats compatible with various reference manager tools)
A novel checkpoint pathway controls actomyosin ring constriction trigger in fission yeast
eLife 9:e59333.
https://doi.org/10.7554/eLife.59333


