Massively multiplex single-molecule oligonucleosome footprinting
- Department of Biochemistry & Biophysics, University of California San Francisco, United States
- Department of Pediatrics, Stanford University, United States
- Vector Institute, United States
- Pacific Biosciences of California Inc, United States
- Bakar Computational Health Sciences Institute, United States
Figures
Figure 1 with 6 supplements

Overview of the single-molecule adenine methylated oligonucleosome sequencing assay (SAMOSA).
(A) In the SAMOSA assay, chromatin is methylated using the nonspecific EcoGII methyltransferase, DNA is purified, and then subjected to sequencing on the PacBio platform. Modified adenine residues are natively detected during SMRT sequencing due to polymerase pausing, leading to an altered interpulse duration at modified residues. (B) SAMOSA data can be used to accurately infer nucleosome dyad positions given a strong positioning sequence. Shown are the distributions of called dyad positions with respect to the known Widom 601 dyad. Called dyads fall within a few nucleotides of the expected dyad position (median ±median absolute deviation [MAD]=4 ± 2.97 bp). (C) SAMOSA data accurately recapitulates the known nucleosome repeat lengths (NRL) of in vitro assembled chromatin fibres. Called NRLs are strongly concordant with the expected 193 repeat length (pairwise distance between adjacent dyads median ±MAD = 193±7.40 bp; single-molecule averaged repeat length median ±MAD = 192±1.30 bp). (D) Expected nucleosome footprints in SAMOSA data can be visually detected with single-molecule resolution (n = 500 sampled footprinted chromatin molecules).
Figure 1—figure supplement 1
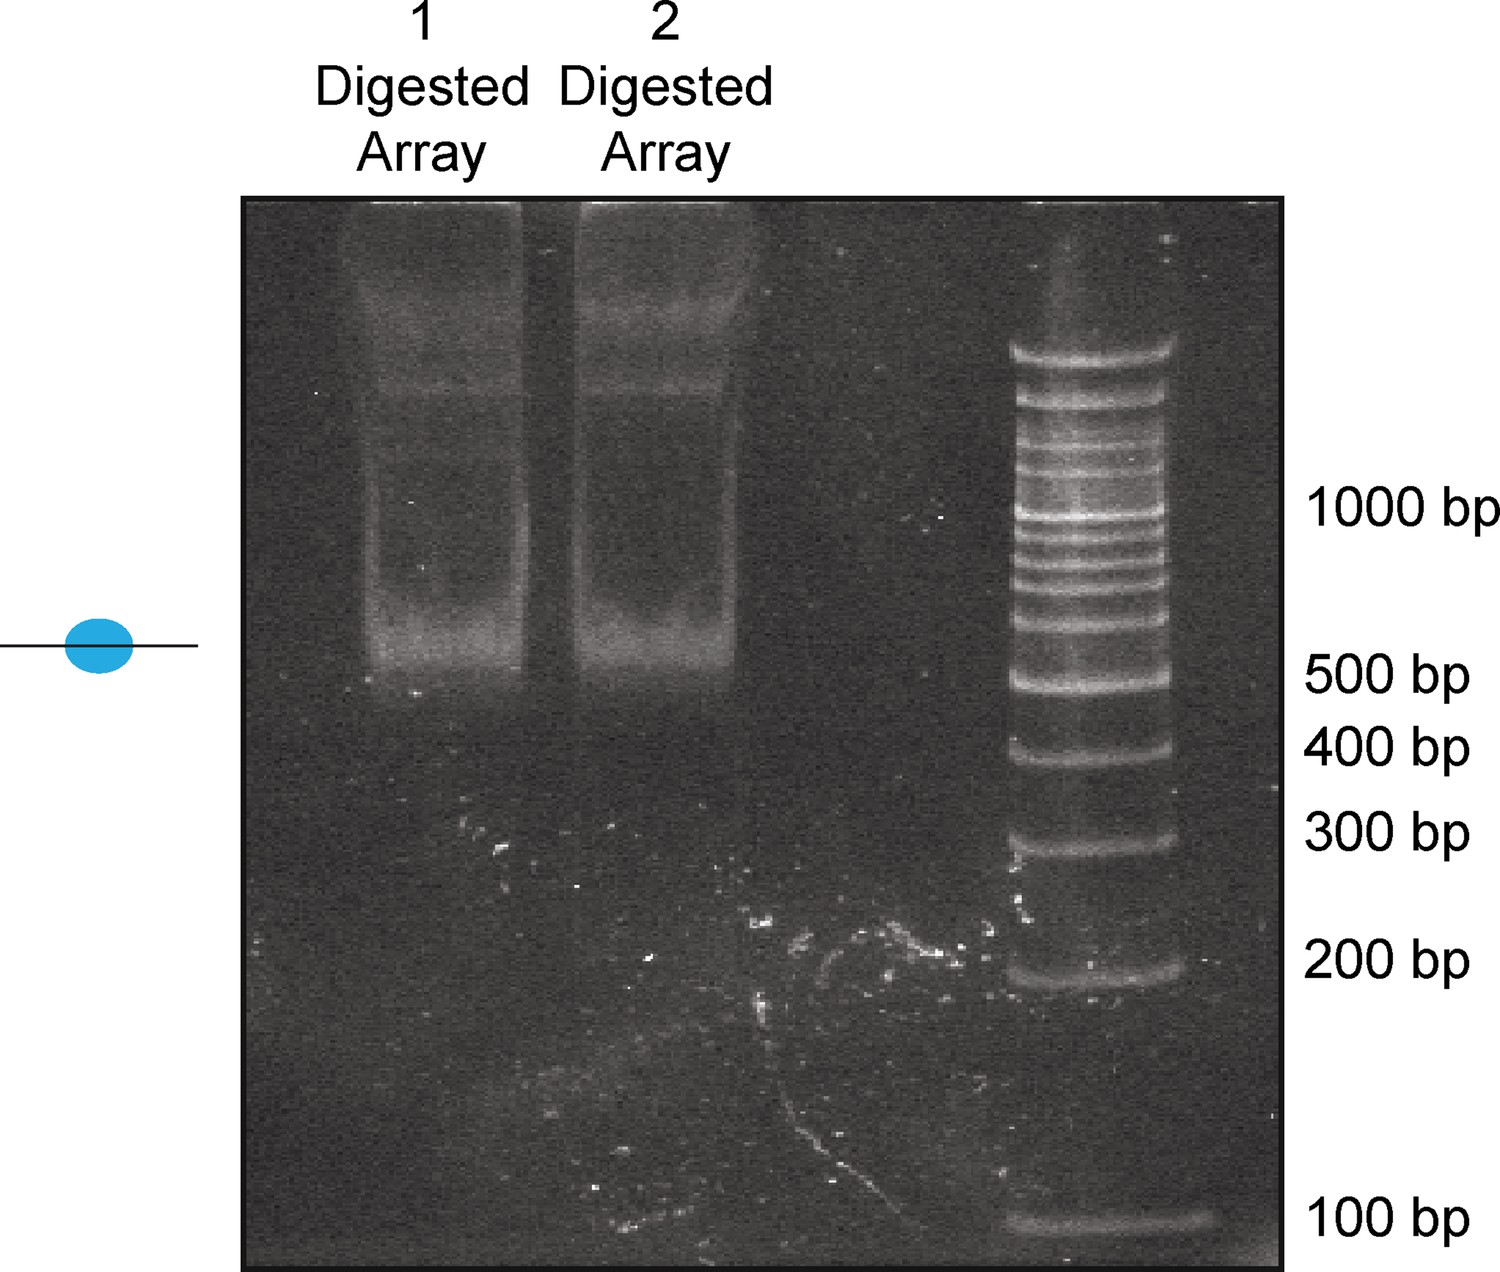
Quality control of in vitro nucleosome arrays assembled through salt-gradient dialysis.
Nonanucleosomal arrays were assembled in duplicate as previously and checked for assembly extent via restriction enzyme digest. In both cases, the smallest digestion products corresponded to a protected mononucleosomal fragment, suggesting that there is minimal underassembly of the resulting arrays.
Figure 1—figure supplement 2
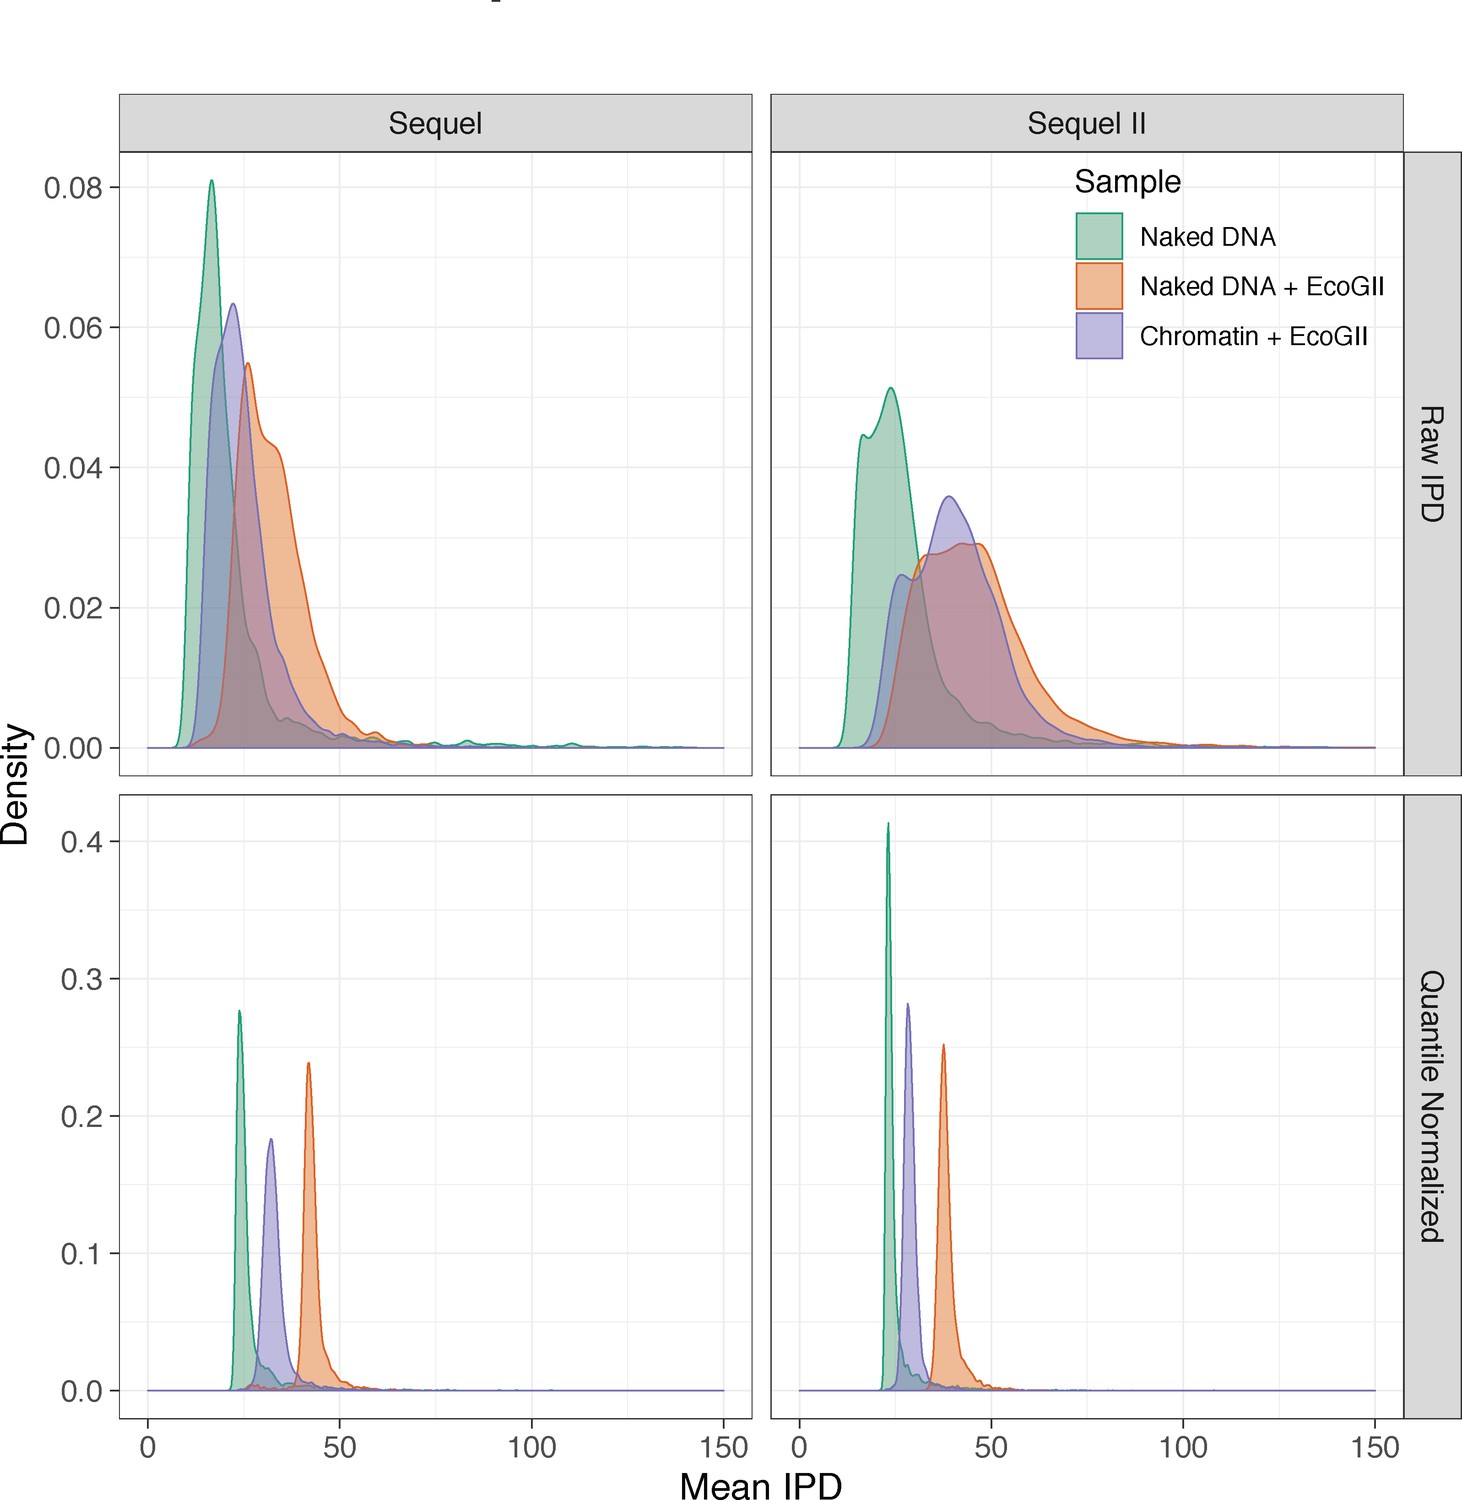
Mean raw and quantile normalized interpulse durations for in vitro SAMOSA experiments.
In vitro SAMOSA experiments demonstrate intermediate single-molecule average interpulse durations compared to unmethylated array DNA and fully methylated deproteinated array DNA. Data are similarly separated on the Sequel and Sequel II platforms and quantile normalization further aids in separating chromatin from control samples, particularly on the Sequel II platform.
Figure 1—figure supplement 3
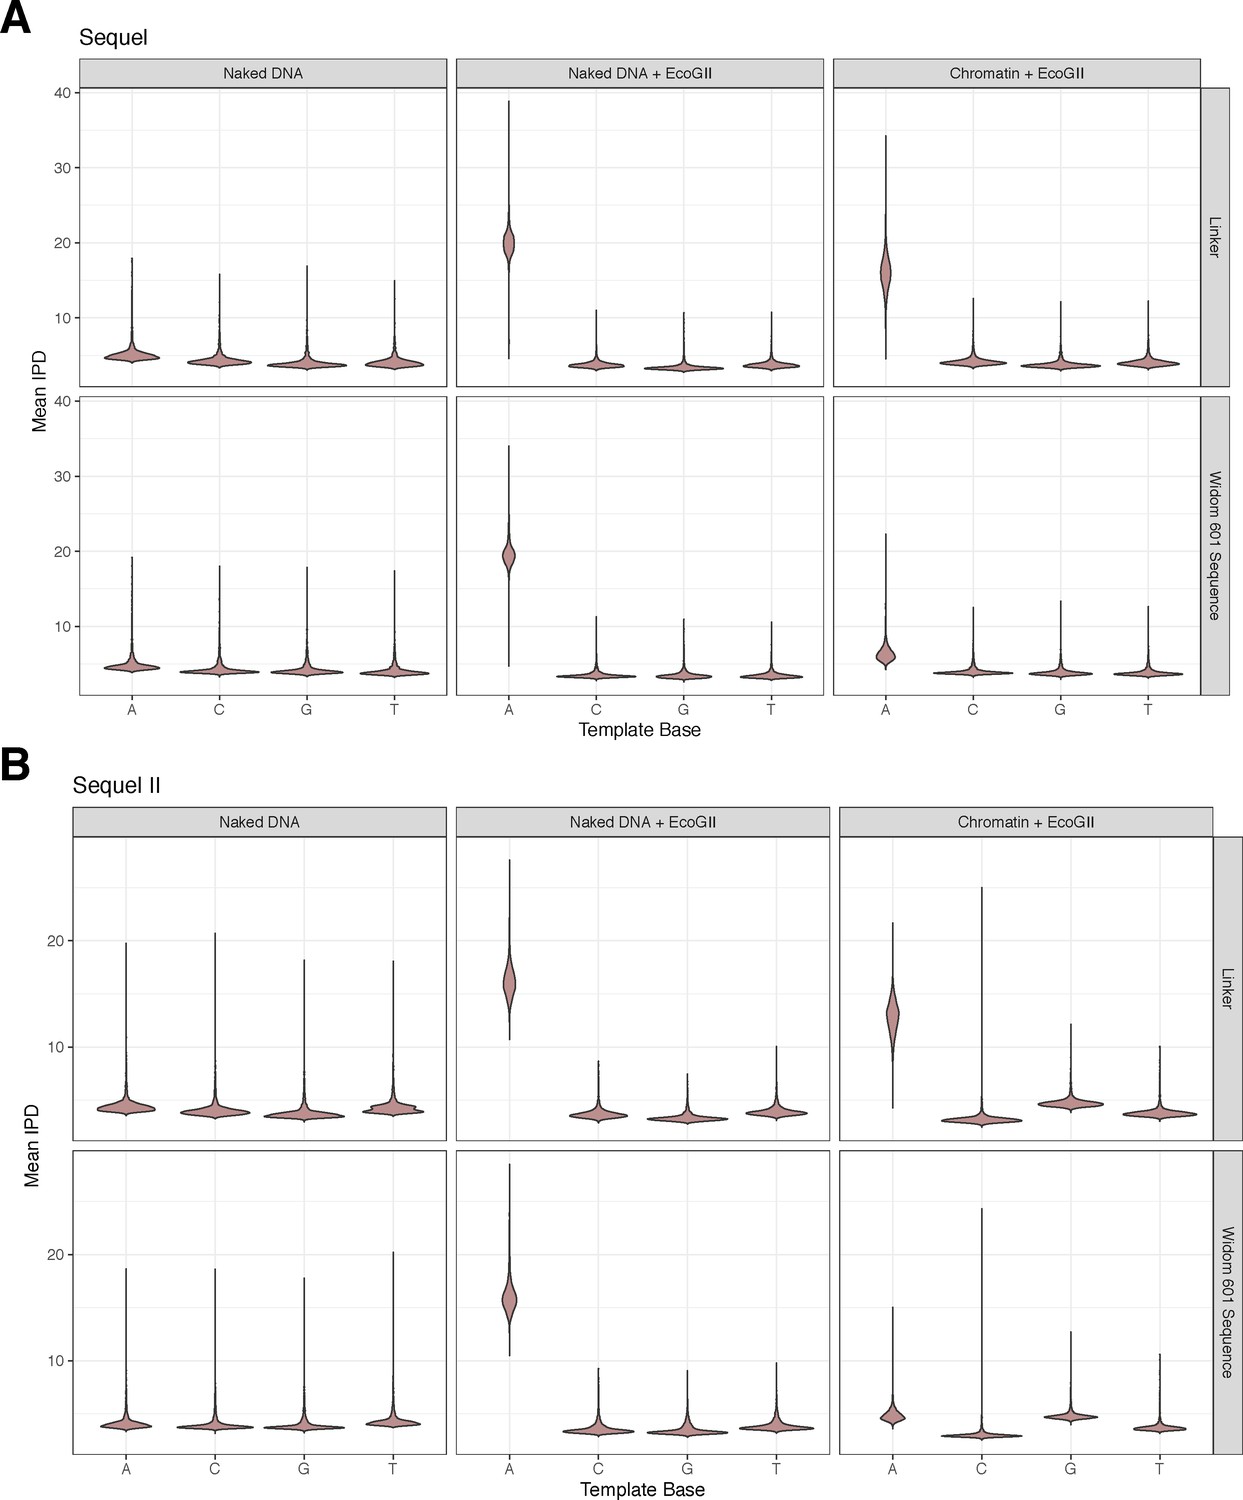
Adenine methylation by the EcoGII enzyme is specific to accessible adenines and is protected against by the nucleosome.
(A) Violin plots of the distribution of average, quantile normalized IPD values for each nucleotide on controls (unmethylated/fully methylated naked DNA) and chromatin separated by nucleotides falling within the Widom 601 nucleosome positioning sequence or linker DNA. In the chromatin context, only adenine nucleotides falling within the linker are modified, consistent with protection of bases by nucleosomes positioned by the Widom 601 sequence. (B) As in A, but for data from the Sequel II platform.
Figure 1—figure supplement 4
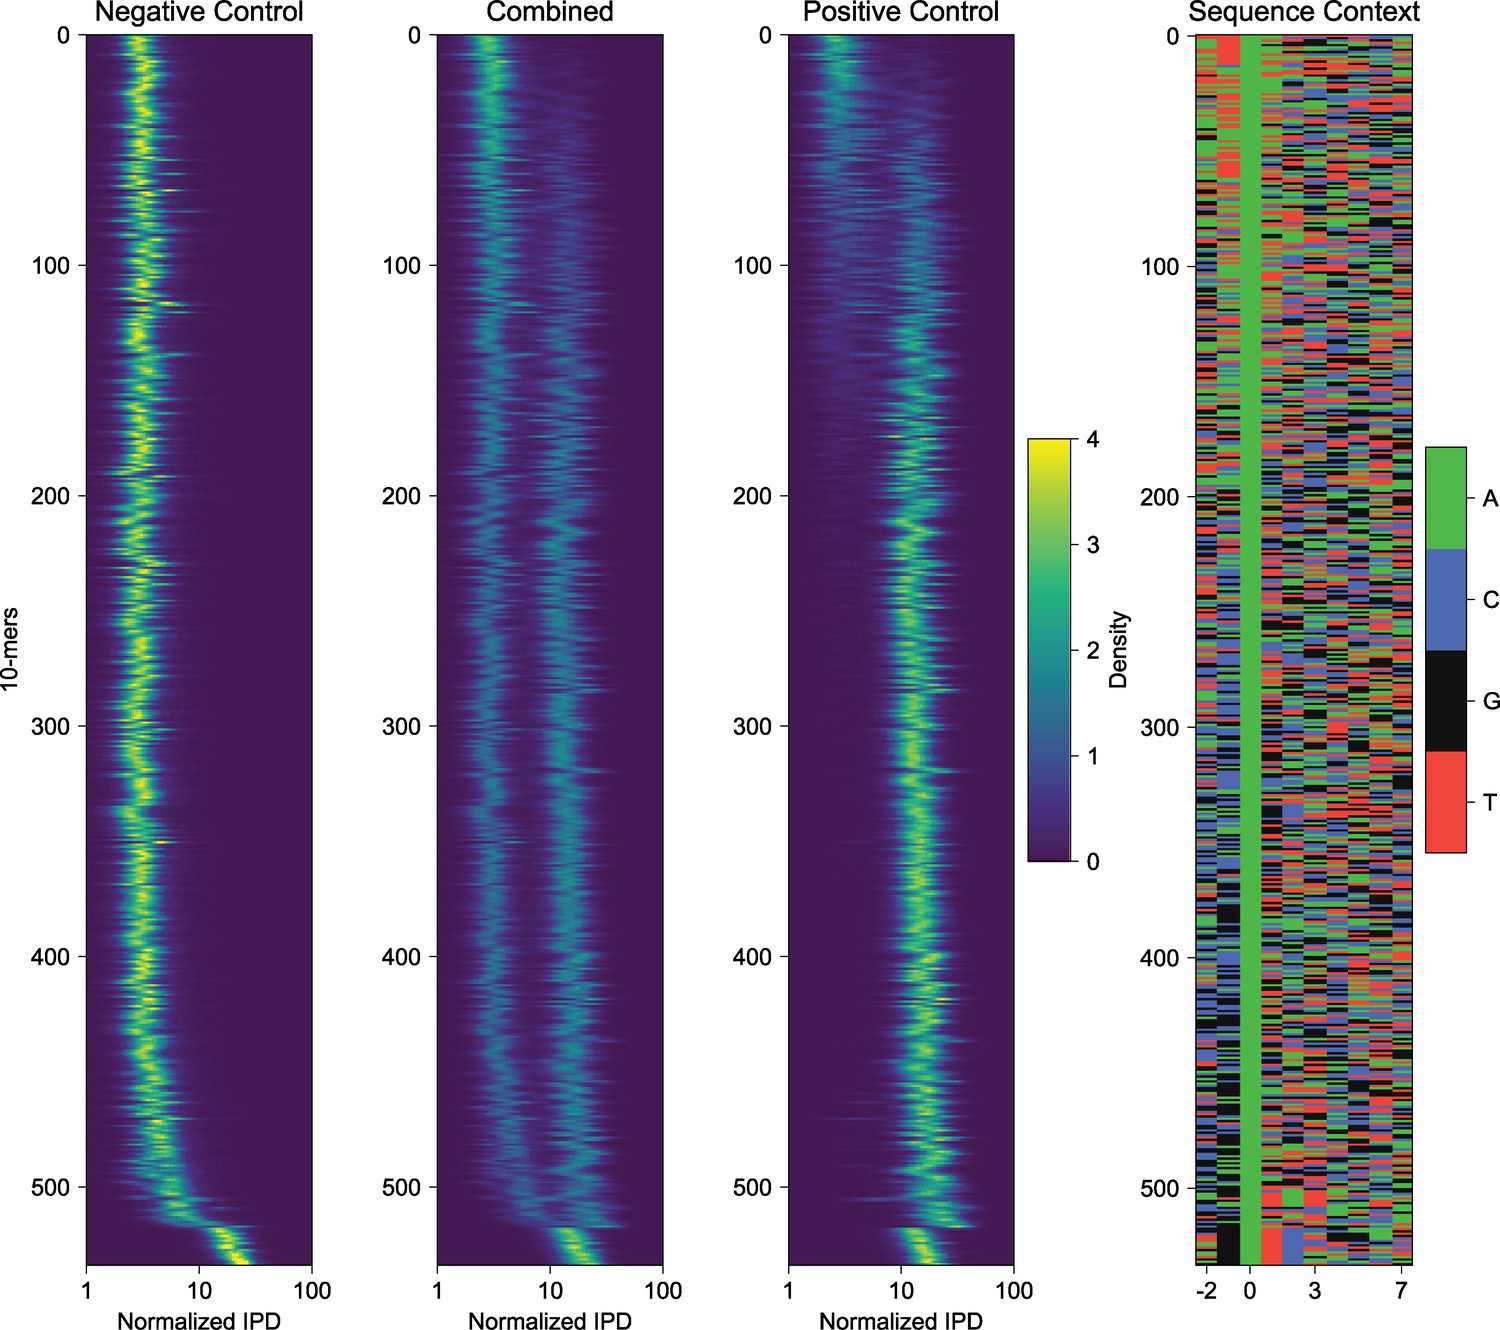
k-mer analysis of negative and positive control sequences reveals sequence biases of IPD measurements of EcoGII modified DNA.
Decomposition of measured IPD values for represented 10-mers in a 10 bp window informed by known PacBio polymerase footprint. Heatmaps are visualizing individual histograms of normalized IPD for each well-respresented 10-mer in the template sequence. The ‘Combined’ panel is an overlay of both negative and positive control histograms, and the ‘Sequence Context’ panel visualizes the 10-mer sequences in color format. This analysis reveals a subset of contexts where methylation efficiency and/or detection is subtly altered by template base composition.
Figure 1—figure supplement 5
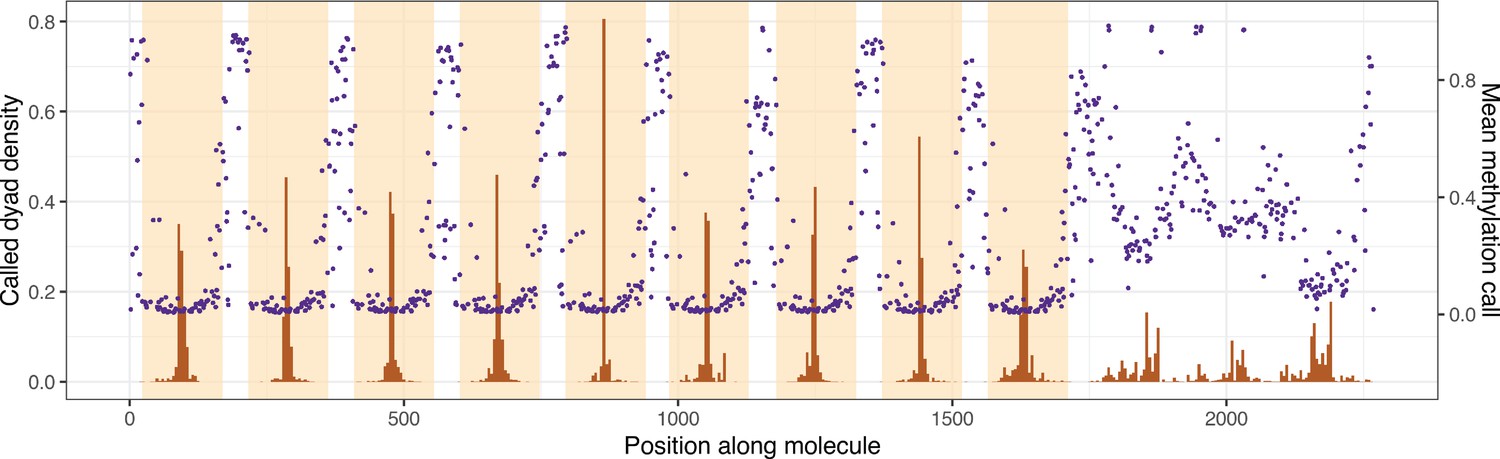
Average linker methylation and individually called dyad positions are qualitatively similar across the length of the nonanucleosomal array molecule.
Histograms of called dyad positions for each occurrence of a Widom 601 repeat unit (orange shading), averaged over all sequenced chromatin molecules are shown in brown. Mean methylation calls for each linker sequence (sequence outside orange shading) are shown in purple.
Figure 1—figure supplement 6
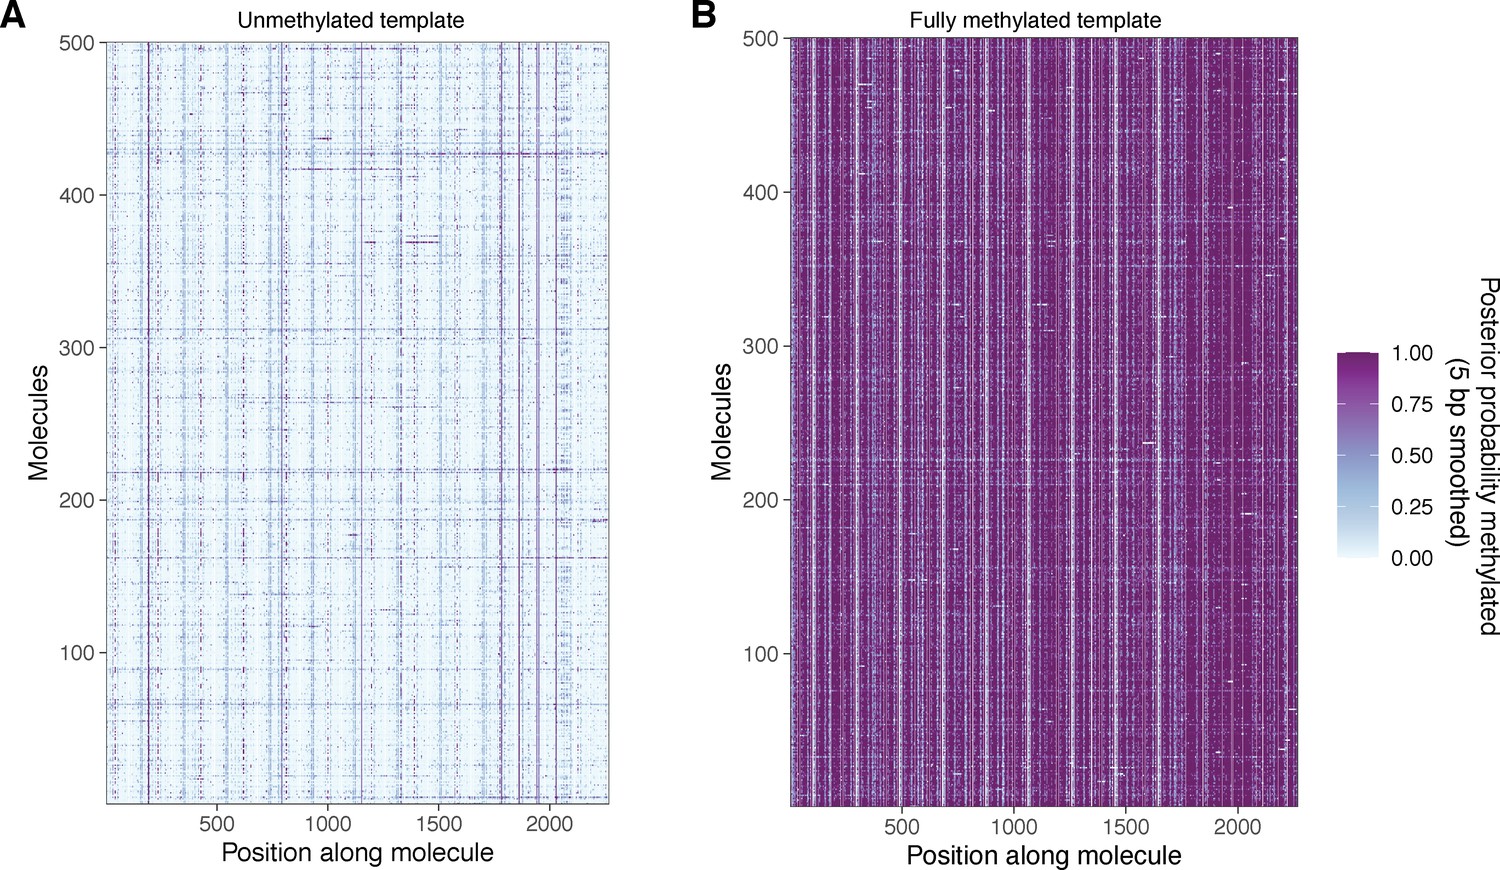
Unmethylated and fully methylated array DNA does not display the same periodic patterning of modified bases seen in methylated chromatin.
(A) Smoothed modification probabilities for 500 molecules of unmethylated array DNA. (B) Smoothed modification probabilities for 500 molecules of fully methylated naked array DNA. In both cases, data are smoothed using a 5 bp rolling mean on the calculated modification probabilities at template A nucleotides.
Figure 2 with 1 supplement
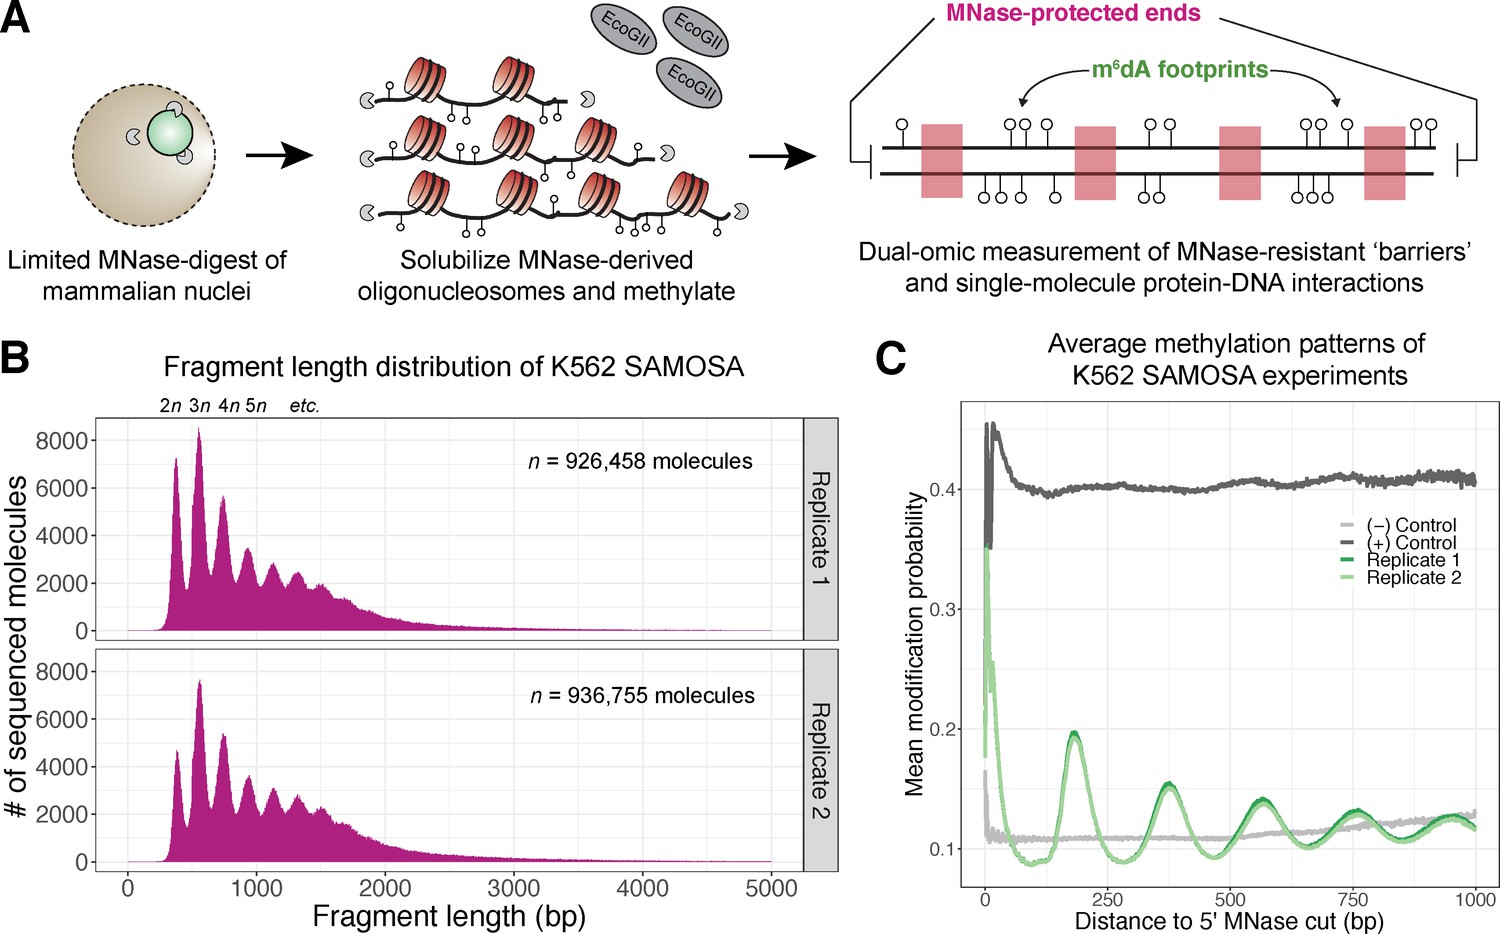
In vivo SAMOSA captures oligonucleosome structure by combining MNase digestion of chromatin with adenine methylation footprinting.
(A) An overview of the in vivo SAMOSA protocol: oligonucleosomes are gently solubilized from nuclei using micrococcal nuclease and fusogenic lipid treatment. Resulting oligonucleosomes are footprinted using the EcoGII enzyme and sequencing on the PacBio platform. Each sequencing molecules captures two orthogonal biological signals: MNase cuts that capture ‘barrier’ protein-DNA interactions, and m6dA methylation protein-DNA footprints. (B) Fragment length distributions for in vivo SAMOSA data reveal expected oligonucleosomal laddering (bin size = 5 bp). (C) Averaged modification probabilities from SAMOSA experiments demonstrate the ability to mark nucleosome-DNA interactions directly via methylation. Modification patterns seen in the chromatin sample are not seen in unmethylated oligonucleosomal DNA or fully methylated K562 oligonucleosomal DNA.
Figure 2—figure supplement 1
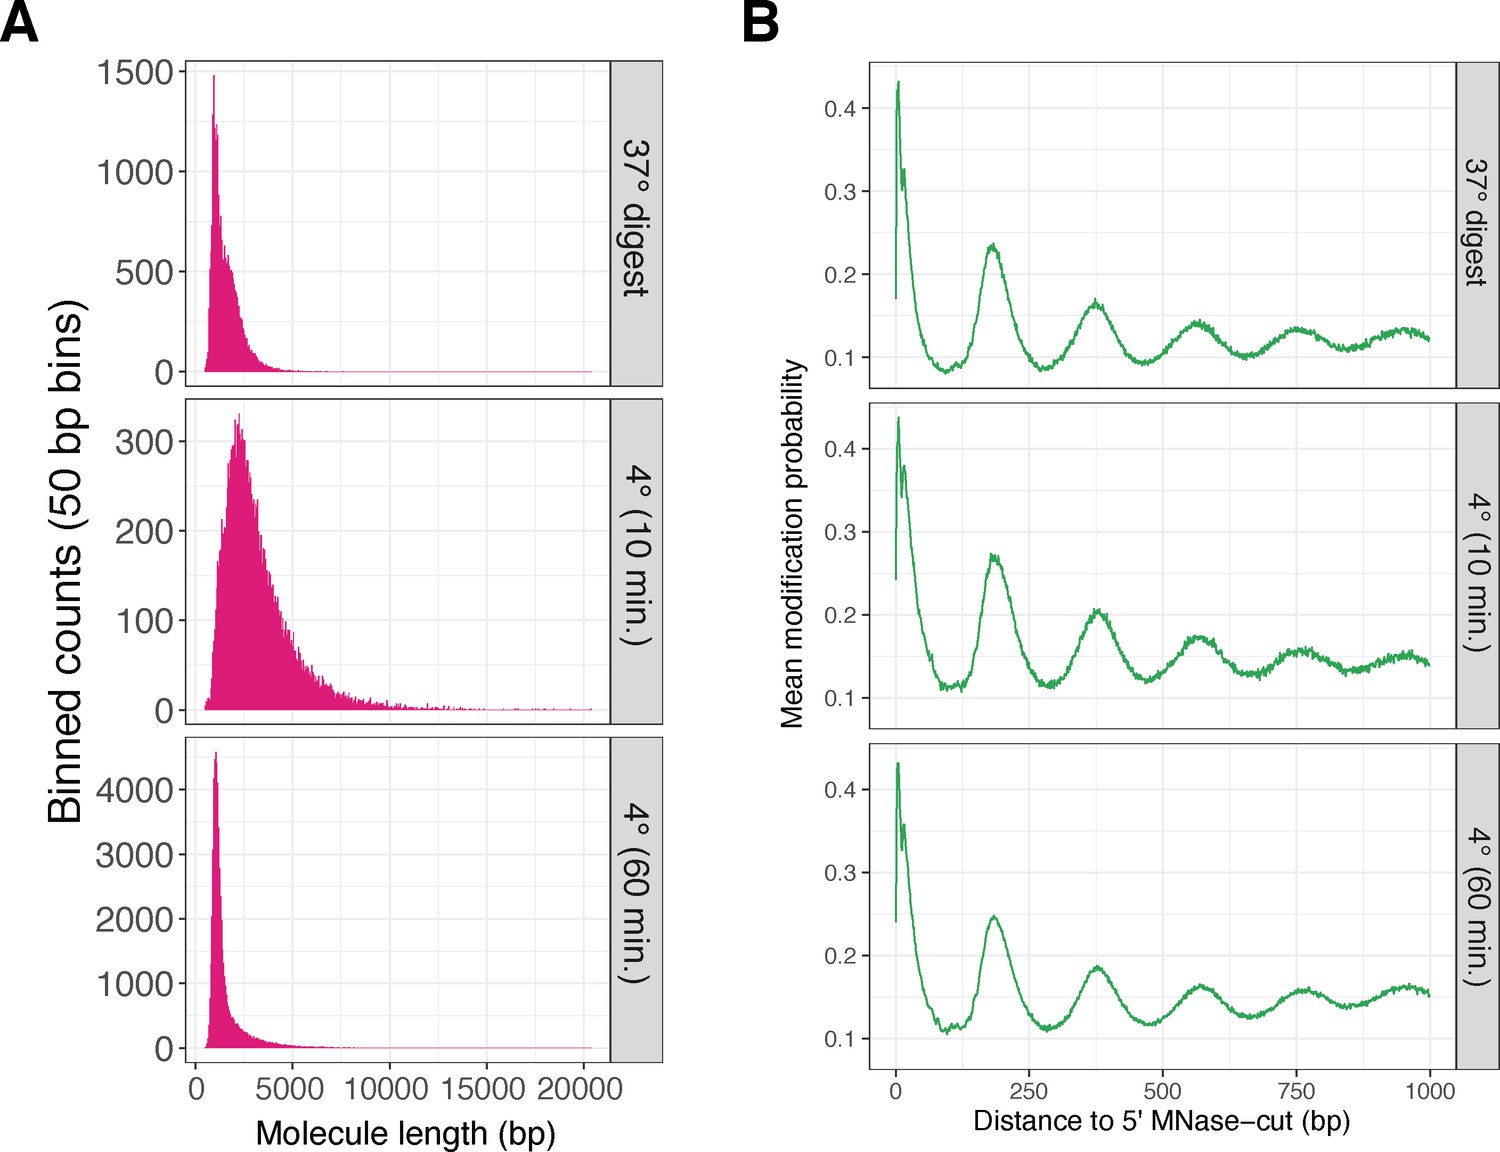
Three additional K562 SAMOSA experimental conditions demonstrate the reproducibility of the technique for footprinting nucleosomes, and demonstrate the ability to tune SAMOSA fragment length distributions by altering MNase digestion conditions.
(A) Fragment length distributions for three additional lightly sequenced K562 SAMOSA experimental conditions. (B) Average modification probabilities with respect to 5′ fragment end for each of the same libraries.
Figure 3 with 1 supplement

SAMOSA reveals distribution of oligonucleosome patterns genome-wide.
(A) Stacked bar chart representation of the contribution of each cluster to overall signal across two replicate experiments in K562 cells. (B) Average modification probability as a function of sequence for each of the seven defined clusters. Left: Manually annoted cluster names based on NRL estimates computed by calling peaks on single-molecule autocorrelograms; Right: Median and median absolute deviation for single-molecule NRL estimates determined for each cluster. (C) Violin plot representation of the distributions of single-molecule NRL estimates for each cluster. Clusters can be separated into three ‘irregular’ and four ‘regular’ groups of oligonucleosomes. (D) Histogram of single-molecule NRL estimates for Clusters 1, 4, and 7, along with (E) 5000 randomly sampled molecules from each cluster.
Figure 3—figure supplement 1
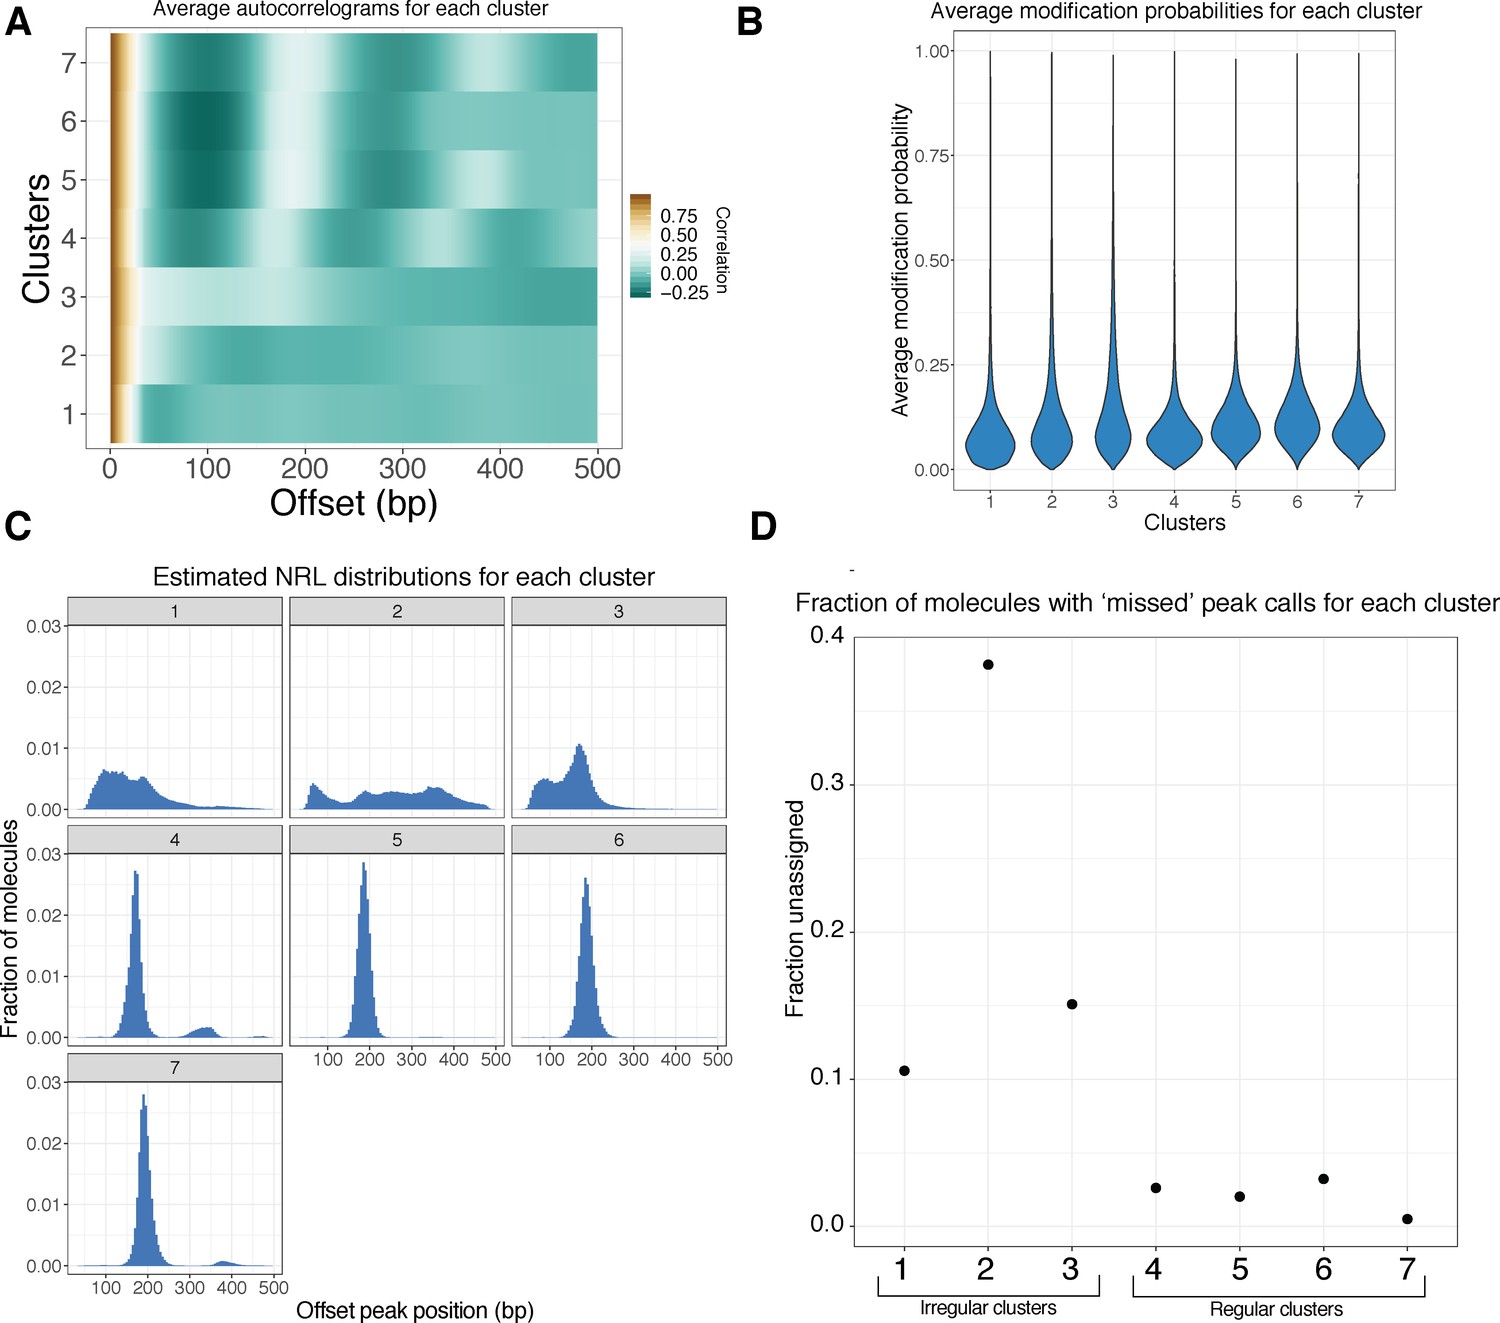
Further characterization of clustered footprinted molecules.
(A) Average autocorrelograms for the seven Leiden clusters. (B) Violin plots of the single-molecule average modification probabilities for each cluster. Clusters do not substantially differ with respect to modification probability, suggesting that clustering is not simply driven by methylation extent. (C) As in Figure 3C; NRL distribution estimates for each of the seven clusters. (D) Autocorrelogram peak-calling fails in a fraction of reads in each cluster; this fraction appears to be negatively associated with the ‘regularity’ of the cluster.
Figure 4 with 1 supplement
SAMOSA captures bulk and single-molecule evidence of transcription factor-DNA interaction simultaneously via two orthogonal molecular signals.
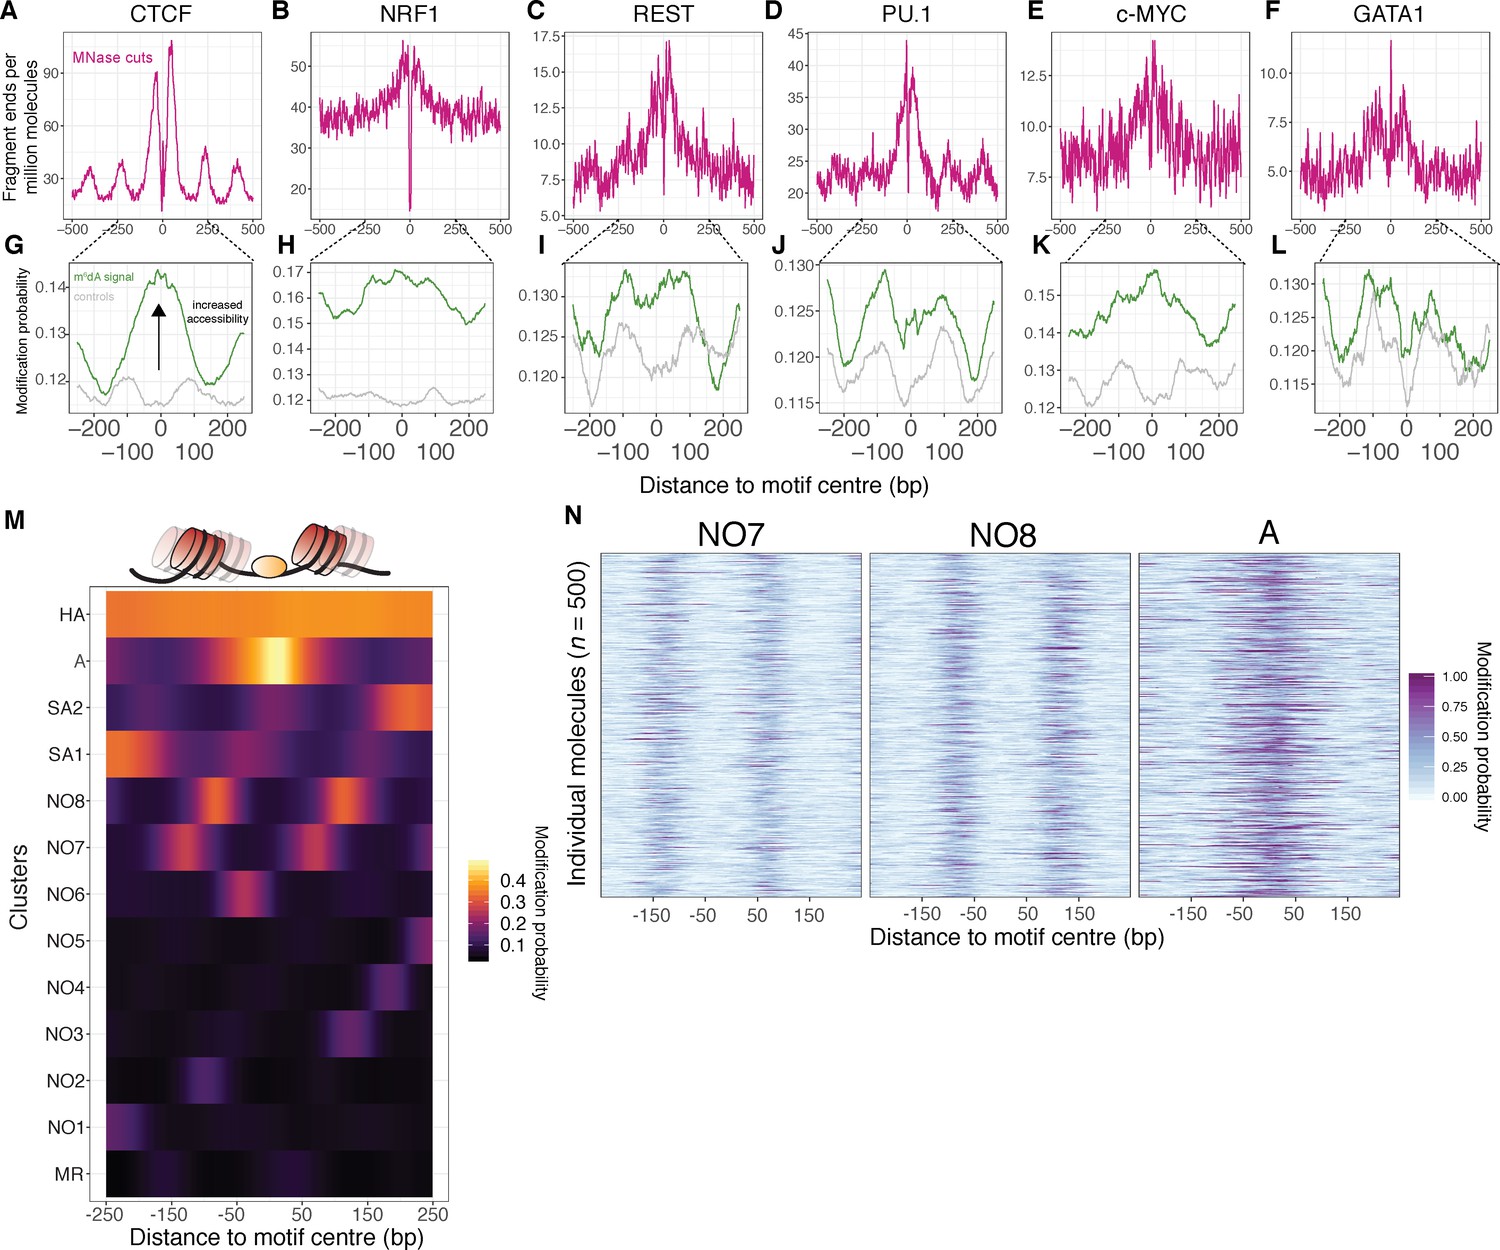
(A-F) SAMOSA MNase-cut signal averaged over predicted CTCF, NRF1, REST, PU.1, c-MYC, and GATA1-binding motifs in the K562 epigenome. All binding sites were predicted from ENCODE ChIP-seq data. (G–L) m6dA signal for the same transcription factors, averaged over molecules containing predicted binding sites and at least 250 bases flanking DNA on either side of the predicted motif. Methylation patterns at predicted sites were compared against average profiles taken from randomly drawn molecules from GC%- and repeat-content-matched regions of the genome (calculated for each ENCODE ChIP-seq peak set). (M) Results of clustering motif-containing molecules using the Leiden community detection algorithm. Clusters were manually annotated as containing molecules that were: ‘methylation resistant’ (MR), nucleosome occupied (NO1-8), stochastically accessible (SA1-2), accessible (A), or hyper-accessible (HA). (N) Heatmap representation of single-molecule accessibility profiles for clusters NO7, NO8, and A (500 randomly sampled molecules per cluster).
Figure 4—figure supplement 1
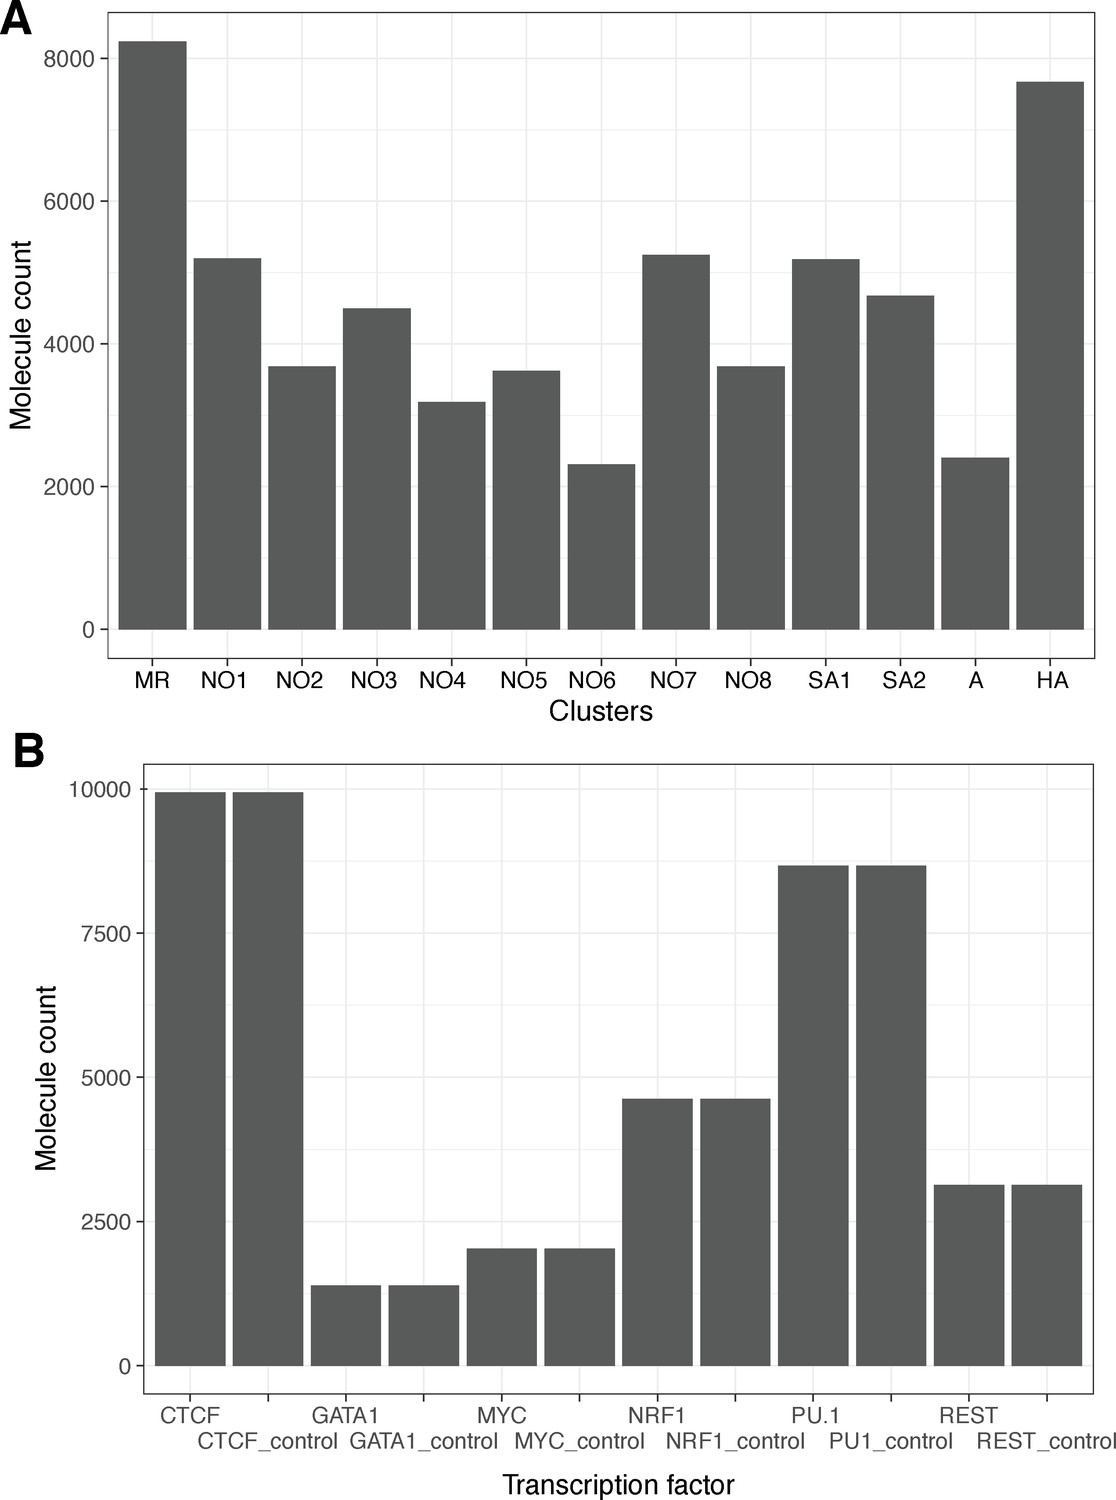
Cluster sizes and numbers of motif-containing molecules for each transcription factor chosen for study.
(A) Leiden cluster sizes for cluster shown in Figure 4. (B) Counts of molecules harboring respective transcription factor binding sites. For each transcription factor, we sampled an equal number of randomly drawn molecules taken from regions GC-/repeat content matched against TF ChIP-seq peaks.
Figure 5 with 1 supplement

TF-centric clusters exhibit significantly different usage of specific ‘registers’ of nucleosome positioning with respect to predicted TF-binding sites.
(A) We performed Fisher’s exact tests to determine relative enrichment and depletion of each cluster for each transcription factor surveyed in Figure 4. Cluster ‘A’ is consistently depleted across control molecules but enriched across molecules containing bona fide transcription factor binding motifs, suggesting that the clusters identified in this study are biologically relevant. Fishers Exact test odds ratios are plotted in heatmap form and all enrichment tests that are statistically significant under a false discovery rate of 10% (q < 0.1) are marked with a black dot. (B) Our data may be explained by the Widom ‘site exposure’ model in vivo. Transcription factor binding motifs are stochastically exposed as nucleosomes toggle between multiple ‘registers’ as seen in Figure 4M (states NO and SA). Transcription factor binding perhaps enforces a favorable nucleosome register (state A), which can then seed hyper-accessible states/further TF-DNA interactions (state HA).
Figure 5—figure supplement 1
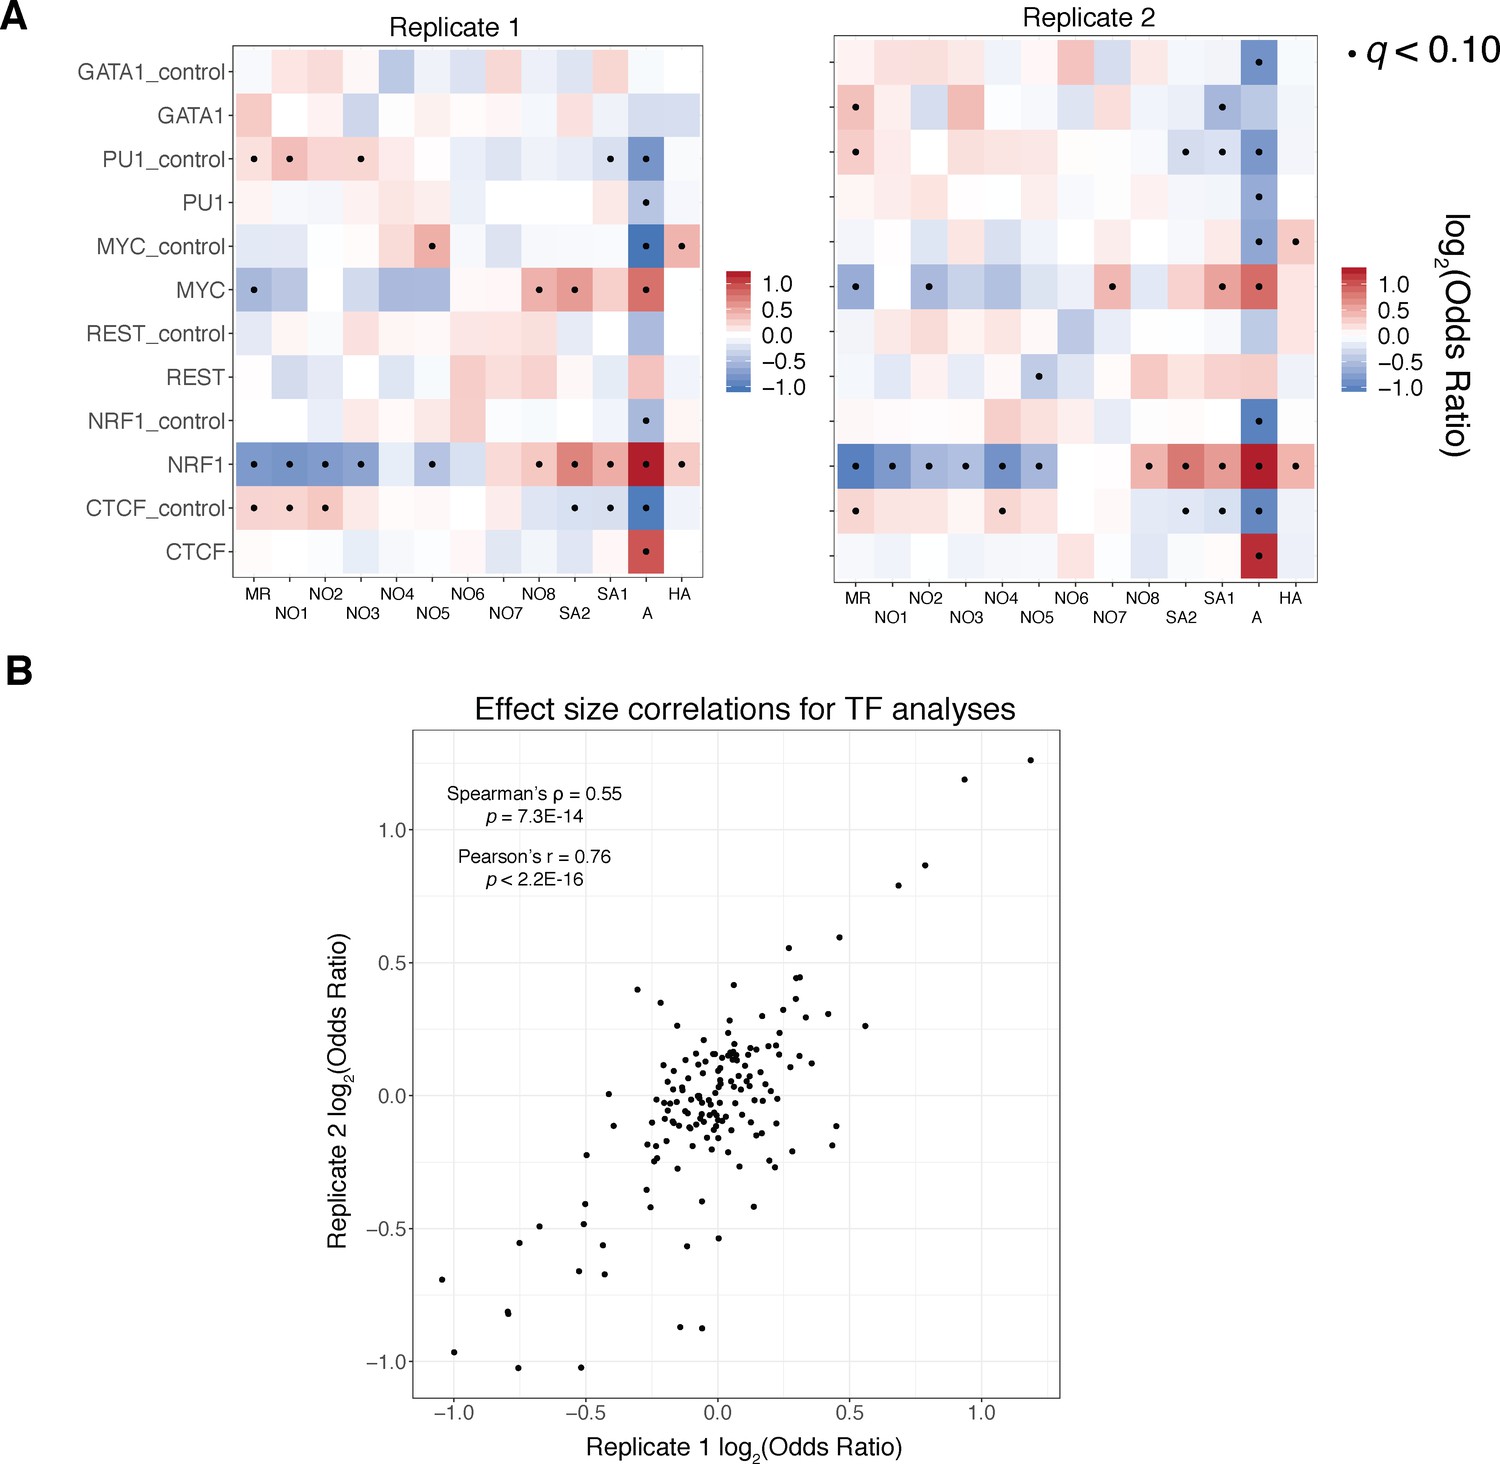
Reproducibility of transcription factor enrichment analyses.
A).) Fisher’s exact test results as visualized in Figure 5A, stratified by replicate demonstrate qualitative reproducibility of our reported findings across replicates. (B).) Scatter plot and associated correlation coefficients and p values (both Pearson’s and Spearman’s tests reported) for replicate 1 and replicate 2 effect sizes demonstrates quantitative concordance of our findings.
Figure 6 with 3 supplements

Human epigenomic states are punctuated by specific oligionucleosome patterns.
A) Histogram representations of the estimated single-molecule NRLs for five different epigenomic domains compared to control sets of molecules matched for GC and repeat content. Inset: Numbers of molecules plotted, median NRL estimates with associated median absolute deviations, and the percent of molecules where a peak could not be detected. (B) Stacked bar chart representation of the relative composition of each epigenomic domain with respect to the seven clusters defined in Figure 3. C. Heterochromatin: constitutive heterochromatin; F. Heterochromatin: facultative heterochromatin. (C). Heatmap of enrichment test results to determine nucleosome conformers that are enriched or depleted for each chromatin state. Tests qualitatively appearing to be chromatin-state specific are highlighted with a black box. Significant tests following multiple hypothesis correction marked with a black dot. Fisher’s Exact Test was used for all comparisons.
Figure 6—figure supplement 1
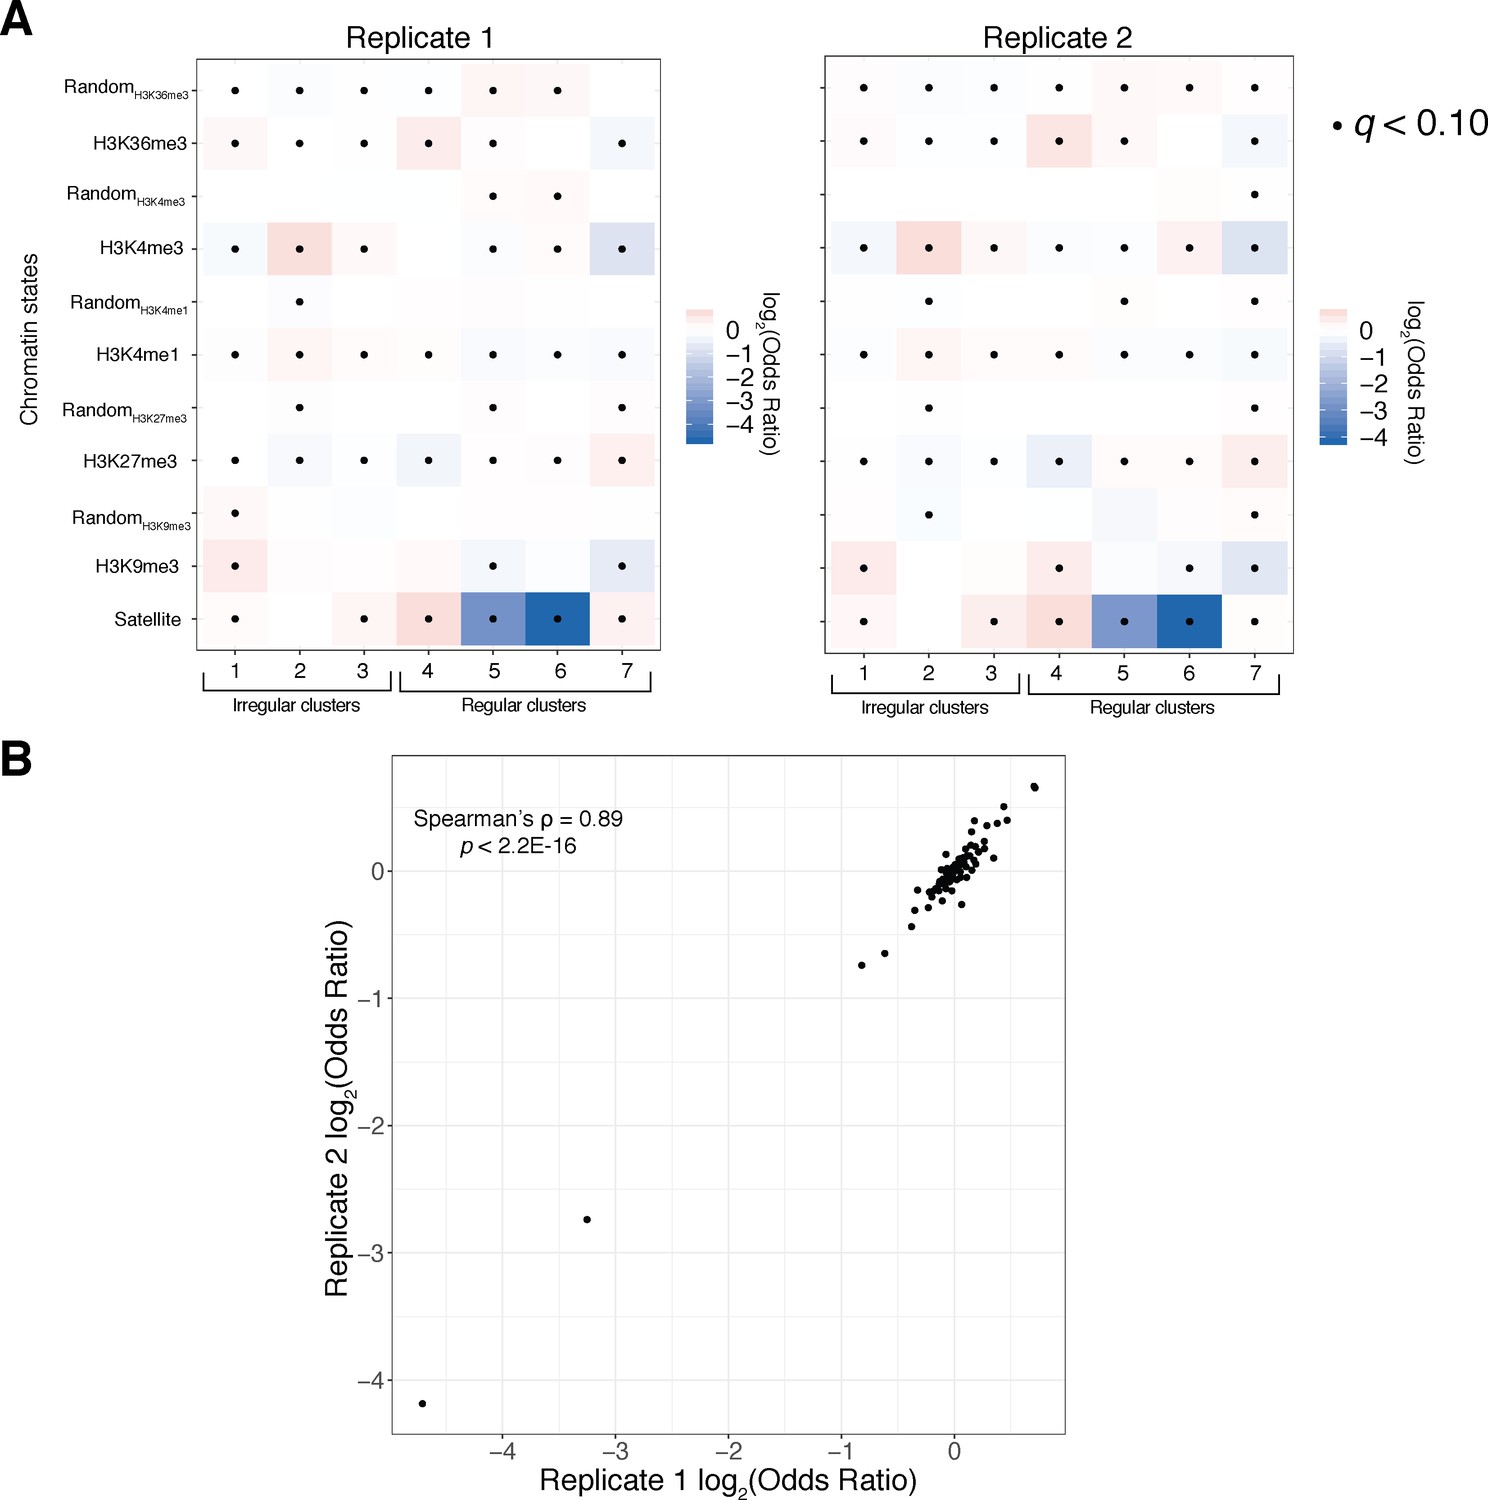
Reproducibility analysis of chromatin state analyses.
(A) Fisher’s exact odds-ratio heatmaps as in Figure 6 for Replicate 1 (left) and Replicate 2 (right) show qualitative agreement in relative cluster sizes/enrichments across replicates. (B) A scatter plot of odds ratios/effect sizes from all Fisher’s exact tests shows strong quantitative agreement of cluster enrichment/depletion across replicates. $$BOX_TXT_START$$. $$BOX_TXT_END$$.
Figure 6—figure supplement 2
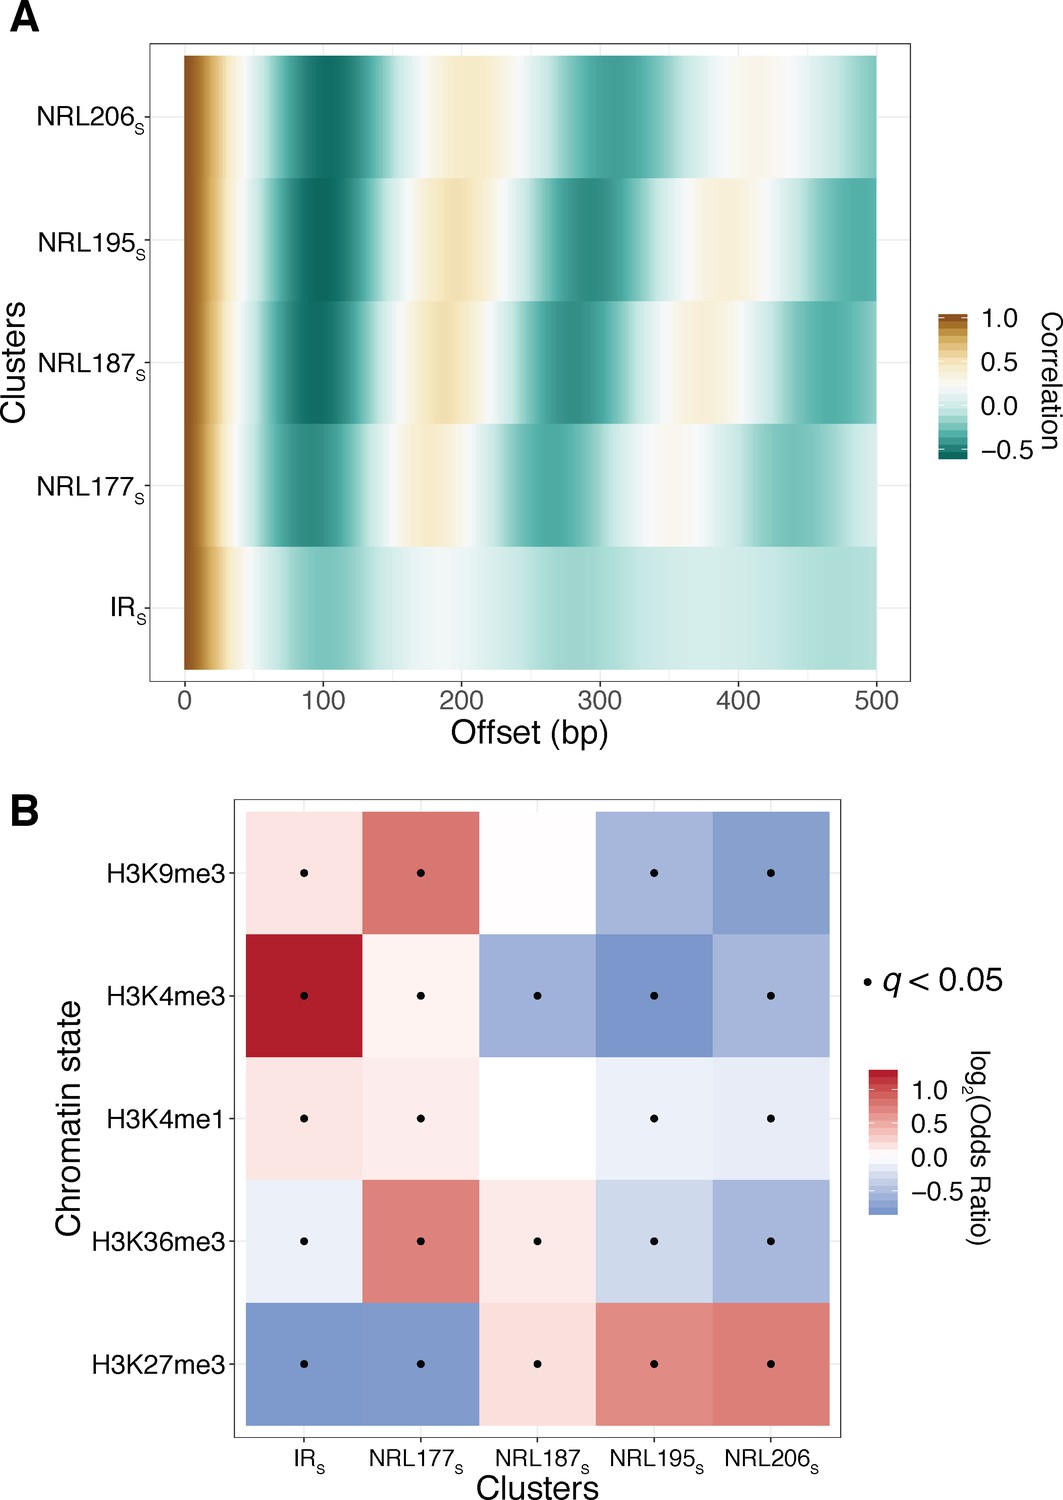
Reanalysis of the Fiber-seq data of Stergachis et al validates SAMOSA-based findings of our initial submission.
A) We obtained and reanalyzed K562 data produced using the Fiber-seq protocol using our analytical pipeline. We clustered fibres based on autocorrelograms using leiden clustering, resulting in five discrete clusters, labeled with the XS notation to distinguish them from clusters defined using SAMOSA data. (B) In agreement with our own SAMOSA-based findings, we find that H3K9me3 decorated chromatin is enriched in irregular chromatin fibres and short NRL fibres, while e.g. H3K27me3 decorated chromatin is enriched for long NRL fibres.
Figure 6—figure supplement 3
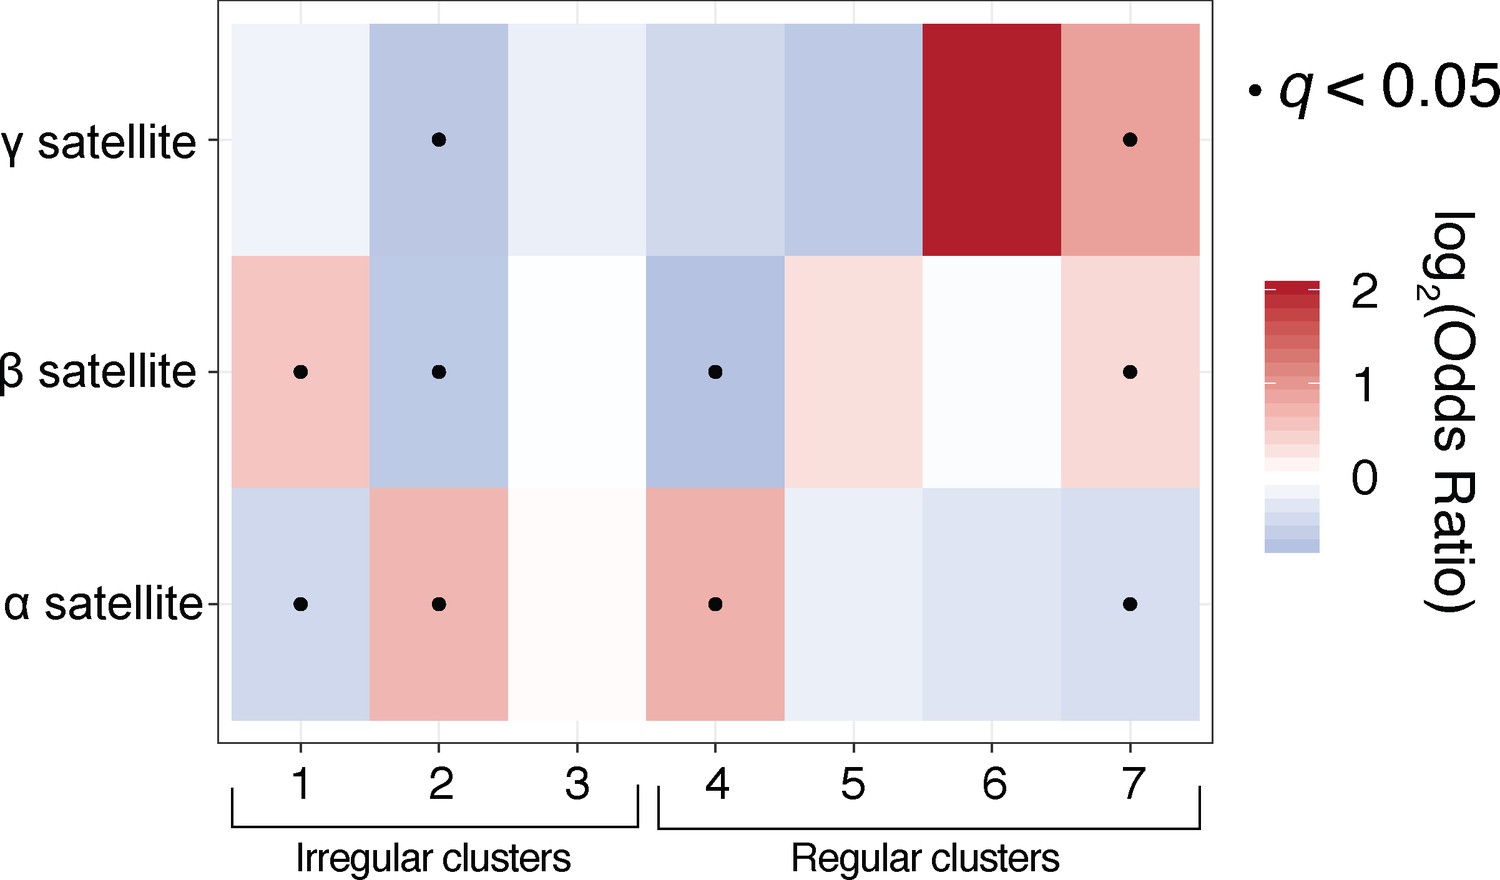
Satellite-specific chromatin analyses reveal differences between fibre-usage across H3K9me3-positive and H3K9me3-negative satellite repeats.
Fisher’s exact analyses for the ‘Satellite’ category studied in Figure 6. Irregular fibres are enriched in alpha- and beta-satellite sequence, both of which are predicted to harbor H3K9-methylated nucleosomes. Gamma satellite, which is typically not H3K9-methylated (Kim et al., 2009), is only enriched for chromatin fibres with estimated long NRLs.
Additional files
Download links
A two-part list of links to download the article, or parts of the article, in various formats.
Downloads (link to download the article as PDF)
Open citations (links to open the citations from this article in various online reference manager services)
Cite this article (links to download the citations from this article in formats compatible with various reference manager tools)
Massively multiplex single-molecule oligonucleosome footprinting
eLife 9:e59404.
https://doi.org/10.7554/eLife.59404


