Homeostatic plasticity in the retina is associated with maintenance of night vision during retinal degenerative disease
- Gavin Herbert Eye Institute, Department of Ophthalmology, University of California, Irvine, United States
- John A. Moran Eye Center, Department of Ophthalmology and Visual Sciences, University of Utah, United States
- Departments of Physiology and Biophysics, and Chemistry, University of California, Irvine, United States
Figures
Figure 1 with 1 supplement
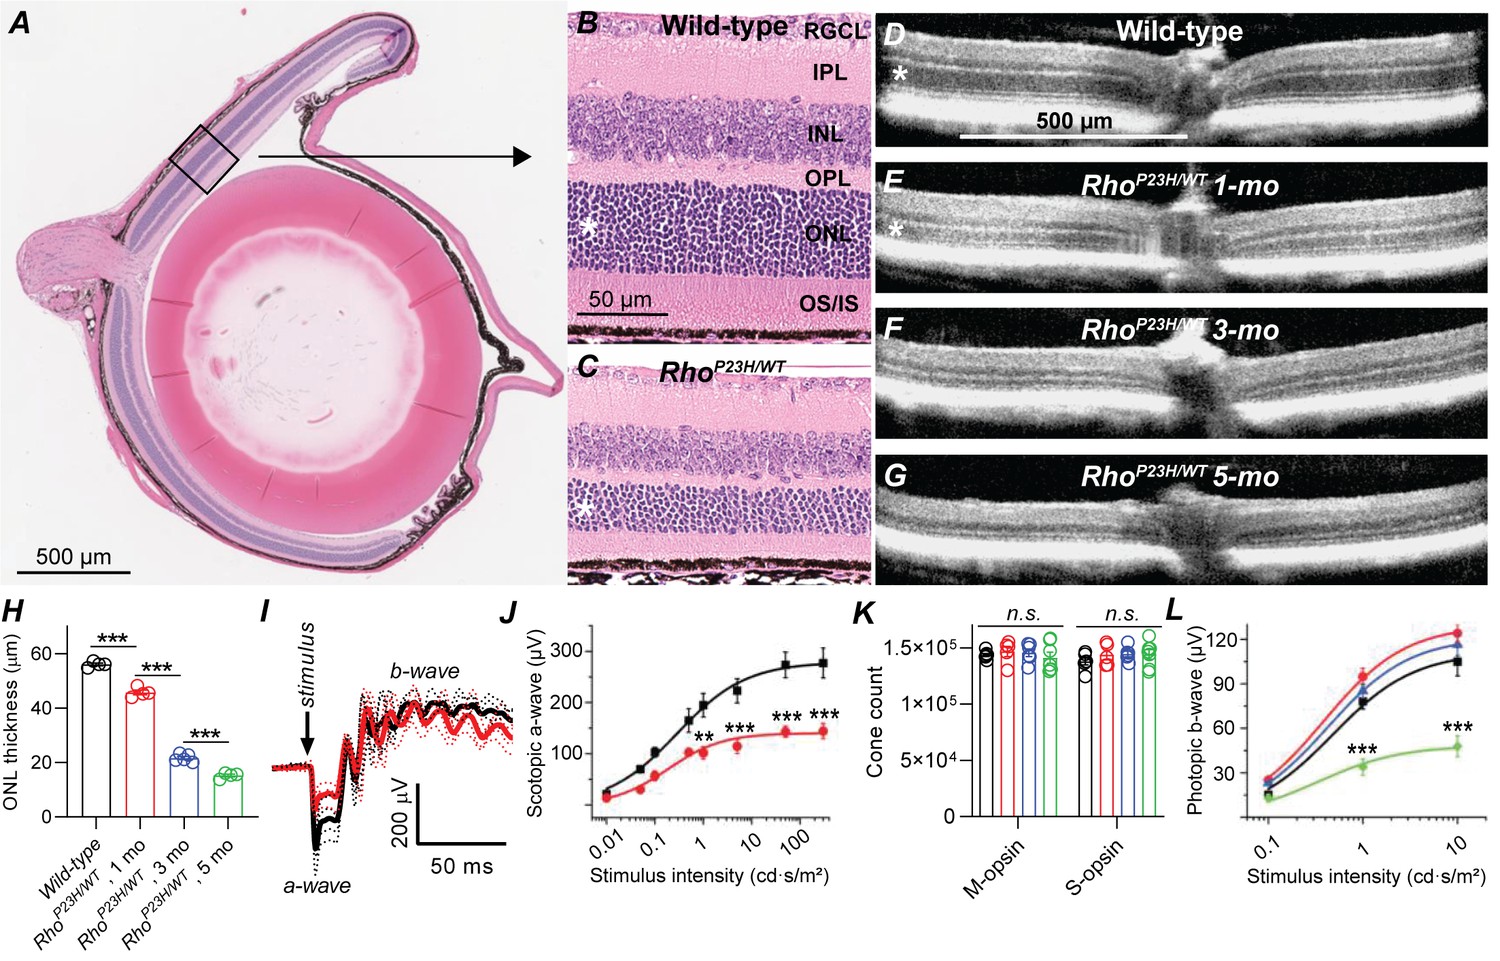
Characterization of retinal degeneration progression in heterozygote P23H rhodopsin-mutated mice.
(A) Representative histology image of a wild-type (WT) mouse eye. (B–C) Representative magnified histology images of 1-month-old WT (B) and P23H (C) dorsal retinas. Asterisks mark the ONL, i.e. photoreceptor nuclei layer. RGCL, retinal ganglion cell layer; IPL, inner plexiform layer; INL, inner nuclear layer; OPL, outer plexiform layer (the site of photoreceptor-bipolar cell synapse); IS/OS, photoreceptor inner and outer segments. (D–G) Representative optical coherence tomography images. (H) ONL thickness analysis from central retina (WT, black, n = 4; P23H one mo, red, n = 4; P23H three mo, n = 5; P23H five mo, green, n = 4 mice). (I) Scotopic ERG waveforms in response to 100 cd•s/m2 flash in 1-month-old WT (black) and P23H (red) mice (WT, black, n = 4 (8); P23H, red, n = 4 (8) mice(eyes)). (J) ERG a-wave amplitude analysis at 1 month of age. (K) Total M- and S-opsin counts in whole mount retinas (WT, black, n = 6; P23H one mo, red, n = 5; three mo, blue, n = 6; five mo, green, n = 7 mice) (L) Photopic ERG b-wave amplitude analysis (WT, black, n = 6 (12); P23H one mo, red, n = 8 (16); three mo, blue, n = 7 (14); five mo, green, n = 5 (10) mice(eyes)). Bonferroni post hoc tests: *p<0.05, **p<0.01, ***p<0.001.
-
Figure 1—source data 1
Average central ONL thickness (H), scotopic ERG a-wave amplitude (J), whole retina M- and S-cone count (K) and photopic b-wave amplitude (L) for individual mice.
- https://cdn.elifesciences.org/articles/59422/elife-59422-fig1-data1-v2.xlsx
Figure 1—figure supplement 1
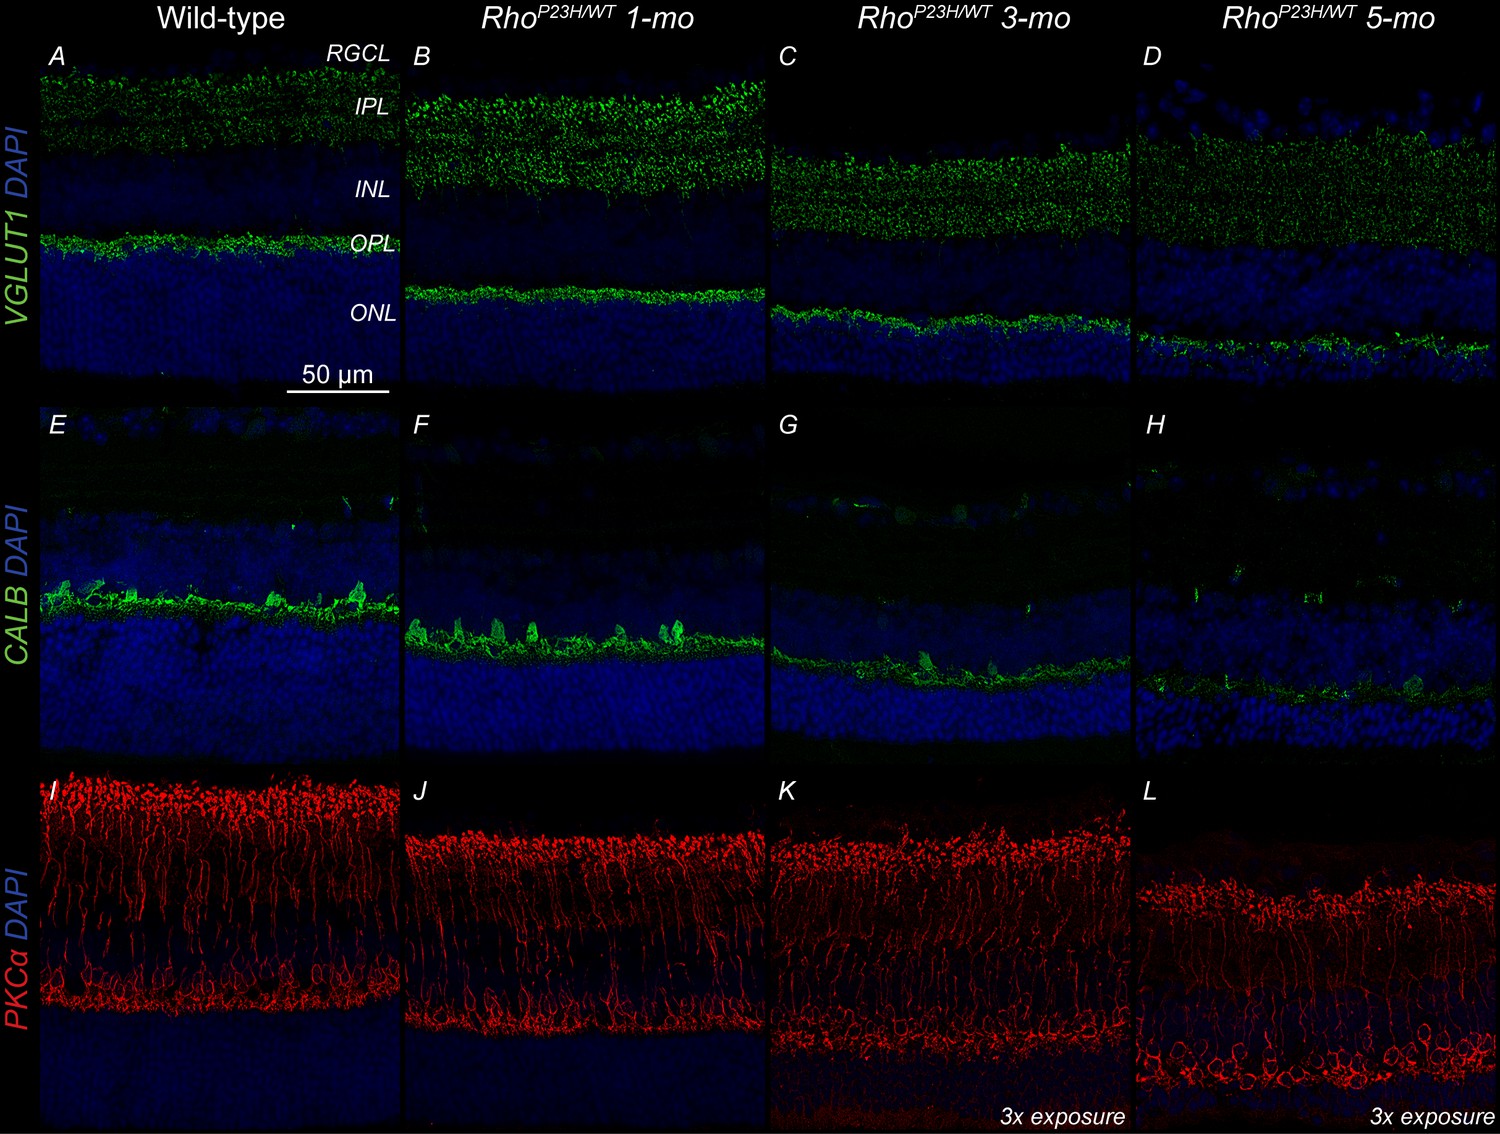
Progressive outer retina degeneration in P23H mice.
(A–D) Vesicular glutamate transporter 1 (VGLUT1) staining appears normal at 1-month-old P23H retinas. Instead, VGLUT1 puncta at outer plexiform layer (OPL, the site of photoreceptor-interneuron synapses) is somewhat decreased at 3 months and prominently at 5 months of age. (E–H). Horizontal cell marker calbindin shows similar decreasing immunoreactivity pattern as VGLUT1. (I–L) Rod bipolar cell (RBC) marker protein kinase C alpha (PKCα) shows normal macrostructure up to 3 months of age; however, immunoreactivity is clearly decreased (note, images K-L were obtained with three times higher exposure time compared to I-J). At 5 months of age, the RBC somata appear less in density. Three biological replicates per group were inspected. All images have the same size and aspect ratio.
Figure 2
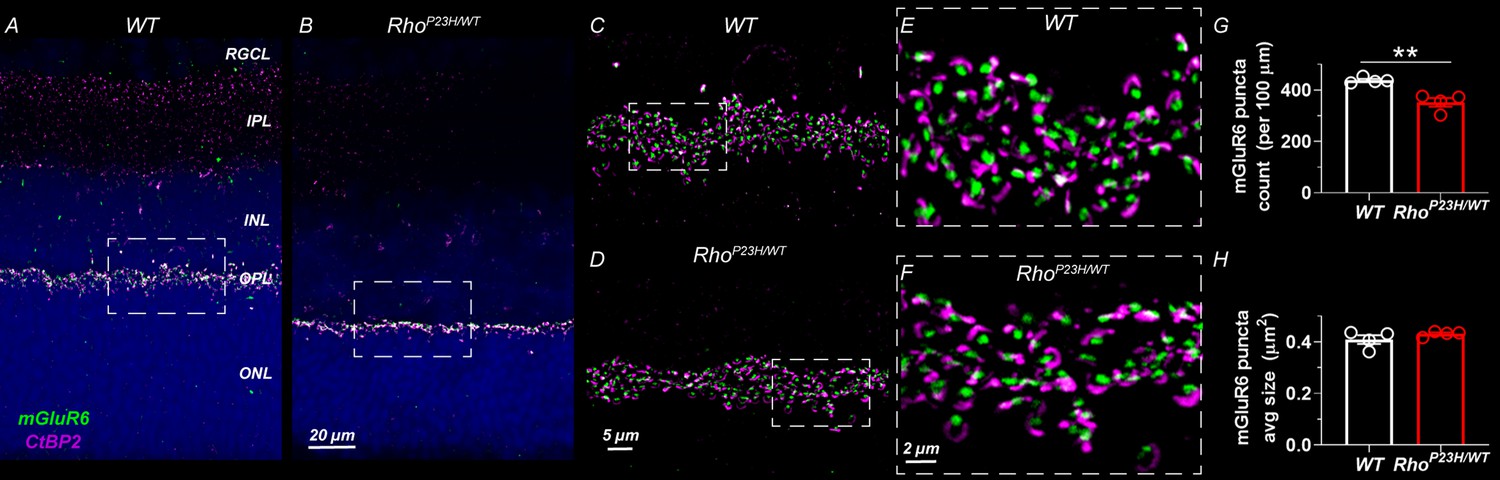
Decreased number of photoreceptor-bipolar cell synapses in 1-month-old P23H mouse retinas.
(A) Representative sections of wild-type and (B) P23H mouse retinas stained with mGluR6 (green) and CtBP2 (magenta) antibodies that stain the postsynaptic and presynaptic compartments at the photoreceptor-bipolar cell synapse, respectively. Images A and B were acquired with 40x objective. Dashed line boxes show where images C-D acquired with 100x objective were taken. E and F are 3x digital zoom images from C-D (dashed line boxes show zoomed location). The photoreceptor-to-bipolar cell synapses show normal appearance in P23H retinas; however, the count is moderately decreased as shown in graph G. (H) Average mGluR6 puncta size is comparable in WT and P23H retinas. Four biological replicates and five technical replicates in each were inspected per group. mGluR6 puncta parameters were averaged of five technical replicates per sample. T-test: **p<0.01.
-
Figure 2—source data 1
Average mGluR6 puncta count per 100x30 μm2 counting window (G) and average mGluR6 puncta size (H) for individual mice.
- https://cdn.elifesciences.org/articles/59422/elife-59422-fig2-data1-v2.xlsx
Figure 3 with 5 supplements
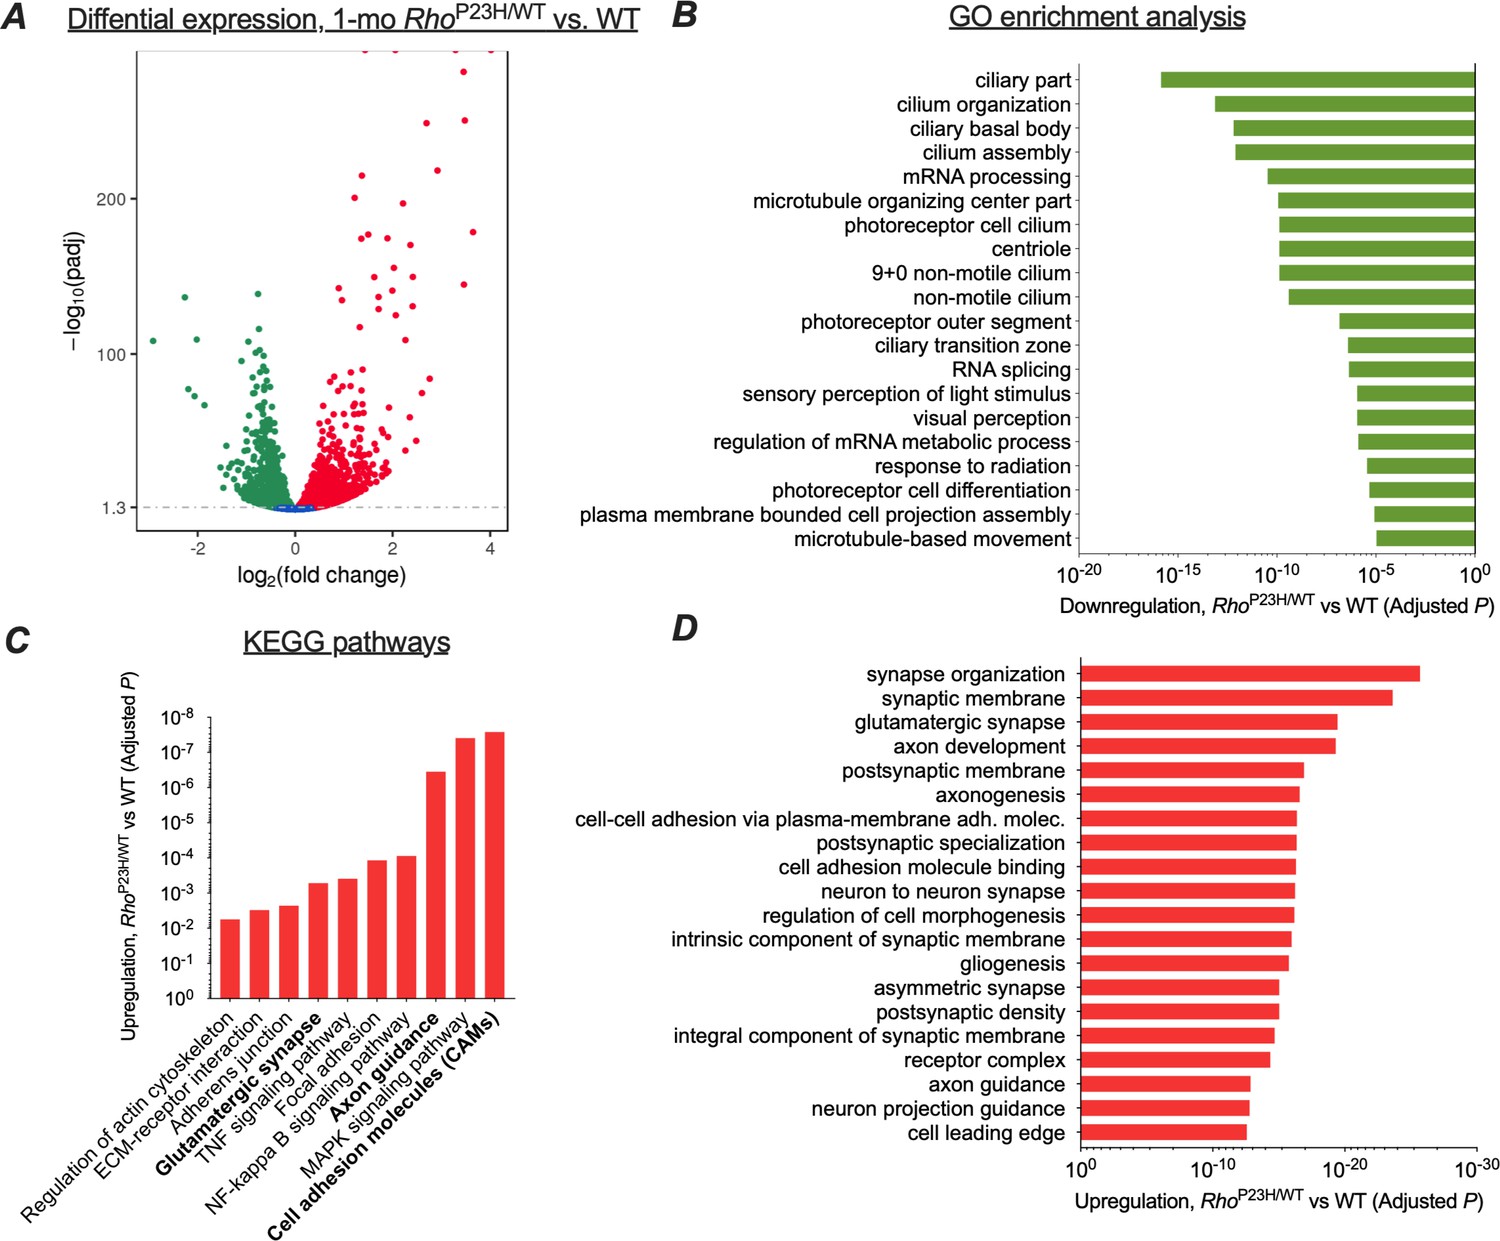
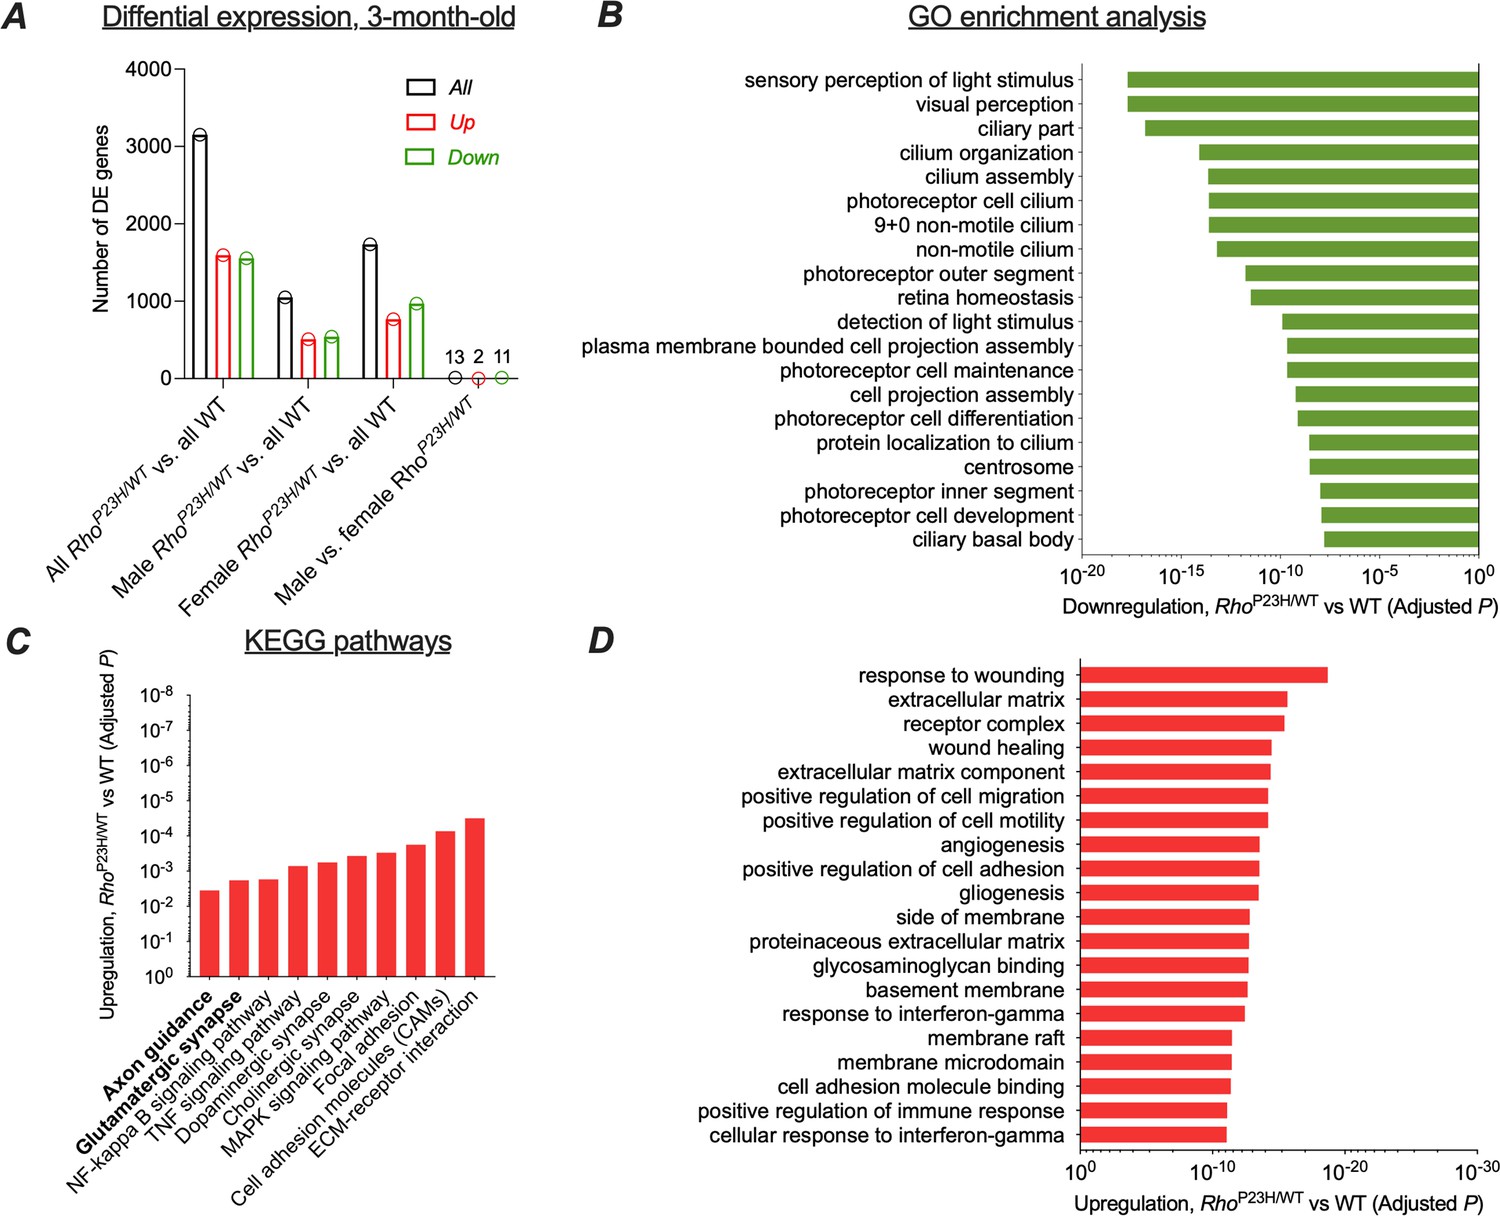
Transcriptomic analysis shows neural network adaptation to rod death in early stage retinitis pigmentosa.
RNA-sequencing was performed from whole retinal extracts at 1 month of age in P23H mice (n = 7) and WT (n = 7) littermates. (A) A total of 5404 transcripts showed differential expression (downregulation, green; upregulation, red) between P23H and WT retinas. (B) Gene ontology (GO) term analysis shows expected downregulation in photoreceptor-dominant gene clusters. (C) KEGG analysis shows significant enrichments in cell/neuron adhesion and growth pathways, glutamatergic synapse formation and several pathways associated with both cell stress and synaptic plasticity. (D) GO term analysis illustrates the most significant upregulation in synaptic and neural development and growth pathways in P23H retinas.
Figure 3—figure supplement 1
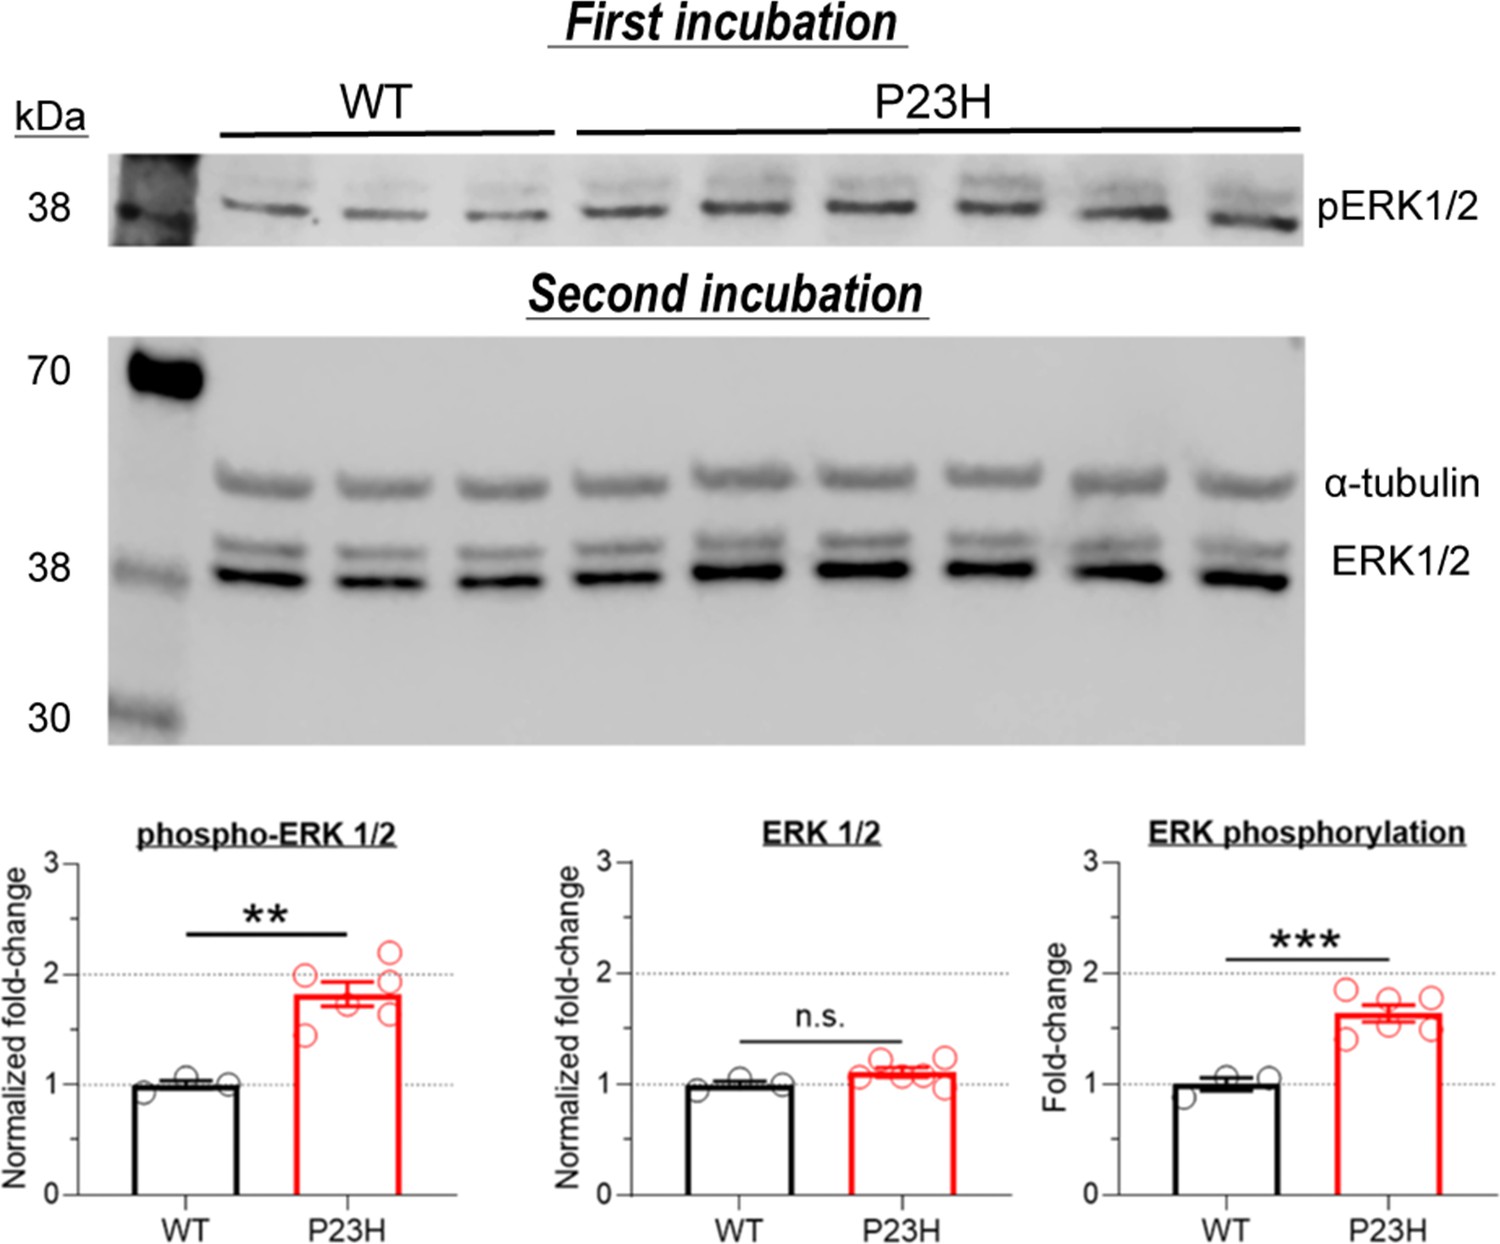
Activation of mitogen-activated protein kinase (MAPK) pathway in P23H retinas.
Samples were collected at 1 month of age. Phospho-ERK was first detected using 680 nm fluorescence acquisition. The same membrane was incubated a second time using anti-ERK and anti α-tubulin (loading control) antibodies and detected using 800 nm fluorescence acquisition. MAPK activation is indicated by the increased ERK phosphorylation level. T-test: **p<0.01, ***p<0.001.
-
Figure 3—figure supplement 1—source data 1
Immunoblot band intensities for a-tubulin, ERK1/2 and phospho-ERK1/2.
- https://cdn.elifesciences.org/articles/59422/elife-59422-fig3-figsupp1-data1-v2.xlsx
Figure 3—figure supplement 2
Response to cell stress overwhelms retinal transcriptomic pathway regulation in intermediate stage retinitis pigmentosa.
Whole retinal extracts from 3-month-old P23H (n = 4) and WT (n = 3) littermate mice were used. (A) Number of differentially expressed genes with an adjusted p<0.05 as a threshold criterion. (B) GO pathway analysis shows progressed downregulation in photoreceptor function-dominant gene clusters. (C) KEGG analysis shows most significant enrichments in extracellular matrix receptor interactions and cell adhesion pathways, and glutamatergic synapse- and axon guidance-associated pathways continue to be significantly upregulated. (D) GO pathway analysis reveals strongest pathway regulation associated with cell stress and growth. Note that this is notably different compared to results obtained at early disease state (refer to main Figure 1D).
Figure 3—figure supplement 3
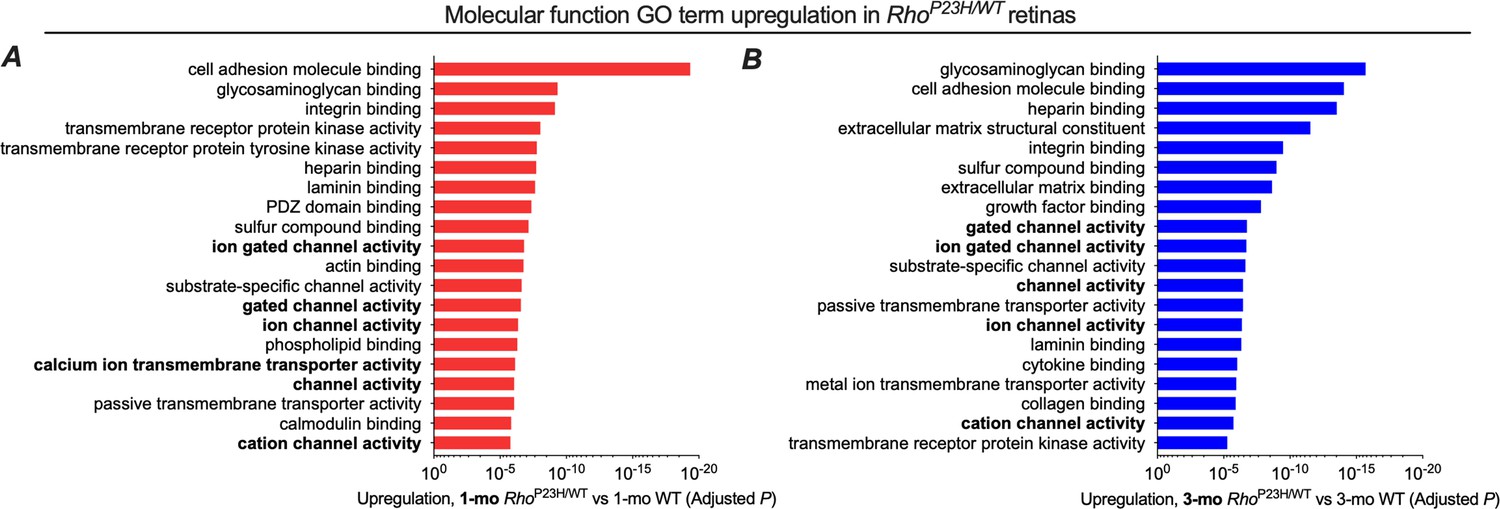
Top 20 list of GO molecular function terms is similar between 1- and 3-month-old retinas.
Cell growth-related pathways show the strongest upregulation followed by ion channel activity-associated pathways both at 1-month (A) and 3-month-old (B) retinas.
Figure 3—figure supplement 4
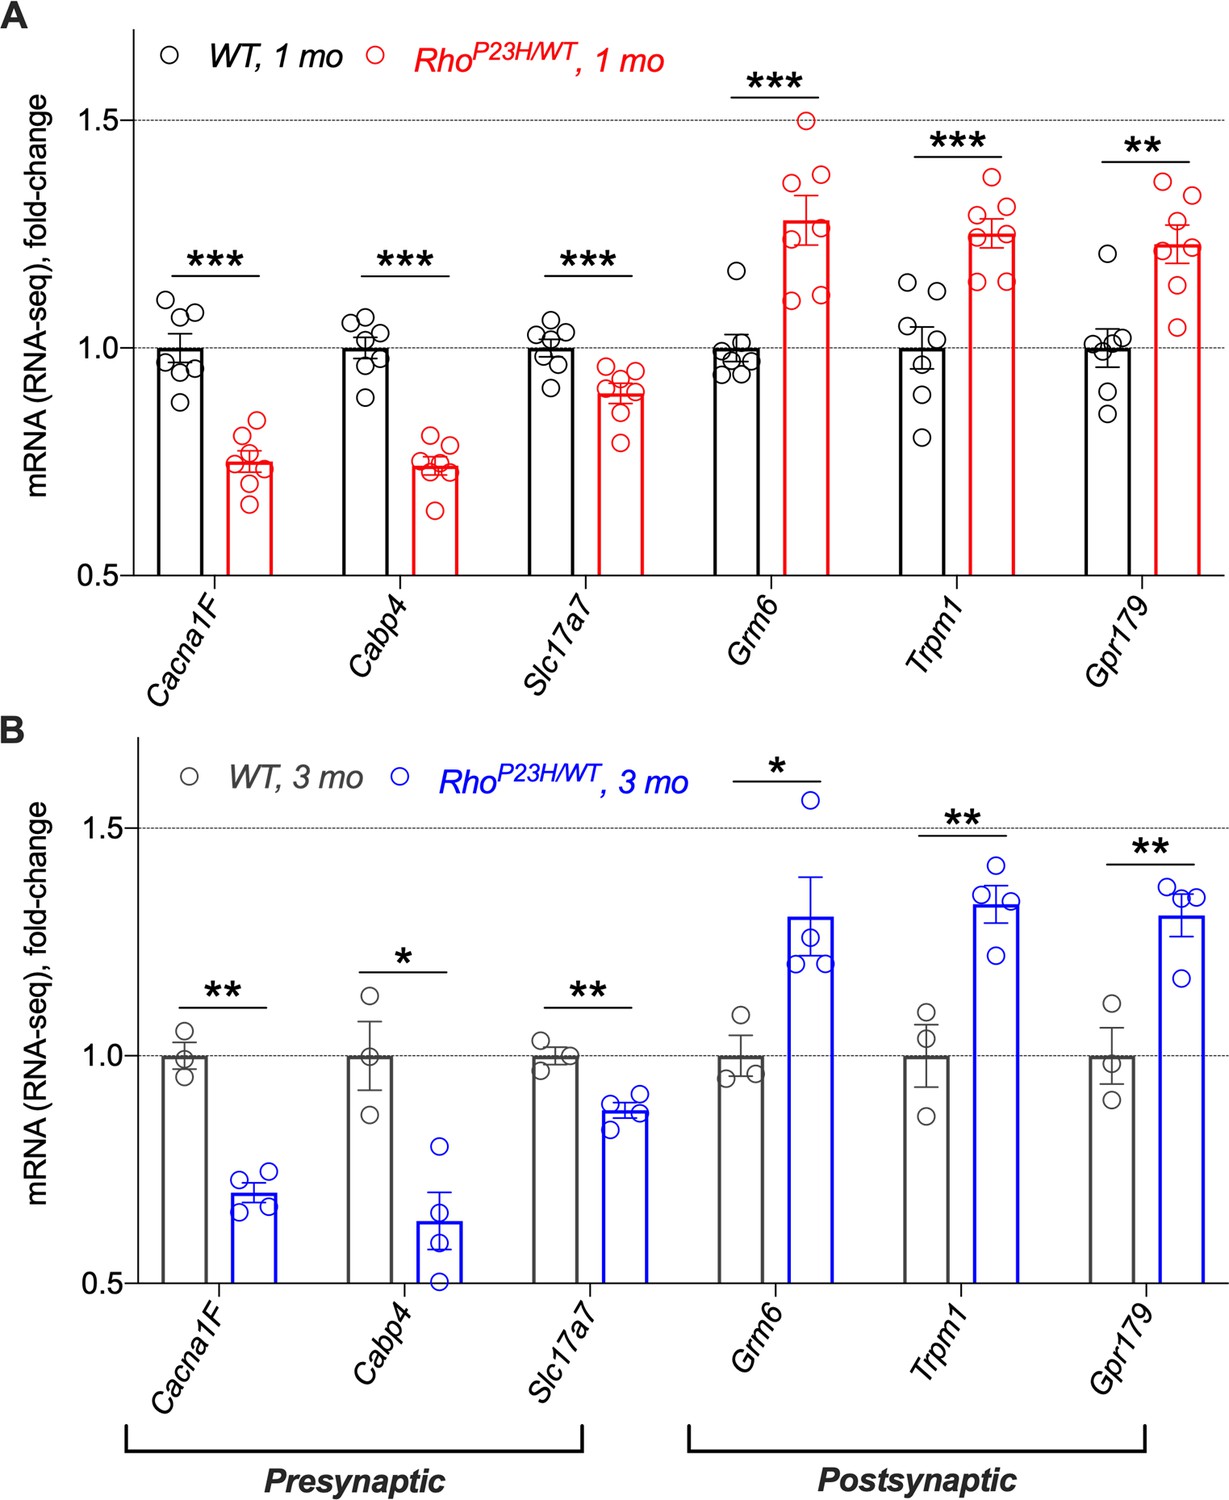
P23H retinas show opposing and persistent mRNA expression regulation in genes required for synaptic transmission in pre- versus postsynaptic sites.
EData was obtained from 1-month-old (A) and 3-month-old (B) mice. Expression levels were obtained from FPKM reads. Data are normalized to WT values at 1.0. Note that the decreased mRNA expression of presynaptic genes is likely a consequence of photoreceptor loss in whole retina extracts. Cacna1F encodes Cav1.4 calcium channel, Cabp4 encodes calcium-binding protein that interacts with Cav1.4, and Slc17a7 encodes vesicular glutamate transporter vGlut1. Grm6 encodes metabotropic glutamate receptor 6 (mGluR6), Trpm1 encodes transient receptor potential cation channel subfamily M member 1, and Gpr179 encodes an orphan G protein-coupled receptor GPR179. mGluR6, TRPM1 and GPR179 are required for normal depolarization at ON bipolar cells. Multiple comparisons corrected t-tests: *p<0.05, **p<0.01, ***p<0.001.
Figure 3—figure supplement 5
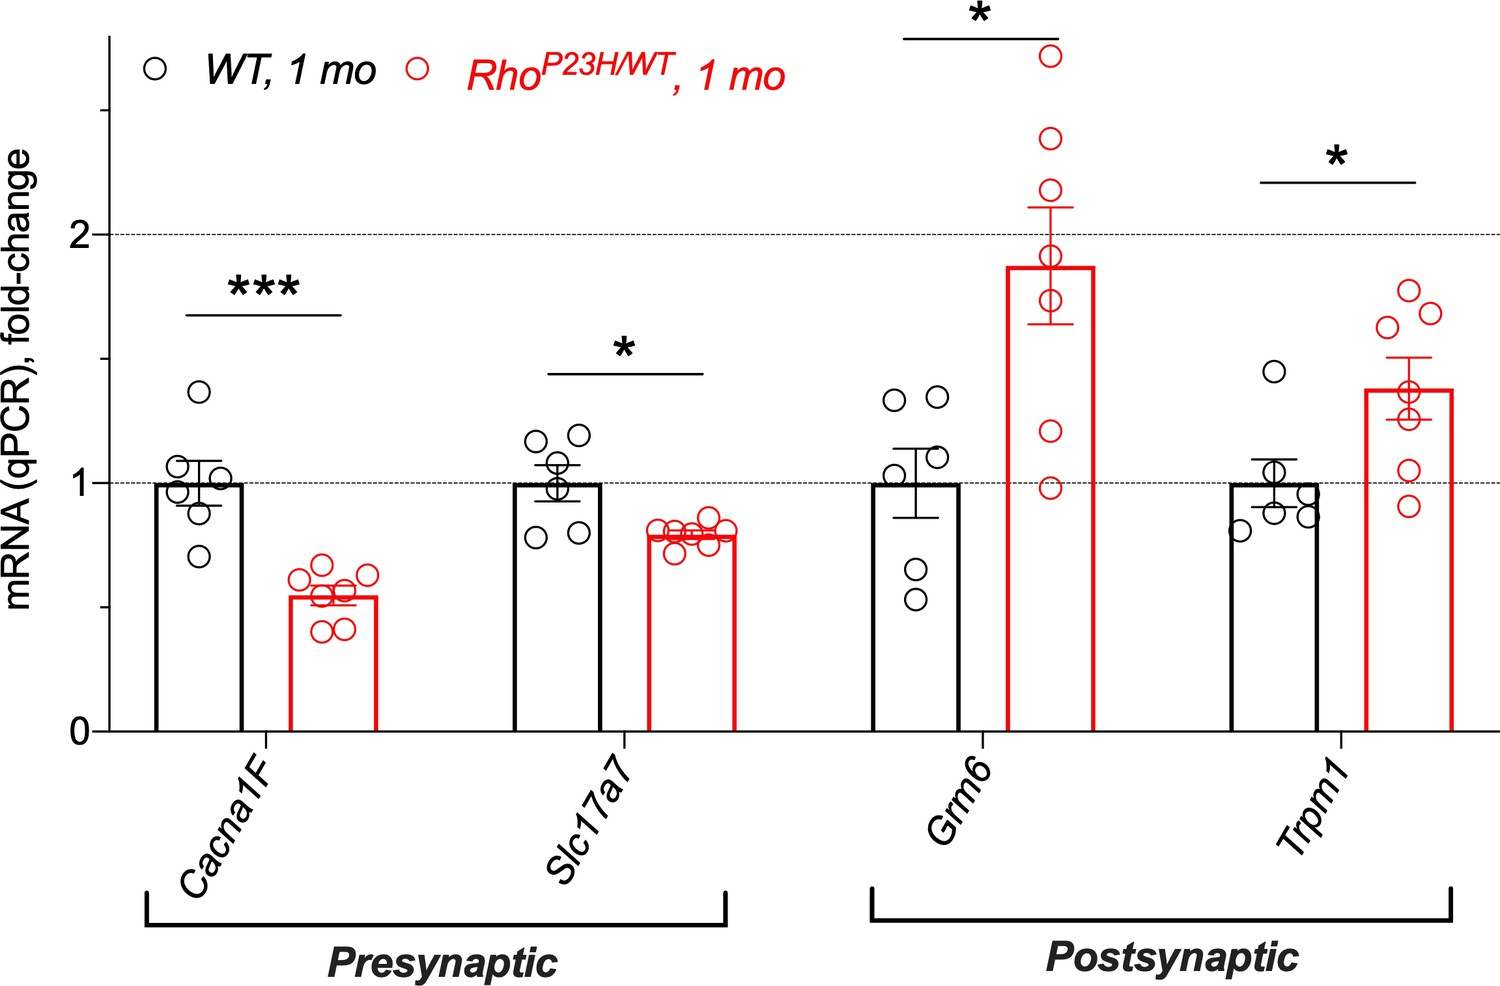
A subset of important gene regulations was confirmed in 1-month-old retinas by qPCR.
Expression levels were obtained using the ΔΔCt method. Data is normalized to WT values at 1.0. Multiple comparisons corrected t-tests: *p<0.05, ***p<0.001.
-
Figure 3—figure supplement 5—source data 1
Primary qPCR parameters for each technical and biological replicate.
- https://cdn.elifesciences.org/articles/59422/elife-59422-fig3-figsupp5-data1-v2.xlsx
Figure 4
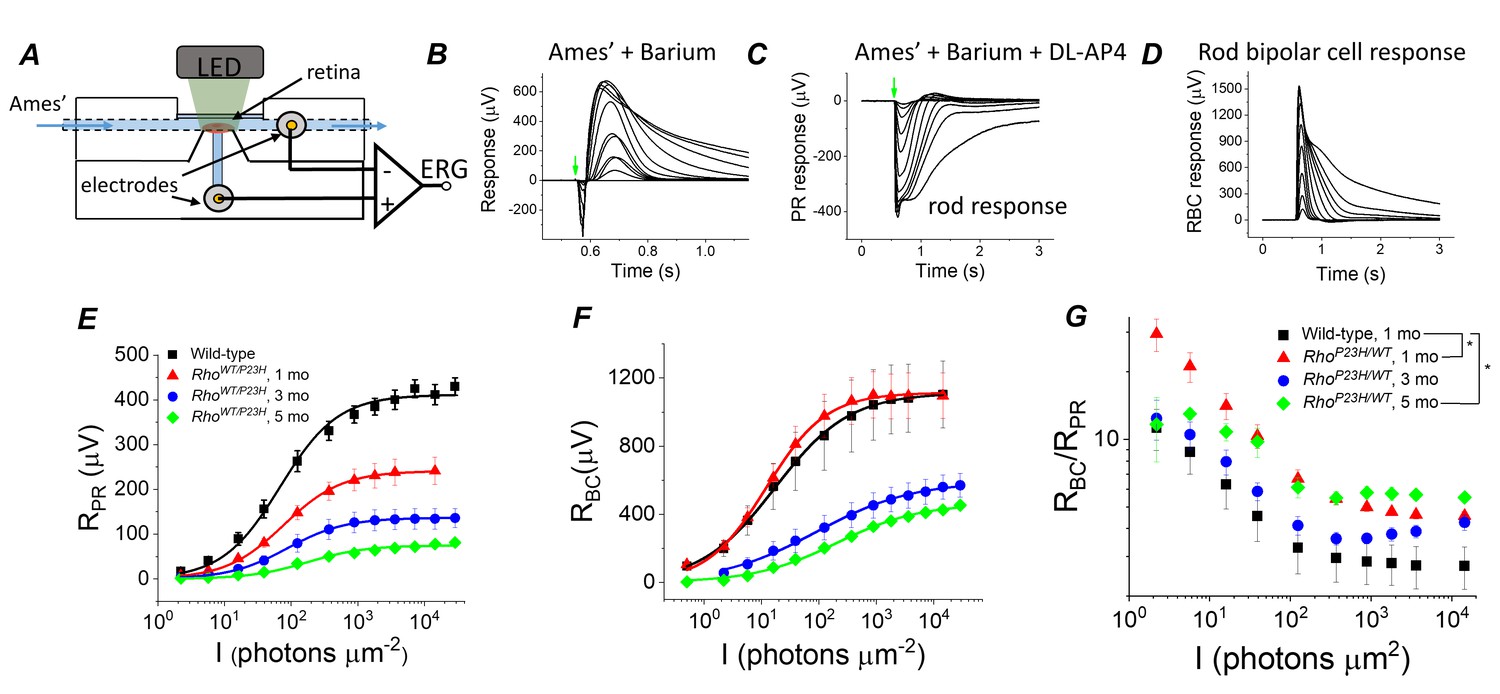
Sensitivity of bipolar cell responses to their photoreceptor input increases in P23H mice.
(A) Custom ex vivo ERG specimen holder used to record transretinal voltage with two Ag/AgCl macro electrodes. Isolated retina without retinal pigment epithelium is mounted photoreceptor side up and perfused with Ames’ medium. (B) Representative light flash responses from a dark-adapted WT control mouse retina perfused with Ames' containing 100 µM BaCl2 to remove signal component arising from Müller cells. (C) Light responses from the same retina after addition of DL-AP4 eliminating metabotropic glutamatergic transmission to reveal the photoreceptor-specific responses. (D) Bipolar cell responses obtained by subtracting the traces shown in (C) from those in (B). Amplitude data for photoreceptor (RPR, E) and bipolar (RBC, F) responses, and RBC/RPR ratio (G) as a function of light flash intensity in photons μm−2 (505 nm). Mean ± SEM. In panel G, *p<0.05 (two-way ANOVA between-subjects effect). Smooth traces in E and F plot Equation 1 fitted to the mean amplitude data. Statistics for Rmax and intensity required to generate half-maximal photoreceptor or ON bipolar cell response (I1/2) are in Table 1. (Control, one mo, n = 4; P23H, one mo, n = 4; three mo, n = 3; five mo, n = 4 mice/retinas).
-
Figure 4—source data 1
Photoreceptor (RPR, E) and bipolar cell (RBC, F) amplitude, and RBC/RPR ratio (G) data for individual mice.
- https://cdn.elifesciences.org/articles/59422/elife-59422-fig4-data1-v2.xlsx
Figure 5 with 1 supplement
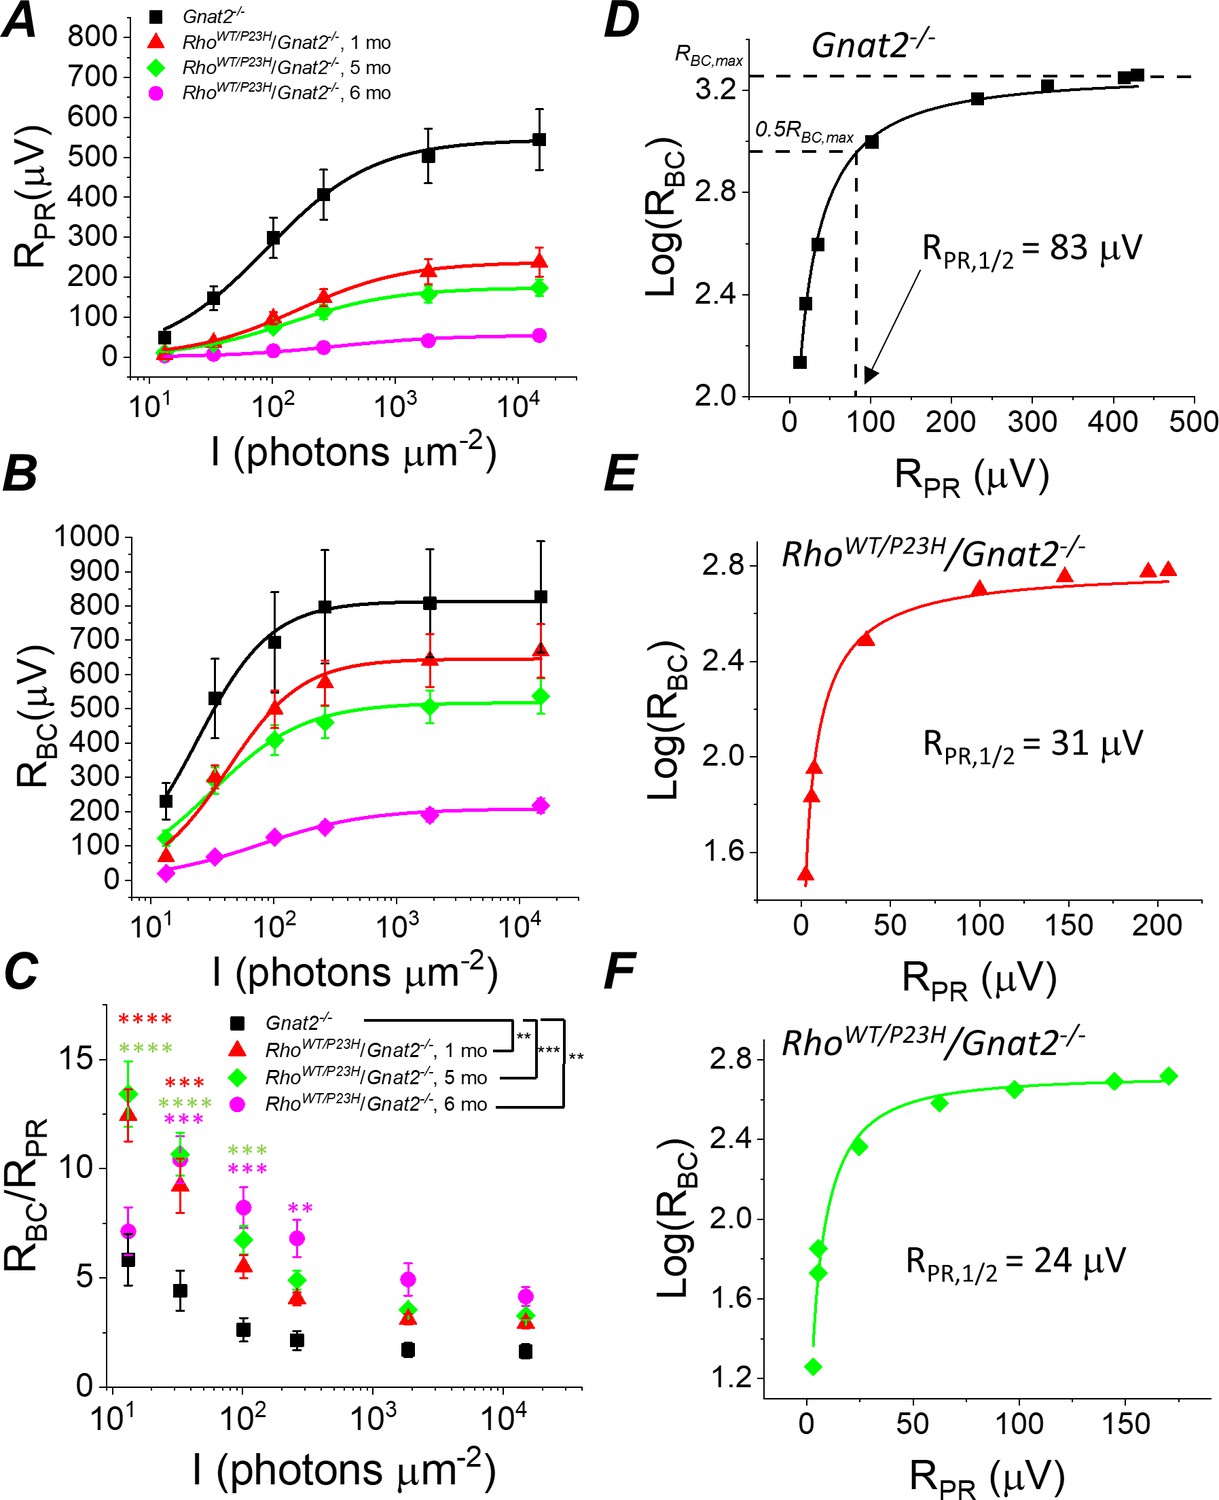
Sensitivity of rod bipolar cell responses to their rod input increases in P23H/Gnat2-/- mice.
Ex vivo ERG rod (A) and RBC (B) response amplitudes, and their ratio (C) derived as in Figure 4. (D–F) RBC plotted as a function of RPR in individual retinas from Gnat2-/- control (D), and one month (E) and five month (F) P23H/Gnat2-/- mice. Smooth lines in A and B plot Equation 1 fitted to mean data. Smooth lines in D-F plot Equation 2 fitted to data from individual retinas. *p<0.05, **p<0.005, ***p<0.001, ****p<0.0001. Statistics for Rmax and intensity required to generate half-maximal rod or RBC response (I1/2) as well as RPR,1/2 are in Table 1. In C, two-way ANOVA followed by Bonferroni’s post hoc test was used to compare between-subjects main effect and the intensity where a significant effect was found, respectively. (Pooled control, 1–6 mo, n = 7 (11); P23H, one mo, n = 4 (6); five mo, n = 11(18); six mo, n = 2 (4) mice(retinas)).
-
Figure 5—source data 1
Photoreceptor (RPR, A) and bipolar cell (RBC, B) amplitude, and RBC/RPR ratio (C) data for individual mice/retinas.
- https://cdn.elifesciences.org/articles/59422/elife-59422-fig5-data1-v2.xlsx
Figure 5—figure supplement 1

Contribution of Müller cell response on the ex vivo ERG light responses in control and P23H mice.
Light responses to identical flash of light in the absence of BaCl2 (A), in the presence of 100 μM BaCl2 (B) and Müller cell response (slow PIII) derived by subtracting the response in B from that shown in A (C). Mean (± SEM) b-wave amplitudes as a function of light flash intensity in the absence (D) and presence (E) of BaCl2 in 1-month-old control Gnat2-/- (black) and P23H/Gnat2-/- (red) mice. (F) Slow P-III amplitudes plotted as a function of light flash intensity in control and P23H mice. (Control, n = 5 (8); P23H, n = 8 (12) mice(retinas)). No differences between control and P23H mouse means in D and E. A statistically significant group-stimulus intensity interaction was found in F (p<0.01); however, post-hoc test did not reach statistical criterion at any light intensity. Statistical analysis was performed by repeated measures two-way ANOVA followed by Bonferroni’s post hoc test.
-
Figure 5—figure supplement 1—source data 1
Bipolar cell amplitudes in the absence (D) and presence (E) of Barium, and slow-PIII amplitudes (F) for individual mice/retinas.
- https://cdn.elifesciences.org/articles/59422/elife-59422-fig5-figsupp1-data1-v2.xlsx
Figure 6
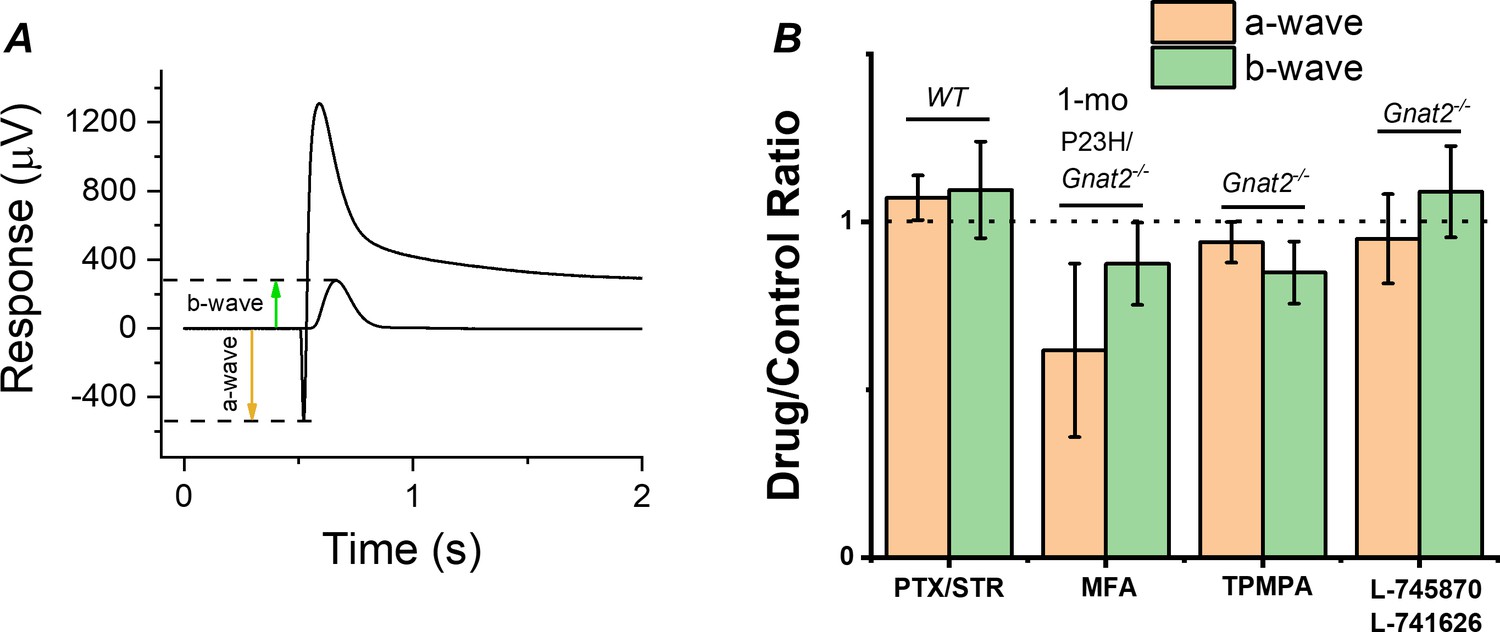
Contribution of gap junctions or inhibitory synaptic inputs to bipolar cells on the photoreceptor and bipolar cell components of the ex vivo ERG signal.
(A) Example traces to dim and bright flashes recorded from a dark-adapted wild-type mouse retina perfused with Ames’ containing 100 µM BaCl2. B-wave amplitudes were measured from baseline using the dim flash responses and a-wave amplitudes from the baseline using the bright flash responses as indicated by arrows. (B) Mean ± SEM a- (brown, a-wavedrug/a-wavecontrol) and b-wave (green, b-wavedrug/b-wavecontrol) ratios determined from the each individual retina perfused with control solution and solution containing 100 µM of the gap junction blocker meclofenamic acid (MFA), 100 µM of picrotoxin (PTX) and 10 µM strytchinine (STR), 10 µM of the dopamine D2 and D4 receptor antagonists L-745870 and L-741626, respectively, or 50 µM the GABAC receptor antagonist (1,2,5,6-Tetrahydropyridin-4-yl)methylphosphinic acid (TPMPA). Mouse genotypes for each drug experiment is indicated in Figure. No statistically significant changes in a- or b-wave amplitudes was observed with any of the drugs tested by paired t-test. n = 6 retinas for PTX/STR, n = 3 retinas for each MFA, TPMPA, and L-745870/L741626 experiments.
-
Figure 6—source data 1
Ratios of ex vivo ERG a-wave and b-wave amplitudes measured from individual retinas perfused in drug vs. control media (B).
- https://cdn.elifesciences.org/articles/59422/elife-59422-fig6-data1-v2.xlsx
Figure 7 with 1 supplement

Visual contrast sensitivity (CS) mediated by rods is not severely compromised in P23H/Gnat2-/- mice up to 5 months of age.
(A) Mouse contrast sensitivity threshold was tested using an optomotor reflex test and infrared visualization of the mouse head movement and cylindrical neutral density filters around the mouse platform. Contrast sensitivity was compared between RhoWT/P23H/Gnat2-/- and their age-matched Gnat2-/- littermate mice from dim scotopic up to mesopic/photopic conditions at 1 (B), 3 (C), and 5/6 (D) month of age. Smooth lines plot Hill-type Equation 3 fitted to mean data points. *p<0.05, **p<0.005, ***p<0.001, two-way ANOVA followed by Bonferroni’s post-hoc test. (Control, 2–3 mo, n = 6 (24); P23H, two mo, n = 11(12); P23H, three mo, n = 6 (13); control, 5–6 mo, n = 9 (17); P23H, five mo, n = 4 (25); P23H, six mo, n = 3 (5) mice(experiments)).
-
Figure 7—source data 1
Contrast sensitivity data from individual experiments measured from control (Gnat2-/-) and P23H/Gnat2-/- mice underlying the graphical data presented B, C and D.
- https://cdn.elifesciences.org/articles/59422/elife-59422-fig7-data1-v2.xlsx
Figure 7—figure supplement 1

Visual contrast sensitivity (CS) is not compromised in P23H/C57 mice up to 5 months of age.
Contrast sensitivity threshold in dim (scotopic), mesopic and photopic ambient light measured as shown in Figure 7 plotted for control (3–5 mo, black), and their littermate 3-month (red) and 5-month RhoWT/P23H mice. No statistically significant differences between control and P23H were found by two-way ANOVA (Control, 3–5 mo, n = 5 (5); P23H, three mo, n = 4 (4); P23H, five mo, n = 5 (6) mice(experiments)).
-
Figure 7—figure supplement 1—source data 1
SContrast sensitivity data from individual experiments measured from control (C57) and P23H mice.
- https://cdn.elifesciences.org/articles/59422/elife-59422-fig7-figsupp1-data1-v2.xlsx
Figure 8
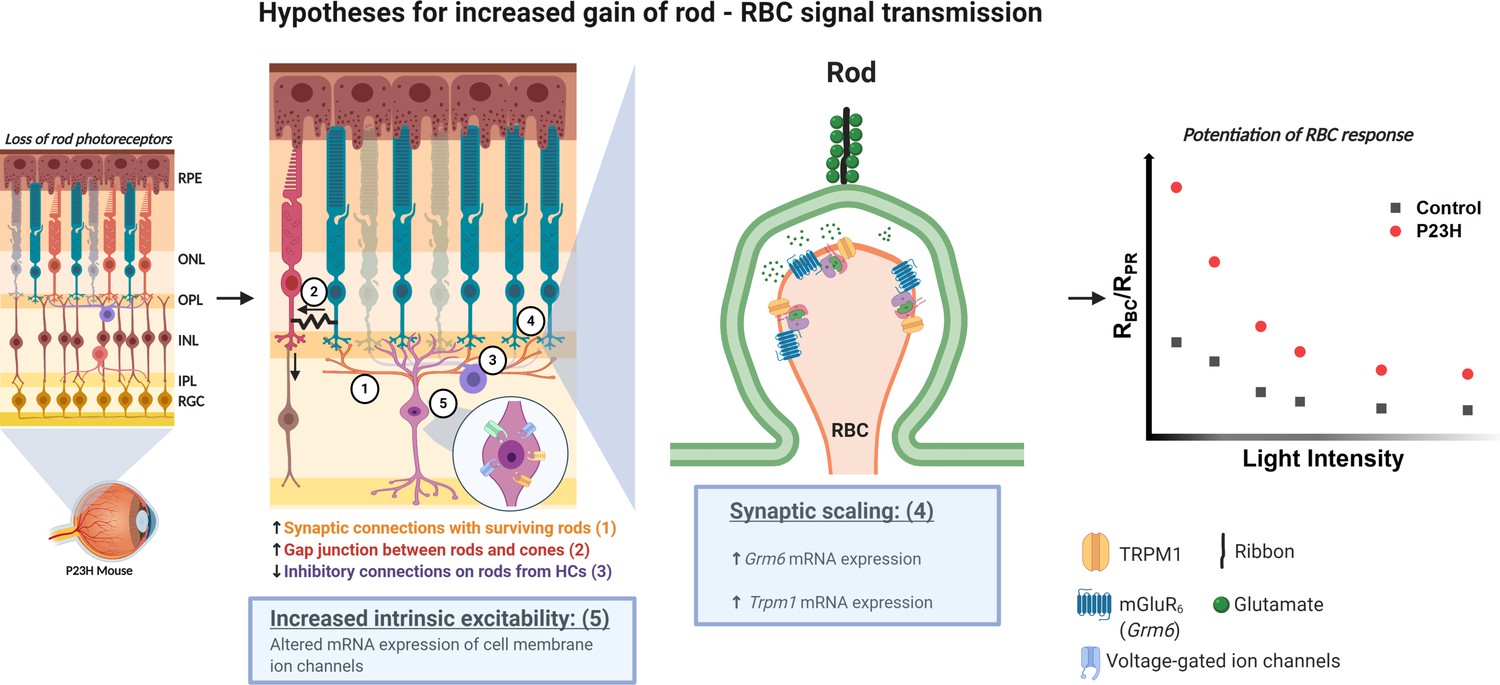
Hypotheses for the potentiation of the rod-rod bipolar cell signal transmission in the P23H mice.
Numbers 1–5 indicate the five different hypotheses discussed in the text. Two of the most probable hypotheses highlighted with blue boxes. Created with BioRender.com.
Tables
Table 1
Ex vivo ERG parameters.
I1/2, photons (505 nm) per flash/µm2 from fitting Equation 1 to photoreceptor (pharmacologically isolated) and bipolar cell (subtracted) amplitude data; Rmax, maximum amplitude measured at plateau of the photoreceptor response and at the peak of the bipolar cell component in response to bright flash (~15,000 photons µm−2); RPR,1/2, photoreceptor response amplitude required for half-maximal bipolar cell response as determined by fitting Equation 2 to RPR – RBC amplitude data. C57 background: Control, one mo, n = 4; P23H, one mo, n = 4; three mo, n = 3; five mo, n = 4 mice/retinas; Gnat2-/- background: Pooled control, 1–6 mo, n = 7 (11); P23H, one mo, n = 4 (6); five mo, n = 11(18); six mo, n = 2 (4) mice(retinas). *p<0.05, **p<0.005, ***p<0.001 in comparison to control data, two-tailed t-test. All data mean ± SEM.
| Photoreceptors | Bipolar cells | ||||
|---|---|---|---|---|---|
| Genotype/age | I1/2 (hn/µm2) | Rmax (µV) | I1/2 (hn/µm2) | Rmax (µV) | RPR,1/2 (µV) |
| 1 month Control P23H/C57 | 74 ± 18 | 410 ± 20 | 24 ± 8 | 1,120 ± 203 | 76 ± 9 |
| 1 month P23H/C57 | 78 ± 10 | 242 ± 29** | 15 ± 2 | 1,152 ± 40 | 29 ± 6** |
| 3 month P23H/C57 | 98 ± 13 | 138 ± 24*** | 71 ± 30 | 547 ± 74* | 39 ± 1* |
| 5 month P23H/C57 | 285 ± 83* | 81 ± 7*** | 72 ± 7* | 388 ± 14* | 24 ± 1** |
| Pooled Control P23H/Gnat2 | 104 ± 17 | 545 ± 76 | 33 ± 12 | 830 ± 160 | 68 ± 9 |
| 1 month P23H/Gnat2 | 230 ± 40** | 238 ± 37** | 48 ± 6 | 670 ± 80 | 38 ± 6* |
| 5 month P23H/Gnat2 | 214 ± 32* | 176 ± 21*** | 42 ± 5 | 540 ± 50 | 28 ± 4*** |
| 6 month P23H/Gnat2 | 339 ± 47*** | 54 ± 8*** | 88 ± 9** | 220 ± 20** | 13 ± 2*** |
Key resources table
| Reagent type (species) or resource | Designation | Source or reference | Identifiers | Additional information |
|---|---|---|---|---|
| Genetic reagent Mus musculus | C57BL/6J | Jackson Laboratory | Stock #: 000664 RRID:MGI:5657312 | WT mouse |
| Genetic reagent Mus musculus | B6.129S6(Cg)-Rhotm1.1Kpal/J | Jackson Laboratory | Stock #: 017628 RRID:IMSR_JAX:017628 | RhoP23H/P23H mouse |
| Genetic reagent Mus musculus | Gnat2tm1(KOMP)Vlcg | Marie E. Burns (University of California, Davis) | Original reference: doi:10.1016/j.exer.2018.02.024 | Gnat2-/- mouse |
| Antibody | Anti-PKCα (rabbit monoclonal) | Abcam | Cat. #: ab32376 RRID:AB_777294 | IHC (1:2000) |
| Antibody | Anti-Calbindin (mouse monoclonal) | Abcam | Cat. #: ab75524 RRID:AB_1310017 | IHC (1:1000) |
| Antibody | Anti-vGlut1 (guinea pig polyclonal) | Millipore | Cat. #: ab5905 RRID:AB_2301751 | IHC (1:1000) |
| Antibody | Anti-mGluR6 (sheep) | Jeannie Chen (University of Southern California) | Originally developed by Kirill Martemyanov lab, doi:10.1523/JNEUROSCI.1367–09.2009 | IHC (1:2000) |
| Antibody | Anti-CtBP2 (mouse monoclonal) | BD Biosciences | Cat. #: 612044 RRID:AB_399431 | IHC (1:1000) |
| Antibody | Anti-S opsin (goat polyclonal) | Krzysztof Palczewski lab | Generated by Bethyl Laboratories | IHC (1:1000) |
| Antibody | Anti-M opsin (rabbit polyclonal) | Novus biologicals | Cat. #: NB110-74730 RRID:AB_1049390 | IHC (1:1000) |
| Antibody | Anti-ERK1/2 (rabbit monoclonal) | Cell Signaling Technology | Cat. #: 4695S RRID:AB_390779 | WB (1:2000) |
| Antibody | Anti-α-tubulin (rabbit polyclonal) | Cell Signaling Technology | Cat. #: 2144S RRID:AB_2210548 | WB (1:2000) |
| Antibody | Anti-phospho ERK1/2 (mouse monoclonal) | Cell Signaling Technology | Cat. #: 9106S RRID:AB_331768 | WB (1:1000) |
| Antibody | Donkey anti-rabbit AlexaFluor 647 secondary | Abcam | Cat. #: ab150075 RRID:AB_2752244 | IHC (1:500) |
| Antibody | Donkey anti-mouse AlexaFluor 488 secondary | Abcam | Cat. #: ab150105 RRID:AB_2732856 | IHC (1:500) |
| Antibody | Donkey anti-mouse AlexaFluor 555 secondary | Abcam | Cat. #: ab150106 RRID:AB_2857373 | IHC (1:500) |
| Antibody | Goat anti-guinea pig AlexaFluor 568 secondary | Abcam | Cat. #: ab175714 | IHC (1:500) |
| Antibody | Donkey anti-sheep AlexaFluor 488 secondary | Abcam | Cat. #: ab150177 RRID:AB_2801320 | IHC (1:500) |
| Antibody | Donkey anti-goat AlexaFluor 488 secondary | Abcam | Cat. #: ab150129 RRID:AB_2687506 | IHC (1:500) |
| Antibody | IRDye 800CW goat anti-rabbit | Licor | Cat. #: 926–32211 RRID:AB_621843 | WB (1:10000) |
| Antibody | IRDye 680RD donkey anti-mouse | Licor | Cat. #: 926–68072 RRID:AB_10953628 | WB (1:10000) |
| Software, algorithm | Keyence BZ-X800 Analyzer | Keyence Corporation of America | RRID:SCR_017205 | Microscopy image analysis |
| Software, algorithm | MetaMorph 7.8 | Molecular Devices | RRID:SCR_002368 | Microscopy image analysis |
| Software, algorithm | GraphPad Prism 8 | GraphPad Software Inc | RRID:SCR_002798 | Statistical analysis |
| Software, algorithm | OriginPro 2020b | OriginLab Inc | https://www.originlab.com/ | Analysis and graphing software |
| Chemical compound, drug | CBR-5884 | Sigma Aldrich | Cat. #: 1656 | Phosphoglycerate dehydrogenase inhibitor |
| Chemical compound, drug | DL-AP4 | Tocris Bioscience | Cat. #: 0101/100 | Glutamatergic antagonist |
| Chemical compound, drug | Picrotoxin; PTX | Sigma Aldrich | Cat. #: 528105 | GABA antagonist |
| Chemical compound, drug | Strychnine; STR | Sigma Aldrich | Cat. #: S0532 | Glycine antagonist |
| Chemical compound, drug | Meclofenamic acid; MFA | Sigma Aldrich | Cat. #: M4531 | Gap junction blocker |
| Chemical compound, drug | (1,2,5,6-Tetrahydropyridin-4-yl)methylphosphinic acid; TPMPA | Sigma Aldrich | Cat. #: T200 | GABAA-ρ antagonist |
| Chemical compound, drug | L-741626 | Tocris Bioscience | Cat. #:1003 | D2-antagonist |
| Chemical compound, drug | L-745870 | Tocris Bioscience | Cat. #:1002 | D4-antagonist |
Table 2
Primer sequences used in qPCR.
| Gene | Forward primer sequence | Reverse primer sequence |
|---|---|---|
| Actb | GGCCAACCGTGAAAAGATGA | GACCAGAGGCATACAGGGAC |
| Cacna1F | CGGACGAATGCACAAGACAT | CGGTATGGTTCAGTGTGCAT |
| Gapdh | GACGGCCGCATCTTCTTG | CCAAATCCGTTCACACCGA |
| Grm6 | CCATCACCATCTTGCCCAAA | CCAGAACTCAGCAAACCAGA |
| Sdha | GCAGTTTCGAGGCTTCTTC | CAACAGAGAAGTGAAAGCCG |
| Slc17a7 | GGGTCCTTGTGCAGTATTCA | CAGTGCCGGTGACTCATAGG |
| Trpm1 | CTGTCAGCAAACACACCCAG | GCCAGTCCTTCACCATGAG |
Additional files
-
Supplementary file 1
Differentially expressed genes in P23H female versus P23H male mouse retinas at postnatal day 30.
- https://cdn.elifesciences.org/articles/59422/elife-59422-supp1-v2.xls
-
Supplementary file 2
Differentially expressed genes in WT female versus WT male mouse retinas at postnatal day 30.
- https://cdn.elifesciences.org/articles/59422/elife-59422-supp2-v2.xls
-
Supplementary file 3
Downregulated genes in P23H mouse retinas as compared to WT at postnatal day 30.
- https://cdn.elifesciences.org/articles/59422/elife-59422-supp3-v2.xls
-
Supplementary file 4
Upregulated genes in P23H mouse retinas as compared to WT at postnatal day 30.
- https://cdn.elifesciences.org/articles/59422/elife-59422-supp4-v2.xls
-
Supplementary file 5
Downregulated GO pathways in P23H mouse retinas as compared to WT at postnatal day 30.
- https://cdn.elifesciences.org/articles/59422/elife-59422-supp5-v2.xls
-
Supplementary file 6
Upregulated GO pathways in P23H mouse retinas as compared to WT at postnatal day 30.
- https://cdn.elifesciences.org/articles/59422/elife-59422-supp6-v2.xls
-
Supplementary file 7
Downregulated KEGG pathways in P23H mouse retinas as compared to WT at postnatal day 30.
- https://cdn.elifesciences.org/articles/59422/elife-59422-supp7-v2.xltx
-
Supplementary file 8
Upregulated KEGG pathways in P23H mouse retinas as compared to WT at postnatal day 30.
- https://cdn.elifesciences.org/articles/59422/elife-59422-supp8-v2.xls
-
Supplementary file 9
Downregulated predicted protein-protein reactome pathways in P23H mouse retinas as compared to WT at postnatal day 30.
- https://cdn.elifesciences.org/articles/59422/elife-59422-supp9-v2.xls
-
Supplementary file 10
Upregulated predicted protein-protein reactome pathways in P23H mouse retinas as compared to WT at postnatal day 30.
- https://cdn.elifesciences.org/articles/59422/elife-59422-supp10-v2.xltx
-
Supplementary file 11
Downregulated genes in P23H mouse retinas as compared to WT at postnatal day 90.
- https://cdn.elifesciences.org/articles/59422/elife-59422-supp11-v2.xlsx
-
Supplementary file 12
Upregulated genes in P23H mouse retinas as compared to WT at postnatal day 90.
- https://cdn.elifesciences.org/articles/59422/elife-59422-supp12-v2.xlsx
-
Supplementary file 13
Downregulated GO pathways in P23H mouse retinas as compared to WT at postnatal day 90.
- https://cdn.elifesciences.org/articles/59422/elife-59422-supp13-v2.xlsx
-
Supplementary file 14
Upregulated GO pathways in P23H mouse retinas as compared to WT at postnatal day 90.
- https://cdn.elifesciences.org/articles/59422/elife-59422-supp14-v2.xlsx
-
Supplementary file 15
Downpregulated KEGG pathways in P23H mouse retinas as compared to WT at postnatal day 90.
- https://cdn.elifesciences.org/articles/59422/elife-59422-supp15-v2.xlsx
-
Supplementary file 16
Upregulated KEGG pathways in P23H mouse retinas as compared to WT at postnatal day 90.
- https://cdn.elifesciences.org/articles/59422/elife-59422-supp16-v2.xlsx
-
Supplementary file 17
Downregulated predicted protein-protein reactome pathways in P23H mouse retinas as compared to WT at postnatal day 90.
- https://cdn.elifesciences.org/articles/59422/elife-59422-supp17-v2.xlsx
-
Supplementary file 18
Upregulated predicted protein-protein reactome pathways in P23H mouse retinas as compared to WT at postnatal day 90.
- https://cdn.elifesciences.org/articles/59422/elife-59422-supp18-v2.xlsx
-
Transparent reporting form
- https://cdn.elifesciences.org/articles/59422/elife-59422-transrepform-v2.docx
Download links
A two-part list of links to download the article, or parts of the article, in various formats.
Downloads (link to download the article as PDF)
Open citations (links to open the citations from this article in various online reference manager services)
Cite this article (links to download the citations from this article in formats compatible with various reference manager tools)
Homeostatic plasticity in the retina is associated with maintenance of night vision during retinal degenerative disease
eLife 9:e59422.
https://doi.org/10.7554/eLife.59422


