Mother brain is wired for social moments
- IDC Herzliya, Bar Ilan University, Israel
- Department of Psychology, Bar Ilan University, Israel
- Gonda Brain Research Center, Bar Ilan University, Israel
- Department of Psychiatry, Tel Aviv Sourasky Medical Center, Israel
- Sackler Faculty of Medicine, Tel Aviv University, Israel
- School of Psychological Sciences, Tel Aviv University, Israel
Figures
Figure 1 with 1 supplement

Proportion of mother-infant synchronous behavior in the three maternal conditions.
Mother-infant synchrony occurred more during face-to-face interaction in the social maternal condition compared to the unavailable and unresponsive maternal conditions. All effects were Greenhouse-Geisser corrected. Error bars represent standard error of the mean.
Figure 1—figure supplement 1
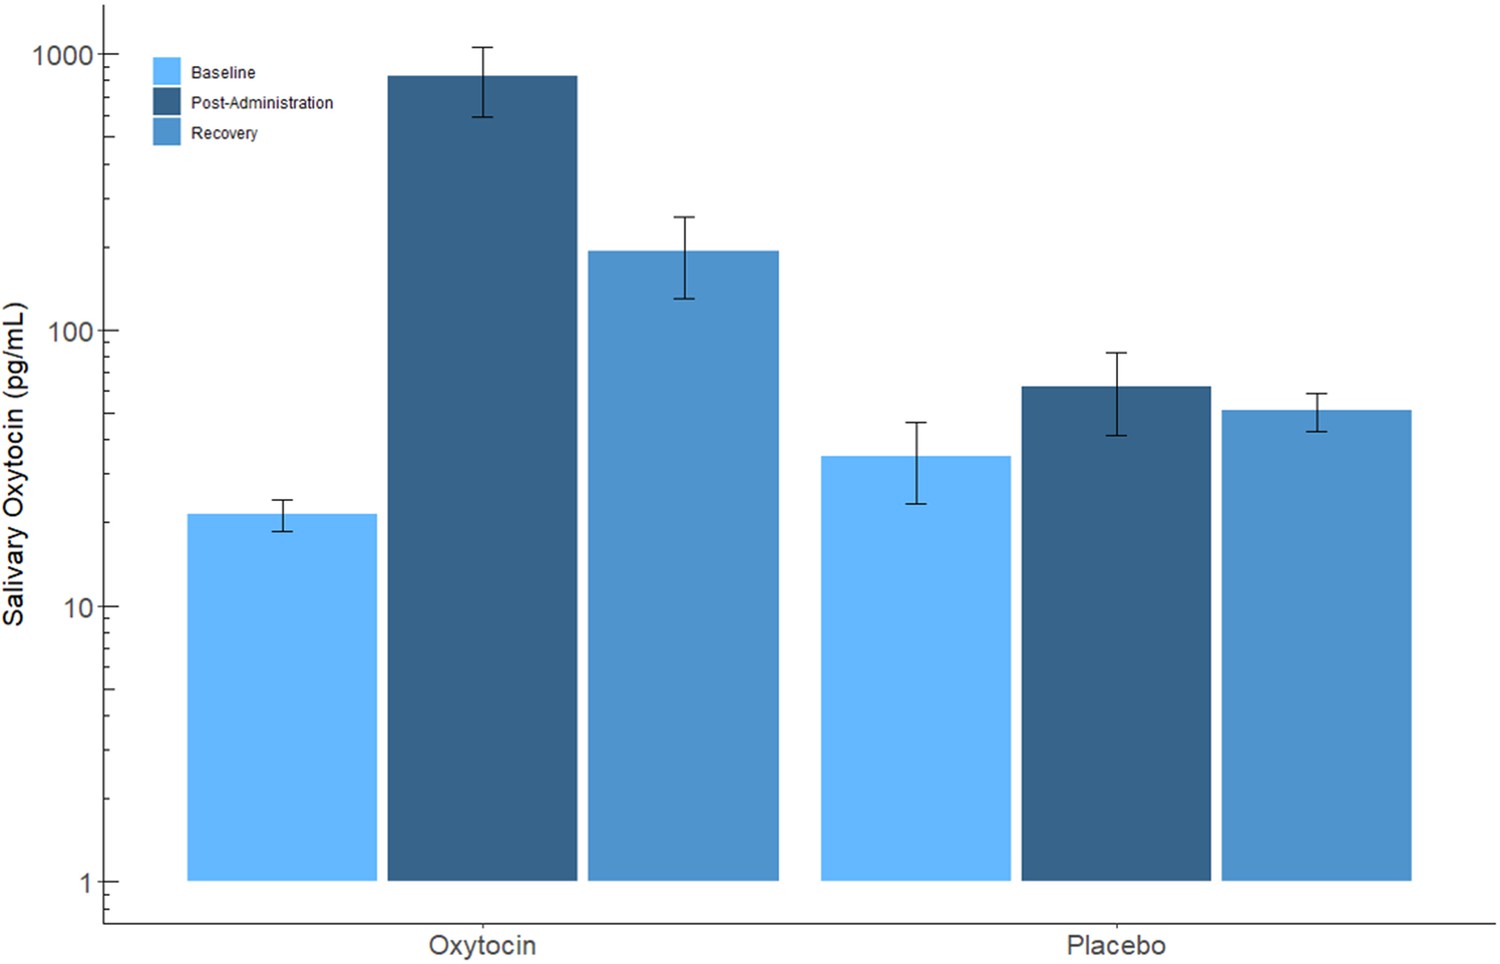
Mother salivary oxytocin levels (pg/mL) in the oxytocin and placebo conditions.
2 × 3 Repeated measures ANOVA revealed a significant PBO-OT × Time interaction effect, PBO-OT main effect and Time main effect, showing marked increase in OT level following OT administration. In the placebo condition, no such increase was observed. All effects were Greenhouse-Geisser corrected. Error bars represent standard error of the mean.
-
Figure 1—figure supplement 1—source data 1
Results of analysis of effects within a two factors Bayesian repeated measures ANOVA (PBO-OT×Time).
BFincl is calculated using the Baws factor approach across all matched models. Two factor Bayesian repeated measures ANOVA (PBO- OT × Time).
- https://cdn.elifesciences.org/articles/59436/elife-59436-fig1-figsupp1-data1-v2.docx
Figure 2 with 1 supplement
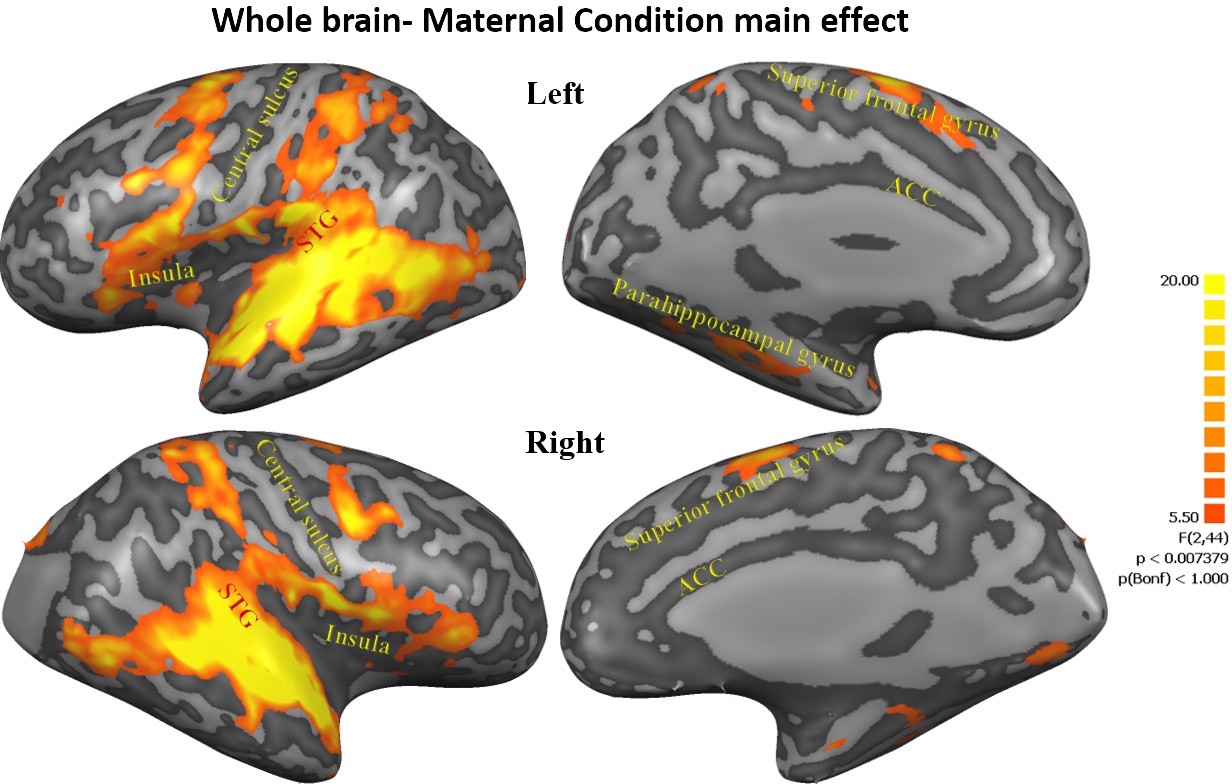
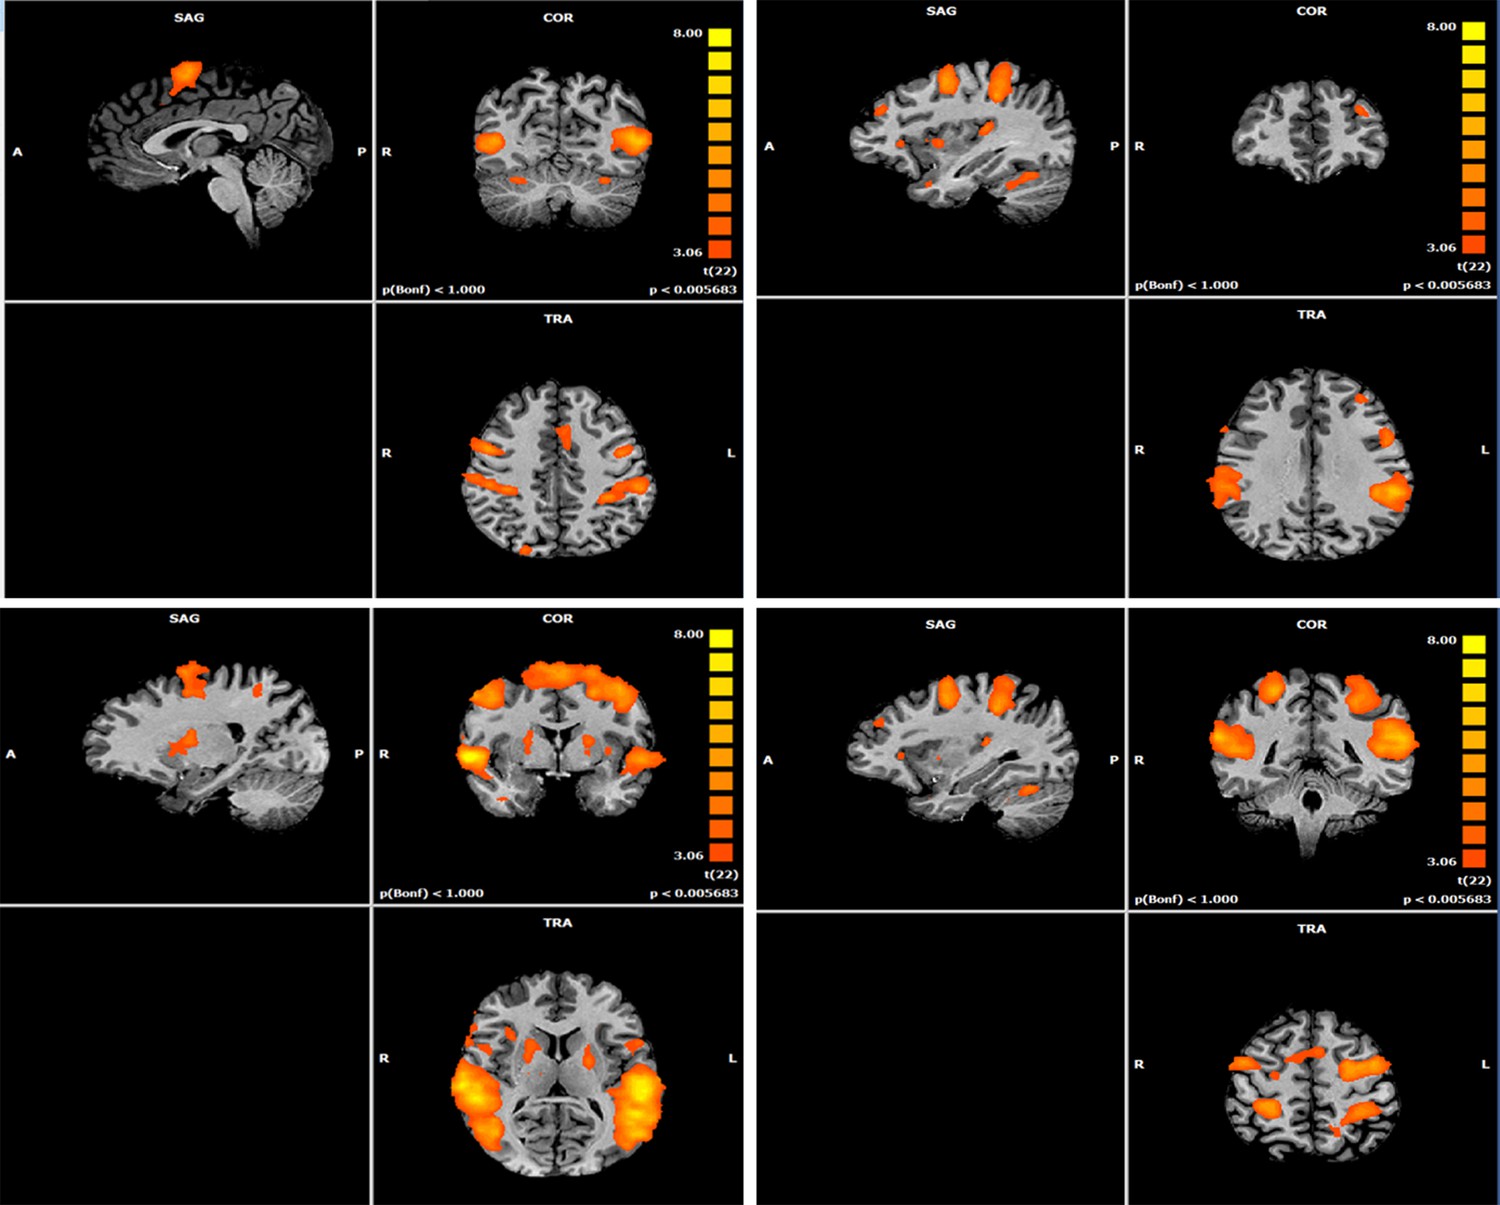
Maternal condition main effect.
Figures representing activations from 3-factorial ANOVA 'maternal condition' main effect (FDR corrected, Cluster threshold 200 voxels) including the cingulate gyrus, bilateral insula, bilateral frontal lobe areas, bilateral STG to TP, bilateral parahippocampal gyrus, bilateral anterior cerebellum, bilateral basal ganglia- putamen, occipital lobe areas and right cuneus. STG, superior temporal gyrus; TP, temporal pole.
Figure 2—figure supplement 1
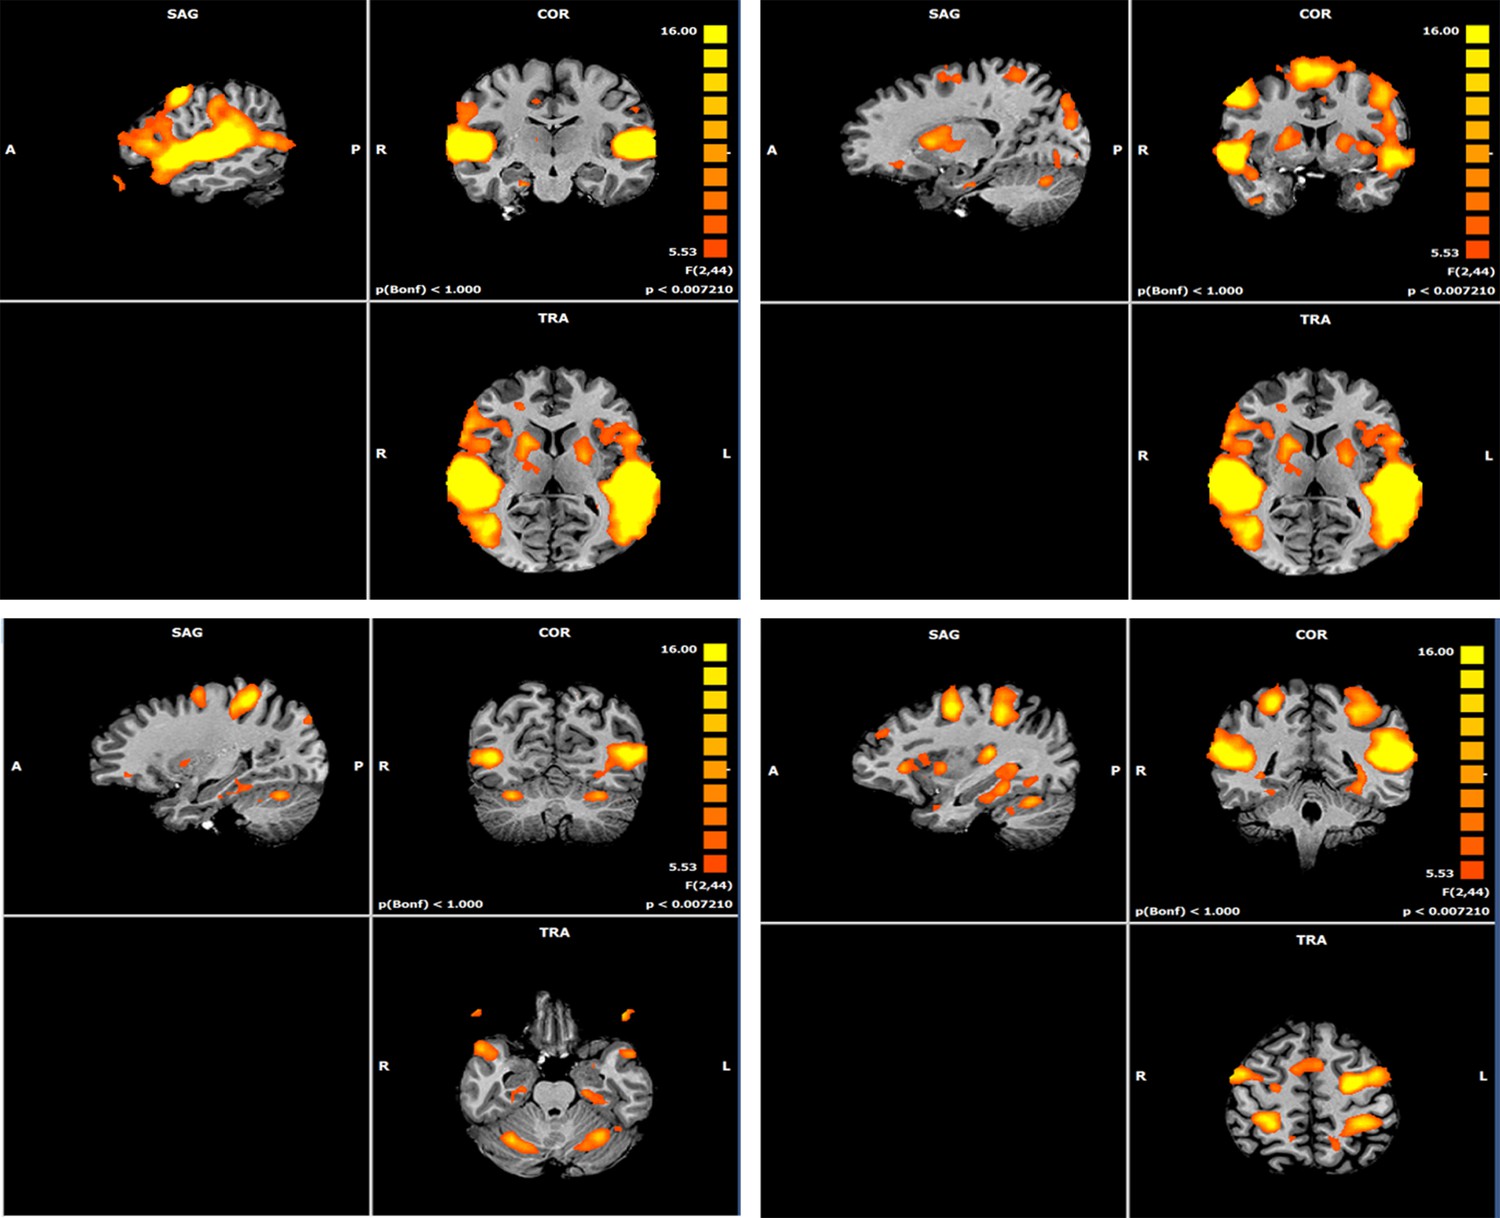
Map of Maternal Condition main effect.
Four views of the Maternal condition main effect whole brain map, presented on 3D T1 image. Figures representing activations from 3-factorial ANOVA 'maternal condition' main effect (FDR corrected, Cluster threshold 200 voxels). These are identical to Figure 2 and added for additional localization information.
Figure 3 with 2 supplements
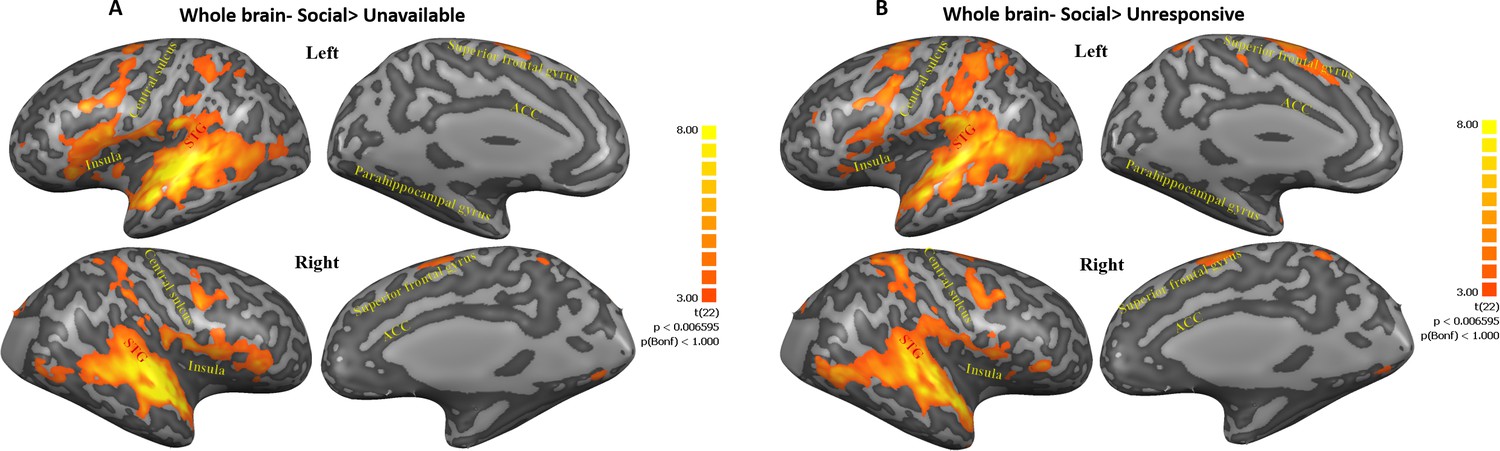
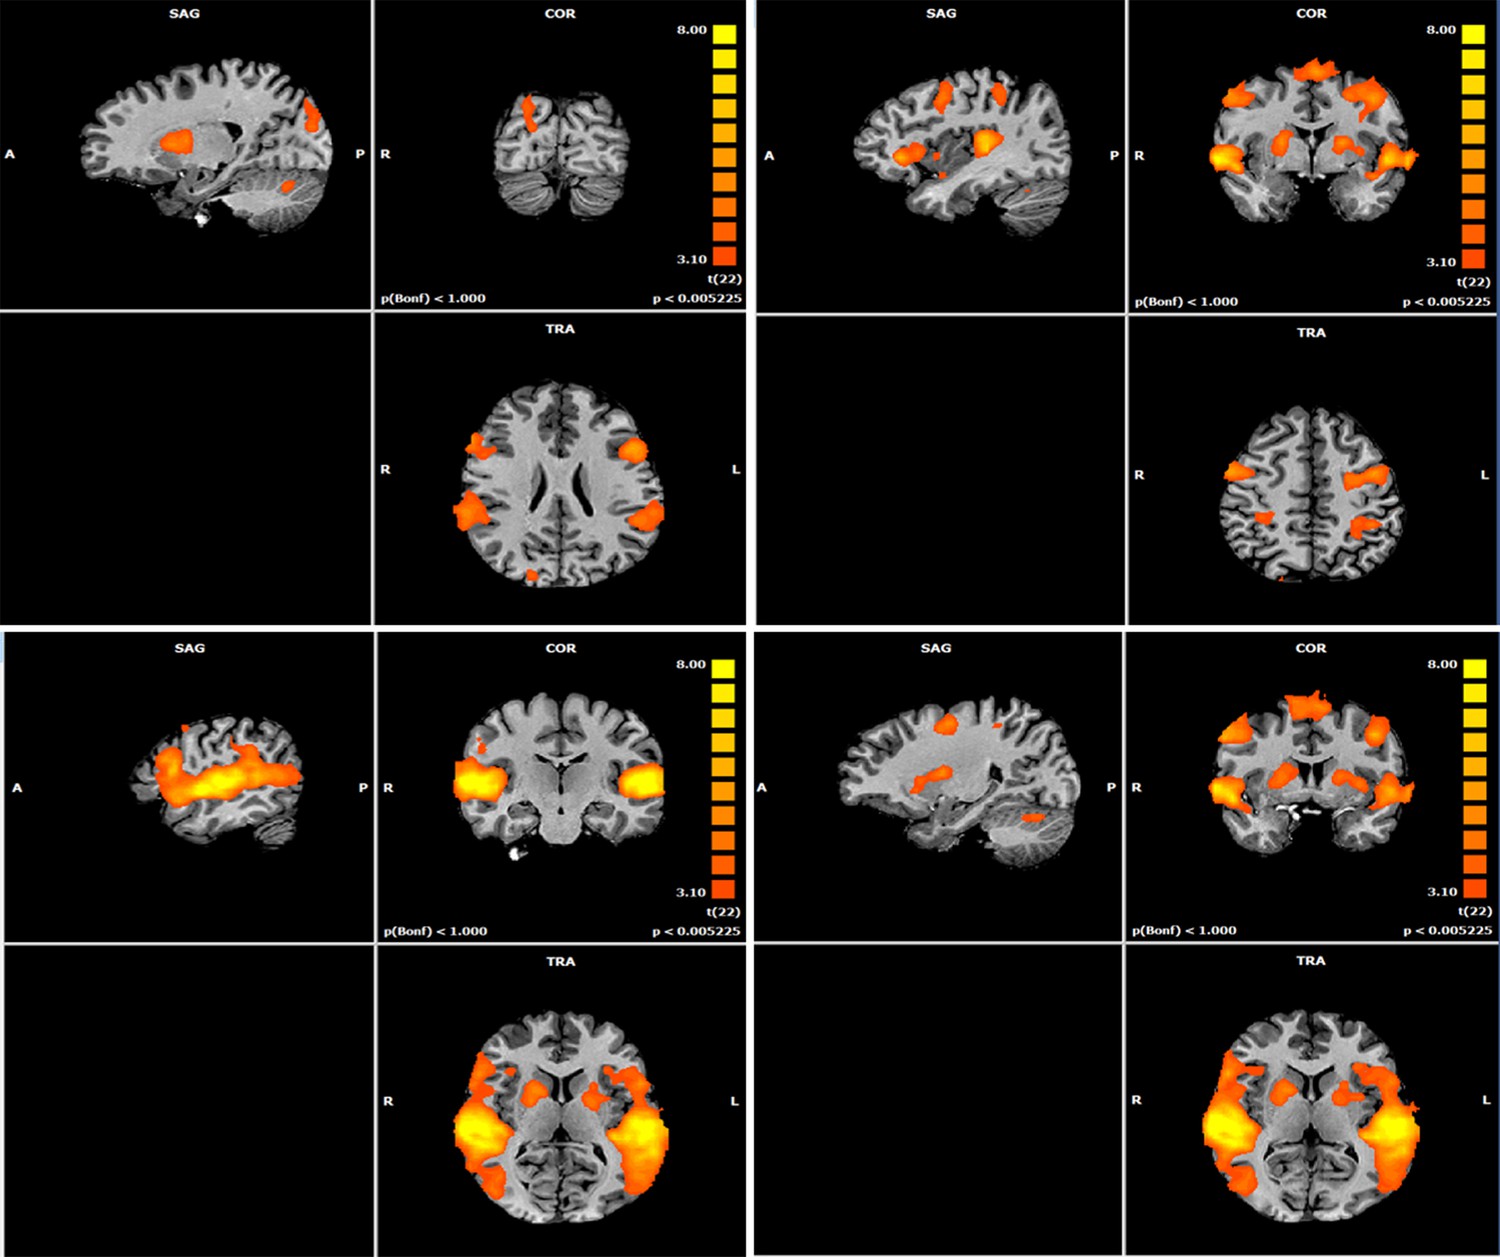
Maps of Social>Unavailable and Social>Unresponsive contrasts.
(A, B) Figures represent regions within post hoc contrasts (Social>Unavailable; Social>Unresponsive, respectively) conducted to further examine the significant maternal condition main effect found in the whole brain three factorial ANOVA. Note that similar areas were elicited in both contrasts. This highlights the extensive activity along regions ranging from the insula, STG to TP and areas in the frontal cortex under the social condition. Subcortical structures in the basal ganglia and the cerebellum were also activated in both contrasts. Results are FDR corrected with Cluster threshold of 200. Brain regions are defined in Table 1. ACC, anterior cingulate; STG, superior temporal gyrus.
Figure 3—figure supplement 1
Map of Social>Unavailable contrast.
Four views of the Social>Unavailable contrast whole brain maps, presented on 3D T1 image, (FDR corrected, Cluster threshold 200 voxels). This is identical to Figure 3A and added for additional localization information.
Figure 3—figure supplement 2
Map of Social> Unresponsive contrast.
Views of the Social>Unavailable contrast whole brain maps, presented on 3D T1 image, (FDR corrected, Cluster threshold 200 voxels). This is identical to Figure 3A and added for additional localization information.
Figure 4
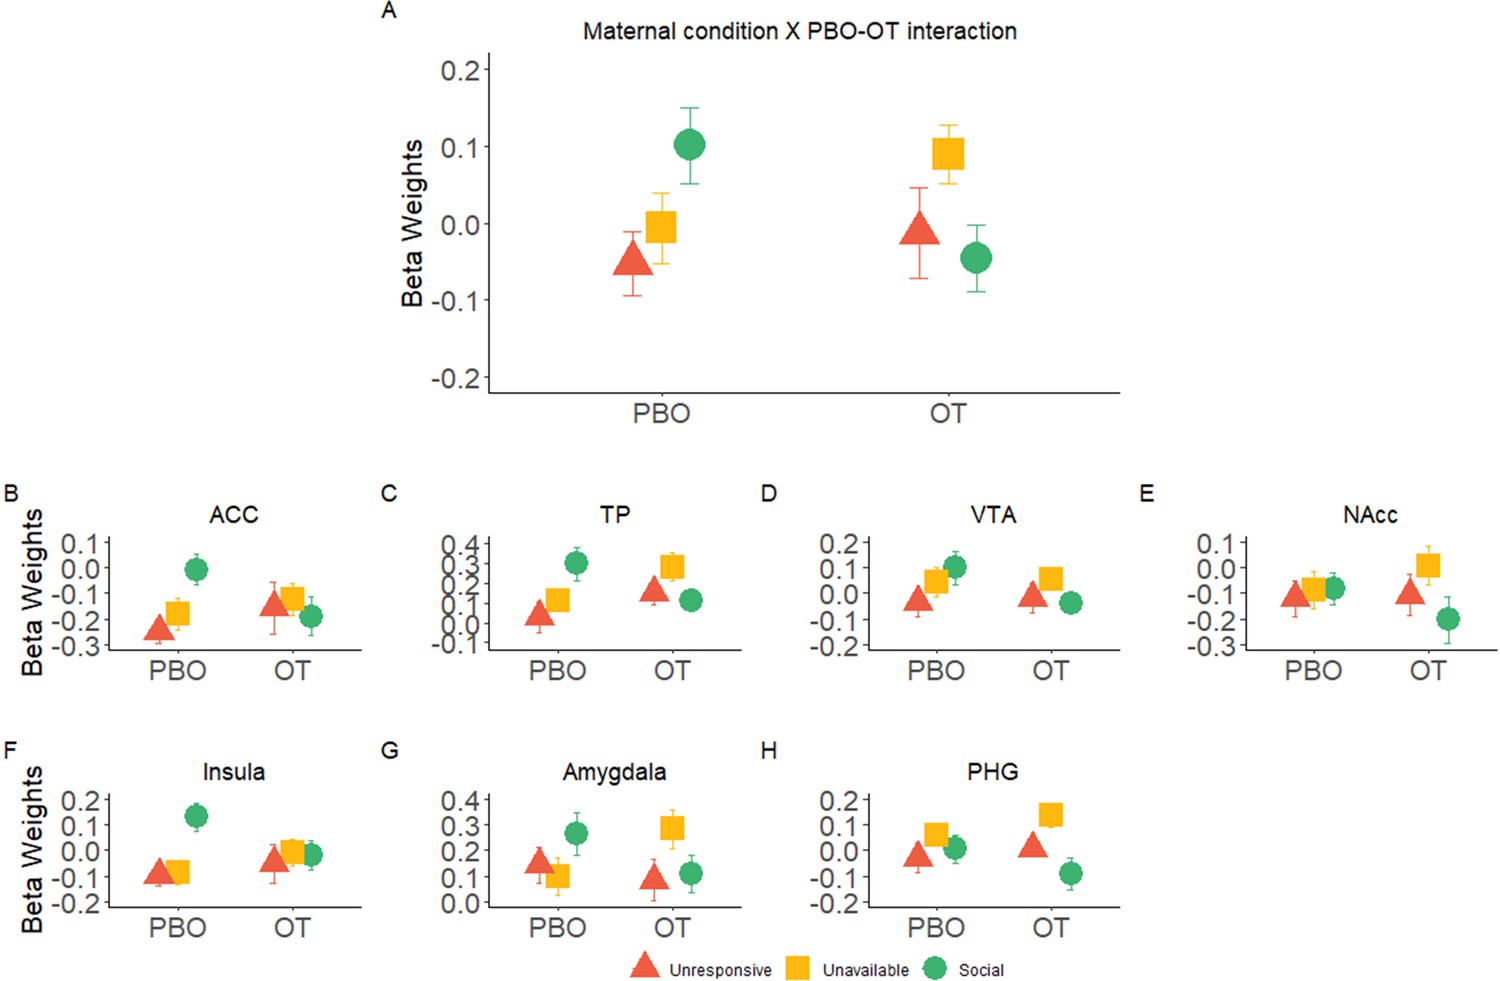
Significant interaction effects of Maternal Condition × PBO-OT.
(A) A significant interaction effect of Maternal Condition× PBO-OT was found for the maternal network. This was driven by attenuation in brain response to the social condition after oxytocin administration. Brain response to the Unavailable and Unresponsive Maternal conditions did not differ between the two scans. (B-F) Interaction effects of Maternal Condition × PBO-OT in seven preregistered ROIs of the maternal brain shown for demonstration purposes only. Bars depict Standard error of the mean. OT, Oxytocin; PBO, placebo; PHG, parahippocmpal gyrus; ACC, Anterior cingulate; TP, Temporal pole; VTA, ventral tegmental area.
Figure 5 with 1 supplement
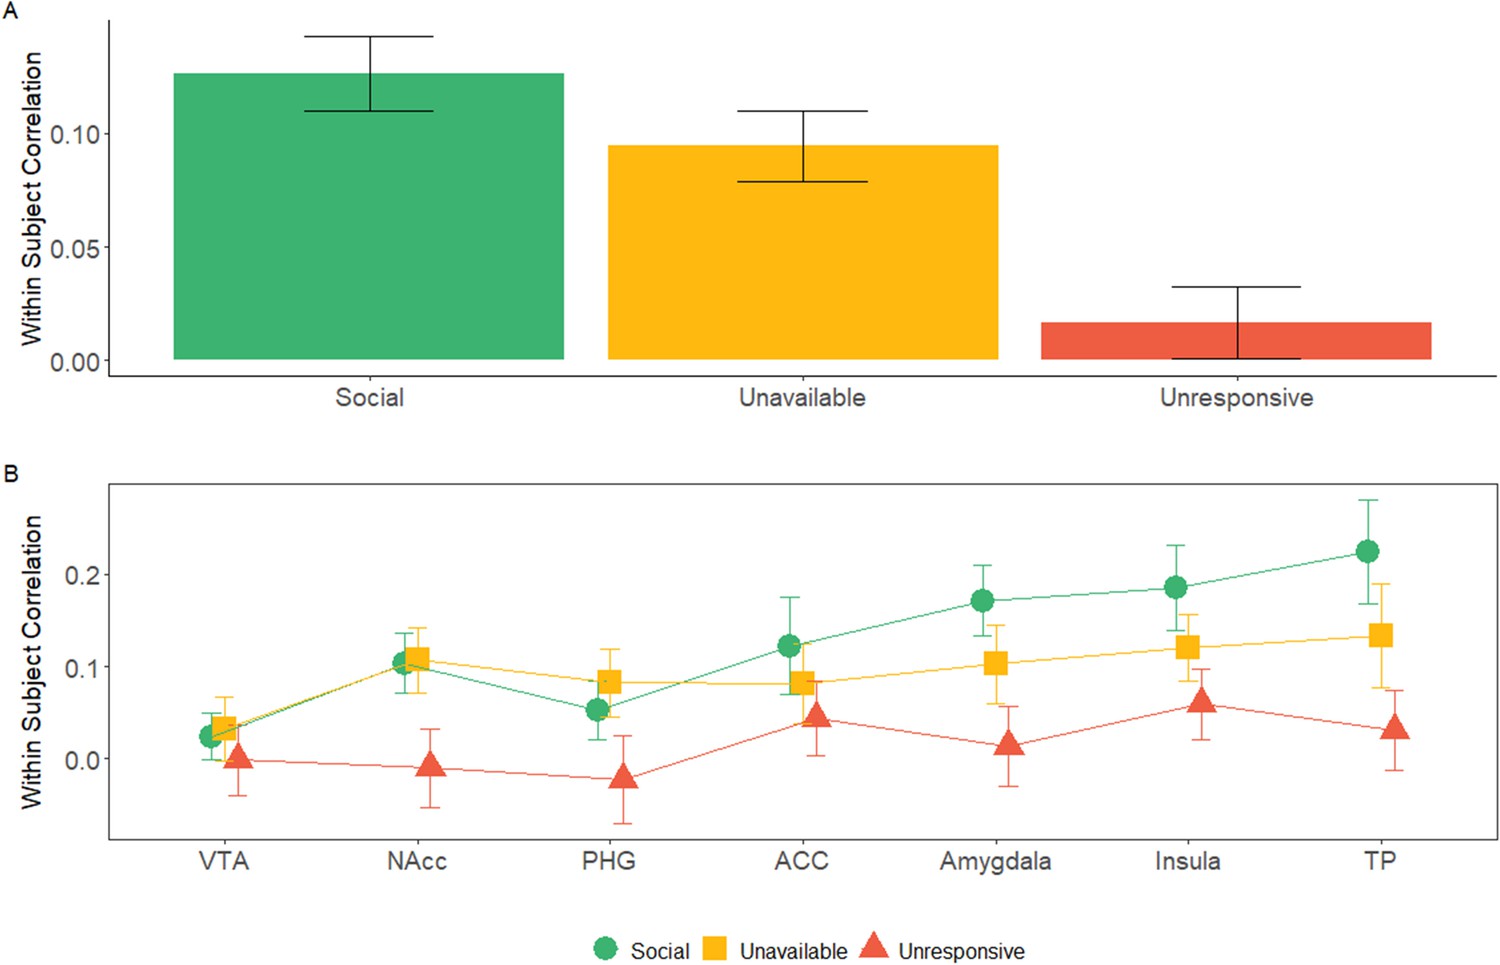
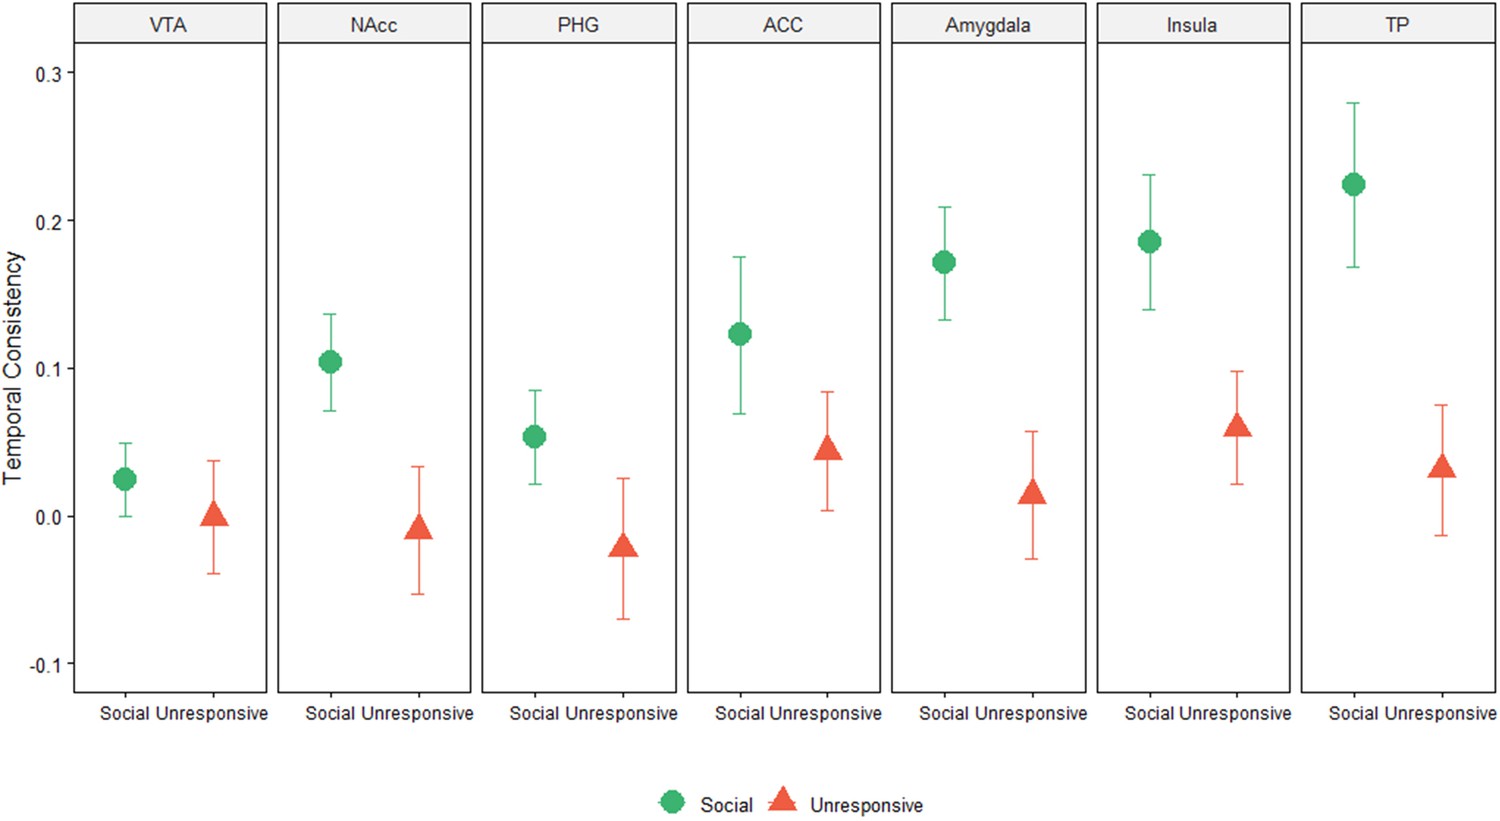
Within subject correlation (WSC) across maternal caregiving network ROIs: WSC represent the temporal activation pattern consistency of the ROIs under the three maternal conditions.
It was calculated for each subject by Pearson’s correlation for the BOLD time course of each condition between the OT and PBO runs. (A) 7 × 3 repeated measures ANOVA (maternal caregiving network ROIs × Maternal Condition) revealed a significant main effect of ROI and Maternal Condition but no interaction. Bayesian analysis indicated strong evidence for the absence of ROI × Condition interaction. Under the social maternal condition, the WSC was higher compared to the unresponsive maternal condition. (B) WSC under the social, unavailable and unresponsive conditions for each of the ROIS are presented for demonstration purposes only. Bars depict Standard error of the mean. ACC, Anterior cingulate; NAcc, Nucleus accumbens; PHG, parahippocmpal gyrus; TP, temporal pole; VTA, Ventral tegmental area. comparisons between ISC under the social and unresponsive conditions for each of the ROIS are presented for demonstration purposes only. Bars depict Standard error of the mean. OT, oxytocin; PBO, placebo; ACC, Anterior cingulate; NAcc, Nucleus accumbens; PHG, parahippocmpal gyrus; TP, temporal pole; VTA, Ventral tegmental area.
-
Figure 5—source data 1
Results of analysis of effects within a three factors Bayesian repeated measures ANOVA (ROI× Maternal Condition× Self-Other).
- https://cdn.elifesciences.org/articles/59436/elife-59436-fig5-data1-v2.docx
Figure 5—figure supplement 1
Graphs depicting the WSC for Social and Unresponsive conditions across all ROIs of the maternal caregiving network.
Bars depict Standard error of the mean.
Figure 6
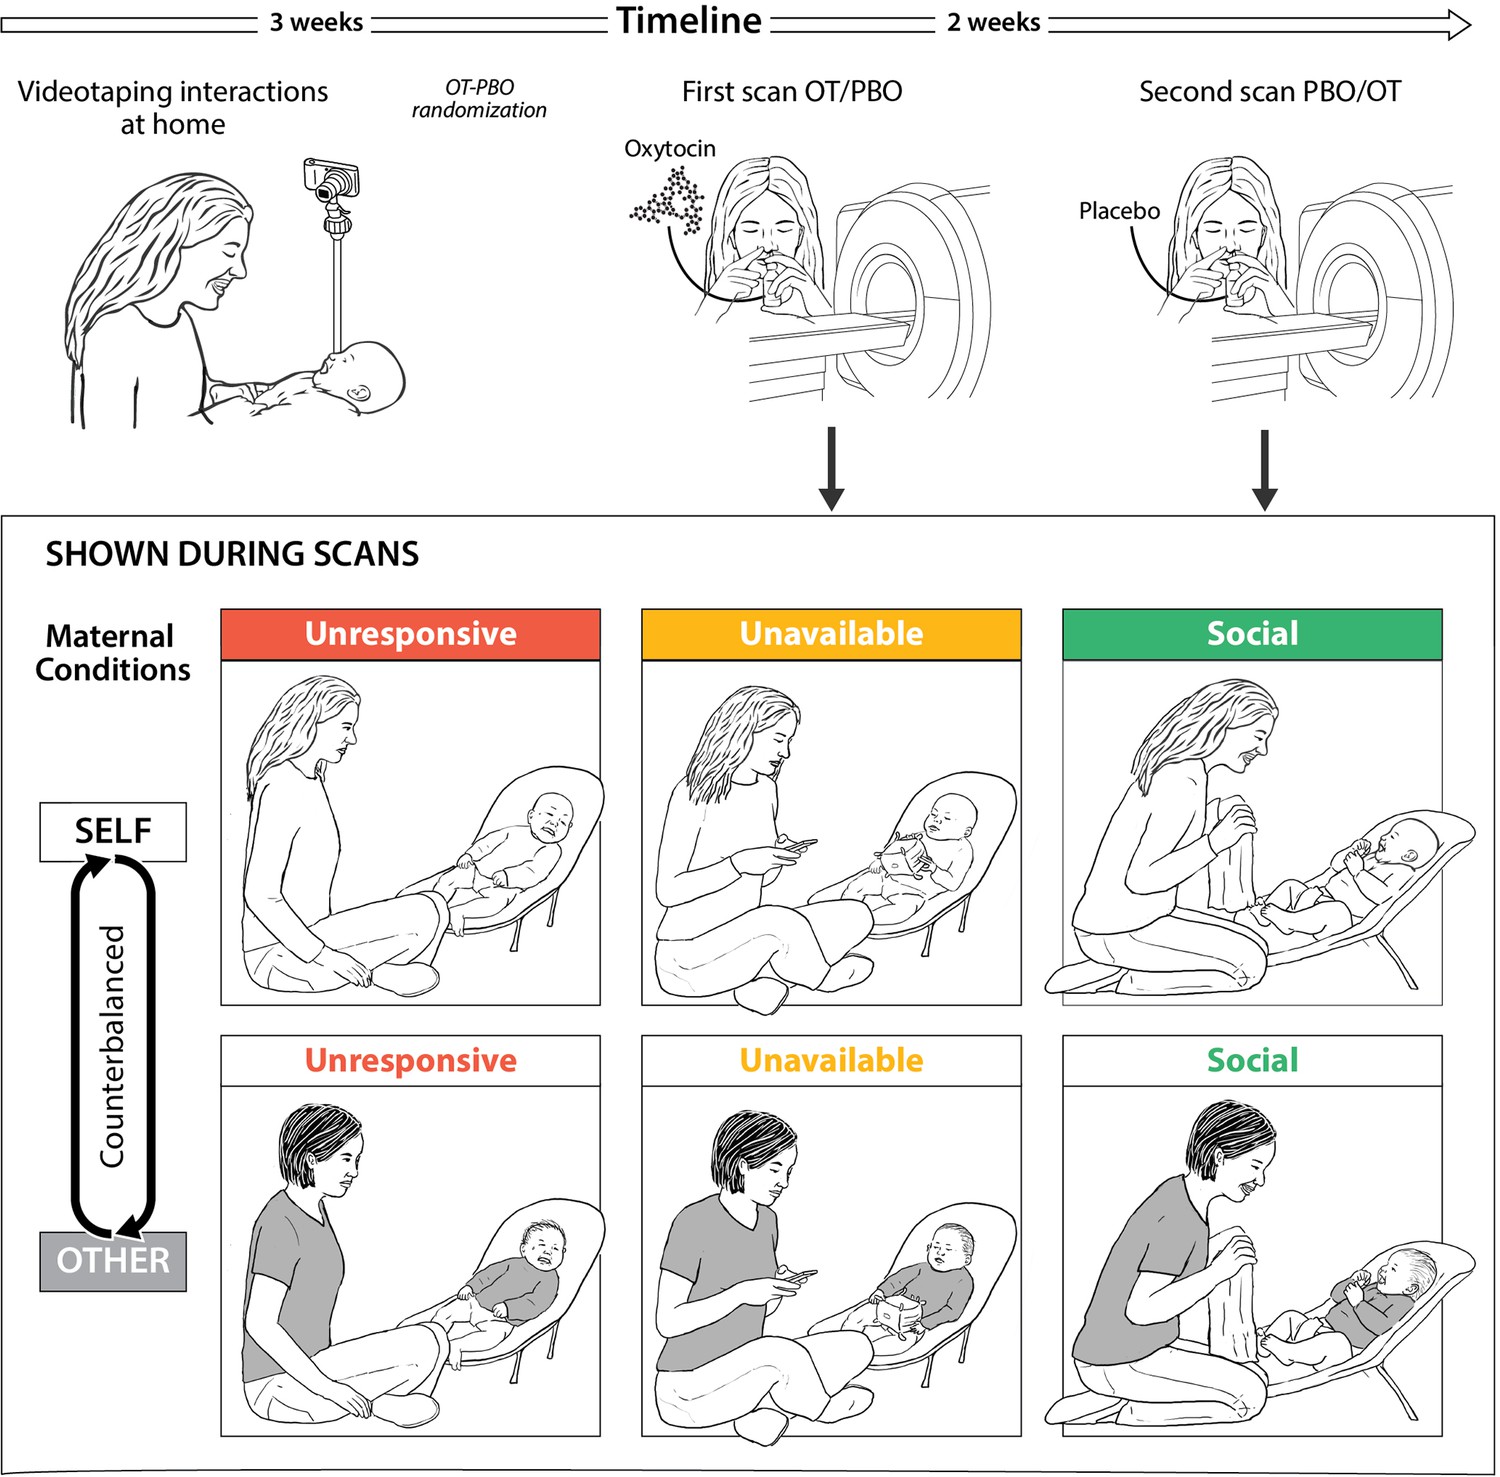
Research plan and fMRI paradigm.
(A) Experimental procedure. Mothers and infants were recruited 4-7 months post-partum and videotaped during a home-visit in the first session. Video vignettes of interactions were used as fMRI stimuli. During the second and third sessions mothers administered oxytocin or placebo before participating in brain scanning, in a randomized, placebo-controlled, double-blind, two-period crossover design. On average two weeks elapsed between scans. (B) Experimental paradigm. Mothers were presented with six video vignettes of self and other (fixed control stimuli) mother-infant interactions depicting three maternal conditions: Unresponsive- no interaction with the baby, mother does not respond to the baby (shown in red), Unavailable- minimal interaction, mother is busy, but respond to the baby when he/she signals (shown in yellow) and Social-mother and infant are engage in a peek-a-boo face-to-face social interaction (shown in green). Clips lasted 1 min each and were previewed by rest with fixation period of 1 min. A rest with fixation periods of alternately 15-18 seconds was presented between clips. Order of self-other and maternal conditions were counterbalanced between the two scans (PBO/OT).
Appendix 1—figure 1
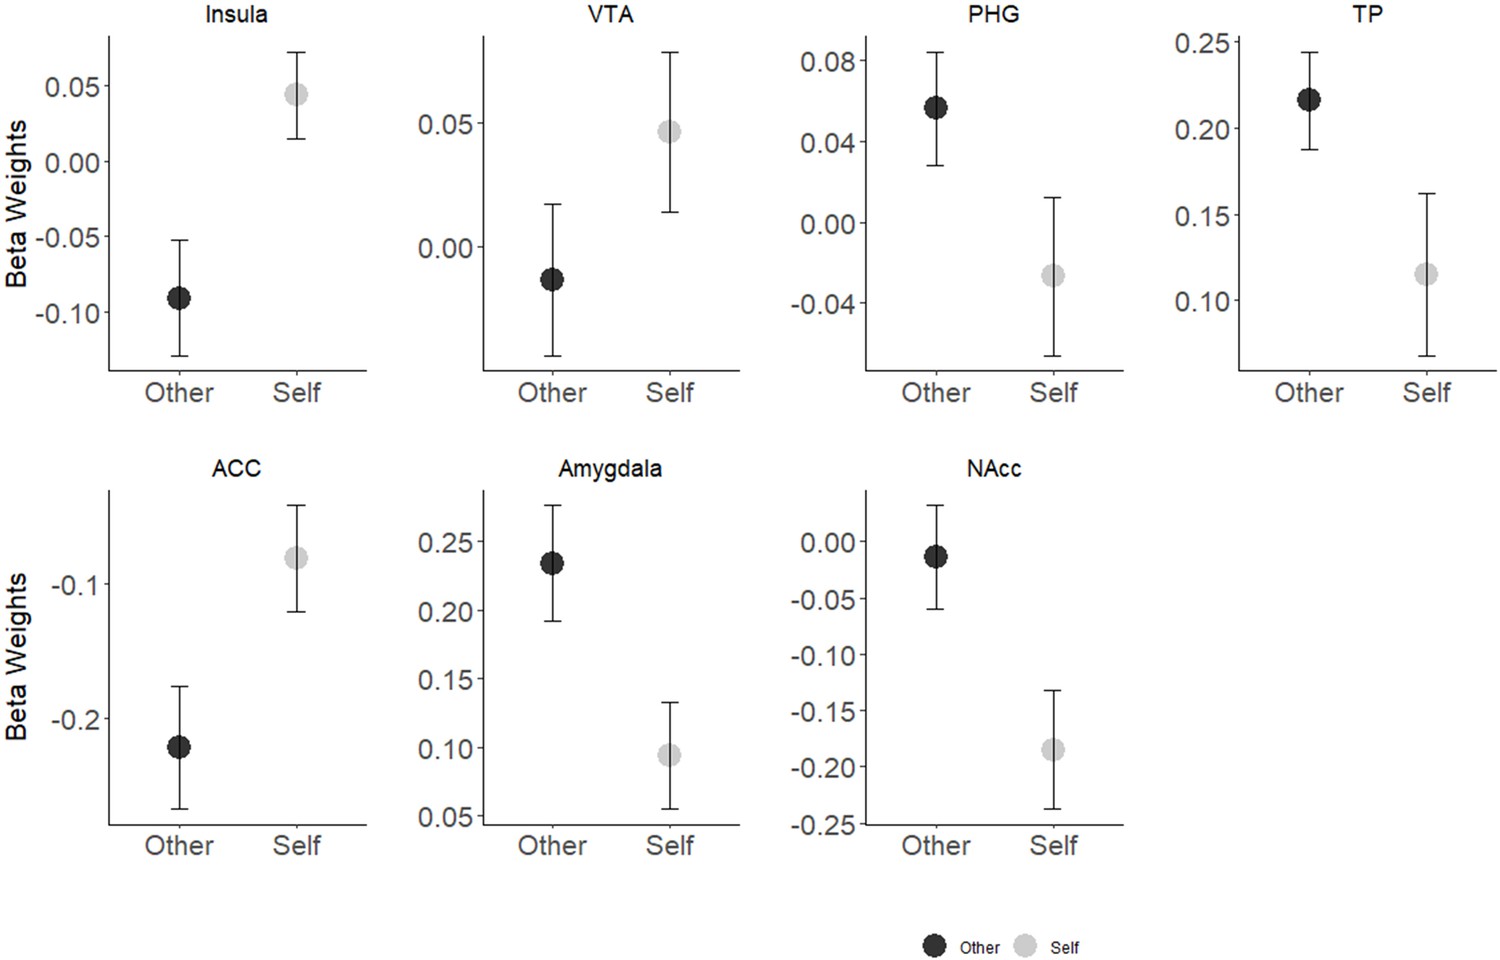
Self-Other main effect in seven preregistered ROIs.
The insula and ACC showed greater activation in response to self- stimuli while greater activation in response to other- stimuli was found in the amygdala, TP, parahippocampal gyrus and in the NAcc. Differences in the VTA were not significant. Bars depict Standard error of the mean; NAcc, Nucleus accumbens; PHG, parahippocampal gyrus; VTA, ventral tegmental area.
Appendix 1—figure 2
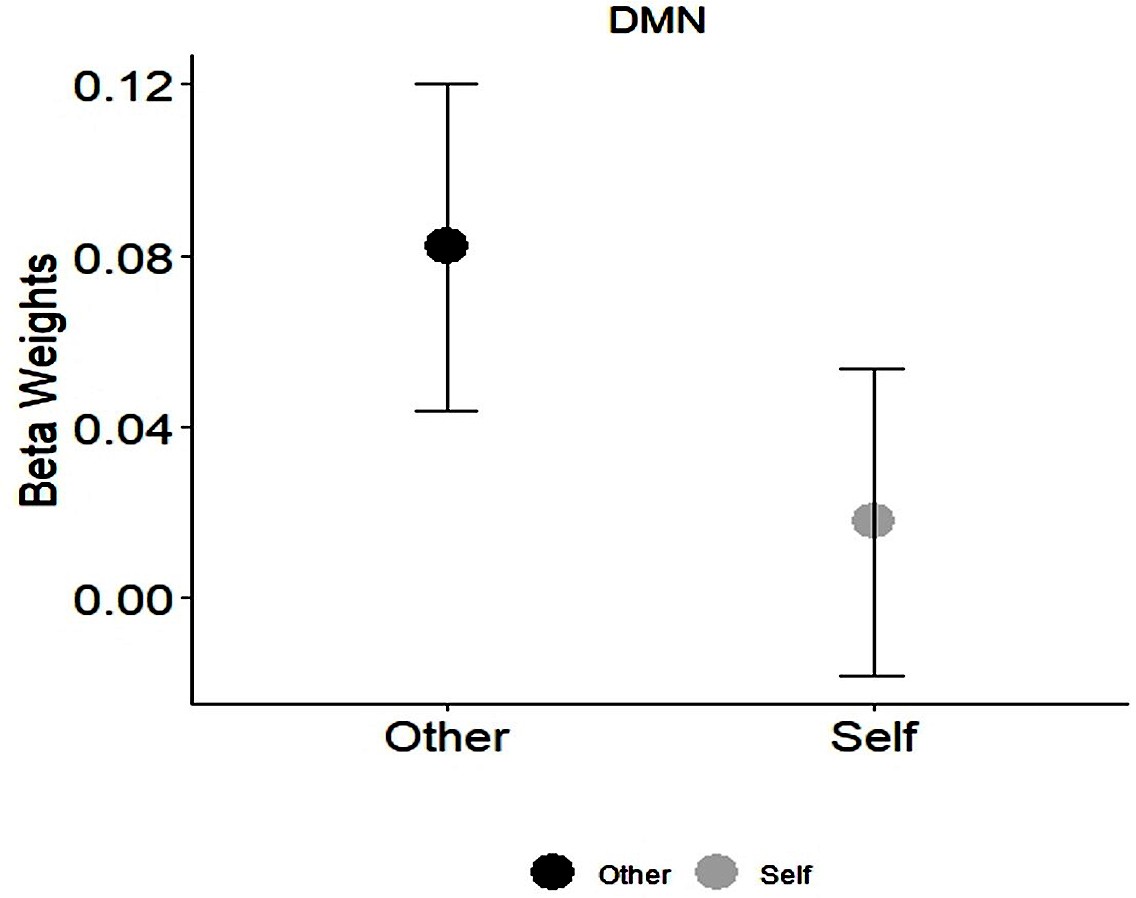
Self-Other main effect in the DMN.
Appendix 1—figure 3

Interaction effects of Condition × PBO-OT in the DMN.
Bars depict Standard error of the mean. PBO, placebo; OT, Oxytocin; DMN, Default mode network.
Appendix 1—figure 4

DMN results of WSC comparison between conditions across the maternal brain.
Contrary to the Maternal brain network, no significant effect was found in the DMN (BF = 0.097). Bars depict Standard error of the mean. DMN, Default mode network.
Appendix 1—figure 5
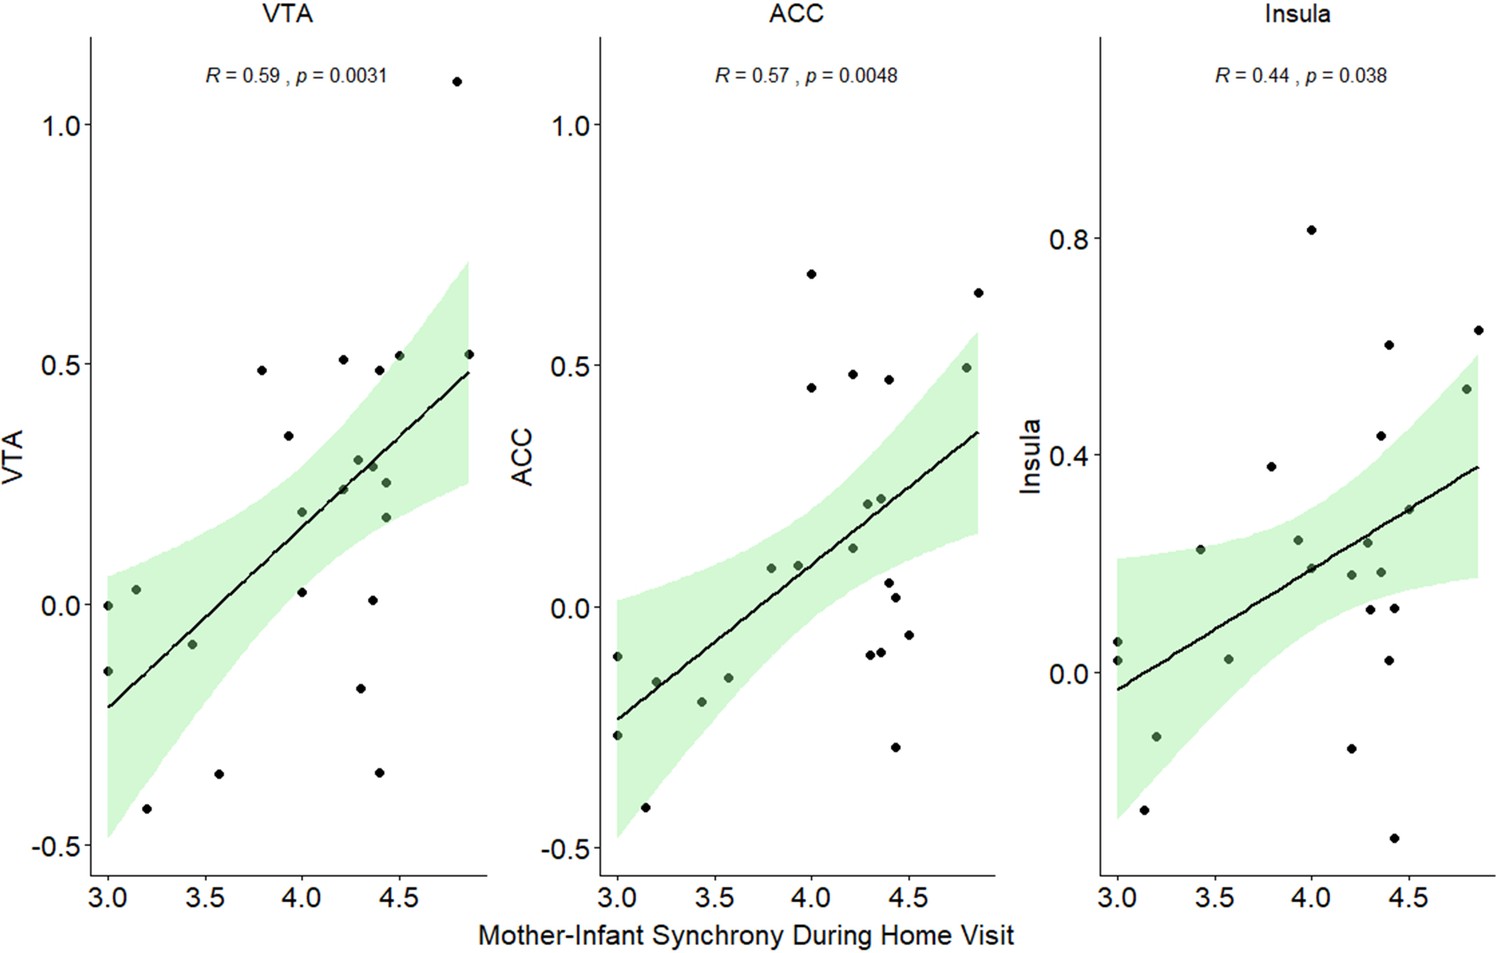
Regression lines of significant correlations between mother-infant synchrony during a free-play interaction at home visit and activation in the VTA, insula and ACC under 'Social' maternal condition and placebo.
VTA, ventral tegmental area; ACC, anterior cingulate.
Appendix 1—figure 6
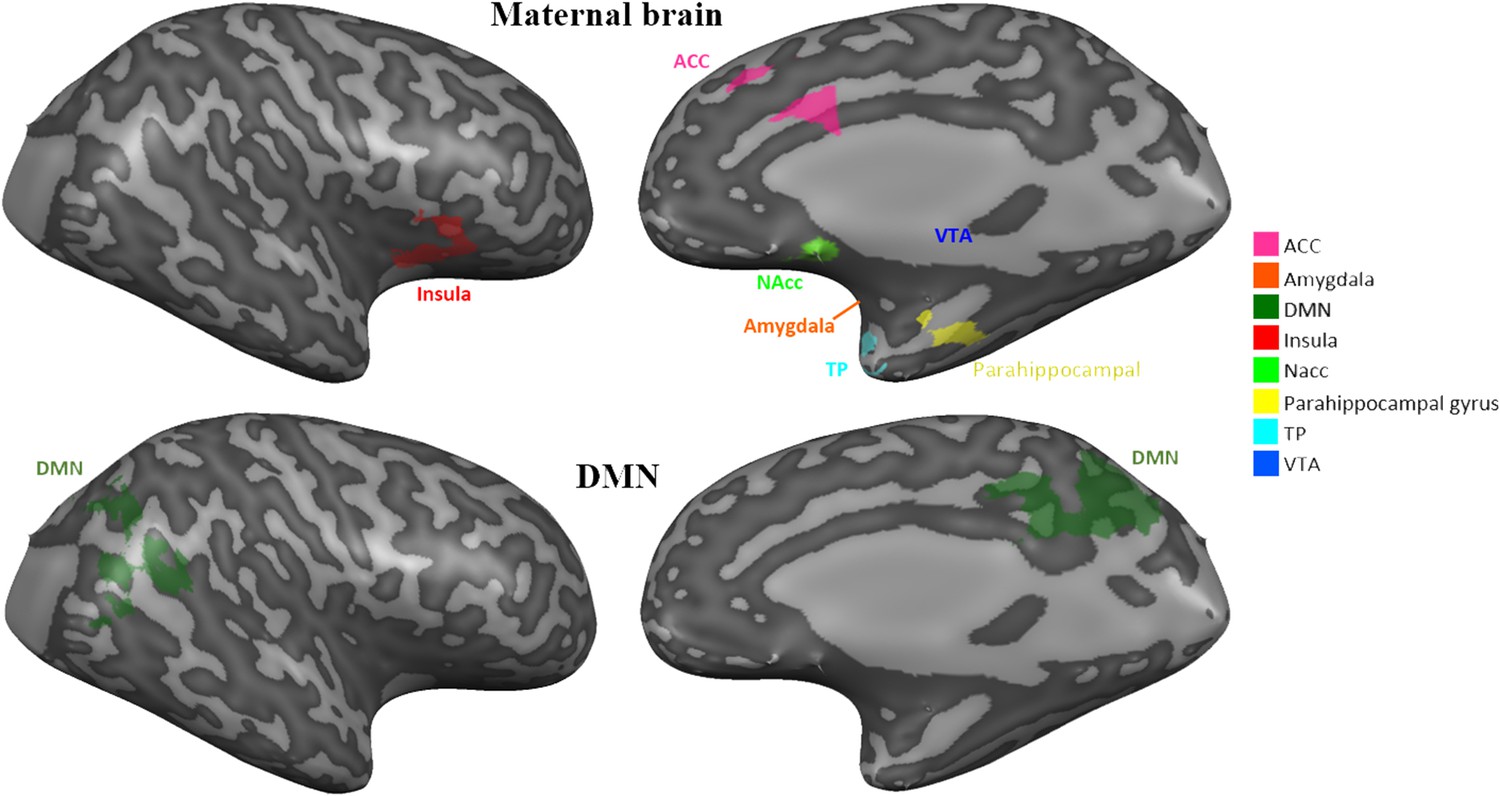
The ‘Maternal caregiving network’ and the DMN.
eight preregistered ROI's laid on right hemisphere. ACC, Anterior cingulate; DMN, Default mode network; NAcc, Nucleus accumbens; TP, Temporal pole; VTA, ventral tegmental area.
Tables
Table 1
Coordinates of activation peaks (whole brain ANOVA results).
Whole brain Coordinates are in MNI space. p<0.05 false discovery rate (FDR). L, left; R, right; BA, Brodmann’s area; STG, superior temporal gyrus; TP, temporal pole.
| Anatomical area | BA | F (2,44) | p | Cluster size | Cluster peak voxel | ||
|---|---|---|---|---|---|---|---|
| x | Y | Z | |||||
| 'Maternal Condition' main effect | |||||||
| Cingulate gyrus | 31 | 8.47 | <0.001 | 389 | 12 | −22 | 40 |
| R TP-STG-insula | 41 | 94.49 | <0.00001 | 84971 | 54 | −25 | 4 |
| L TP-STG-insula | 41 | 88.30 | <0.00001 | 85828 | −54 | −22 | 4 |
| R superior frontal gyrus | 6 | 25.15 | <0.00001 | 8150 | 58 | -1 | 49 |
| L superior frontal gyrus | 6 | 23.99 | <0.00001 | 9609 | −27 | -7 | 52 |
| Bilateral supplementary motor cortex | 6 | 23.74 | <0.00001 | 10983 | 9 | 5 | 70 |
| R orbitofrontal | 11 | 9.82 | <0.0005 | 955 | 21 | 38 | −11 |
| L dorsolateral/prefrontal cortex | 9 | 8.31 | <0.001 | 318 | −33 | 41 | 34 |
| R occipital cortex | 18 | 12.24 | <0.0001 | 1304 | 12 | −79 | -5 |
| L occipital cortex | 18 | 8.27 | <0.001 | 572 | −21 | −94 | -5 |
| R cuneus | 19 | 16.18 | <0.00001 | 3038 | 24 | −82 | 40 |
| L fusiform | 37 | 8.96 | <0.001 | 689 | −36 | −64 | 0 |
| R parietal lobule | 5 | 21.85 | <0.00001 | 9305 | 27 | −43 | 58 |
| L parietal lobule | 5 | 18.17 | <0.00001 | 9723 | −30 | −40 | 49 |
| R basal ganglia- putamen | 15.60 | <0.00001 | 4316 | 18 | 11 | 7 | |
| L basal ganglia- putamen | 17.28 | <0.00001 | 3046 | −21 | -4 | 10 | |
| R paraippocampal gyrus | 14.15 | = 0.00001 | 1575 | 36 | −40 | -2 | |
| L parahippocampal gyrus | 12.38 | <0.0001 | 2712 | −33 | −40 | −14 | |
| R cerebellum | 15.32 | <0.00001 | 1603 | 30 | −64 | −26 | |
| L cerebellum | 14.32 | = 0.00001 | 2686 | −30 | −61 | −26 | |
| Social>Unavailable | T (22) | ||||||
| R TP-STG-insula | 41 | 12.07 | <0.00001 | 66205 | 63 | −22 | 4 |
| L STG-insula | 41 | 11.18 | <0.00001 | 69734 | −54 | −22 | 4 |
| R superior frontal gyrus | 6 | 7.41 | <0.00001 | 4134 | 60 | 5 | 40 |
| L superior frontal gyrus | 6 | 7.79 | <0.00001 | 6967 | −42 | 2 | 43 |
| Bilateral supplementary motor cortex | 6 | 5.64 | = 0.00001 | 7116 | -3 | -1 | 67 |
| R occipital cortex areas | 18 | 4.67 | = 0.0001 | 2281 | 12 | −79 | -5 |
| R parietal lobule | 40 | 5.16 | <.00005 | 4024 | 48 | −28 | 37 |
| L parietal lobule | 40 | 4.69 | = 0.0001 | 3031 | −42 | −40 | 49 |
| R basal ganglia- putamen | 5.39 | <0.00005 | 4028 | 15 | 8 | 7 | |
| L basal ganglia- putamen | 5.51 | = 0.00001 | 3673 | −21 | -1 | 0 | |
| R cerebellum | 4.80 | <0.0001 | 1283 | 30 | −64 | −26 | |
| L cerebellum | 4.29 | <0.0005 | 1349 | −30 | −61 | −26 | |
| Social>Unresponsive | |||||||
| R TP-STG-insula | 41 | 10.36 | <0.00001 | 63180 | 60 | 2 | -2 |
| L TP-STG-insula | 41 | 9.65 | <0.00001 | 70134 | −54 | −22 | 4 |
| R superior frontal gyrus | 6 | 6.05 | <0.00001 | 7539 | 45 | 2 | 46 |
| L superior frontal gyrus | 6 | 6.40 | <0.00001 | 12392 | −42 | -1 | 55 |
| Bilateral supplementary motor cortex | 6 | 6.97 | <0.00001 | 13949 | -6 | 8 | 70 |
| L dorsolateral prefrontal cortex | 9 | 4.15 | <0.0005 | 495 | −33 | 41 | 31 |
| R occipital cortex areas | 18 | 4.77 | <0.0005 | 2042 | −12 | −55 | 58 |
| R parietal lobule | 5 | 6.44 | <0.00001 | 8766 | 27 | −43 | 58 |
| L parietal lobule | 40 | 5.87 | <0.00001 | 10104 | −33 | −37 | 43 |
| R basal ganglia- putamen | 4.39 | <0.0005 | 2136 | 21 | 2 | 10 | |
| L basal ganglia- putamen | 5.00 | = 0.00005 | 1539 | −21 | -4 | 13 | |
| R cerebellum | 4.31 | <0.0005 | 956 | 30 | −61 | −26 | |
| L cerebellum | 4.83 | <0.0001 | 1875 | −30 | −61 | −23 | |
| Unresponsive> Unavailable | |||||||
| R STG | 41 | 7.482 | <0.00001 | 3127 | 54 | −10 | 1 |
| L STG | 41 | 6.528 | <0.00001 | 413 | −45 | −19 | 1 |
Table 2
Results of 4 factors repeated measures ANOVA (ROI × Maternal Condition × Self-Other × PBO- OT) including seven preregistered ROIs defined as the maternal caregiving network.
| df | F score | P | Eta2 | |
|---|---|---|---|---|
| ROI main effect*** | 3.65, 80.24 | 20.63 | <0.001 | 0.48 |
| Self-Other main effect | 1, 22 | 0.54 | 0.471 | 0.02 |
| Maternal Condition main effect | 1.76, 38.63 | 2.35 | 0.12 | 0.1 |
| PBO-OT main effect | 1,22 | 0.01 | 0.945 | 0.00 |
| ROI × PBO-OT interaction | 3.19, 70.14 | 0.24 | 0.881 | 0.01 |
| ROI × Maternal Condition interaction * | 5.36, 117.85 | 2.7 | 0.021 | 0.11 |
| ROI × Self-Other interaction *** | 3.45, 75.87 | 18.73 | <0.001 | 0.46 |
| PBO-OT × Maternal Condition interaction** | 2, 43.89 | 6.92 | 0.002 | 0.24 |
| PBO-OT × Self-Other interaction | 1, 22 | 0.69 | 0.415 | 0.03 |
| Maternal Condition × Self-Other interaction | 1.67, 36.82 | 0.31 | 0.697 | 0.01 |
| ROI × PBO-OT × Maternal Condition interaction | 5.13, 112.93 | 0.95 | 0.452 | 0.04 |
| ROI × PBO-OT × Self-Other interaction | 2.79, 61.45 | 0.27 | 0.832 | 0.01 |
| ROI × Maternal Condition × Self-Other interaction | 5.71, 125.81 | 1.40 | 0.222 | 0.06 |
| PBO-OT × Maternal Condition × Self-Other interaction | 1.72, 37.94 | 0.4 | 0.644 | 0.02 |
| ROI × PBO-OT × Maternal Condition × Self-Other interaction | 5.53, 121.74 | 0.63 | 0.697 | 0.03 |
-
Bayesian analysis of ROI effects. Four factor Bayesian repeated measures ANOVA (ROI × Maternal Condition × Self- Other × PBO- OT).
In the table are results of 4 factors repeated measures ANOVA (ROI× Maternal Condition× Self-Other× PBO-OT). All results are Greenhouse-Geisser corrected. OT, oxytocin; PBO, placebo; *, p<0.05; **, p<0.01; ***, p<0.001.
-
Table 2—source data 1
Results of analysis of effects within a 4 factors Bayesian repeated measures (ANOVA ROI× Maternal Condition× Self-Other× PBO-OT).
BFincl is calculated using the Baws factor approach across all matched models.
- https://cdn.elifesciences.org/articles/59436/elife-59436-table2-data1-v2.docx
Table 3
Results of significant ROI × Maternal Condition interaction effect within a repeated measures ANOVA (ROI × Maternal Condition × Self-Other × PBO- OT) separately for each of the preregistered ROIs.
| Maternal caregiving network | |||||||
|---|---|---|---|---|---|---|---|
| Insula | ACC | TP | Amygdala | VTA | PHG | NAcc | |
| Maternal Condition main effect, df (2,44) | |||||||
| F score | 6.31 | 1.82 | 2.63 | 0.99 | 1.92 | 7.32 | 1.42 |
| P | 0.006ψ | 0.176 | 0.089 | 0.376 | 0.167 | 0.002ψ | 0.25 |
| Eta2 | 0.22 | 0.08 | 0.11 | 0.04 | 0.00 | 0.25 | 0.06 |
-
In the table post hoc analysis of significant interaction done separately for each of the preregistered ROIs. All results are Greenhouse-Geisser corrected. OT, oxytocin; PBO, placebo; ACC, anterior cingulate cortex; NAcc, nucleus accumbans; PHG, parahippocampal gyrus; TP, temporal pole; VTA, ventral tegmental area. *, p<.05; ψ, Bonferroni correction for multiple comparisons.
Appendix 1—table 1
Results of significant Self-Other × ROI interaction effect within a repeated measures ANOVA (ROI × Maternal Condition × Self-Other × PBO- OT) separately for each of the preregistered ROIs.
post hoc analysis of significant interaction done separately for each of the preregistered ROIs. All results are Greenhouse-Geisser corrected. OT, oxytocin; PBO, placebo; ACC, anterior cingulate cortex; NAcc, nucleus accumbans; PHG, parahippocampal gyrus; TP, temporal pole; VTA, ventral tegmental area. *, p<.05; ψ, Bonferroni correction for multiple comparisons.
| Maternal Caregiving Network | |||||||
|---|---|---|---|---|---|---|---|
| Insula | ACC | TP | Amygdala | VTA | PHG | NAcc | |
| Self-Other main effect, df (1,22) | |||||||
| F score | 22.97 | 13.78 | 4.47 | 6.81 | 2.91 | 6.32 | 11.27 |
| P | <0.001ψ | 0.001ψ | 0.046* | 0.016* | 0.102 | 0.020* | 0.003ψ |
| Eta2 | 0.51 | 0.39 | 0.17 | 0.24 | 0.12 | 0.22 | 0.34 |
Appendix 1—table 2
Results of Self-Other and Maternal Condition main effects within a repeated measures ANOVA (Maternal Condition × Self-Other × PBO- OT) in the DMN.
All results are Greenhouse-Geisser corrected. DMN, default mode network. *, p<.05.
| DMN | |
|---|---|
| Self-Other main effect, df (1,22) | |
| F score | 4.93 |
| P | 0.037* |
| Eta2 | 0.18 |
| Maternal Condition main effect, df (2,44) | |
| F score | 1.18 |
| P | 0.32 |
| Eta2 | 0.05 |
Appendix 1—table 3
Results of 3 factors repeated measures ANOVA (Maternal Condition × Self-Other × PBO- OT) in the visual system.
All results are Greenhouse-Geisser corrected. OT, oxytocin; PBO, placebo.
| df | F score | P | Eta2 | |
|---|---|---|---|---|
| PBO-OT main effect | 1,22 | 0.003 | 0.956 | 0.000 |
| Maternal Condition main effect | 1.849, 40.672 | 1.037 | 0.359 | 0.045 |
| Self-Other main effect | 1,22 | 2.153 | 0.156 | 0.089 |
| PBO-OT × Maternal Condition interaction | 1.923, 42.312 | 2.251 | 0.120 | 0.093 |
| PBO-OT × Self-Other interaction | 1,22 | 0.09 | 0.926 | 0.000 |
| Maternal Condition × Self-Other interaction | 1.759, 38.698 | 1.610 | 0.215 | 0.068 |
| PBO-OT × Maternal Condition × Self-Other interaction | 1.647,36.226 | 0.362 | 0.658 | 0.016 |
Appendix 1—table 4
Results of analysis of effects within a 3 factors Bayesian repeated measures ANOVA (Maternal Condition× Self-Other× PBO-OT) in the visual system.
BFincl is calculated using the Baws factor approach across all matched models.
| Effects | P (incl) | P (incl, data) | BFincl |
|---|---|---|---|
| PBO-OT | 0.263 | 0.115 | 0.132 |
| Maternal Condition | 0.263 | 0.212 | 0.077 |
| Self-Other | 0.263 | 0.071 | 0.271 |
| PBO-OT× Maternal Condition | 0.263 | 0.003 | 0.295 |
| PBO-OT × Self-Other | 0.263 | 0.005 | 0.177 |
| Maternal Condition × Self-Other | 0.263 | 0.002 | 0.154 |
| PBO-OT× Maternal Condition × Self-Other | 0.053 | 2.021e −6 | 0.128 |
Appendix 1—table 5
Significant Pearson's correlation and Bayesian results between infants' engagement and brain activation to social condition.
| Pearson's r | P | BF | |
|---|---|---|---|
| TP Self Positive PBO | 0.521 | 0.011 | 5.525 |
| TP Other Positive PBO | 0.472 | 0.023 | 2.957 |
| VTA Self Positive PBO | 0.438 | 0.037 | 2.027 |
| VTA Other Positive PBO | 0.426 | 0.043 | 1.792 |
Appendix 1—table 6
Pearson's correlations of infants affect and toy exploration with maternal brain response to self and other social condition under placebo.
| ROI | Infants affect (emotionality) | Toy exploration (attention regulation) | ||||||
|---|---|---|---|---|---|---|---|---|
| Pearson's r | p | Upper 95% CI | Lower 95% CI | Pearson's r | p | Upper 95% CI | Lower 95% CI | |
| ACC Self | 0.206 | 0.346 | 0.57 | −0.225 | −0.354 | 0.098 | 0.069 | −0.668 |
| ACC Other | −0.025 | 0.908 | 0.391 | −0.433 | −0.236 | 0.278 | 0.195 | −0.591 |
| Amygdala Self | −0.023 | 0.916 | 0.393 | −0.431 | −0.358 | 0.093 | 0.064 | −0.671 |
| Amygdala Other | 0.040 | 0.858 | 0.445 | −0.379 | −0.516 | 0.012 | −0.132 | −0.765 |
| Insula Self | −0.005 | 0.981 | 0.408 | −0.417 | −0.182 | 0.405 | 0.248 | −0.553 |
| Insula Other | 0.006 | 0.979 | 0.417 | −0.407 | −0.322 | 0.135 | 0.104 | −0.648 |
| NAcc Self | 0.005 | 0.983 | 0.416 | −0.408 | −0.154 | 0.483 | 0.276 | −0.532 |
| NAcc Other | −0.053 | 0.810 | 0.367 | −0.455 | −0.078 | 0.725 | 0.346 | −0.475 |
| PHG Self | 0.043 | 0.847 | 0.447 | −0.376 | 0.114 | 0.605 | 0.503 | 0.313 |
| PHG Other | −0.077 | 0.727 | 0.346 | −0.474 | −0.066 | 0.765 | 0.356 | −0.465 |
| TP Self | 0.049 | 0.823 | 0.452 | −0.37 | −0.063 | 0.776 | 0.359 | −0.463 |
| TP Other | 0.049 | 0.823 | 0.452 | −0.37 | −0.313 | 0.145 | 0.113 | −0.643 |
| VTA Self | 0.020 | 0.926 | 0.429 | −0.395 | −0.200 | 0.360 | 0.231 | −0.566 |
| VTA Other | −0.013 | 0.953 | 0.401 | −0.423 | −0.411 | 0.051 | 0.001 | −0.704 |
Author response table 1
| Mother-infant synchrony | ||||||
|---|---|---|---|---|---|---|
| Infants toy exploration | Pearson's r | 0.159 | ||||
| p | 0.468 | |||||
| Lower 95% CI | -0.271 | |||||
| Upper 95% CI | 0.536 | |||||
| Infants affect | Pearson's r | 0.053 | ||||
| p | 0.811 | |||||
| Lower 95% C | -0.368 | |||||
| Upper 95% CI | 0.455 |
Author response table 2
Paired sample t test results comparing functional connectivity under OT and PBO.
| ROIs connectivity | t | Df | p | Cohen's d | Lower 95% CI | Upper 95% CI |
|---|---|---|---|---|---|---|
| ACC-Amygdala | -0.300 | 22 | 0.767 | -0.062 | -0.471 | 0.374 |
| ACC-VTA | -0.990 | 22 | 0.333 | -0.206 | -0.617 | 0.209 |
| ACC-Insula | -0.366 | 22 | 0.718 | -0.076 | -0.485 | 0.334 |
| Amygdala-Insula | -0.159 | 22 | 0.875 | -0.033 | -0.442 | 0.376 |
Additional files
Download links
A two-part list of links to download the article, or parts of the article, in various formats.
Downloads (link to download the article as PDF)
Open citations (links to open the citations from this article in various online reference manager services)
Cite this article (links to download the citations from this article in formats compatible with various reference manager tools)
Mother brain is wired for social moments
eLife 10:e59436.
https://doi.org/10.7554/eLife.59436


