Reciprocal interaction between mesenchymal stem cells and transit amplifying cells regulates tissue homeostasis
- Center for Craniofacial Molecular Biology, University of Southern California, United States
- State Key Laboratory of Oral Diseases, National Clinical Research Center for Oral Diseases, West China Hospital of Stomatology, China
- Department of Craniofacial Development and Stem Cell Biology, Dental Institute, Kings College London, United Kingdom
Figures
Figure 1

In vivo anatomical and molecular identities of mesenchymal stem cells (MSCs) and transit amplifying cells (TACs) in the mouse incisor.
(A and B) Ki67 staining (green), tdTomato visualization (red), and DAPI staining (blue) of incisors from 1-month-old Axin2-CreERT2;Rosa26<fs-tdTomato> mice 1 day after tamoxifen (TM) induction. (C and D) β-gal staining (green) and Ki67 immunofluorescence (red) of incisors from 1-month-old Gli1-LacZ mice. Box in (C) is shown enlarged in (D). (E) Schematic diagram of MSCs and TACs in the mouse incisor. Arrows indicate positive signal. Induction protocol schematic indicates tamoxifen (TM) administration and sample collection time. The white dashed lines outline the cervical loop. Scale bars, 100 μm.
Figure 2
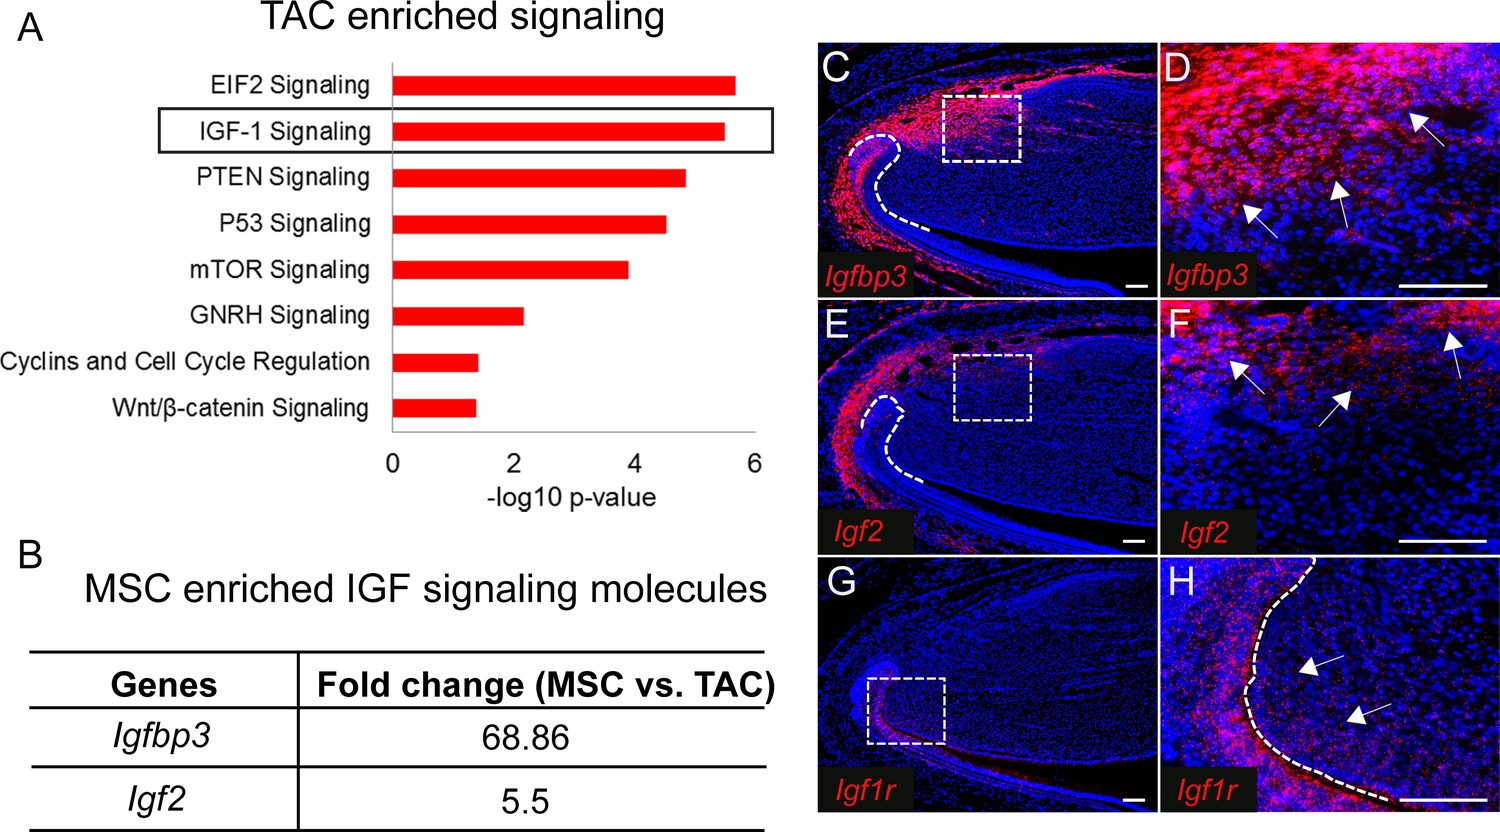
IGF ligand and binding proteins are highly enriched in mesenchymal stem cells (MSCs).
(A) Top eight signaling pathways enriched in transit amplifying cells (TACs) identified by Ingenuity Pathway Analysis. (B) IGF signaling molecules enriched in MSCs. (C–H) RNAscope (red) of Igfbp3 (C and D), Igf2 (E and F), and Igf1r (G and H) in incisors of 1-month-old control mice. Boxes in (C, E, and G) shown magnified in (D, F, and H), respectively. Arrows indicate positive signal. The white dashed lines outline the cervical loop. Scale bars, 100 μm.
Figure 3 with 3 supplements
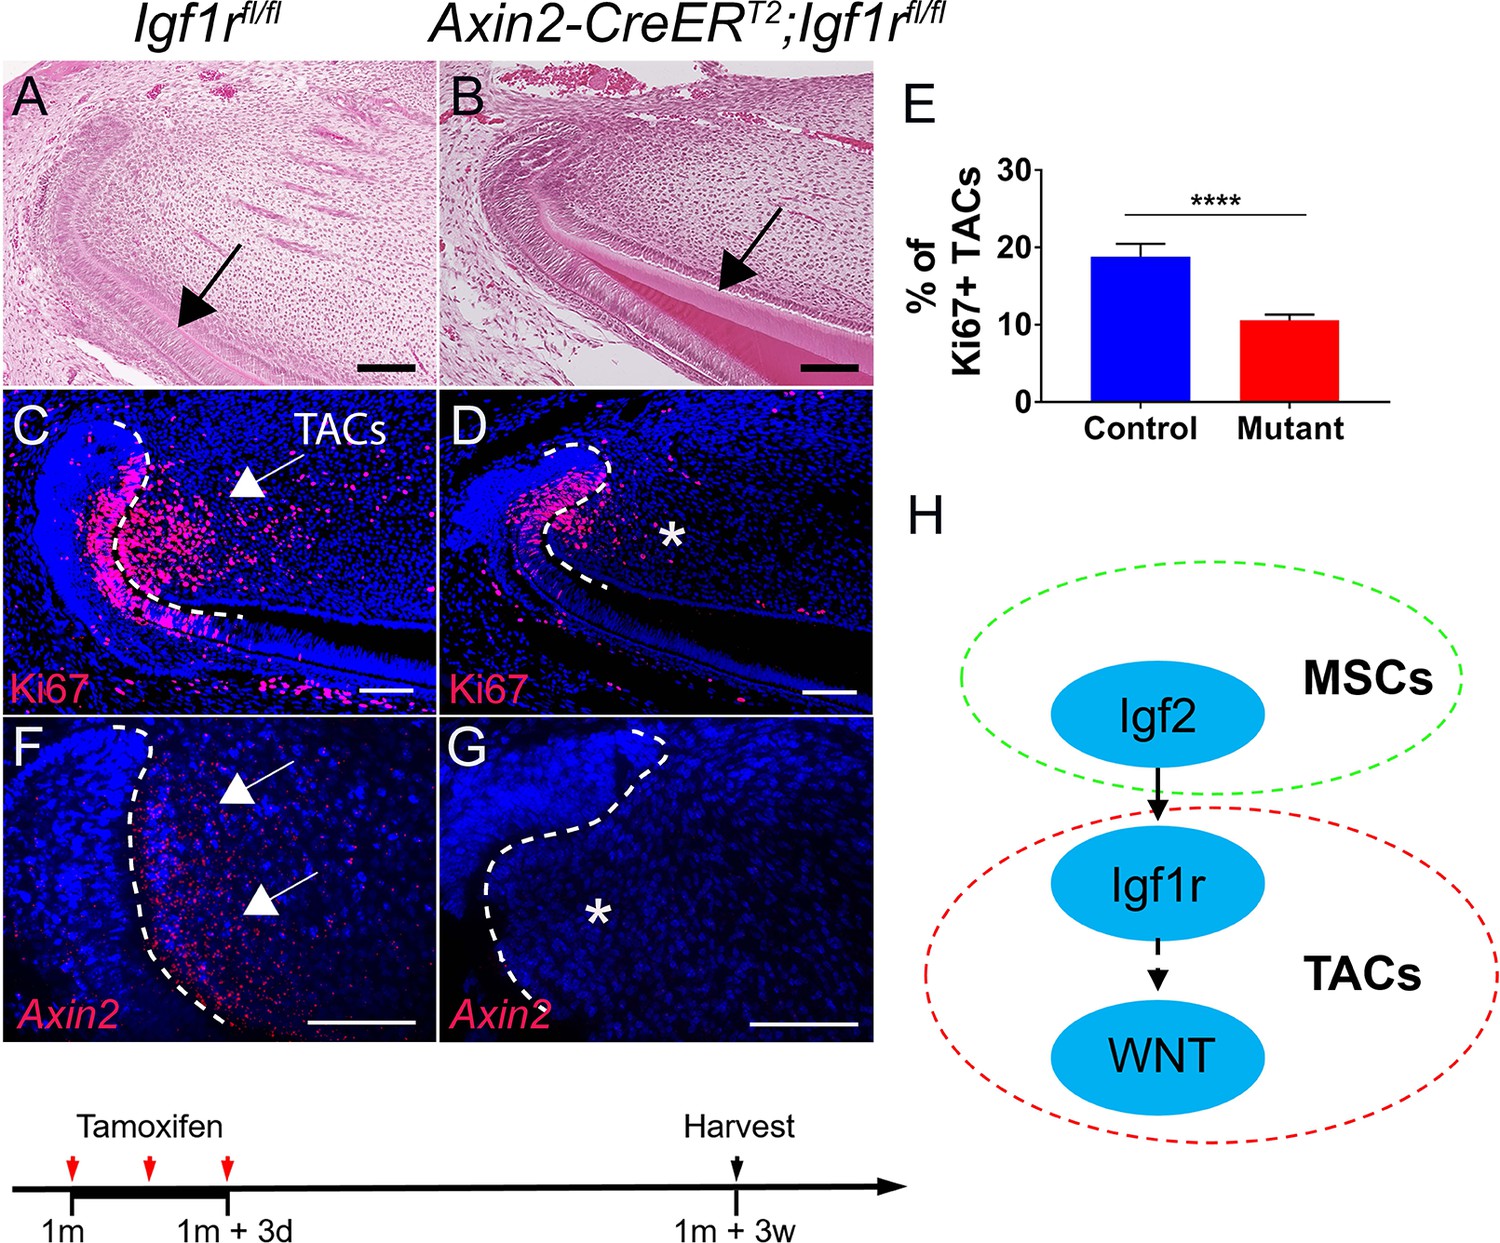
Inactivation of IGF signaling leads to transit amplifying cell (TAC) loss in the incisor mesenchyme.
(A–D) H and E staining and Ki67 immunofluorescence (red) of incisors from Igf1rfl/fl (control) and Axin2-CreERT2;Igf1rfl/fl mice. Black arrow in (A) indicates normal dentin and black arrow in (B) indicates thicker dentin. White arrow in (C) indicates a positive signal and asterisk in (D) indicates diminished signal. (E) Quantitation of the percentage of Ki67+ TACs from (C and D). (F and G) RNAscope staining of Axin2 expression (red) in incisors from Igf1rfl/fl (control) and Axin2-CreERT2;Igf1rfl/fl mice. White arrow in (F) indicates a positive signal and asterisk in (G) indicates absence of a signal. (H) Diagram depicts our model of the Igf2-WNT signaling cascade. Quantitative data are presented as mean ± SD. ****, p<0.0001. Schematic at the bottom indicates induction protocol. The white dashed lines outline the cervical loop. Four mice with four sections within each mouse per group were used to quantify Ki67+ cells. Scale bars, 100 μm.
-
Figure 3—source data 1
Source data for Figure 3E.
- https://cdn.elifesciences.org/articles/59459/elife-59459-fig3-data1-v1.xlsx
Figure 3—figure supplement 1
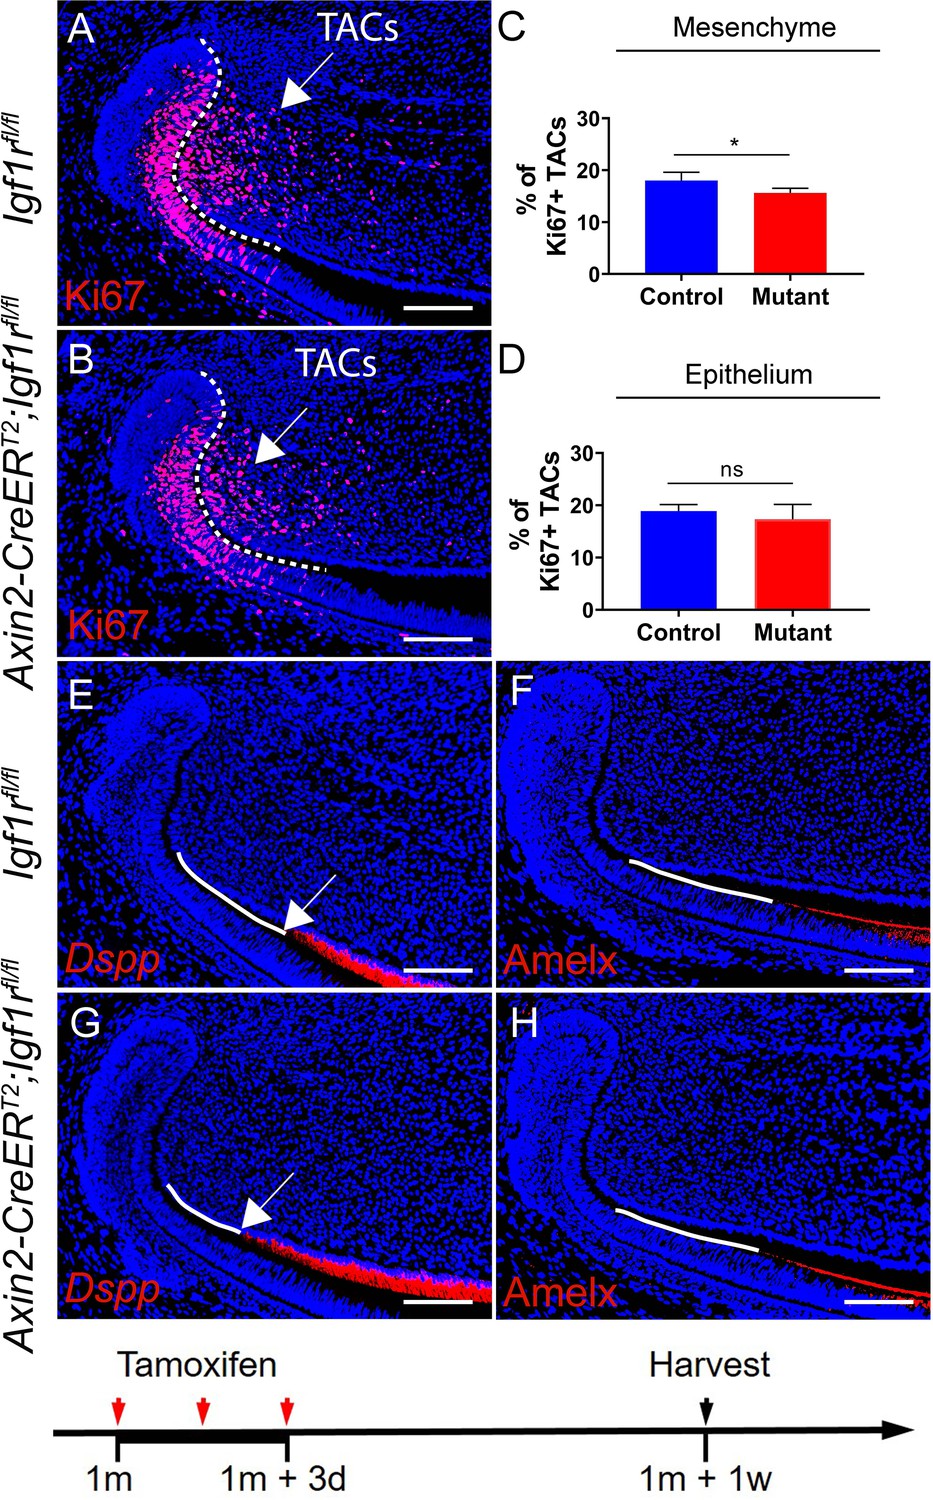
Effect of the incisor mesenchyme is primary in transit amplifying cell (TAC) loss in Axin2-CreERT2;Igf1rfl/fl incisors.
(A and B) Ki67 immunostaining of Igf1rfl/fl and Axin2-CreERT2;Igf1rfl/fl incisors 1 week after tamoxifen induction. (C and D) Quantitative analysis of Ki67+ TACs in the mesenchyme and epithelium of Igf1rfl/fl and Axin2-CreERT2;Igf1rfl/fl incisors 1 week after tamoxifen induction. (E–H) RNAscope staining of Dspp and immunostaining of Amelx in Igf1rfl/fl and Axin2-CreERT2;Igf1rfl/fl incisors 1 week after tamoxifen induction. Quantitative data are presented as mean ± SD. *, p<0.05. ns, no significance. Schematic at the bottom indicates induction protocol. White arrows in E and G indicate the position where odontoblasts start. The white dashed lines outline the cervical loop. Four mice per group, with four sections per mouse, were used to quantify Ki67+ cells. Scale bars, 100 μm.
-
Figure 3—figure supplement 1—source data 1
Source data for Figure 3—figure supplement 1C and D.
- https://cdn.elifesciences.org/articles/59459/elife-59459-fig3-figsupp1-data1-v1.xlsx
Figure 3—figure supplement 2

Canonical WNT signaling is downregulated after loss of Igf1r in the transit amplifying cells (TACs) of the mouse incisor.
(A–D) Immunostaining of c-Myc and active β-catenin in incisors from Igf1rfl/fl (control) and Axin2-CreERT2;Igf1rfl/fl mice. The white dashed lines outline the cervical loop. Arrows indicate positive signal and asterisks indicate diminished signal. Schematic at the bottom indicates induction protocol. Scale bars, 100 μm. (E) Western blot of active β-catenin in incisors from Igf1rfl/fl and Axin2-CreERT2;Igf1rfl/fl mice.
Figure 3—figure supplement 3

Long-term phenotype of Axin2-CreERT2;Igf1rfl/fl incisors.
(A–F) H and E and RNAscope staining of Dspp (red) and Ki67 staining (red) of incisors from Igf1rfl/fl (control) and Axin2-CreERT2;Igf1rfl/fl mice 5 months after tamoxifen induction. Black arrow in A indicates normal dentin and black arrow in D indicates thicker dentin. White arrows in B and E indicate the position where odontoblasts start. White arrow in C indicates positive signal and asterisk in F indicates diminished signal. White dashed lines outline the cervical loop. Schematic at the bottom indicates induction protocol. Scale bars, 100 μm.
Figure 4 with 4 supplements
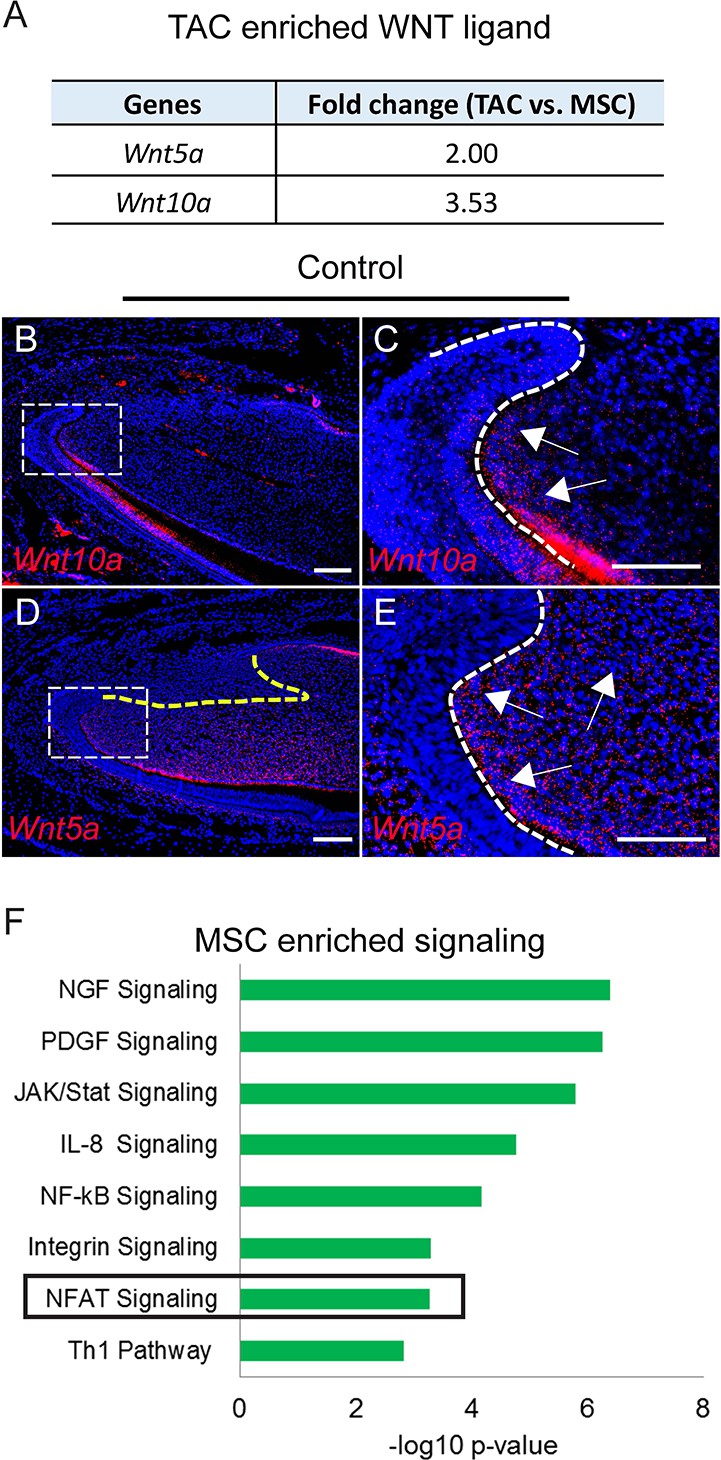
Signaling enriched in mesenchymal stem cells (MSCs) and WNT ligand enriched in transit amplifying cells (TACs).
(A) Wnt10a and Wnt5a are enriched in TACs. (B–E) RNAscope (red) of Wnt10a and Wnt5a in incisors from 1-month-old control mice. (F) Top eight signaling pathways enriched in MSCs identified by Ingenuity Pathway Analysis. Boxes in (B and D) are shown magnified in (C and E), respectively. Arrows indicate positive signal. The white dashed lines outline the cervical loop. The yellow dashed line outlines the MSC region. Scale bars, 100 μm.
Figure 4—figure supplement 1
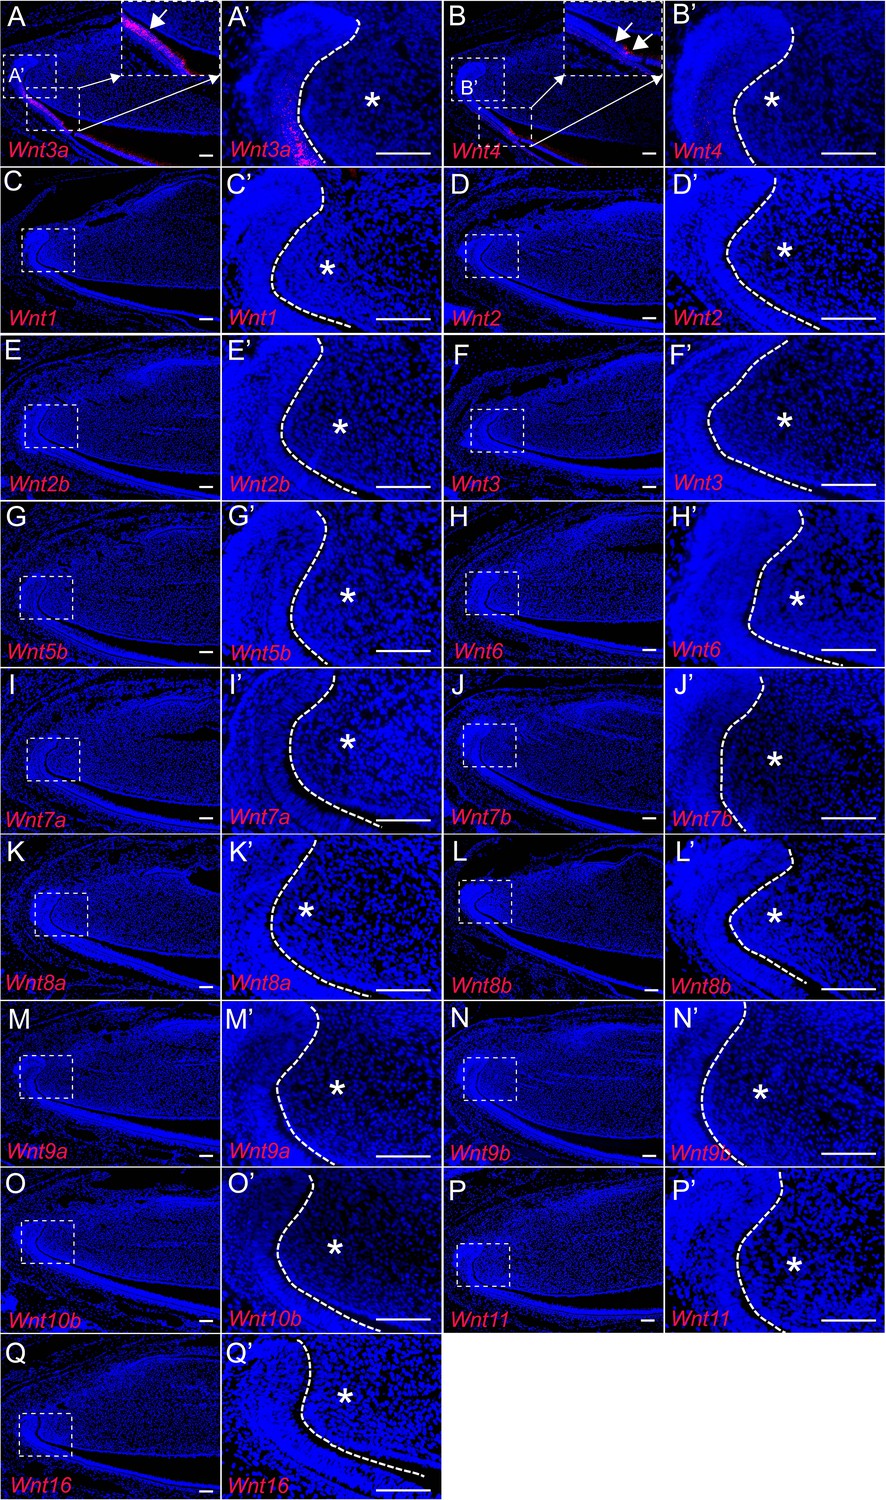
WNT ligand expression in adult incisors.
(A–Q’) RNAscope (red) of Wnt3a (A–A’), Wnt4 (B–B’), Wnt1 (C–C’), Wnt2 (D–D’), Wnt2b (E–E’), Wnt3 (F–F’), Wnt5b (G–G’), Wnt6 (H–H’), Wnt7a (I–I’), Wnt7b (J–J’), Wnt8a (K–K’), Wnt8b (L–L’), Wnt9a (M–M’), Wnt9b (N–N’), Wnt10b (O–O’), Wnt11 (P–P’), and Wnt16 (Q–Q’) in incisors of 1-month-old control mice. Boxes in (A–Q) are shown magnified in (A’–Q’), respectively. Insets in (A and B) show magnified images of the epithelium. The white dashed lines outline the cervical loop. Arrows indicate positive signal and asterisks indicate absence of signal. Scale bars, 100 μm.
Figure 4—figure supplement 2
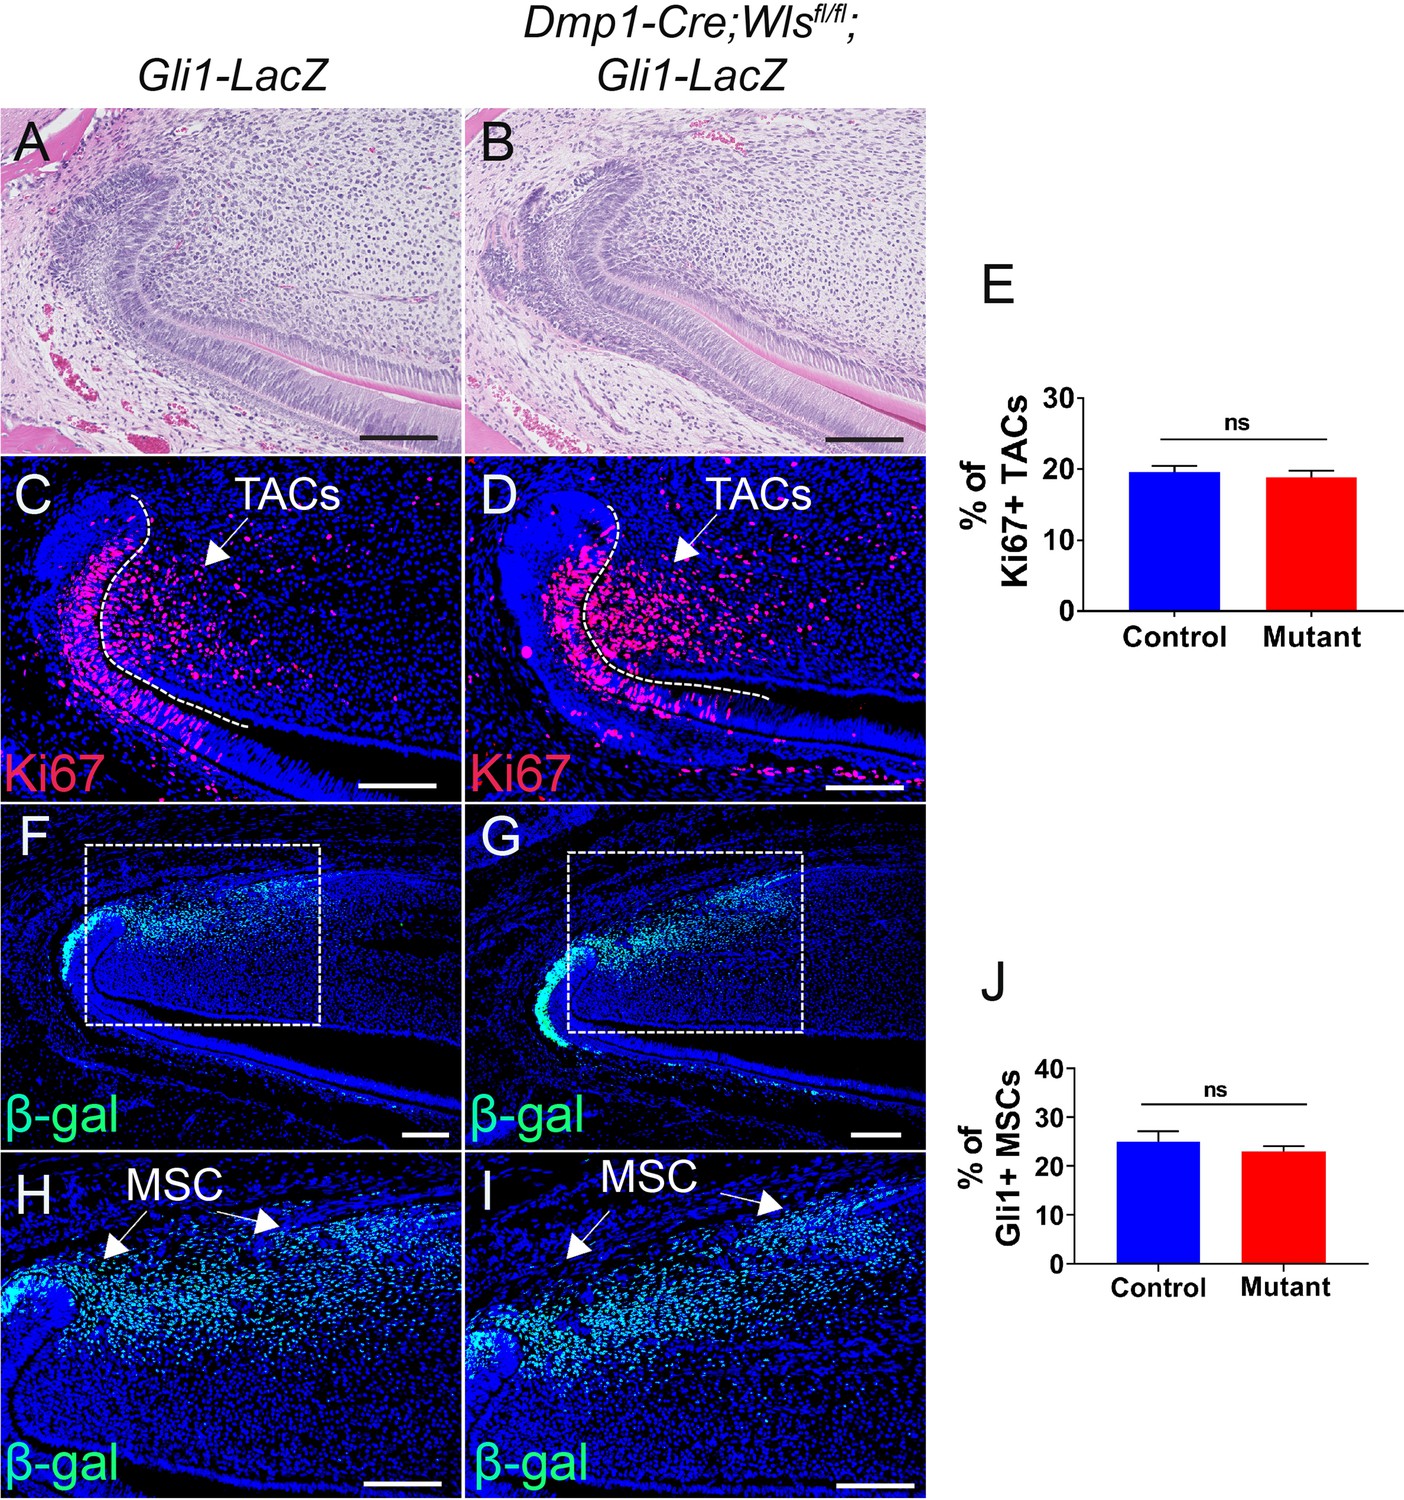
Loss of WNT signaling in odontoblasts has no effect on mesenchymal stem cells (MSCs) or transit amplifying cells (TACs).
(A–D) H and E staining and Ki67 immunofluorescence (red) of incisors from 2-month-old Gli1-LacZ (control) and Dmp1-Cre;Wlsfl/fl;Gli1-LacZ mice (mutant). (E) Quantitation of the percentage of Ki67+ cells per higher magnification section (C and D) of Gli1-LacZ and Dmp1-Cre;Wlsfl/fl;Gli1-LacZ incisor mesenchyme. (F–I) β-gal staining (green) of incisors from 2-month-old Gli1-LacZ and Dmp1-Cre;Wlsfl/fl;Gli1-LacZ mice. (J) Quantitation of the percentage of Gli1+ cells per higher magnification section (H and I) of Gli1-LacZ and Dmp1-Cre; Wlsfl/fl;Gli1-LacZ incisor mesenchyme. Arrows indicate positive signal. The white dashed lines outline the cervical loop. All quantitative data are presented as mean ± SD. ns, no significance. Four mice with four sections within each mouse per group were used to quantify Ki67+ cells. Gli1+ cells in the proximal region between the two cervical loops were counted in the mouse incisor. Scale bars, 100 μm.
-
Figure 4—figure supplement 2—source data 1
Source data for Figure 4—figure supplement 2E and J.
- https://cdn.elifesciences.org/articles/59459/elife-59459-fig4-figsupp2-data1-v1.xlsx
Figure 4—figure supplement 3
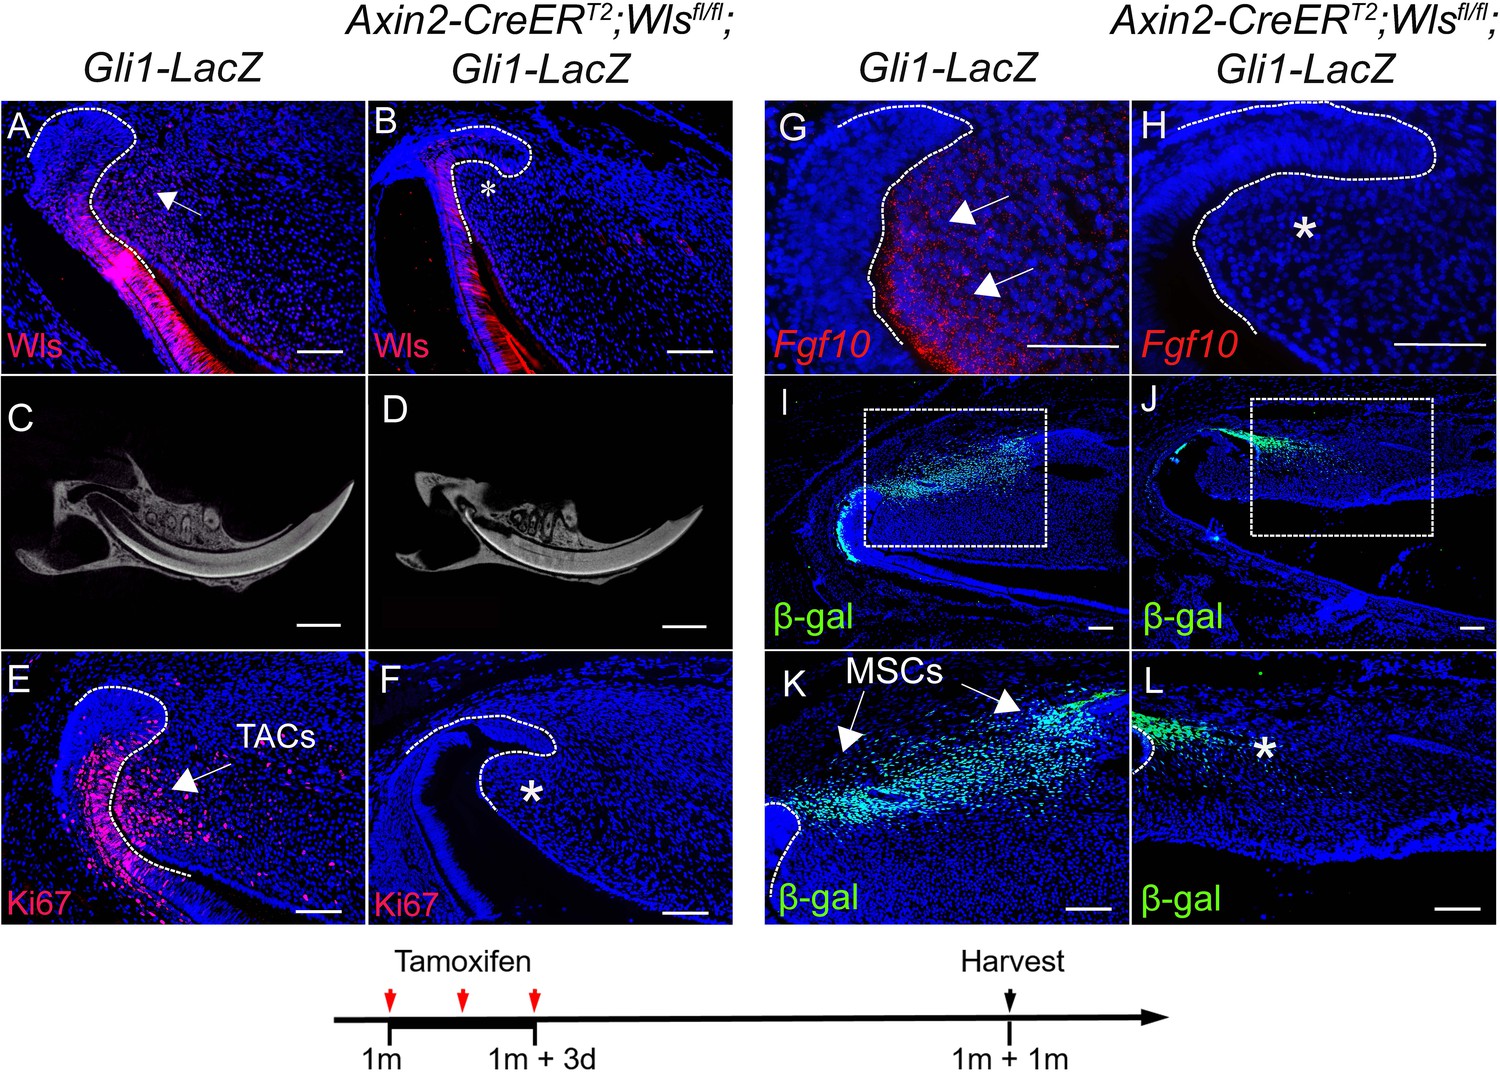
Loss of Wls in transit amplifying cells (TACs) results in diminished TACs and mesenchymal stem cells (MSCs) in the incisors of Axin2-CreERT2;Wlsfl/fl;Gli1-LacZ mice.
(A and B) Wls immunofluorescence (red) and DAPI staining (blue) of incisors from 2-month-old Gli1-LacZ (control) and Axin2-CreERT2;Wlsfl/fl;Gli1-LacZ mice. (C and D) MicroCT images of incisors from 2-month-old Gli1-LacZ and Axin2-CreERT2;Wlsfl/fl;Gli1-LacZ mice induced with tamoxifen for 1 month. (E–H) Ki67 immunofluorescence (red) and RNAscope (red) of Fgf10 in incisors of 2-month-old control and Axin2-CreERT2;Wlsfl/fl;Gli1-LacZ mice. (I–L) β-gal staining (green) of incisors from 2-month-old Gli1-LacZ and Axin2-CreERT2;Wlsfl/fl;Gli1-LacZ mice. The white dashed lines outline the cervical loop. Arrow indicates positive signal and asterisk indicates absence of signal. Schematic at the bottom indicates induction protocol. Scale bars for (E and F), 2 mm; Scale bars for others, 100 μm.
Figure 4—figure supplement 4

WNT receptor expression in adult incisors.
(A–H) RNAscope (red) of Lrp5 (A and B), Fzd2 (C and D), Fzd4 (E and F), and Fzd6 (G and H) in incisors of 1-month-old control mice. Boxes in (A, C, E, and G) are shown magnified in (B, D, F, and H), respectively. Arrows indicate positive signal and asterisks indicate absence of signal. Scale bars, 100 μm.
Figure 5 with 3 supplements
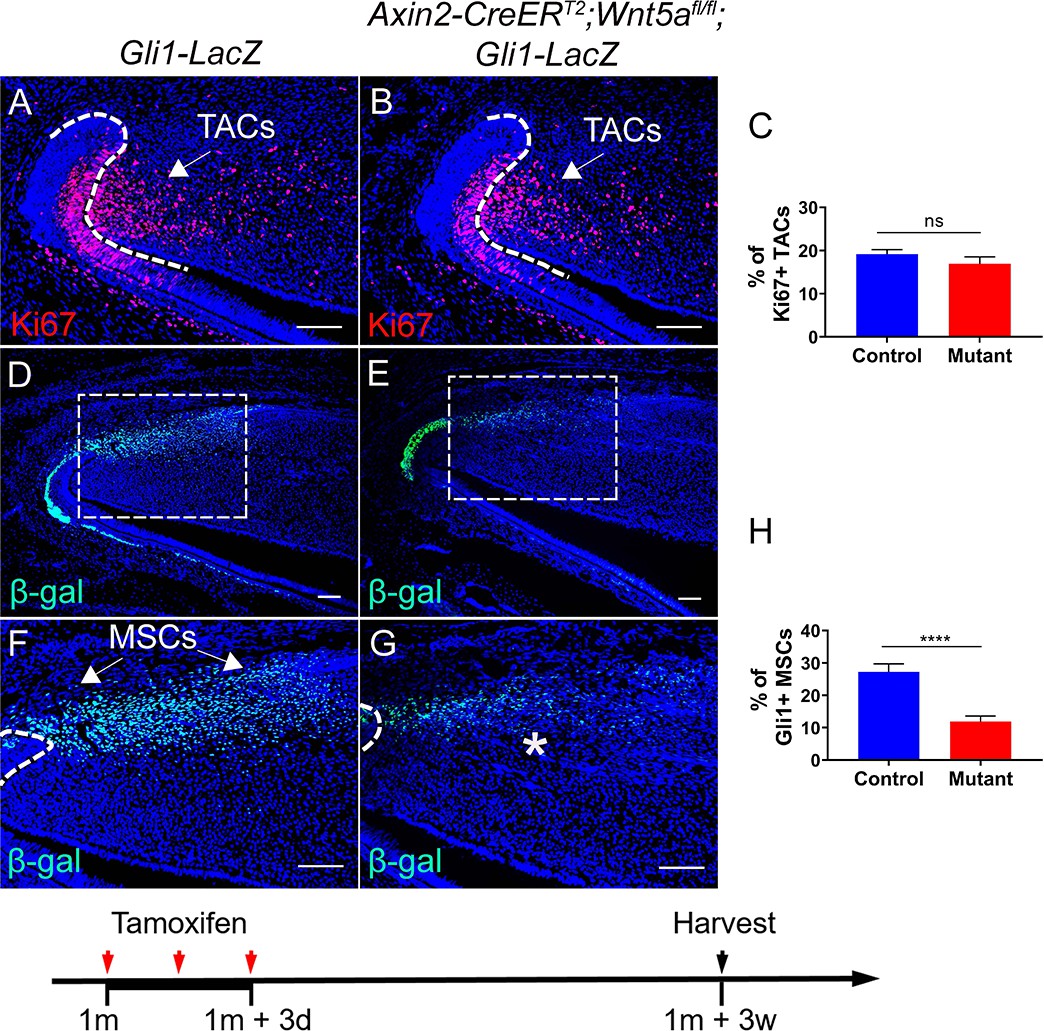
Loss of Wnt5a results in loss of Gli1+ mesenchymal stem cells (MSCs).
(A and B) Ki67 staining (red) of incisors from Gli1-LacZ (control) and Axin2-CreERT2;Wnt5afl/fl;Gli1-LacZ mice 3 weeks after tamoxifen induction. (C) Quantitation of the percentage of Ki67+ transit amplifying cells (TACs) from (A and B). (D–G) β-gal staining (green) of incisors from 1-month-old Gli1-LacZ and Axin2-CreERT2;Wnt5afl/fl;Gli1-LacZ mice 3 weeks after tamoxifen induction. Boxes in (D and E) are shown magnified in (F and G), respectively. (H) Quantitation of the percentage of Gli1+ cells per higher magnification section (F and G) of Gli1-LacZ and Axin2-CreERT2;Wnt5afl/fl;Gli1-LacZ incisor mesenchyme. Schematic at the bottom indicates induction protocol. The white dashed lines outline the cervical loop. Arrows indicate positive signal and asterisks indicate diminished signal. All quantitative data are presented as mean ± SD. ns, no significance. ****, p<0.0001. Four mice with four sections within each mouse per group were used to quantify Ki67+ cells. Gli1+ cells in the proximal region between the two cervical loops were counted in the mouse incisor. Scale bars, 100 μm.
-
Figure 5—source data 1
Source data for Figure 5C and H.
- https://cdn.elifesciences.org/articles/59459/elife-59459-fig5-data1-v1.xlsx
Figure 5—figure supplement 1
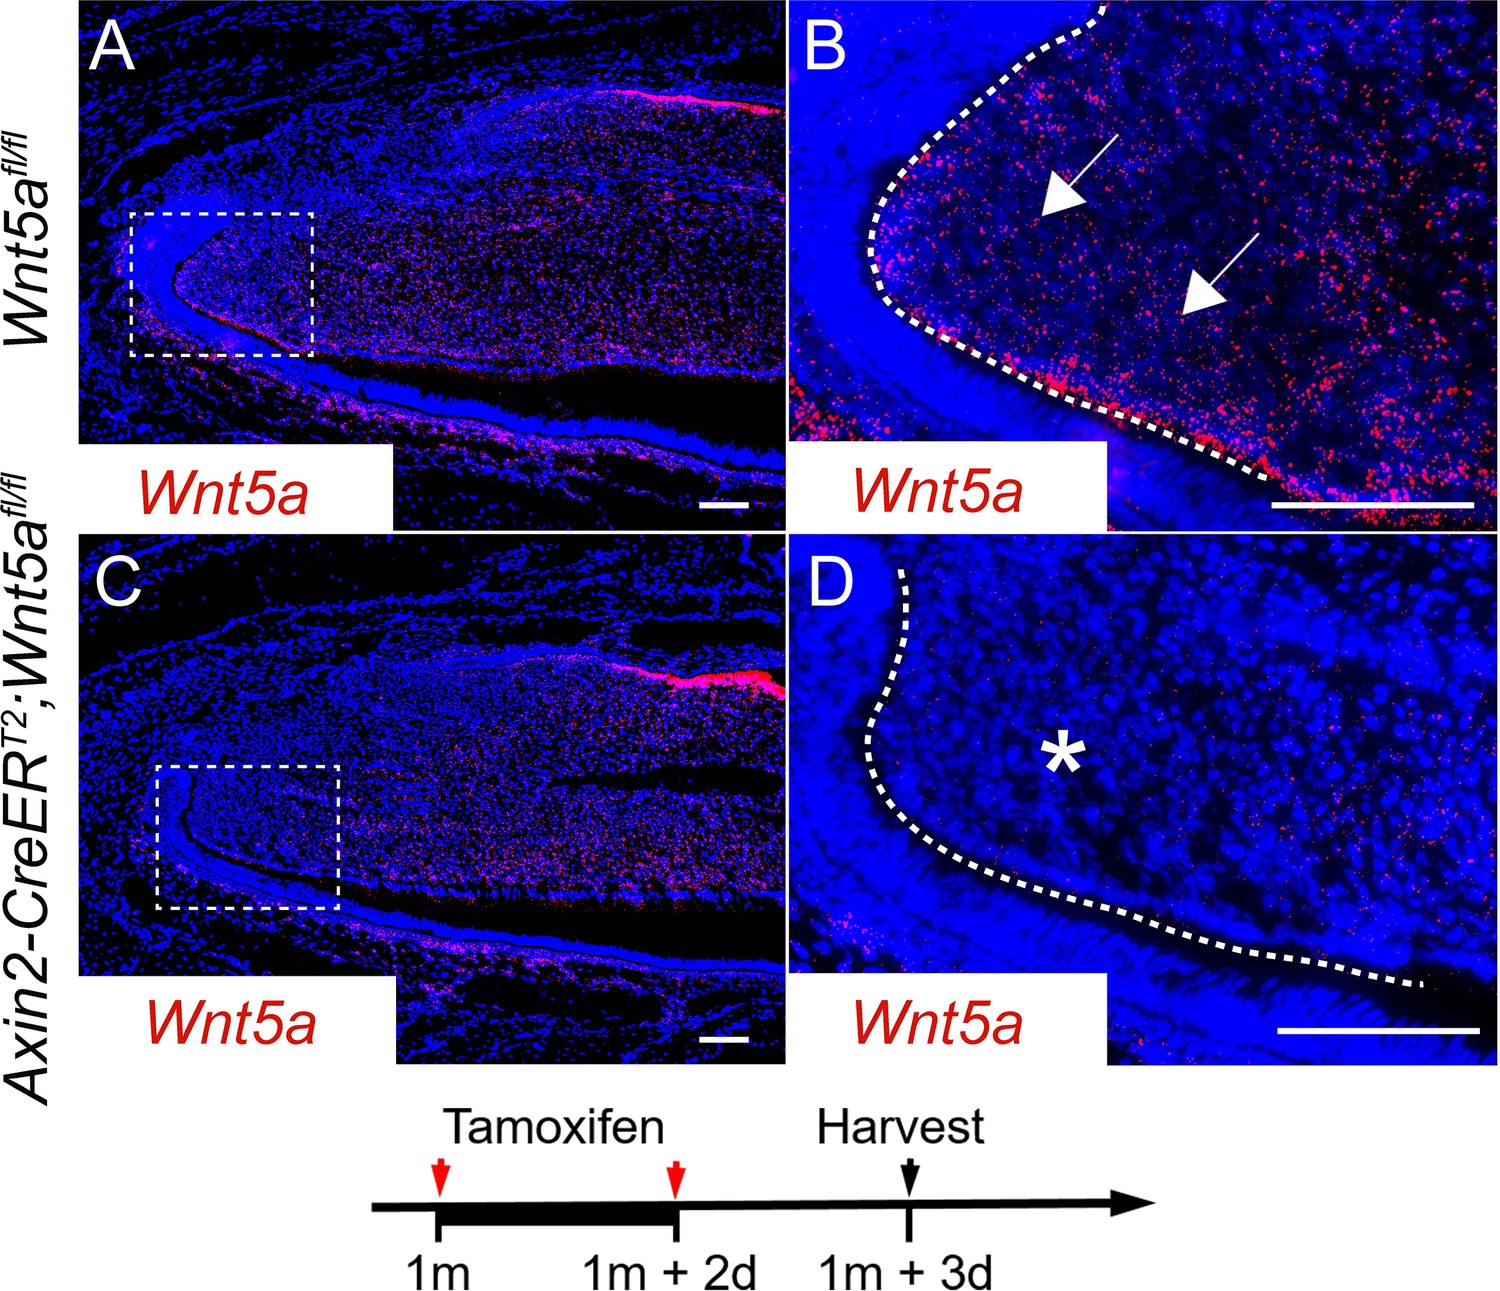
Validation of Wnt5a knockout efficiency in Axin2-CreERT2;Wnt5afl/fl incisors.
(A–D) RNAscope (red) of Wnt5a in incisors from Wnt5afl/fl (control) and Axin2-CreERT2;Wnt5afl/fl incisors 3 days after tamoxifen induction. White arrow indicates positive signal and asterisk indicates diminished signal. Schematic at the bottom indicates induction protocol. Scale bars, 100 μm.
Figure 5—figure supplement 2
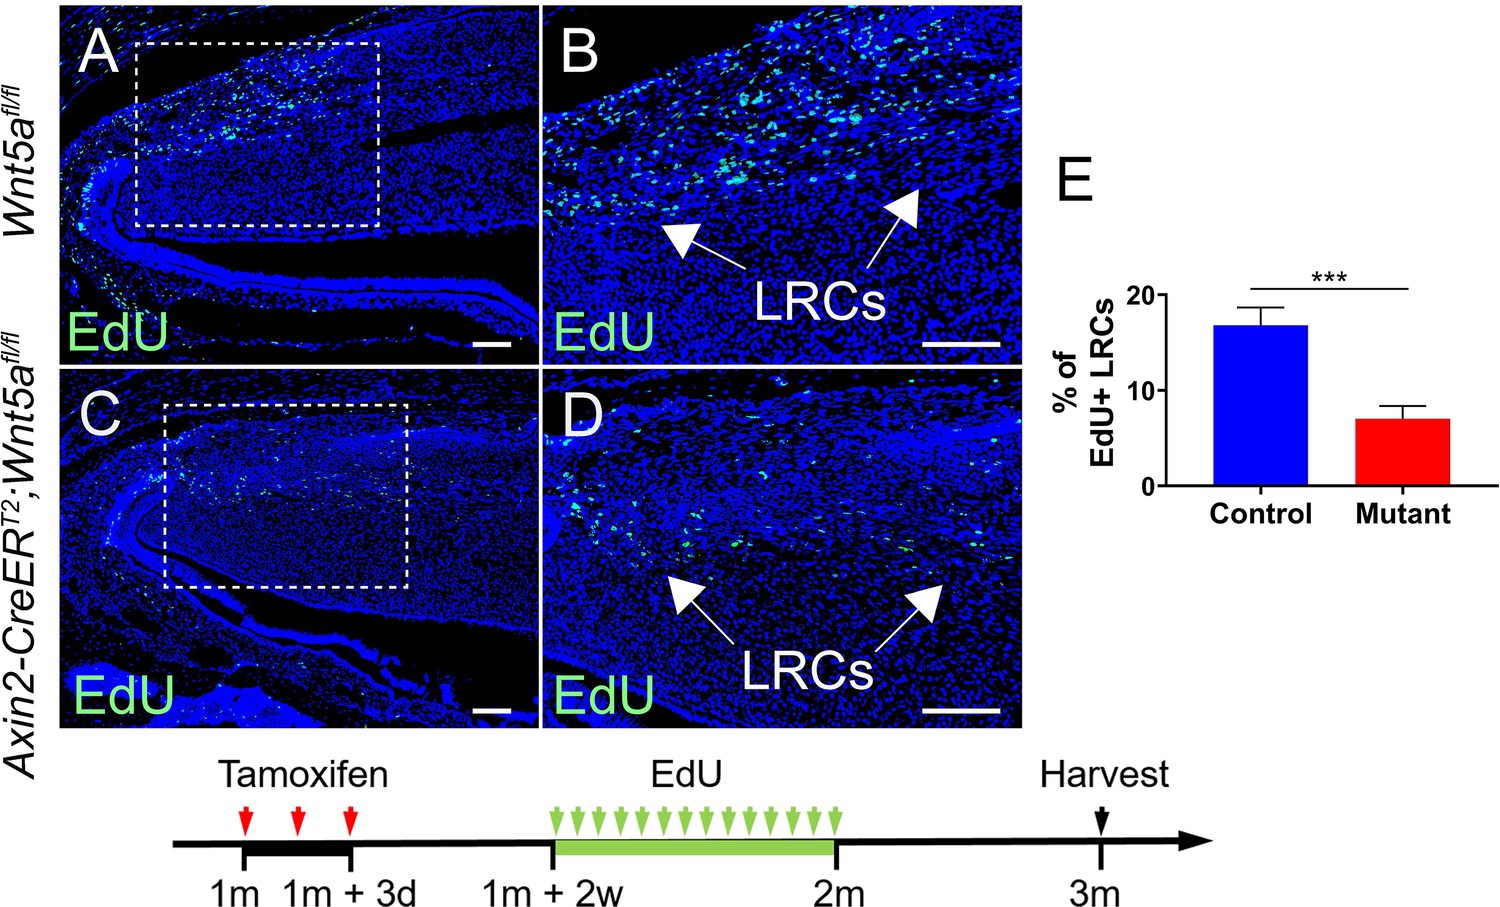
Loss of Wnt5a results in diminished EdU+ label retaining cells (LRCs).
(A–D) EdU staining of Wnt5afl/fl and Axin2-CreERT2;Wnt5afl/fl mouse incisors. (E) Quantification was performed by calculating the percentage of EdU+ cells per section under higher magnification (B and D) in Wnt5afl/fl and Axin2-CreERT2;Wnt5afl/fl mouse incisor mesenchyme. Schematic underneath figures indicates induction protocol. All quantitative data are presented as mean ± SD. ***, p<0.001. Scale bars, 100 μm.
-
Figure 5—figure supplement 2—source data 1
Source data for Figure 5—figure supplement 2E.
- https://cdn.elifesciences.org/articles/59459/elife-59459-fig5-figsupp2-data1-v1.xlsx
Figure 5—figure supplement 3
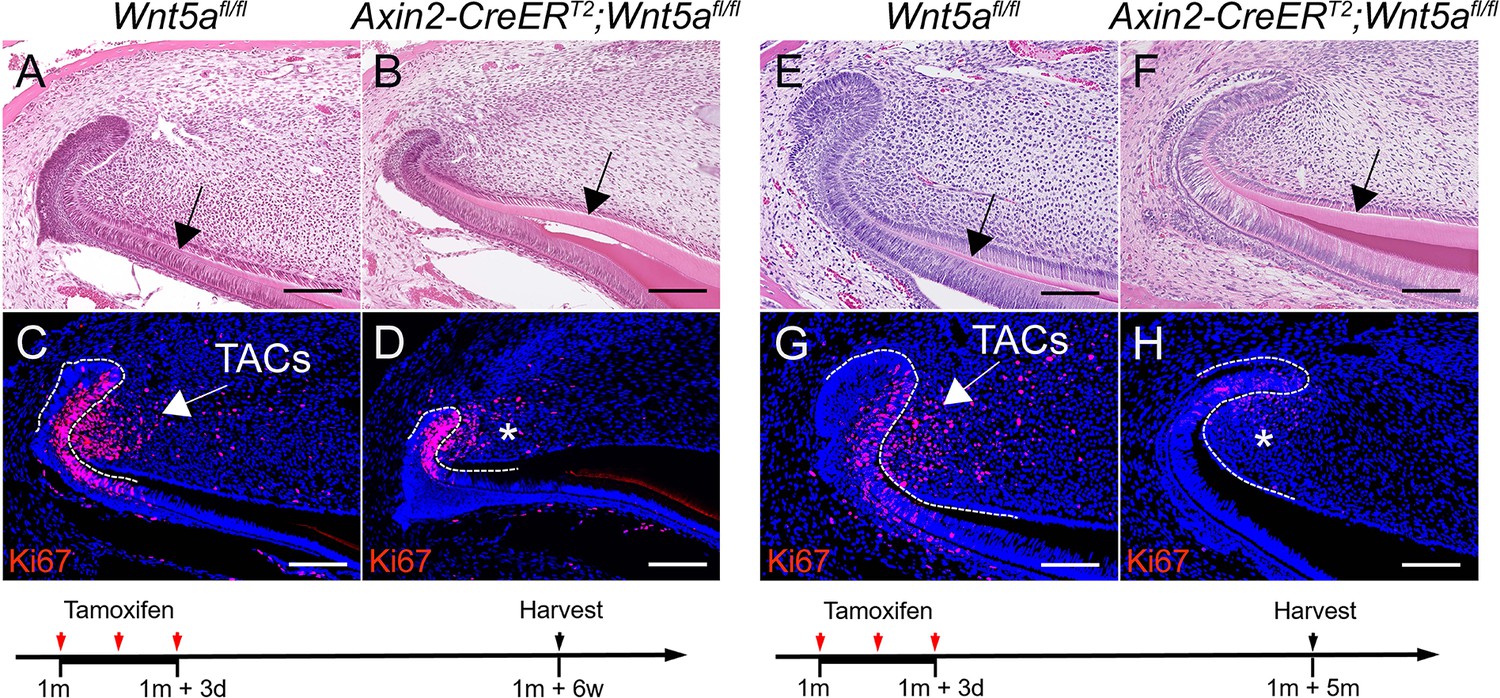
Loss of Wnt5a results in thicker dentin and diminished transit amplifying cells (TACs).
(A–D) H and E and Ki67 staining (red) of incisors from 1-month-old Wnt5afl/fl (control) and Axin2-CreERT2;Wnt5afl/fl mice 6 weeks after tamoxifen induction. (E–H) H and E and Ki67 staining (red) of incisors from Wnt5afl/fl (control) and Axin2-CreERT2;Wnt5afl/fl mice 5 months after tamoxifen induction. Black arrows in A and E indicate normal dentin and black arrows in B and F indicate thicker dentin. White arrows in C and G indicate positive signal and asterisks in D and H indicate diminished signal. White dashed lines outline the cervical loop. Schematics at the bottom indicate induction protocols. Scale bars, 100 μm.
Figure 6 with 1 supplement

Ror2-mediated non-canonical Wnt signaling regulates mesenchymal stem cell (MSC) maintenance in the incisor.
(A and B) RNAscope (red) of Ror2 in incisors from Gli1-LacZ (control) and Gli1-CreERT2;Ror2fl/fl;Gli1-LacZ 1-month-old mice. Insets in A and B show magnified images of the MSC region. (C–F) β-gal staining (green) of incisors from Gli1-LacZ and Gli1-CreERT2;Ror2fl/fl;Gli1-LacZ mice. Boxes in C and D are shown magnified in E and F, respectively. (G) Quantification of the percentage of Gli1+ cells per higher magnification section of Gli1-LacZ (control) and Gli1-CreERT2;Ror2fl/fl;Gli1-LacZ (mutant) mouse incisor mesenchyme in E and F. Gli1+ cells in the proximal region between the two cervical loops were counted in the mouse incisor. Quantitative data are presented as mean ± SD. ****, p<0.0001. Arrows indicate positive signal and asterisks indicate diminished signal. Schematic at the bottom indicates induction protocol. Scale bars, 100 μm.
-
Figure 6—source data 1
Source data for Figure 6G.
- https://cdn.elifesciences.org/articles/59459/elife-59459-fig6-data1-v1.xlsx
Figure 6—figure supplement 1

Loss of Ror2 results in diminished EdU+ label retaining cells (LRCs).
(A–D) EdU staining of Ror2fl/fl and Gli1-CreERT2;Ror2fl/fl mouse incisors. (E) Quantification was performed by calculating the percentage of EdU+ cells per section of Ror2fl/fl and Gli1-CreERT2;Ror2fl/fl incisor mesenchyme under higher magnification (B and D). Schematic underneath figures indicates induction protocol. All quantitative data are presented as mean ± SD. ****, p<0.0001. Scale bars, 100 μm.
-
Figure 6—figure supplement 1—source data 1
Source data for Figure 6—figure supplement 1E.
- https://cdn.elifesciences.org/articles/59459/elife-59459-fig6-figsupp1-data1-v1.xlsx
Figure 7
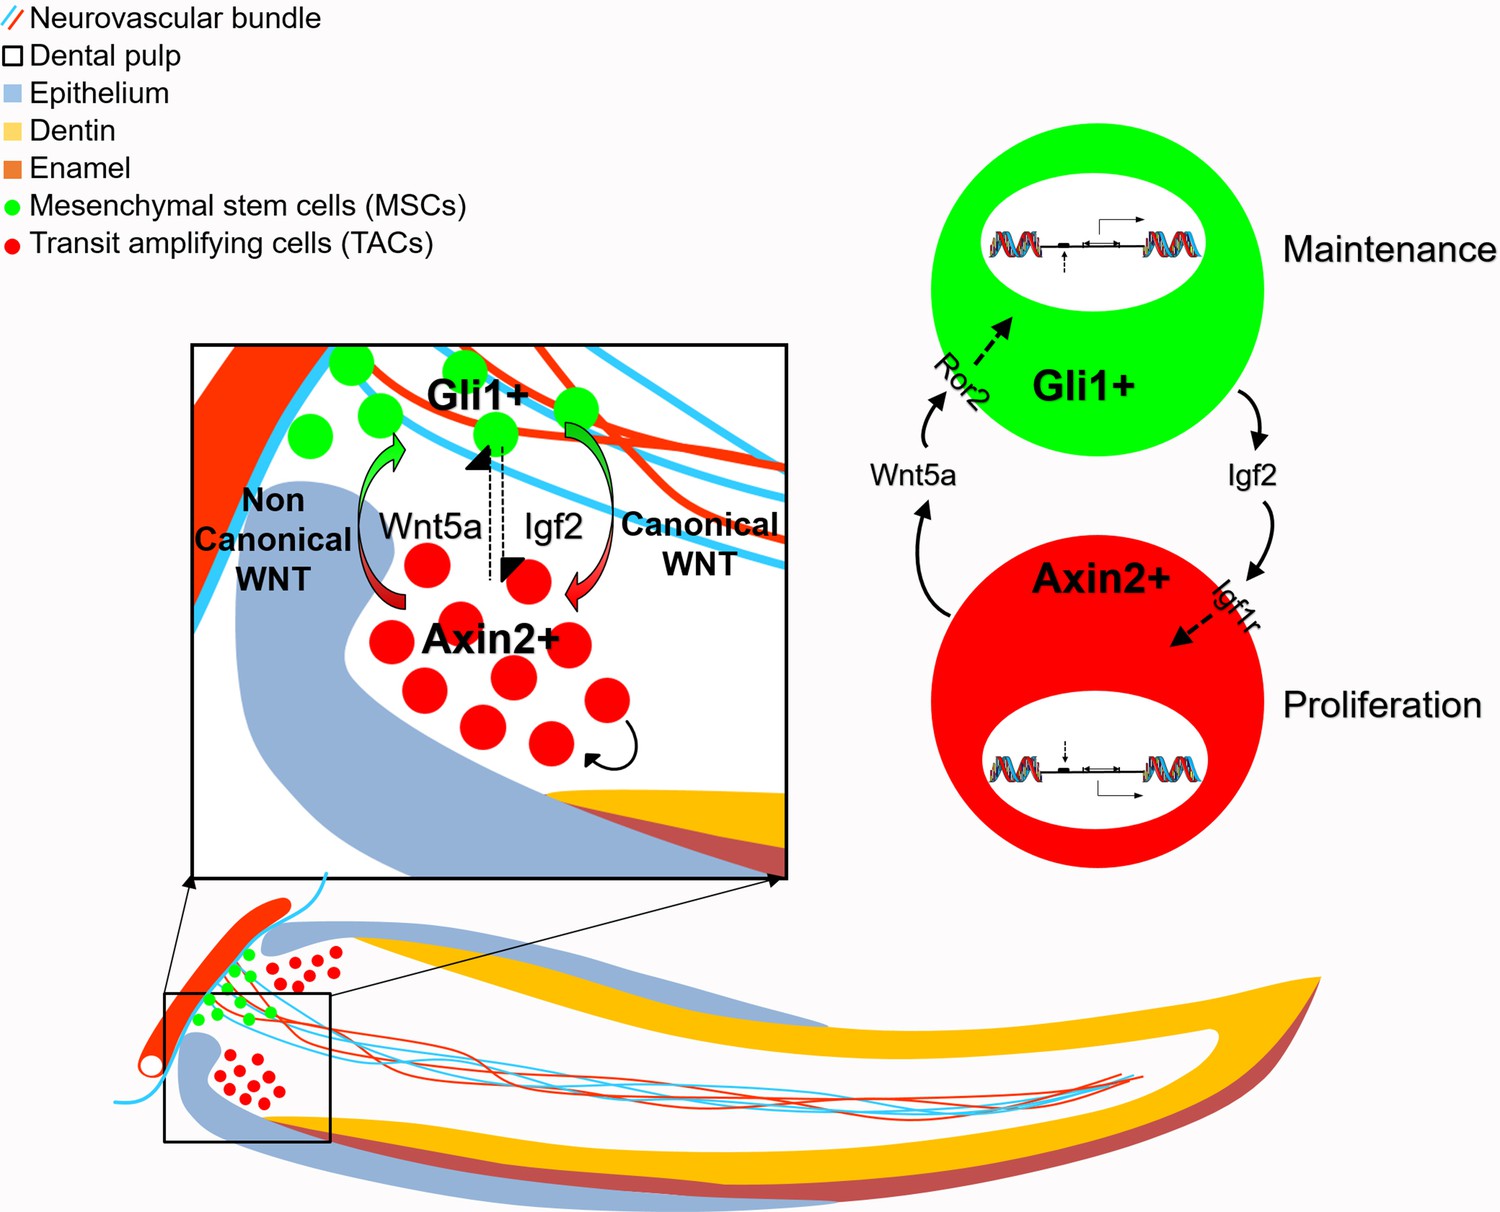
Schematic diagram of bidirectional interaction between transit amplifying cells (TACs) and mesenchymal stem cells (MSCs).
Igf2 secreted from Gli1+ MSCs binds to Igf1r in the Axin2+ TACs, activating target gene expression and regulate TAC proliferation. Wnt5a serves as a non-canonical WNT ligand, feeding back to MSCs through Ror2 to activate downstream gene expression to regulate the maintenance of MSCs. Thus, MSCs and TACs dynamically interact with each other to maintain mesenchymal tissue homeostasis.
Author response image 1
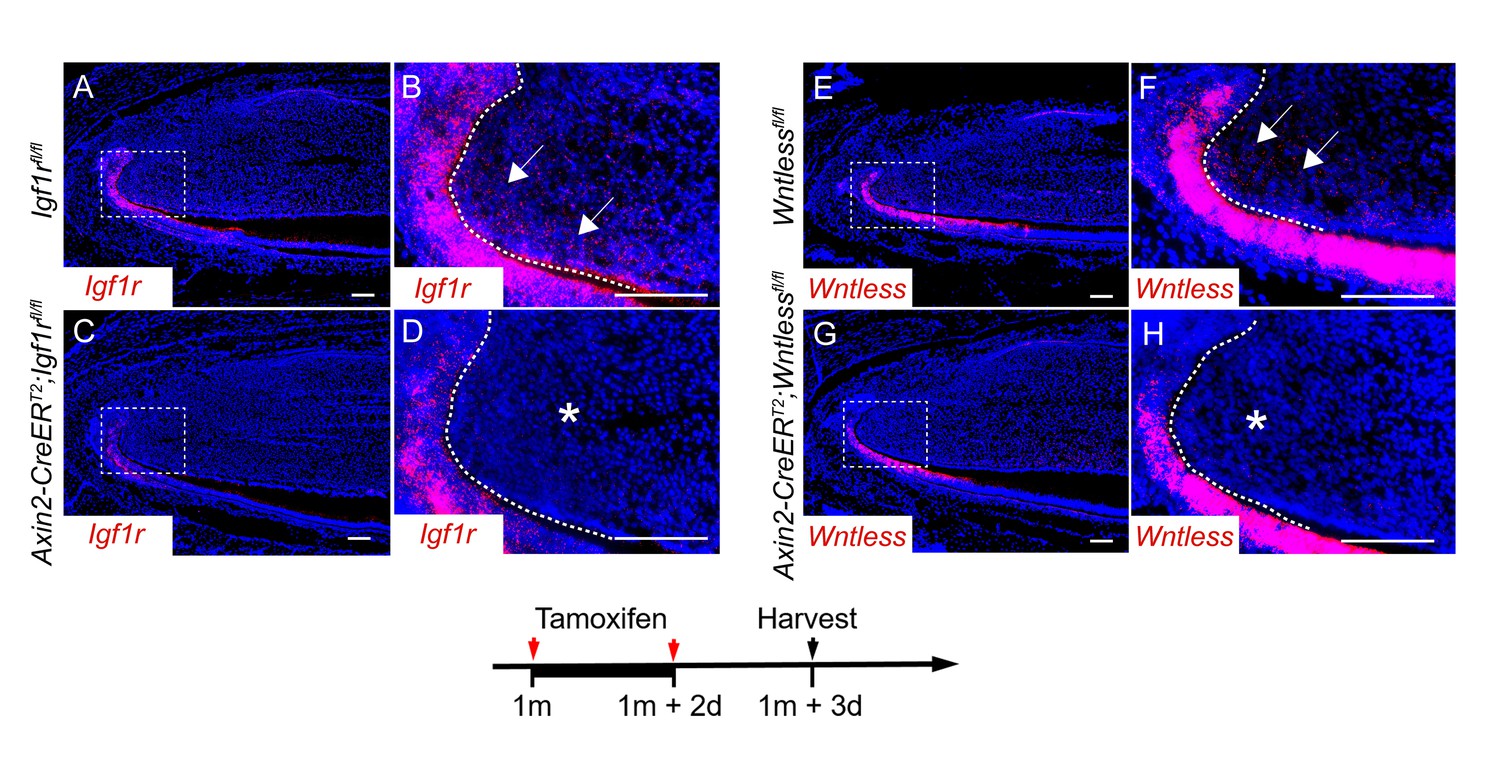
RNAscope staining of Igf1r (A-D) and Wntless (E-H) in control, Axin2-CreERT2;Igf1rfl/fl and Axin2-CreERT2;Wntlessfl/fl mutant incisors three days after tamoxifen induction.
Arrow indicates positive signal and asterisk indicates absence of signal.
Author response image 2
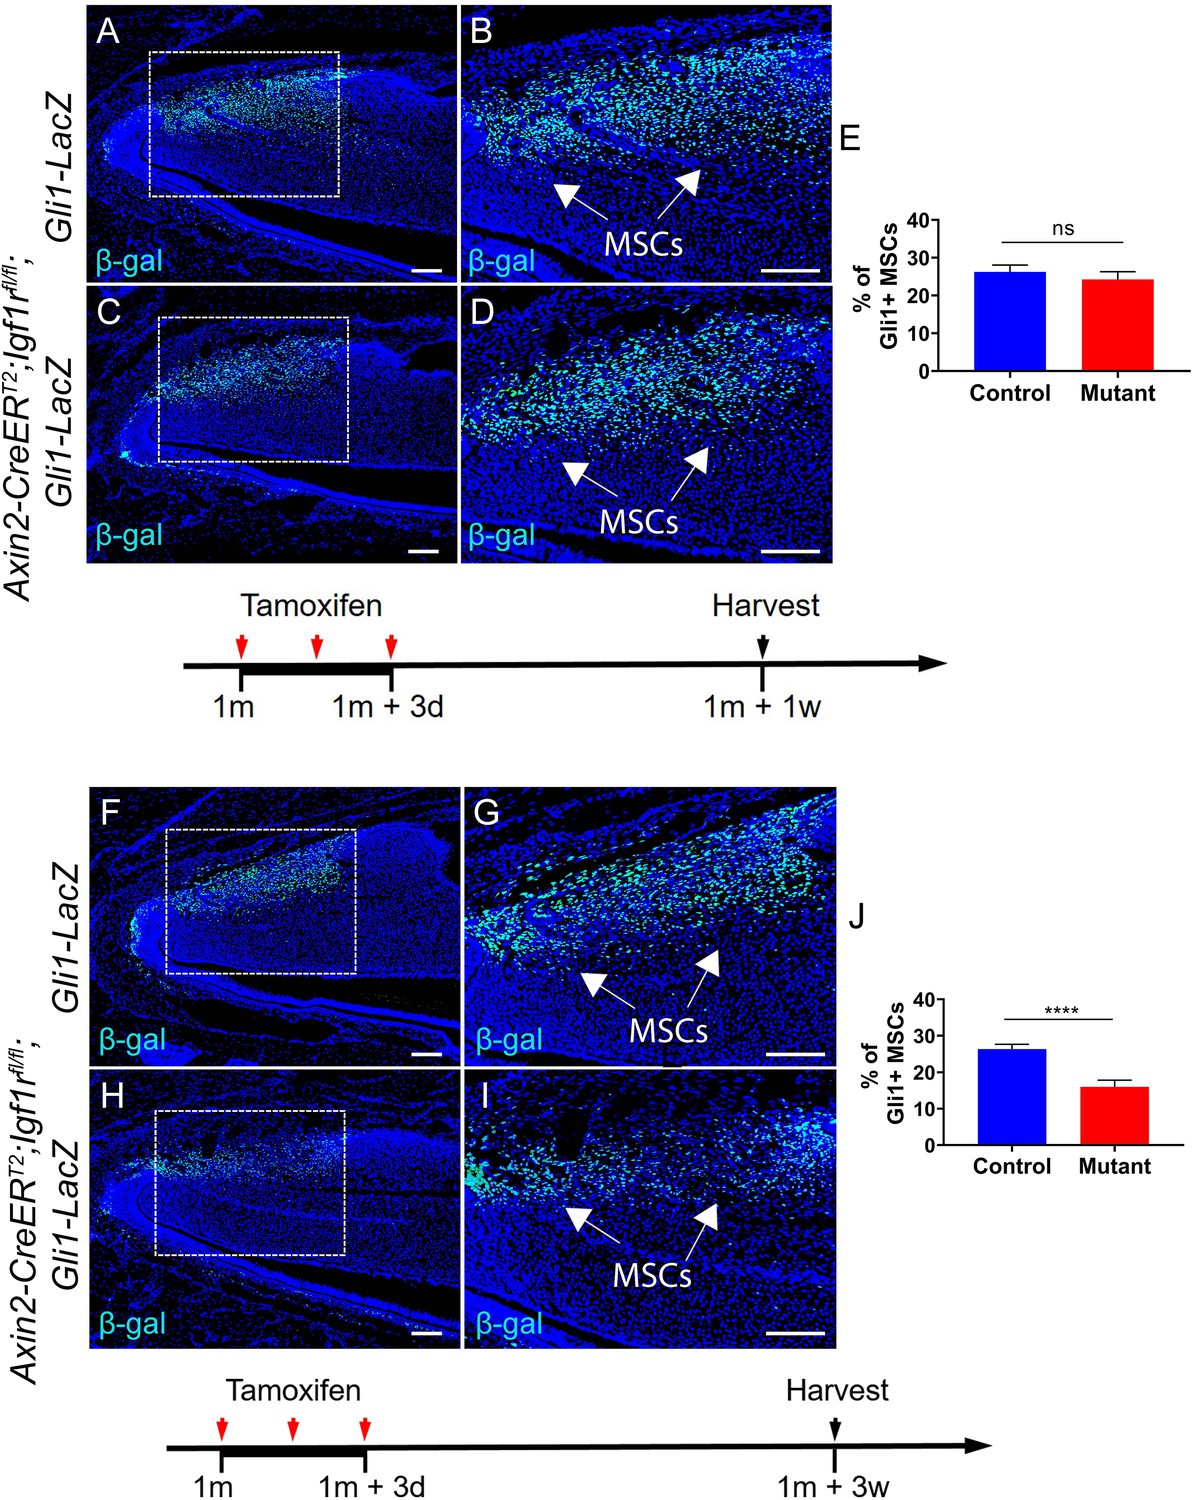
(A-D) Immunostaining of β-gal in Gli1-lacZ and Axin2-CreERT2;Igf1rfl/fl;Gli1-LacZ incisors one week after tamoxifen induction.
(E) Quantitative analysis of Gli1+ MSCs of Gli1-lacZ and Axin2-CreERT2;Igf1rfl/fl;Gli1-LacZ incisors one week after tamoxifen induction. (F-I) Immunostaining of β-gal in Gli1-lacZ and Axin2CreERT2;Igf1rfl/fl;Gli1-LacZ incisors three weeks after tamoxifen induction. (J) Quantitative analysis of Gli1+ MSCs of Gli1-lacZ and Axin2-CreERT2;Igf1rfl/fl;Gli1-LacZ incisors three weeks after tamoxifen induction.
Author response image 3

(A-D) H & E staining and Ki67 immunostaining of Wntlessfl/fl and Axin2-CreERT2;Wntlessfl/fl incisors five months after tamoxifen induction.
Black arrow in (A) indicates normal dentin and black arrow in (C) indicates thicker dentin.
Author response image 4
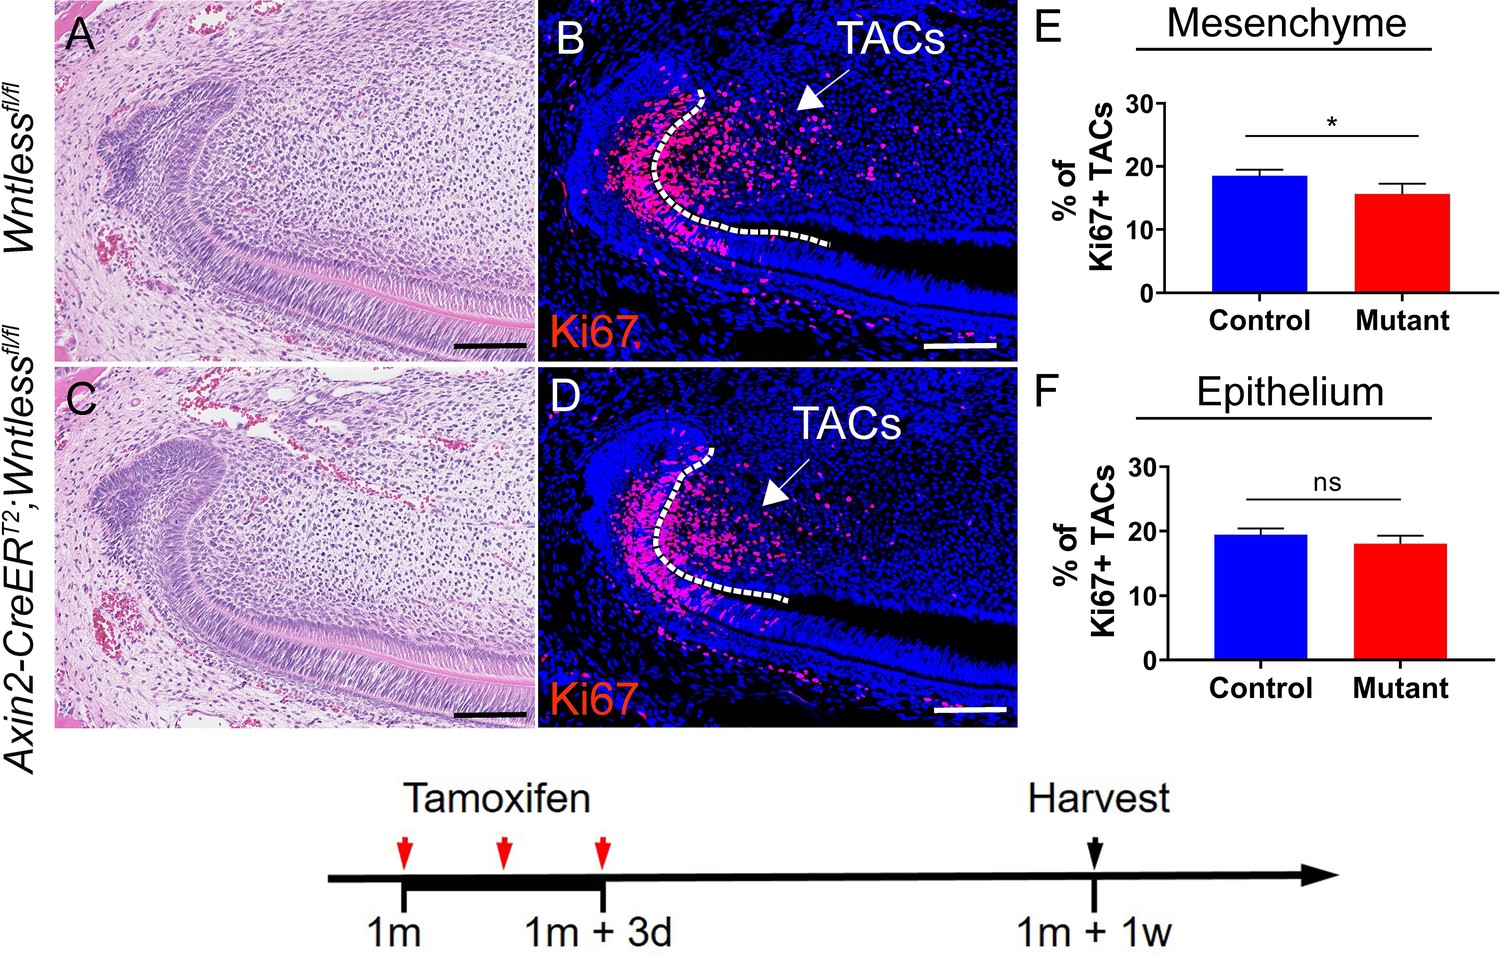
(A-D) H & E staining and Ki67 immunostaining of Wntlessfl/fl and Axin2-CreERT2;Wntlessfl/fl incisors.
(E-F) Quantitative analysis of Ki67+ TACs in the mesenchyme and epithelium of Wntlessfl/fl and Axin2-CreERT2;Wntlessfl/fl incisors one week after tamoxifen induction.
Author response image 5
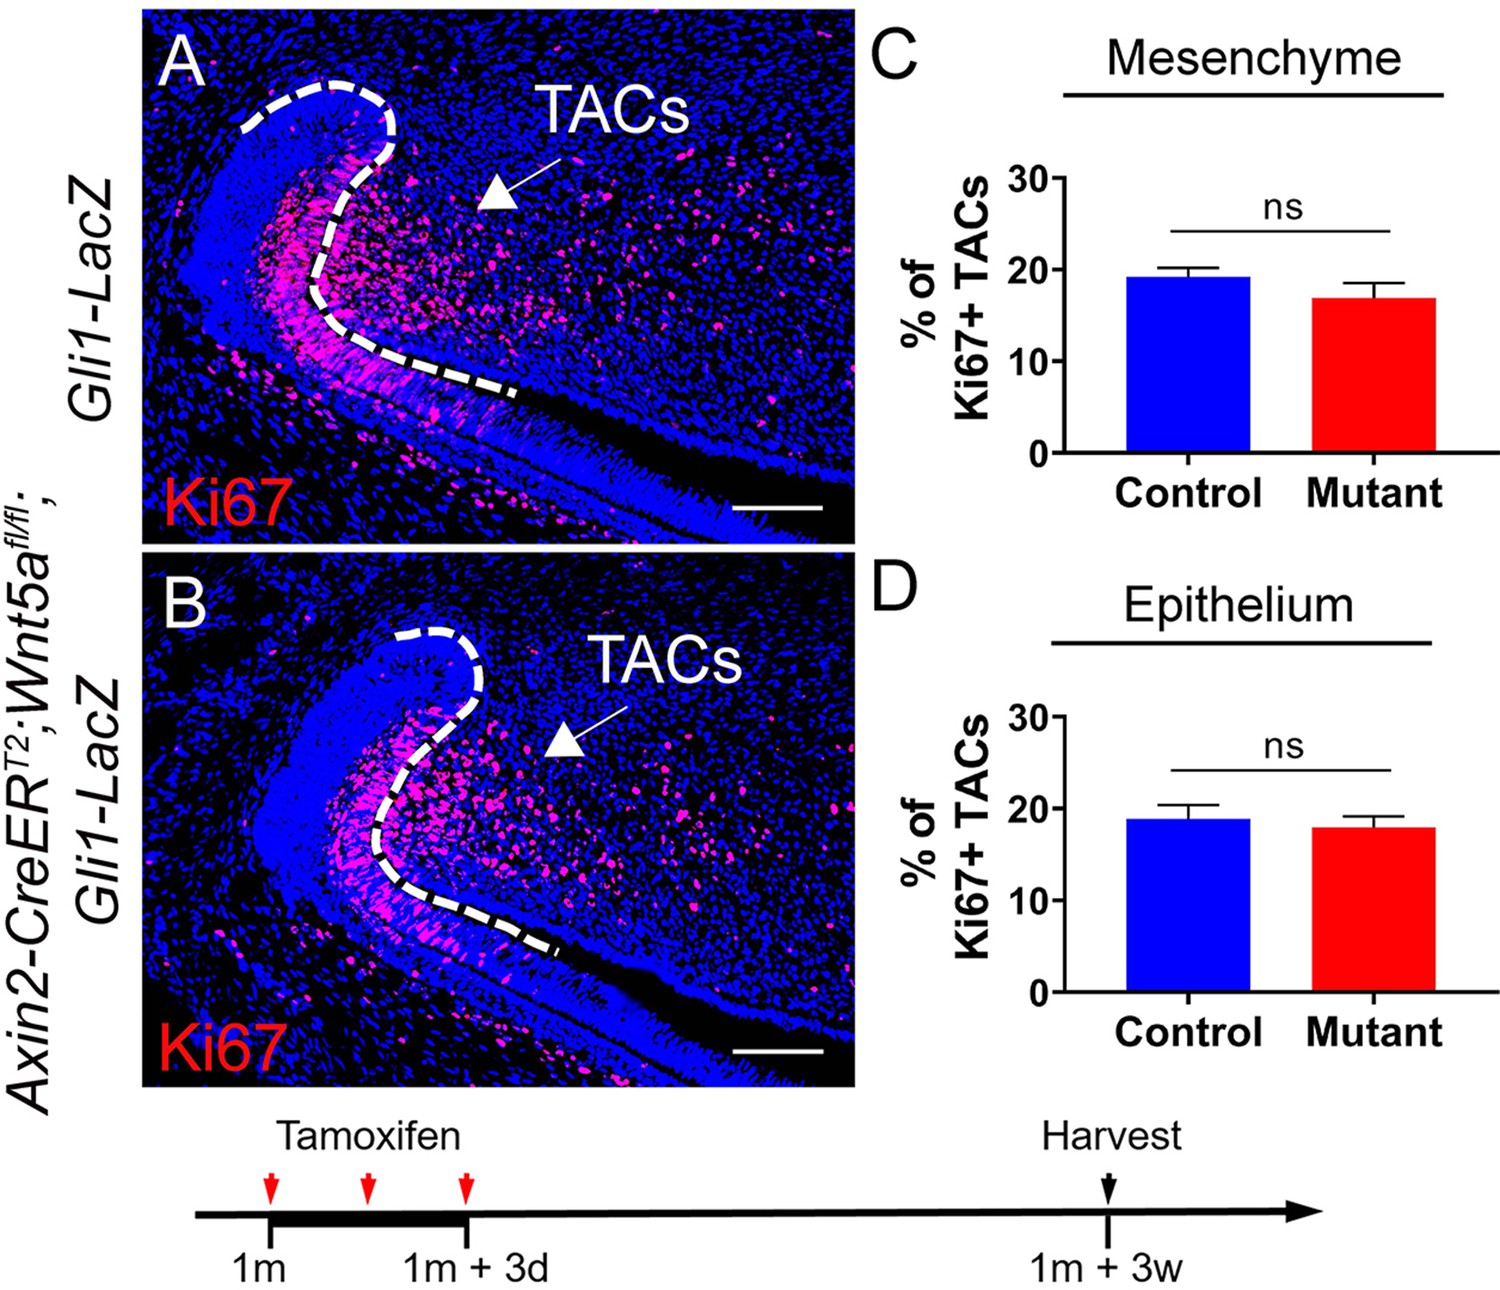
(A-B) Ki67 immunostaining of Gli1-LacZ and Axin2-CreERT2;Wnt5afl/fl;Gli1-LacZ incisors three weeks after tamoxifen induction.
(C-D) Quantitative analysis of Ki67+ TACs in the mesenchyme and epithelium of Gli1-LacZ and Axin2-CreERT2;Wnt5afl/fl;Gli1-LacZ incisors three weeks after tamoxifen induction.
Author response image 6
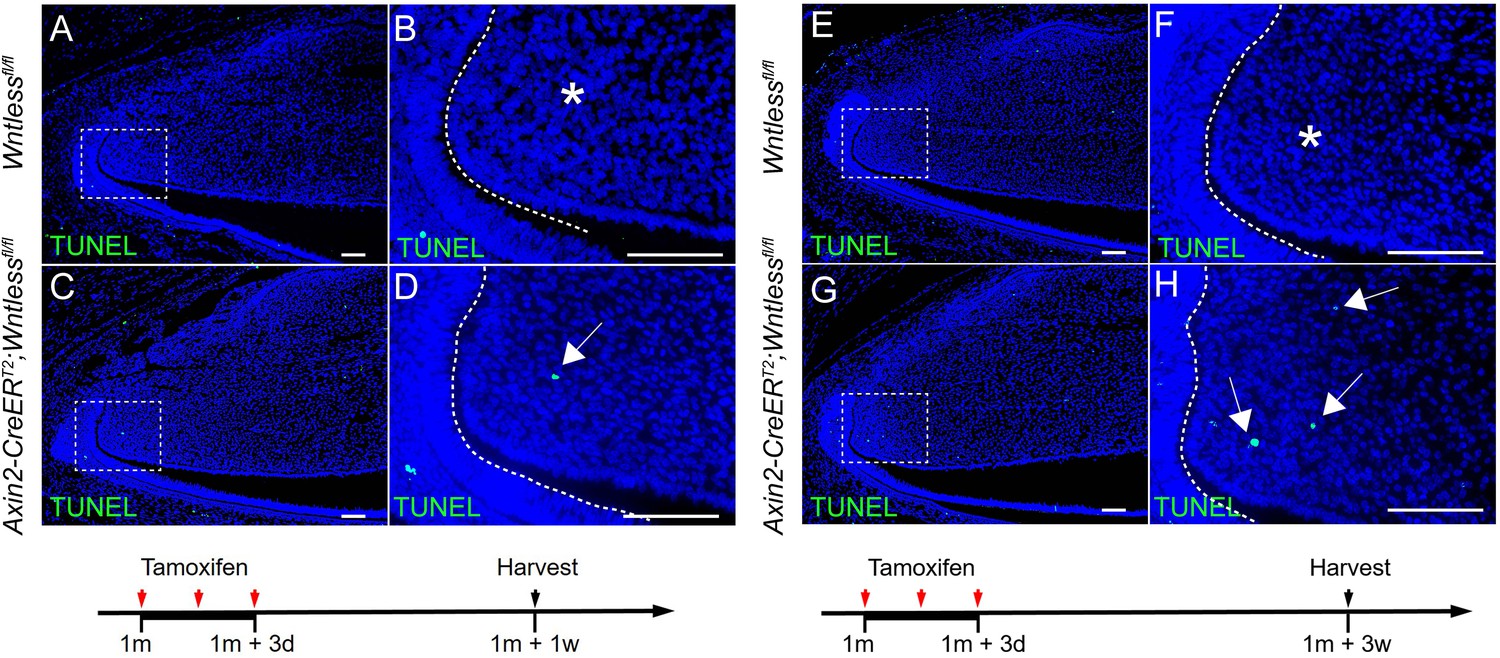
(A-H) TUNEL staining of Wntlessfl/fl and Axin2-CreERT2;Wntlessfl/fl incisors one week and 3 weeks after tamoxifen induction.
Arrow indicates positive signal and asterisk indicates absence of signal.
Author response image 7

(A-F) Immunostaining of β-gal in Gli1-LacZ, Gli1-CreERT2;Gli1-LacZ and Gli1-CreERT2;Ror2fl/fl;Gli1LacZ incisors 3 weeks after tamoxifen induction.
(G) Quantitative analysis of Gli1+ MSCs in the mesenchyme of Gli1-LacZ, Gli1-CreERT2;Gli1-LacZ and Gli1-CreERT2;Ror2fl/fl;Gli1-LacZ incisors at higher magnification (B, D and F) 3 weeks after tamoxifen induction.
Tables
Key resources table
| Reagent type (species) or resource | Designation | Source or reference | Identifiers | Additional information |
|---|---|---|---|---|
| Strain, strain background (M. musculus) | Axin2-CreERT2 | Jackson Laboratory | Stock No. 018867 RRID:IMSR_JAX:018867 | |
| Strain, strain background (M. musculus) | Dmp1-Cre | Jackson Laboratory | Stock No. 023047 RRID:IMSR_JAX:023047 | |
| Strain, strain background (M. musculus) | Gli1-CreERT2 | Jackson Laboratory | Stock No. 007913 RRID:IMSR_JAX:007913 | |
| Strain, strain background (M. musculus) | Gli1-LacZ | Jackson Laboratory | Stock No. 008211 RRID:IMSR_JAX:008211 | |
| Strain, strain background (M. musculus) | Igf1rfl/fl | Jackson Laboratory | Stock No. 012251 RRID:IMSR_JAX:012251 | |
| Strain, strain background (M. musculus) | Ror2flox/flox | Jackson Laboratory | Stock No. 018354 RRID:IMSR_JAX:018354 | |
| Strain, strain background (M. musculus) | Rosa26<fs-tdTomato> | Jackson Laboratory | Stock No. 007905 RRID:IMSR_JAX:007905 | |
| Strain, strain background (M. musculus) | Wnt5aflox/flox | Jackson Laboratory | Stock No. 026626 RRID:IMSR_JAX:026626 | |
| Strain, strain background (M. musculus) | Wlsflox/flox | Jackson Laboratory | Stock No. 012888 RRID:IMSR_JAX:012888 | |
| Genetic reagent (M. musculus) | Anti-Axin2 probe | Advanced Cell Diagnostics | Cat# 400331 | |
| Genetic reagent (M. musculus) | Anti-Fgf10 probe | Advanced Cell Diagnostics | Cat#446371 | |
| Genetic reagent (M. musculus) | Anti-Fzd2 probe | Advanced Cell Diagnostics | Cat#404881 | |
| Genetic reagent (M. musculus) | Anti-Fzd4 probe | Advanced Cell Diagnostics | Cat#404901 | |
| Genetic reagent (M. musculus) | Anti-Fzd6 probe | Advanced Cell Diagnostics | Cat#404921 | |
| Genetic reagent (M. musculus) | Anti-Igf1r probe | Advanced Cell Diagnostics | Cat#417561 | |
| Genetic reagent (M. musculus) | Anti-Igf2 probe | Advanced Cell Diagnostics | Cat#437671 | |
| Genetic reagent (M. musculus) | Anti-Igfbp3 probe | Advanced Cell Diagnostics | Cat#405941 | |
| Genetic reagent (M. musculus) | Anti-Lrp5 probe | Advanced Cell Diagnostics | Cat#315791 | |
| Genetic reagent (M. musculus) | Anti-Ror2 probe | Advanced Cell Diagnostics | Cat#430041 | |
| Genetic reagent (M. musculus) | Anti-Wnt1 probe | Advanced Cell Diagnostics | Cat#401091 | |
| Genetic reagent (M. musculus) | Anti-Wnt2 probe | Advanced Cell Diagnostics | Cat#313601 | |
| Genetic reagent (M. musculus) | Anti-Wnt2b probe | Advanced Cell Diagnostics | Cat#405031 | |
| Genetic reagent (M. musculus) | Anti-Wnt3 probe | Advanced Cell Diagnostics | Cat#312241 | |
| Genetic reagent (M. musculus) | Anti-Wnt3a probe | Advanced Cell Diagnostics | Cat#405041 | |
| Genetic reagent (M. musculus) | Anti-Wnt4 probe | Advanced Cell Diagnostics | Cat#401101 | |
| Genetic reagent (M. musculus) | Anti-Wnt5a probe | Advanced Cell Diagnostics | Cat#316791 | |
| Genetic reagent (M. musculus) | Anti-Wnt5b probe | Advanced Cell Diagnostics | Cat#405051 | |
| Genetic reagent (M. musculus) | Anti-Wnt6 probe | Advanced Cell Diagnostics | Cat#401111 | |
| Genetic reagent (M. musculus) | Anti-Wnt7a probe | Advanced Cell Diagnostics | Cat#401121 | |
| Genetic reagent (M. musculus) | Anti-Wnt7b probe | Advanced Cell Diagnostics | Cat#401131 | |
| Genetic reagent (M. musculus) | Anti-Wnt8a probe | Advanced Cell Diagnostics | Cat#405061 | |
| Genetic reagent (M. musculus) | Anti-Wnt8b probe | Advanced Cell Diagnostics | Cat#405071 | |
| Genetic reagent (M. musculus) | Anti-Wnt9a probe | Advanced Cell Diagnostics | Cat#405081 | |
| Genetic reagent (M. musculus) | Anti-Wnt9b probe | Advanced Cell Diagnostics | Cat#405091 | |
| Genetic reagent (M. musculus) | Anti-Wnt10a probe | Advanced Cell Diagnostics | Cat#401061 | |
| Genetic reagent (M. musculus) | Anti-Wnt10b probe | Advanced Cell Diagnostics | Cat#401071 | |
| Genetic reagent (M. musculus) | Anti-Wnt11 probe | Advanced Cell Diagnostics | Cat#405021 | |
| Genetic reagent (M. musculus) | Anti-Wnt16 probe | Advanced Cell Diagnostics | Cat#401081 | |
| Antibody | Anti-β-actin (Rabbit monoclonal) | Cell Signaling Technology | Cat#4970S RRID:AB_2223172 | (1:2000) |
| Antibody | Anti-Amelx (Rabbit polyclonal) | Abcam | Cat# ab153915 | (1:100) |
| Antibody | Anti-β-catenin (Rabbit monoclonal) | Cell Signaling Technology | Cat#8814S RRID:AB_11127203 | IF (1:100), WB (1:2000) |
| Antibody | Anti-β-gal (Chicken polyclonal) | Abcam | Cat#ab9361 RRID:AB_307210 | (1:100) |
| Antibody | Anti-c-Myc (Rabbit monoclonal) | Abcam | Cat#ab32072 RRID:AB_731658 | (1:100) |
| Antibody | Anti-Ki67 (Rabbit monoclonal) | Abcam | Cat# ab16667; RRID:AB_302459 | (1:200) |
| Antibody | Anti-Wls (Chicken polyclonal) | Abcam | Cat#ab72385 RRID:AB_1269023 | (1:200) |
| Antibody | Anti-Chicken (Goat polyclonal) | Life Technologies | Cat#A-11039 RRID:AB_142924 | (1:200) |
| Antibody | Anti-Rabbit (Goat polyclonal) | Life Technologies | Cat#A-11011 RRID:AB_143157 | (1:200) |
| Antibody | Anti-Chicken (Goat polyclonal) | Life Technologies | Cat#A-11041 RRID:AB_2534098 | (1:200) |
| Commercial assay or kit | RNeasy Micro Kit | QIAGEN | Cat# 74004 | |
| Commercial assay or kit | Click-iT EdU Cell Proliferation Kit | Thermo Fisher Scientific | Cat# C10337 | |
| Software, algorithm | ImageJ | NIH | RRID:SCR_003070 | |
| Software, algorithm | GraphPad Prism | GraphPad Software | RRID:SCR_002798 |
Additional files
Download links
A two-part list of links to download the article, or parts of the article, in various formats.
Downloads (link to download the article as PDF)
Open citations (links to open the citations from this article in various online reference manager services)
Cite this article (links to download the citations from this article in formats compatible with various reference manager tools)
Reciprocal interaction between mesenchymal stem cells and transit amplifying cells regulates tissue homeostasis
eLife 10:e59459.
https://doi.org/10.7554/eLife.59459


