Wnt3 distribution in the zebrafish brain is determined by expression, diffusion and multiple molecular interactions
- Department of Biological Sciences, National University of Singapore, Singapore
- Center for BioImaging Sciences, National University of Singapore, Singapore
- International Institute of Molecular and Cell Biology in Warsaw, Poland
- Department of Chemistry, National University of Singapore, Singapore
Figures
Figure 1

Spatiotemporal expression of wnt3 promoter-driven Wnt3EGFP and PMTmApple.
(A) Schematic illustration of the brain of a zebrafish embryo (dorsal view and lateral view). Expression profile of Wnt3EGFP in Tg(−4.0wnt3:Wnt3EGFP) line at (B) 24 hpf and (C) 48hpf. Expression profile of PMTmApple in Tg(−4.0wnt3:PMTmApple) line at (D) 24 hpf and (E) 48hpf. BV, brain ventricle; Ce, cerebellum; CP, choroid plexus; E, epiphysis; FP, floor plate; HB, hindbrain; MHB, midbrain–hindbrain boundary; mRP, midbrain roof plate; OT, optic tectum; r, rhombomere; RP, roof plate (spinal cord); SCO, sub-commissural organ. SCO and E are regions of the epithalamus (Epi). Images orientation: anterior to the left. Scale bar 30 μm.
Figure 2 with 3 supplements
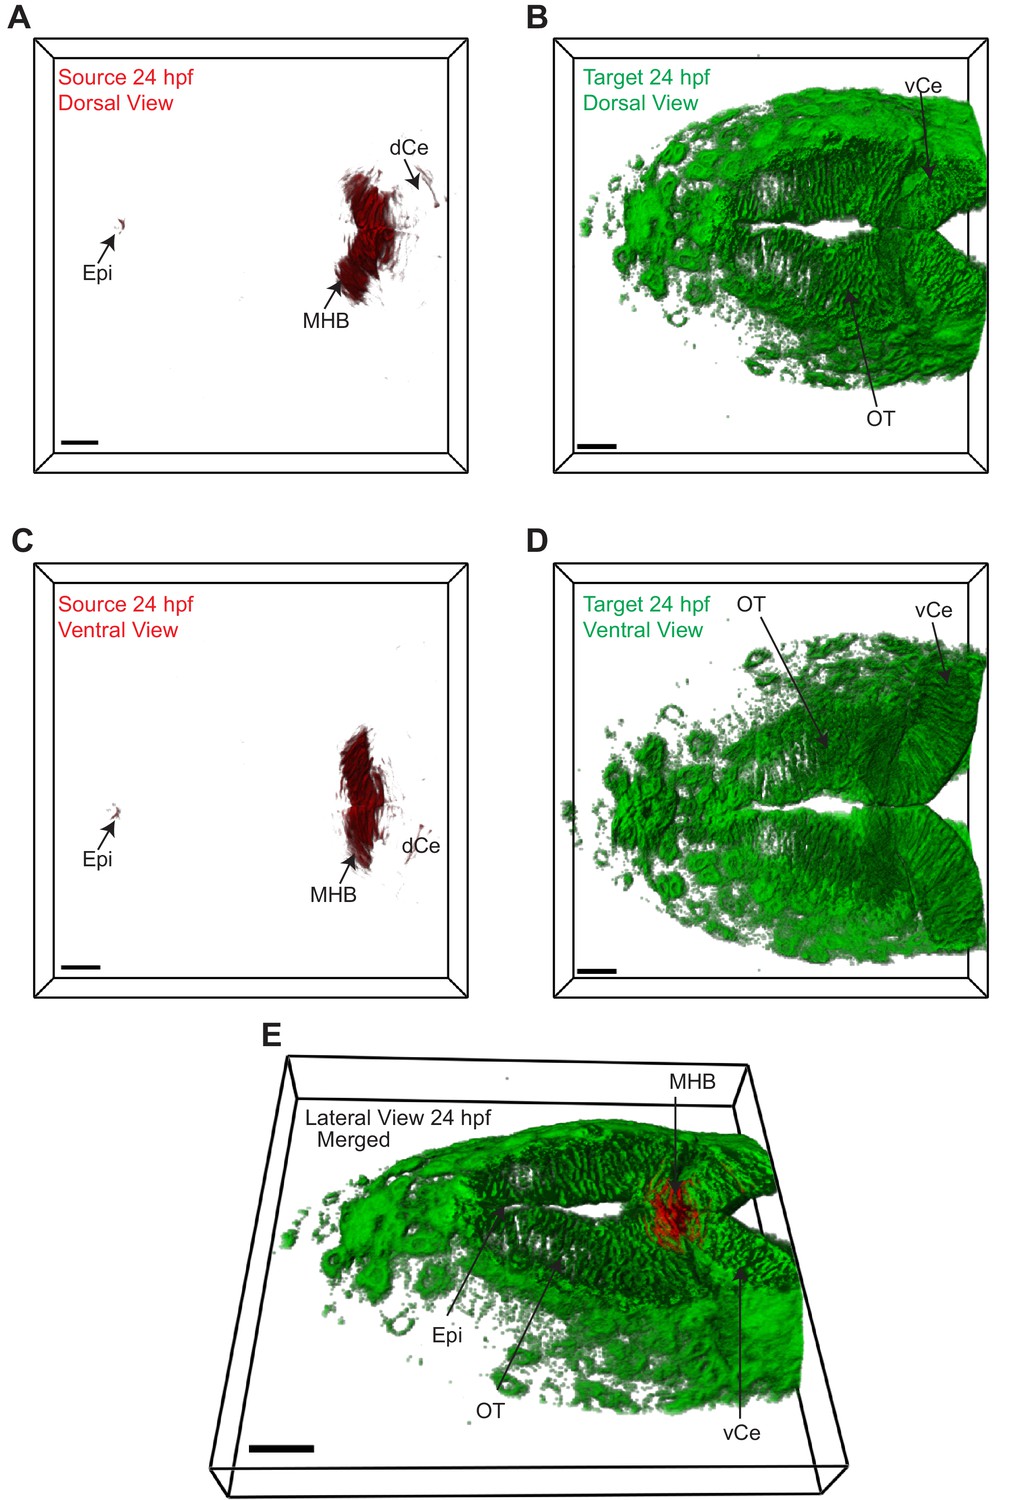
Wnt3 source and target regions at 24 hpf.
3D dorsal projection of Wnt3 (A) source regions at 24 hpf and (B) target regions at 24 hpf (top view). 3D ventral projection of Wnt3 (C) source regions at 24 hpf and (D) target regions at 24 hpf (bottom view). (E) 3D projection of Wnt3 source and target regions at 24 hpf (lateral view). See Video 3 for a detailed view. dCe, dorsal regions of cerebellum; Epi, epithalamus; MHB, midbrain–hindbrain boundary; OT, optic tectum; vCe, ventral regions of cerebellum. Images orientation: anterior to the left. Scale bar 30 μm.
Figure 2—figure supplement 1
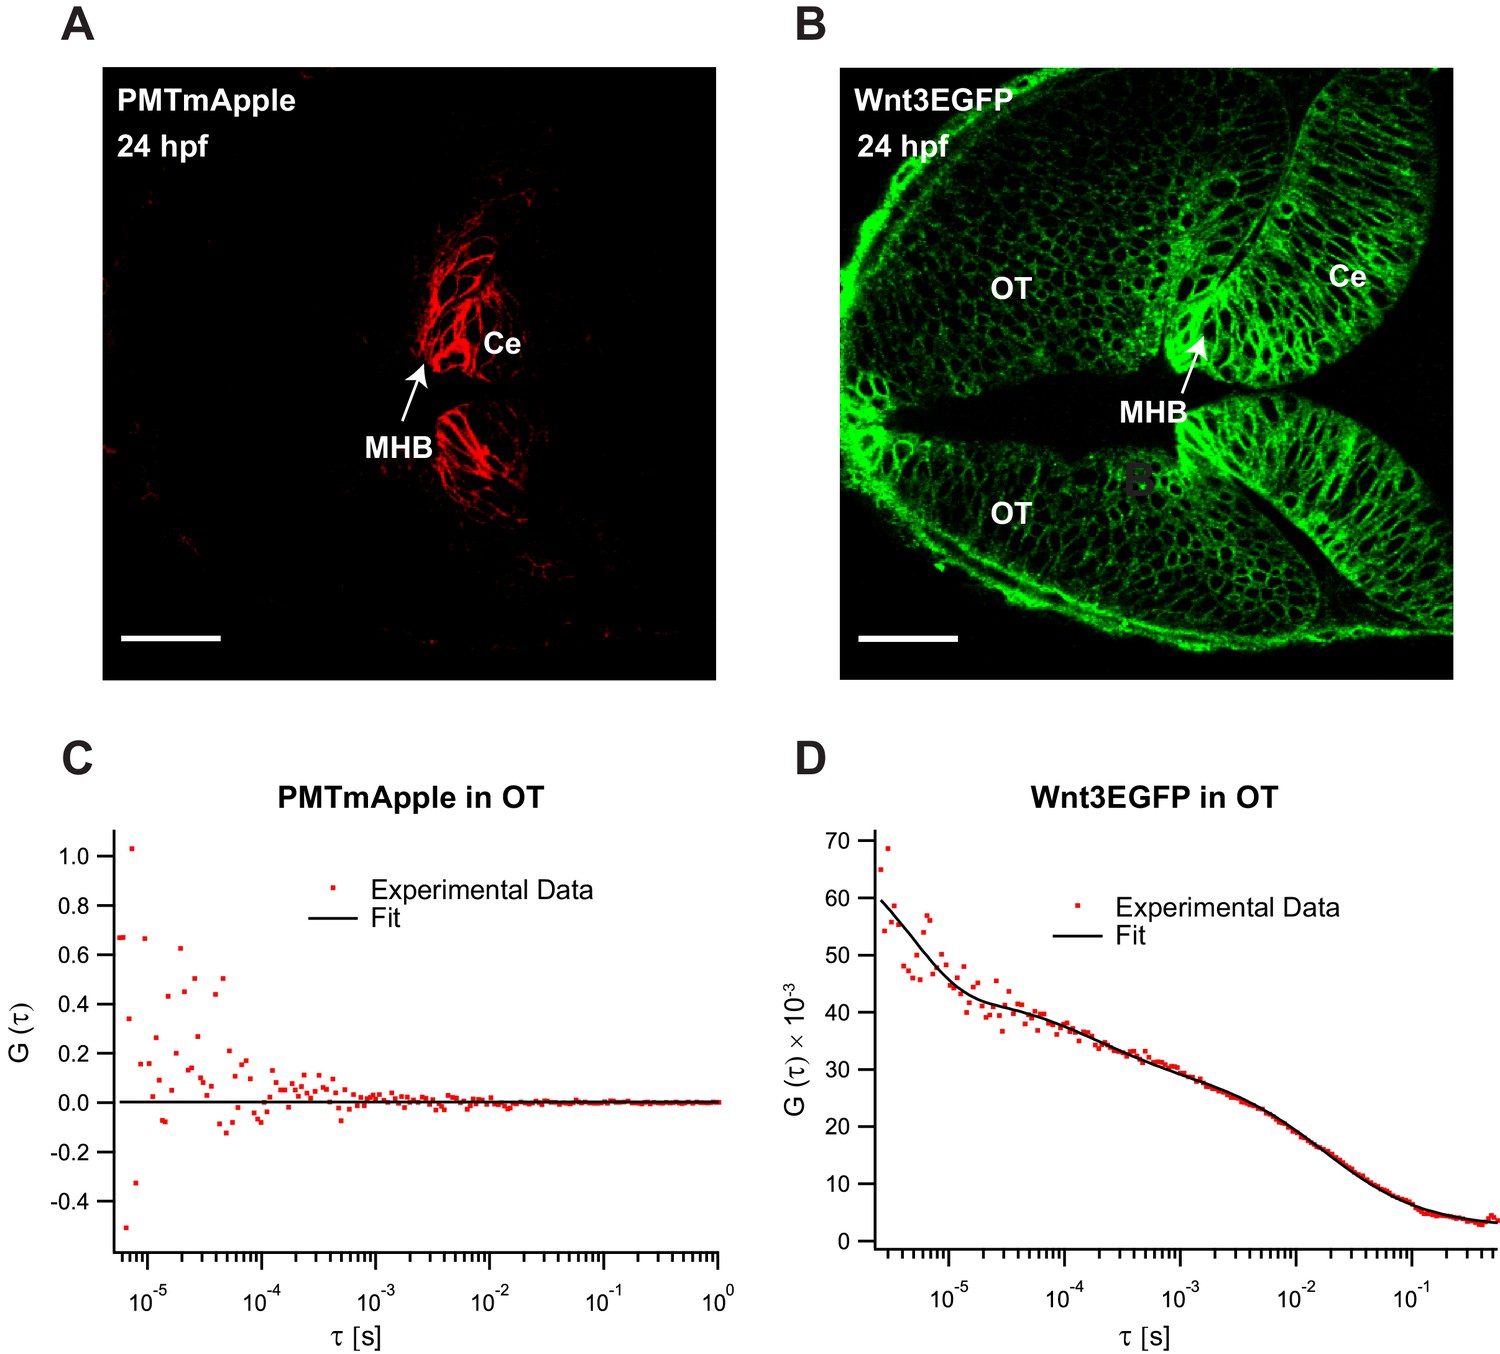
Fluorescence correlation spectroscopy (FCS) measurements of Wnt3EGFP and PMTmApple in the Wnt3 target regions at 24 hpf.
Expression of (A) PMTmApple and (B) Wnt3EGFP in Tg(−4.0wnt3:Wnt3EGFP) × Tg(−4.0wnt3:PMTmApple) double transgenic embryos at 24 hpf. Representative autocorrelation function (ACF) for (C) PMTmApple and (D) Wnt3EGFP in the OT at 24 hpf. No ACFs were obtained for PMTmAPple in the target regions indicating an absence of mApple signal in these regions. Ce, cerebellum; MHB; midbrain–hindbrain boundary; OT, optic tectum. Images orientation: anterior to the left. Scale bar 30 μm.
Figure 2—figure supplement 2
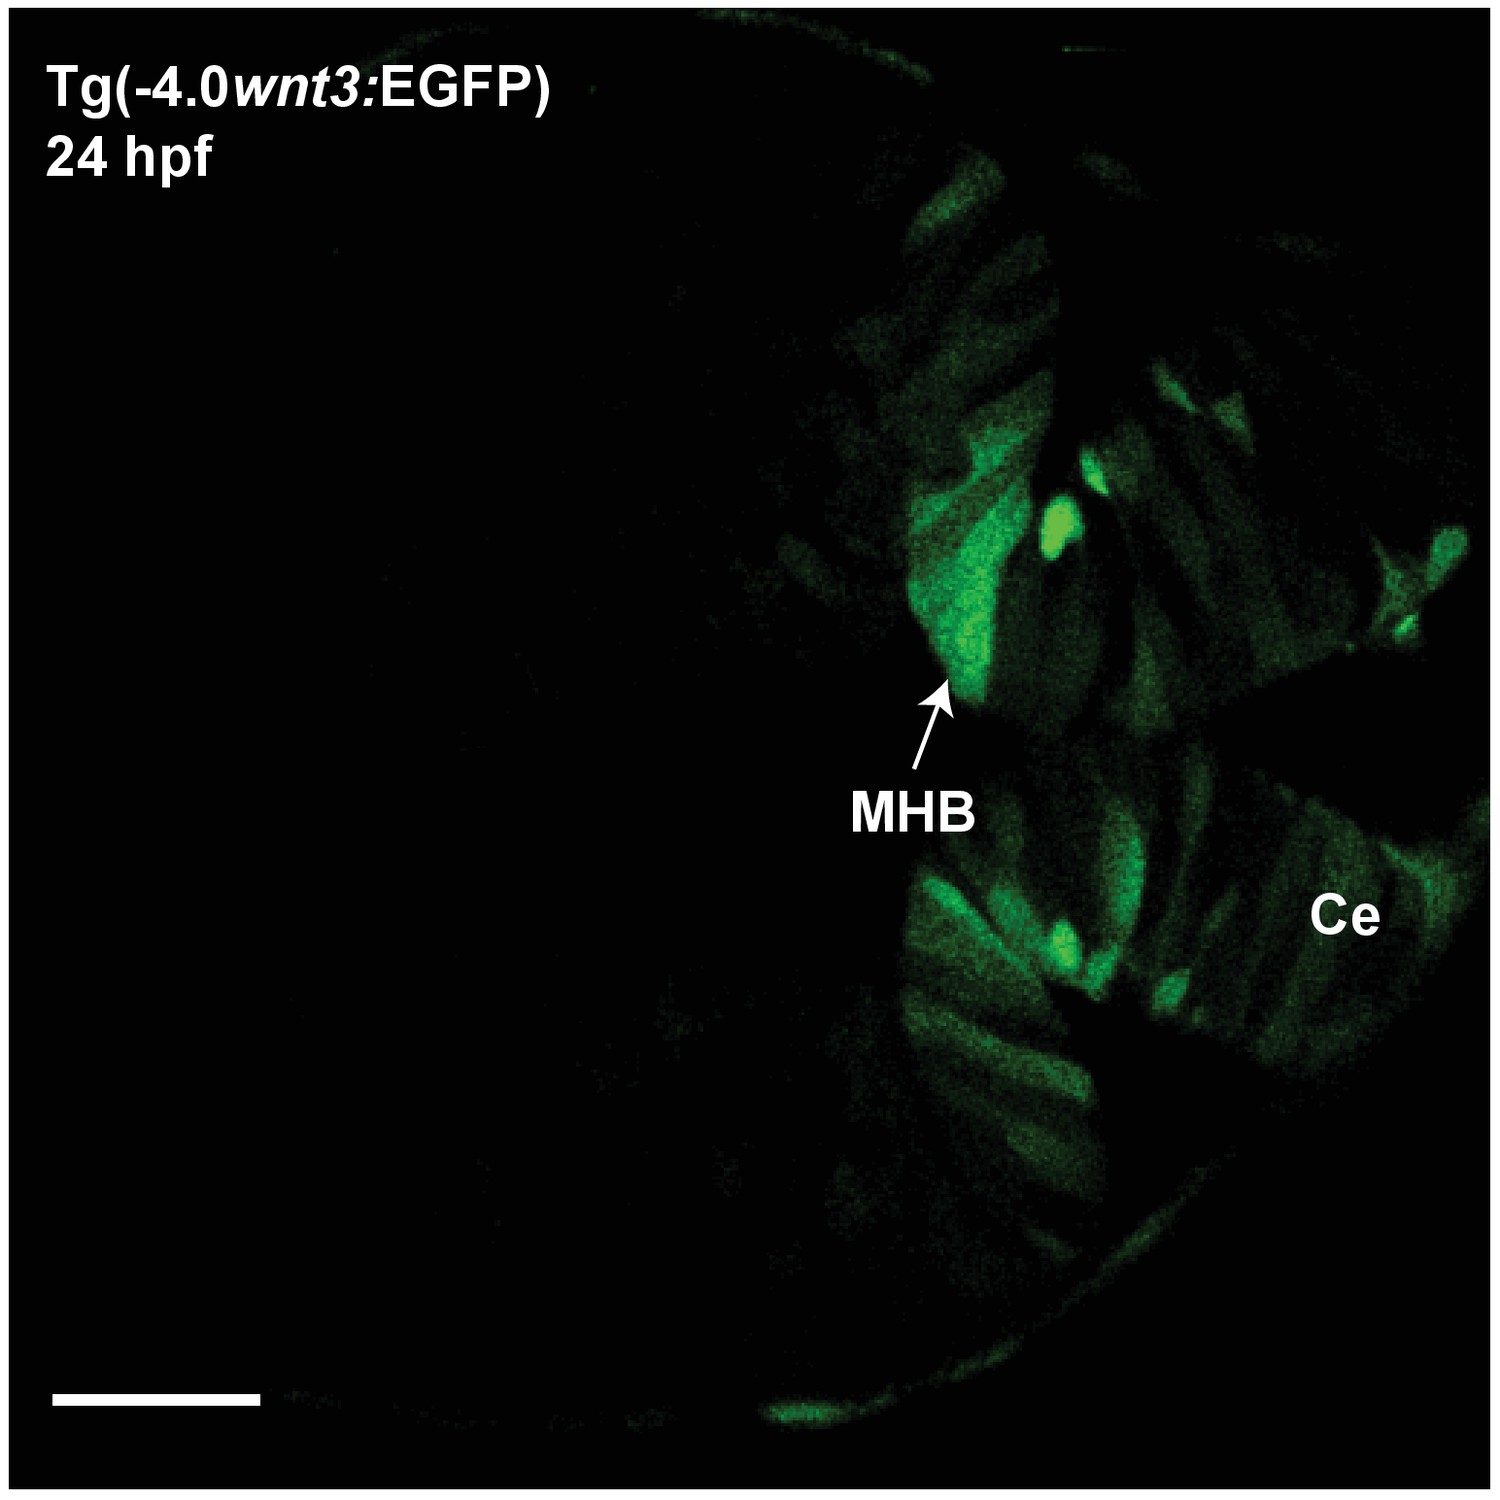
Expression of EGFP in Tg(−4.0wnt3:EGFP) at 24 hpf.
The expression of EGFP in Tg(-4.0wnt3:EGFP) closely mimics the expression of PMTmApple in Tg(−4.0wnt3:PMTmApple). Ce, cerebellum; MHB; midbrain–hindbrain boundary. Images orientation: anterior to the left. Scale bar 30 μm.
Figure 2—figure supplement 3
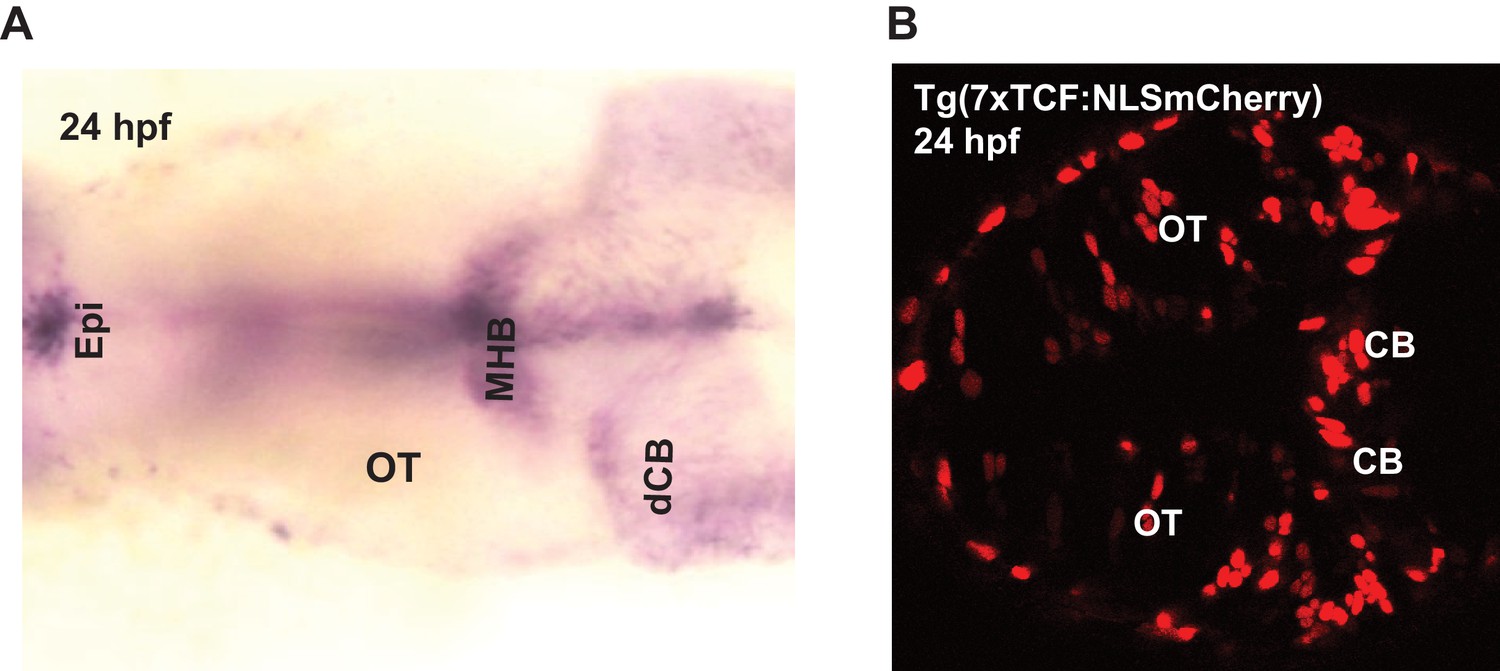
Expression of wnt3 transcripts and downstream wnt signaling transcription factor at 24 hpf.
(A) Whole mount in situ hybridization (dorsal view) of wnt3 at 24 hpf. The expression pattern is similar to previously published results in Clements et al., 2009, Duncan et al., 2015, and Teh et al., 2015. (B) Expression of NLS-mCherry in wnt reporter line Tg(7XTcf-Xla.Siam:NLS-Cherry) at 24 hpf. dCB, cerebellum; Epi, epithalamus; FP, floor plate; MHB, midbrain–hindbrain boundary; mRP, midbrain roof plate; OT, optic tectum. Orientation: anterior to left.
Figure 3 with 3 supplements
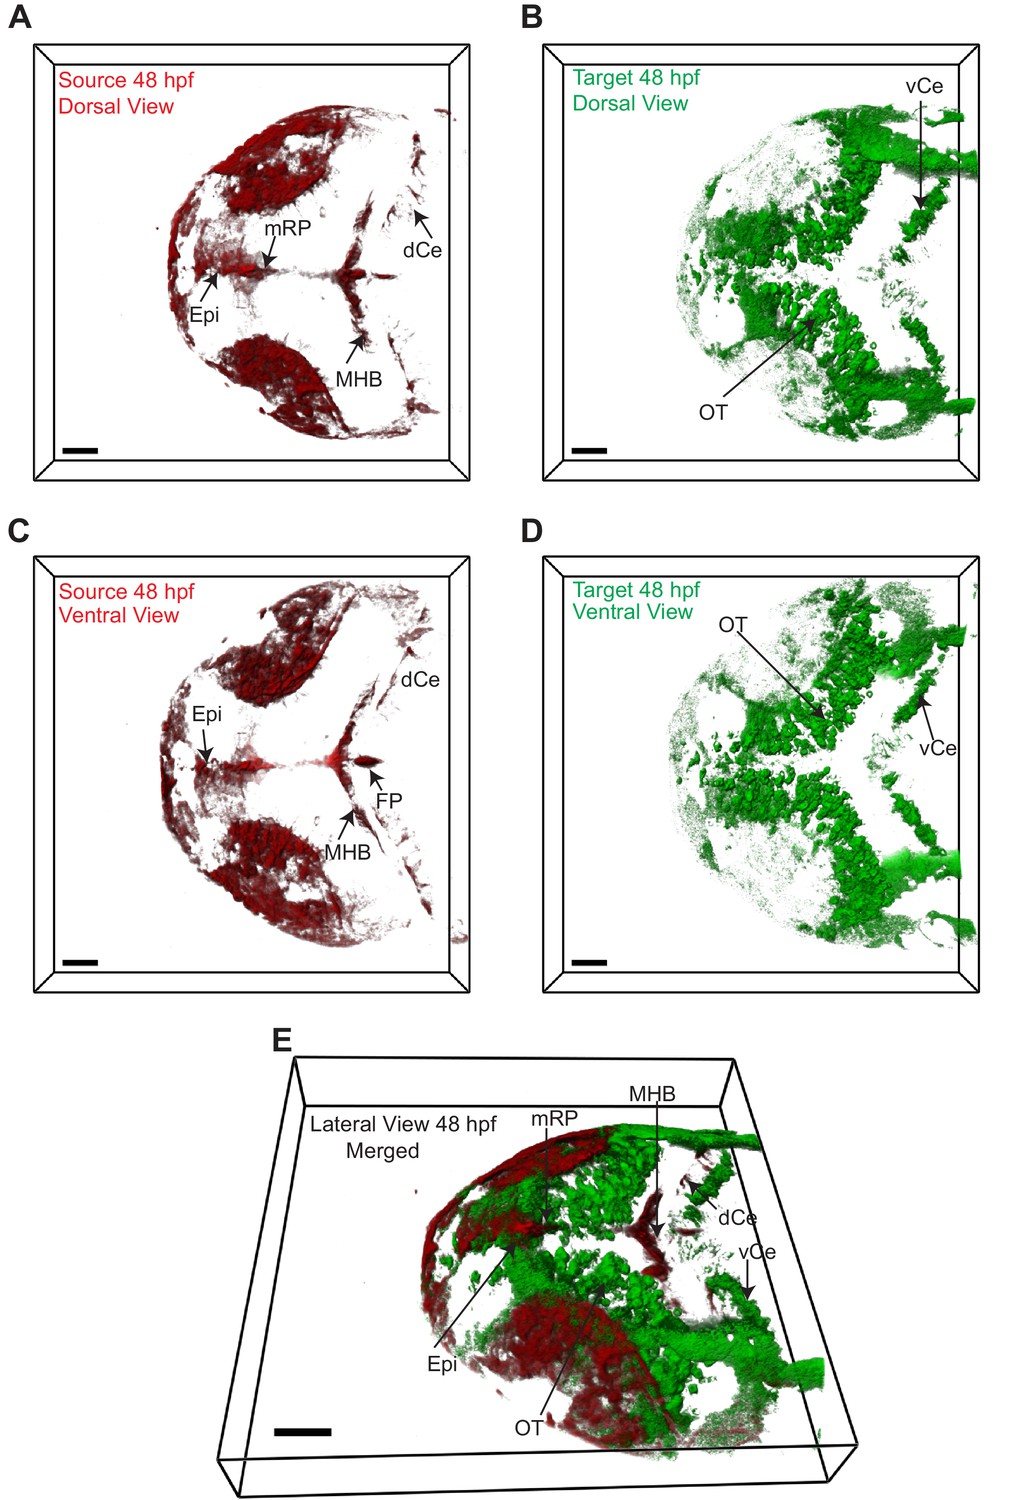
Wnt3 source and target regions at 48 hpf.
3D dorsal projection of Wnt3 (A) source regions at 48 hpf and (B) target regions at 48 hpf (top view). 3D ventral projection of Wnt3 (C) source regions at 48 hpf and (D) target regions at 48 hpf (bottom view). (E) 3D projection of Wnt3 source and target regions at 48 hpf (lateral view). See Video 4 for a detailed view. dCe, dorsal regions of cerebellum; Epi, epithalamus; FP, floor plate; MHB, midbrain–hindbrain boundary; mRP, midbrain roof plate; OT, optic tectum; vCe, ventral regions of cerebellum. Images orientation: anterior to the left. Scale bar 40 μm.
Figure 3—figure supplement 1
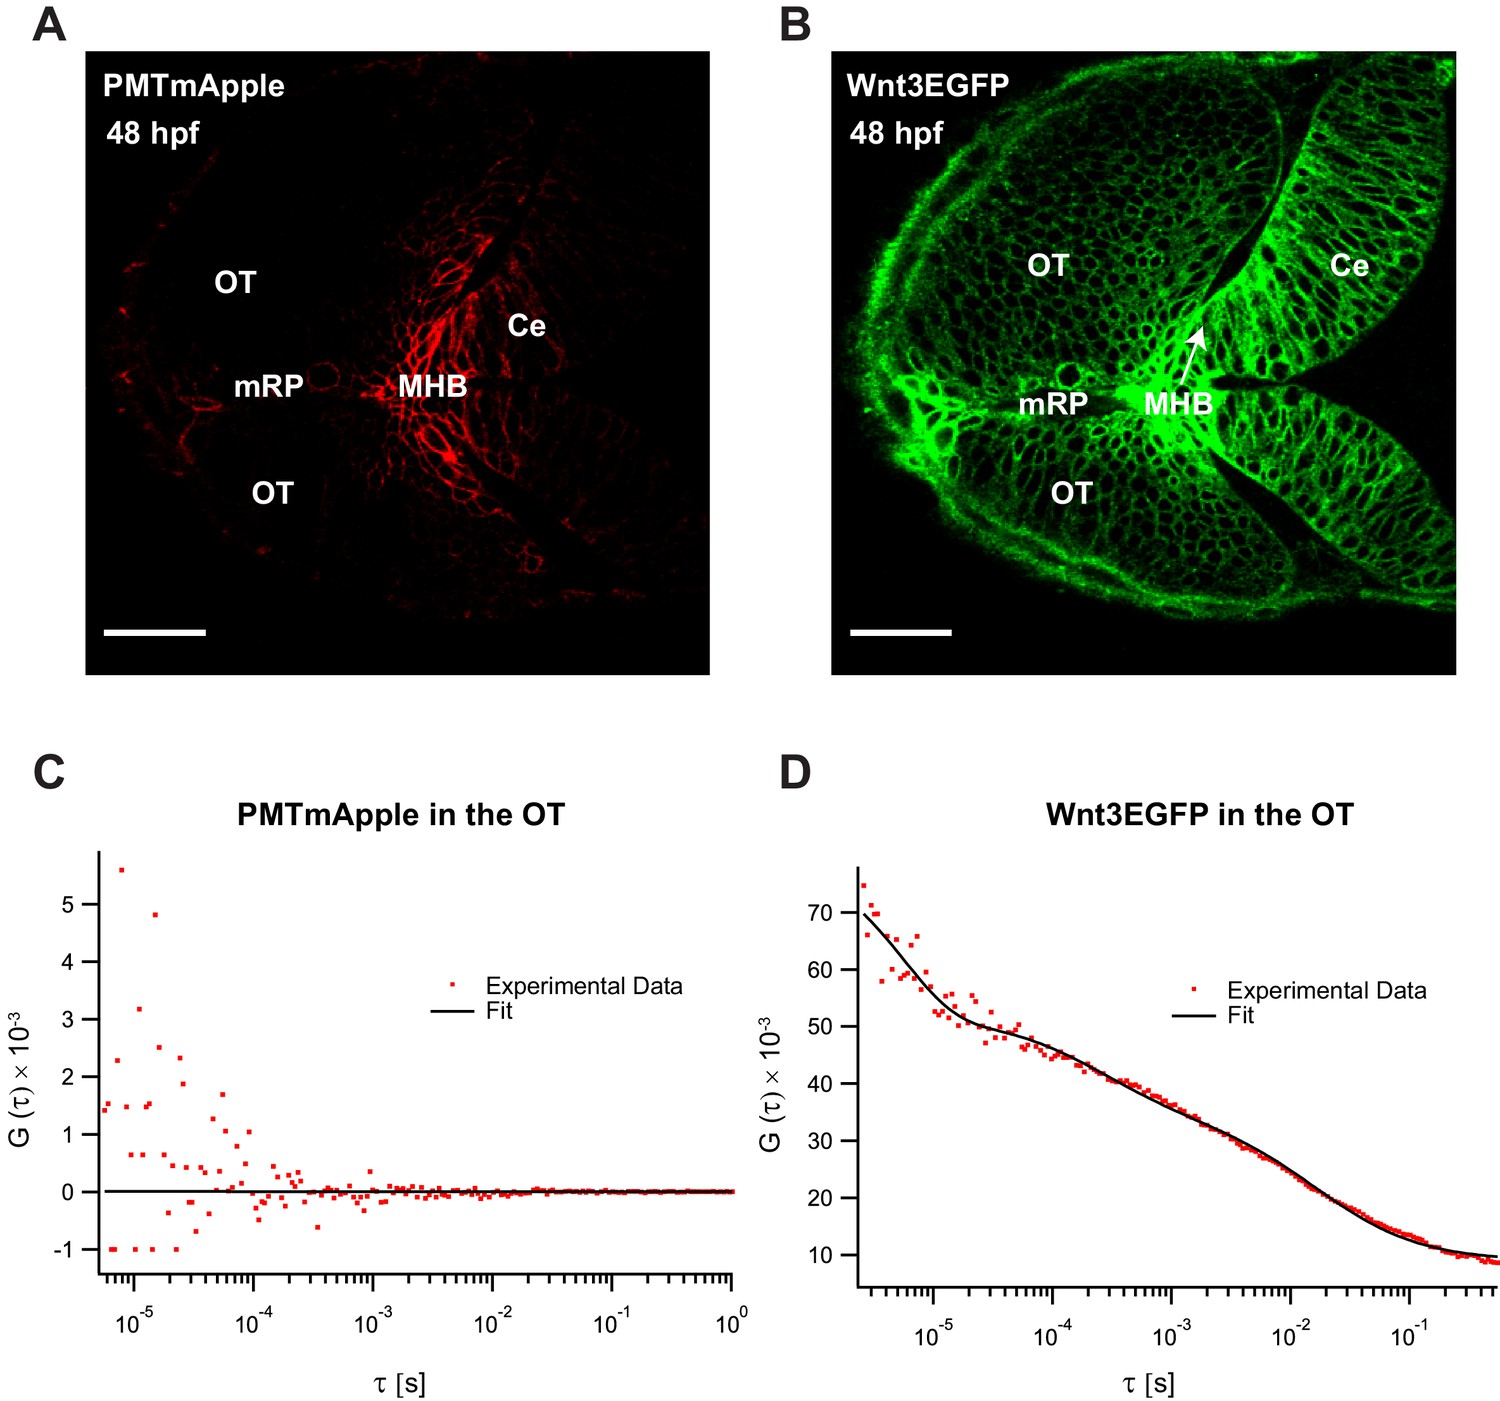
Fluorescence correlation spectroscopy (FCS) measurements of Wnt3EGFP and PMTmApple in the Wnt3 target regions at 48 hpf.
Expression of (A) PMTmApple and (B) Wnt3EGFP in Tg(−4.0wnt3:Wnt3EGFP) × Tg(−4.0wnt3:PMTmApple) double transgenics at 48 hpf. Representative autocorrelation function (ACF) for (C) PMTmApple and (D) Wnt3EGFP in the OT at 48 hpf. No ACFs were obtained for PMTmAPple in the target regions indicating an absence of mApple signal in these regions. Ce, cerebellum; MHB, midbrain–hindbrain boundary; OT, optic tectum. Images orientation: anterior to the left. Scale bar 30 μm.
Figure 3—figure supplement 2
Expression of EGFP in Tg(−4.0wnt3:EGFP) at 48 hpf.
The expression of EGFP in Tg(-4.0wnt3:EGFP) closely mimics the expression of PMTmApple in Tg(−4.0wnt3:PMTmApple). Ce, cerebellum; MHB, midbrain–hindbrain boundary; OT, optic tectum. Images orientation: anterior to the left. Scale bar 30 μm.
Figure 3—figure supplement 3
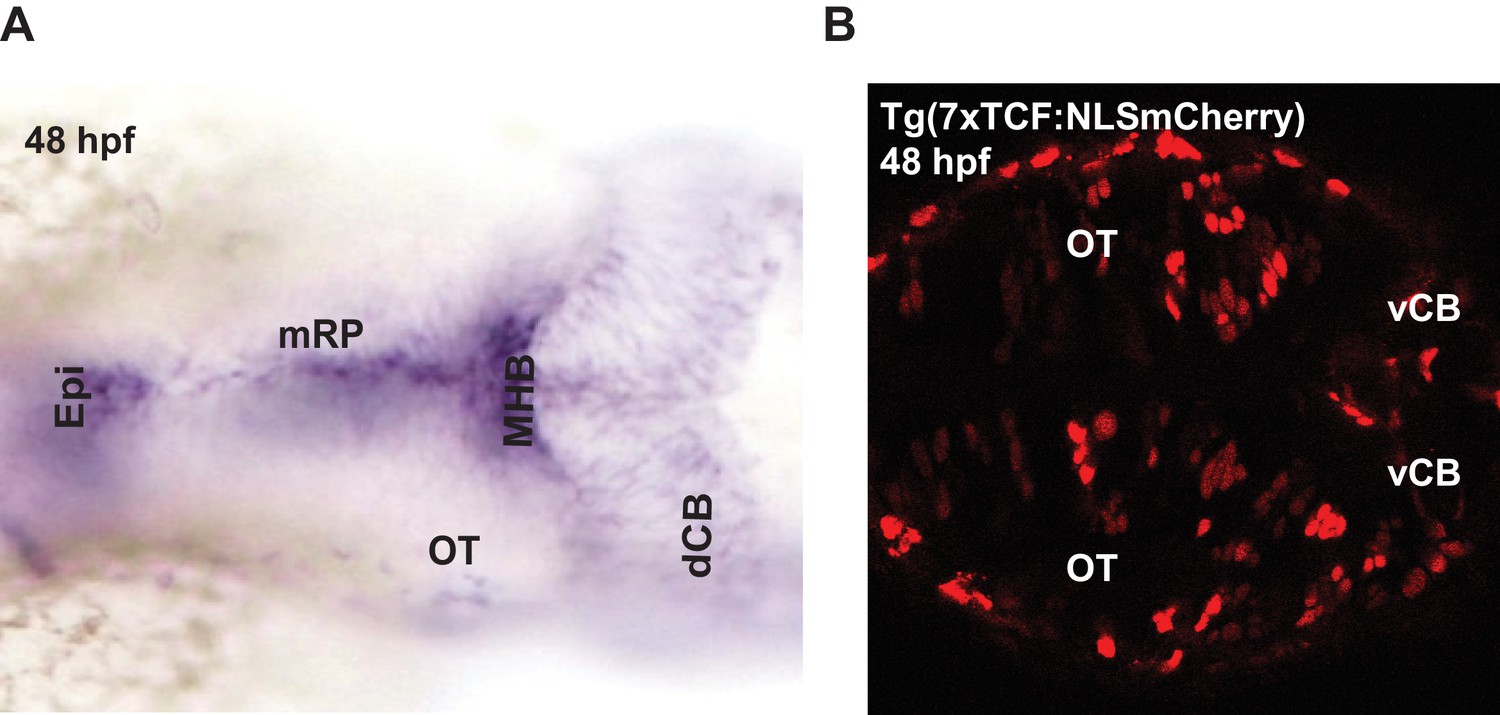
Expression of wnt3 transcripts and downstream wnt signaling transcription factors at 48 hpf.
(A) Whole mount in situ hybridization (dorsal view) of wnt3 at 48 hpf. The expression pattern is similar to previously published results in Clements et al., 2009, Duncan et al., 2015, and Teh et al., 2015. (B) Expression of NLS-mCherry in wnt reporter line Tg(7XTcf-Xla.Siam:NLS-Cherry) at 48 hpf. dCB, cerebellum; Epi, epithalamus; FP, floor plate; MHB, midbrain–hindbrain boundary; mRP, midbrain roof plate; OT, optic tectum. Orientation: anterior to left.
Figure 4 with 1 supplement
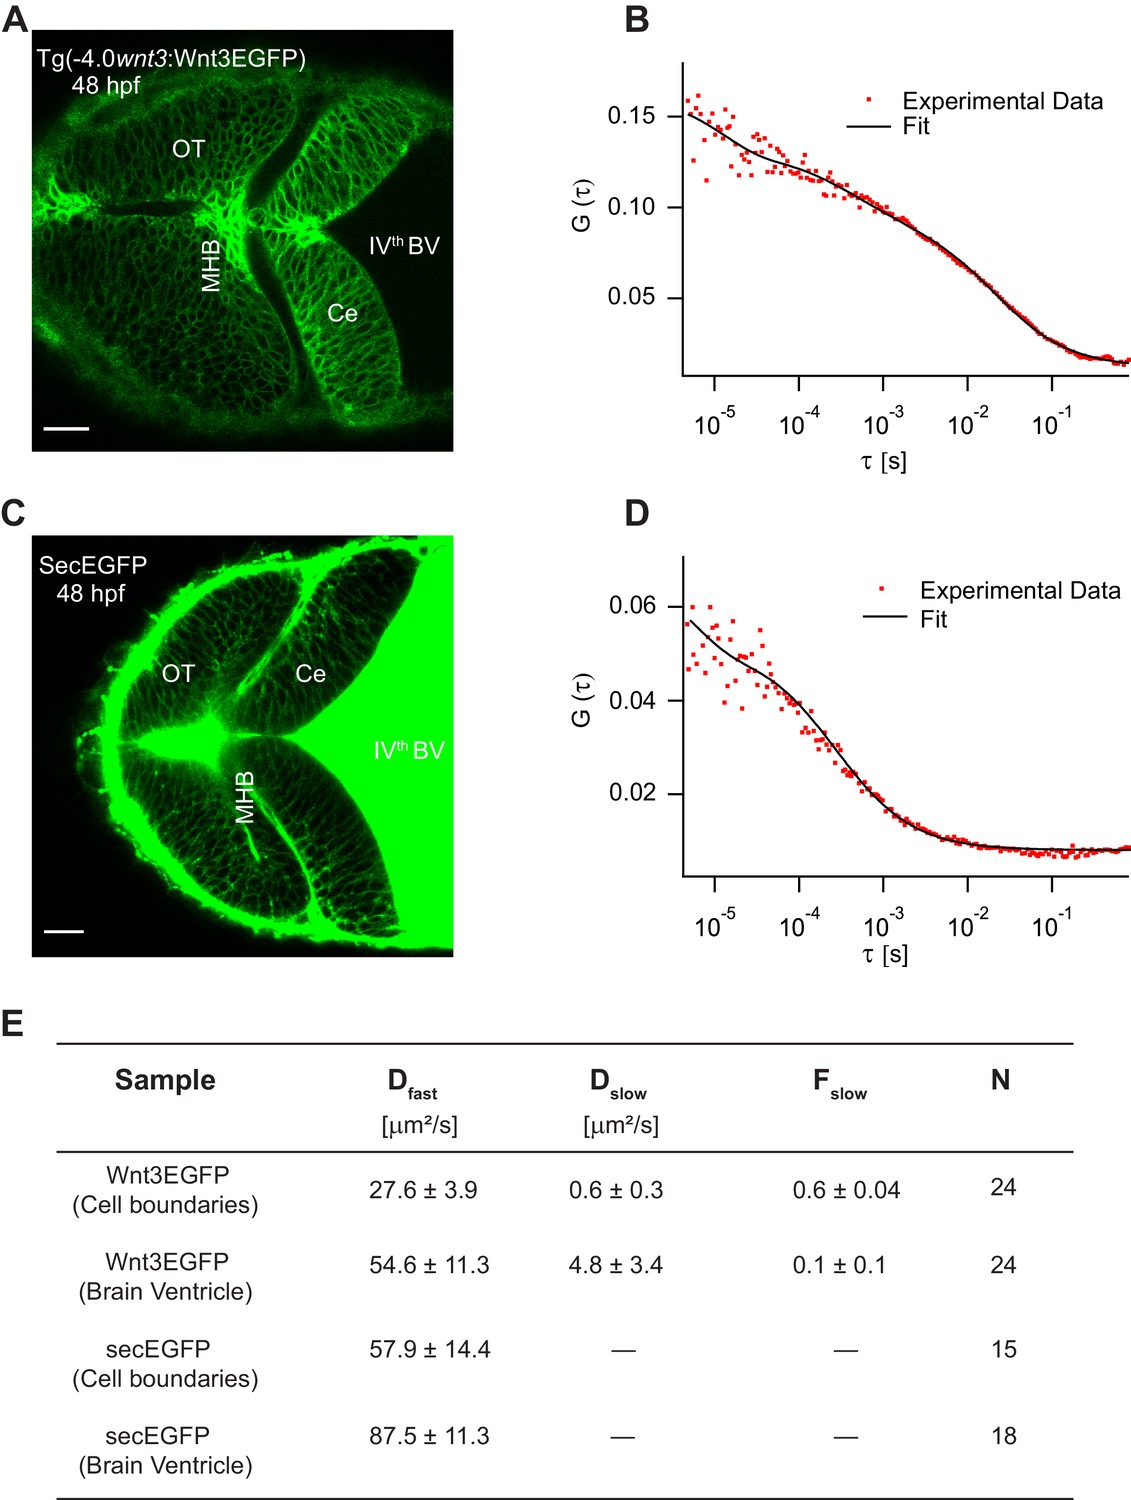
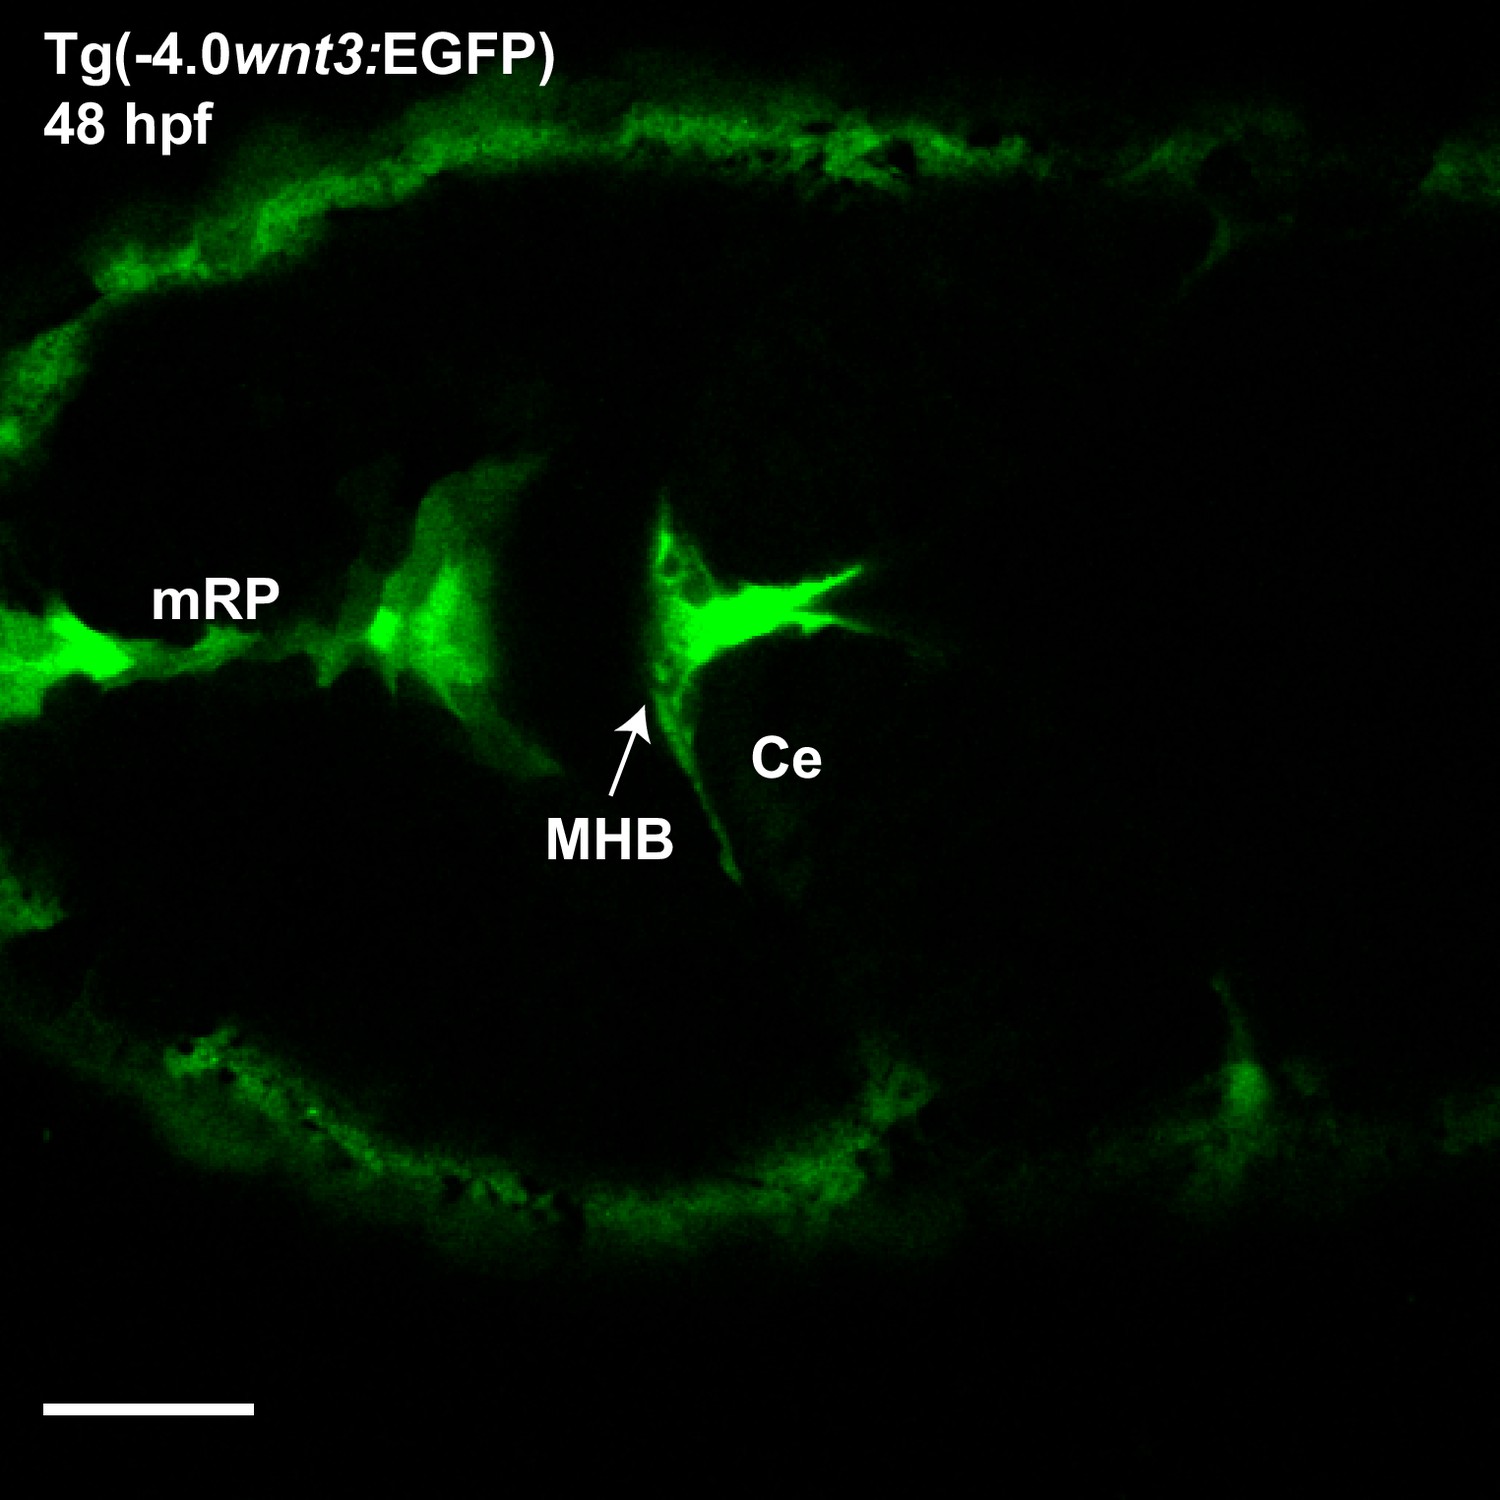
Characterizing the dynamics of Wnt3EGFP and secEGFP using fluorescence correlation spectroscopy (FCS).
(A) Expression of Wnt3EGFP in Tg(−4.0wnt3:Wnt3EGFP) at 48 hpf. (B) Representative autocorrelation function (ACF; dots) and fitting (line) of a Wnt3EGFP measurement at a cell boundary. (C) Expression of secEGFP in the zebrafish brain at 48 hpf. (D) Representative ACF (dots) and fitting (line) of a secEGFP measurement at a cell boundary. (E) Table showing diffusion coefficients of the fast component (Dfast), slow component (Dslow) and the fraction of slow component (Fslow) for Wnt3EGFP and secEGFP measured by FCS. Measurements were performed in the cell borders of Ce, MHB, and OT; and in the BV. Data are mean ± SD; N = No of measurements. BV, brain ventricle; Ce, cerebellum; MHB, midbrain–hindbrain boundary; OT, optic tectum. Images orientation: anterior to left. Scale bar 30 μm.
-
Figure 4—source data 1
Diffusion coefficients of Wnt3EGFP and secEGFP at cell borders and in the brain ventricle.
- https://cdn.elifesciences.org/articles/59489/elife-59489-fig4-data1-v2.xlsx
Figure 4—figure supplement 1
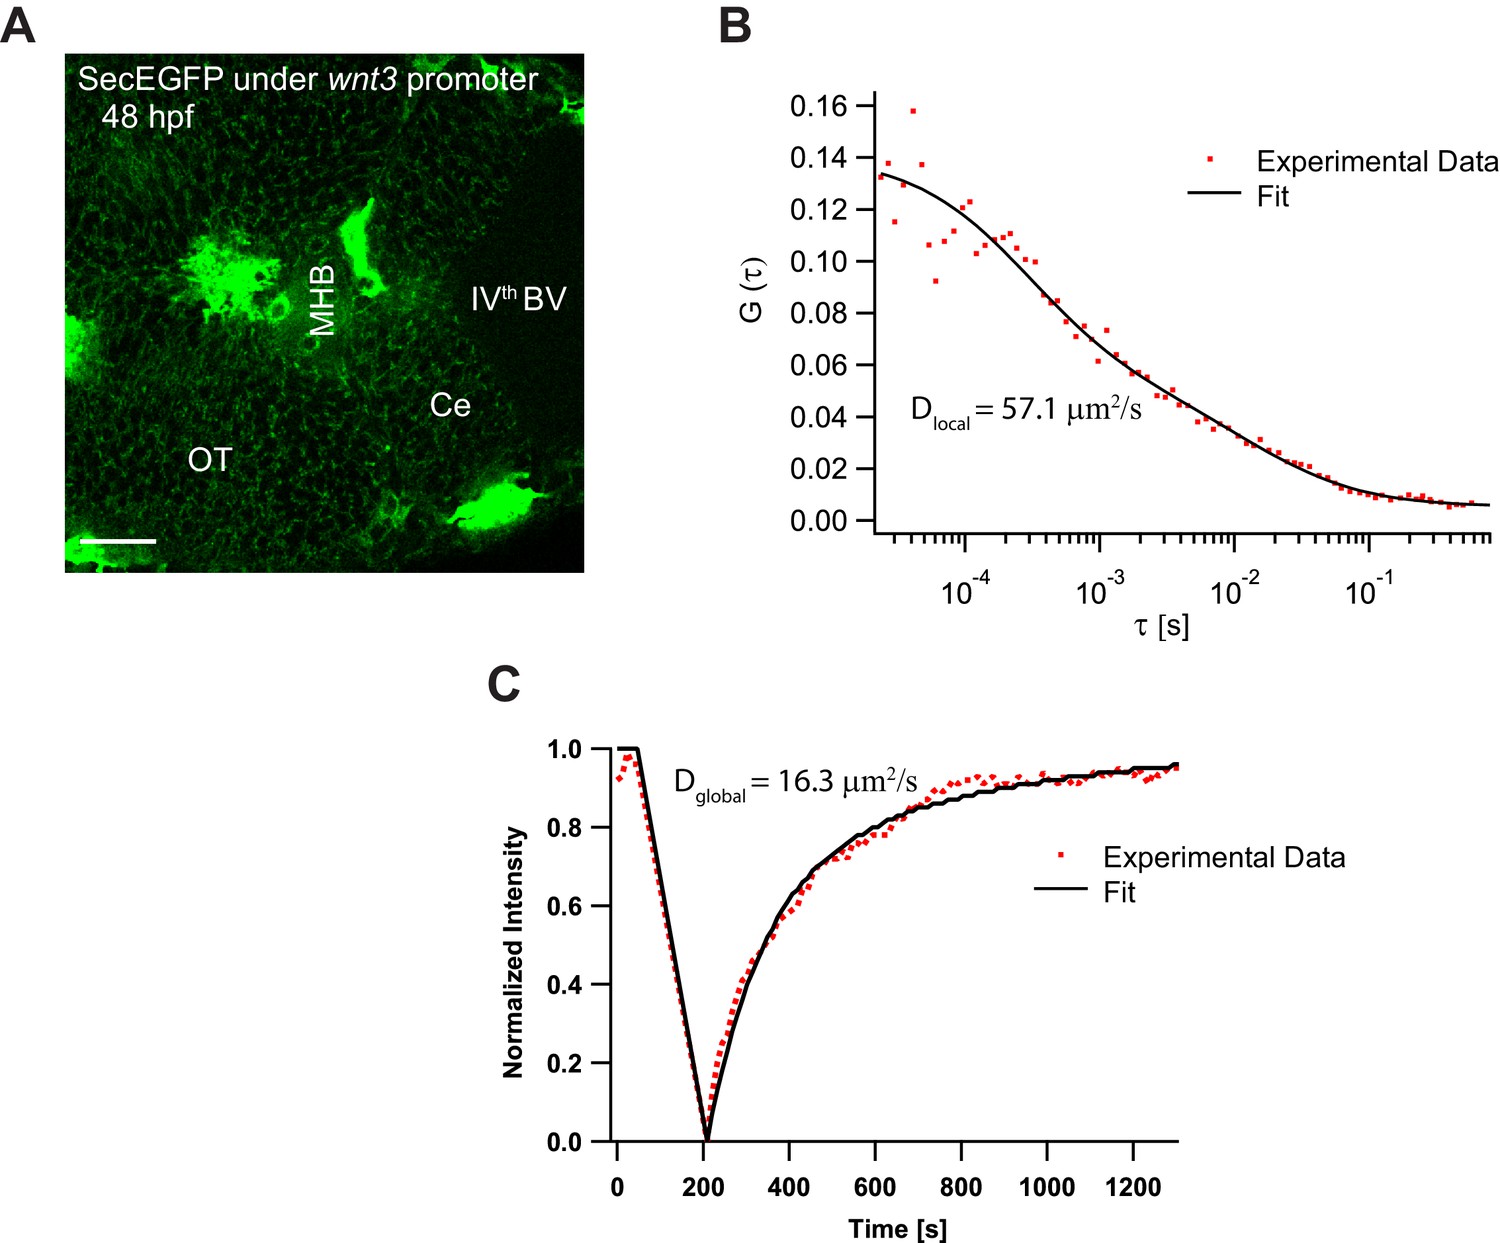
Expression and dynamics of secEGFP under 4 kb wnt3 promoter.
(A) Expression of secEGFP under wnt3 promoter in the zebrafish brain at 48hpf. (B) Representative fluorescence correlation spectroscopy measurement of secEGFP under wnt3 promoter with a diffusion coefficient of 57.1 μm2/s. (C) Representative fluorescence recovery after photobleaching recovery curve of secEGFP under wnt3 promoter with a diffusion coefficient of 16.3 μm2/s. Orientation: anterior to the left. Scale bar 30 μm.
Figure 5 with 4 supplements
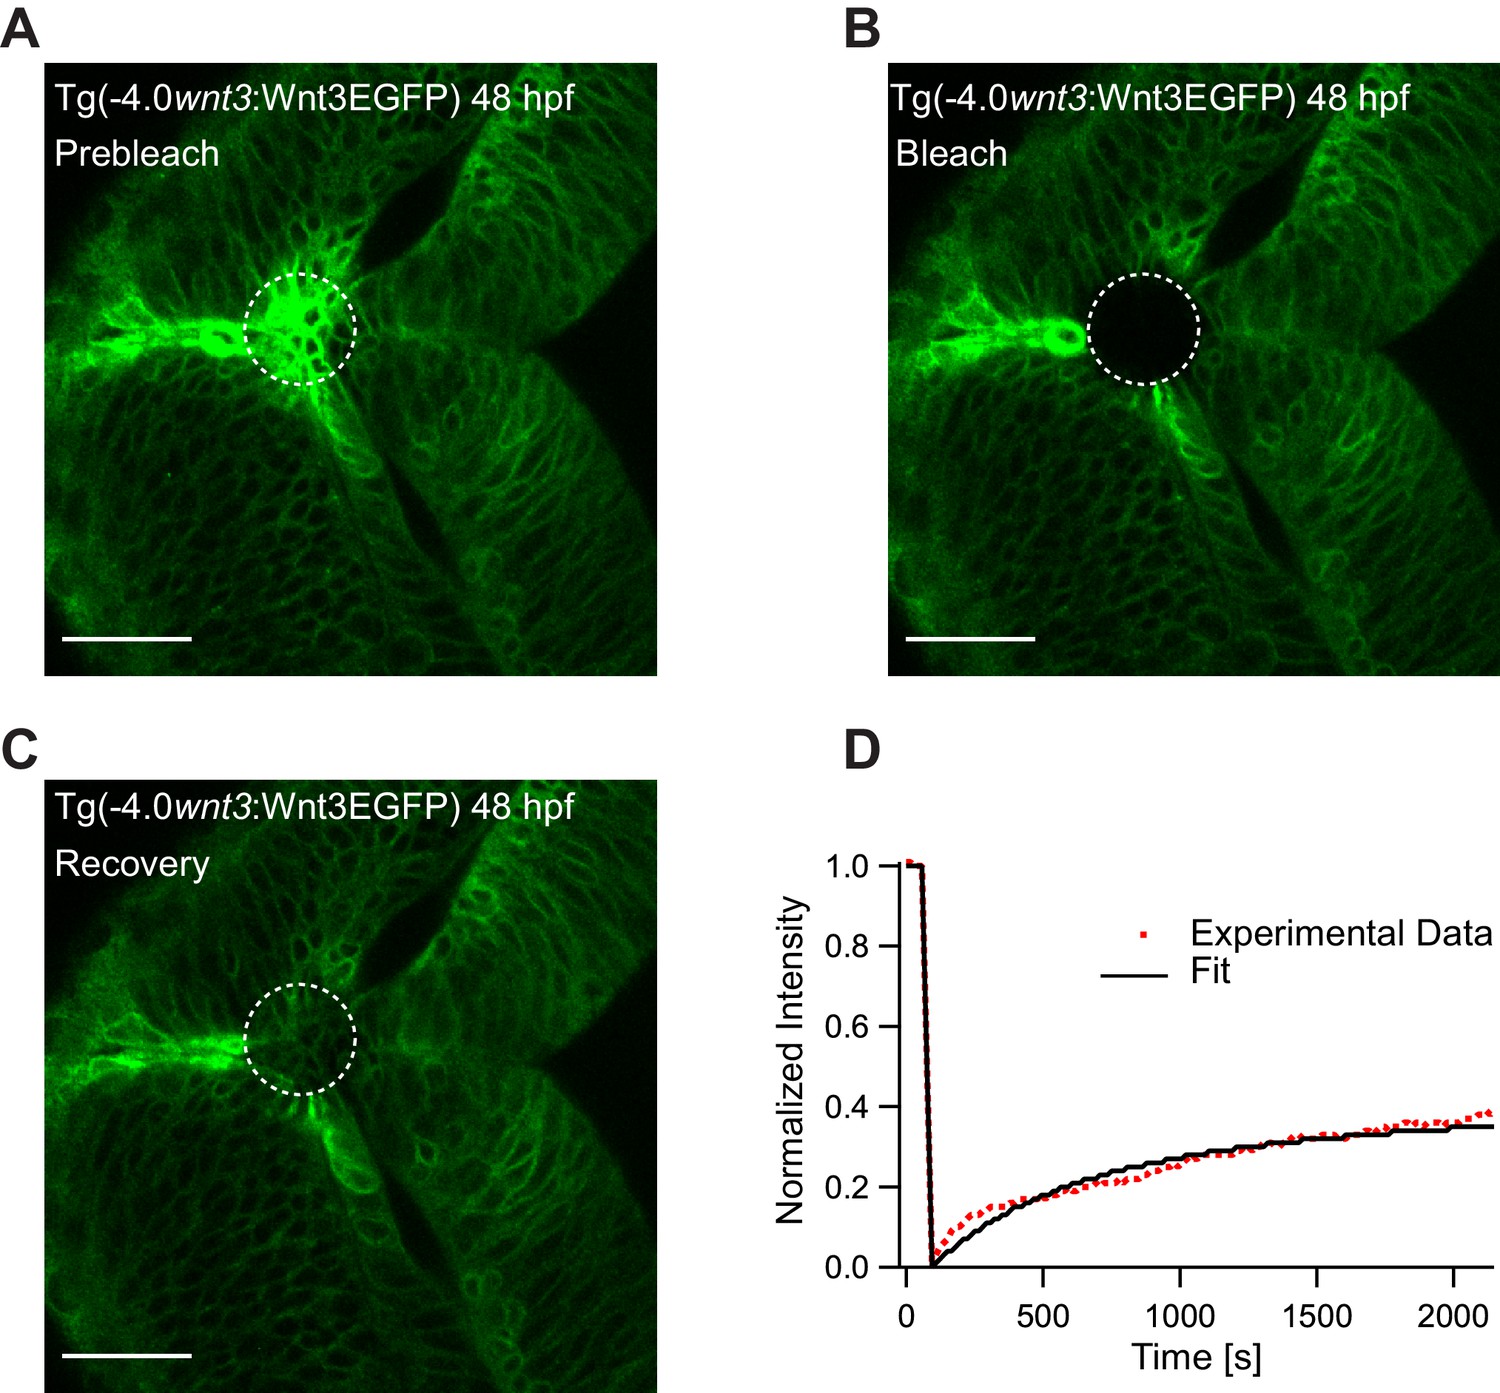
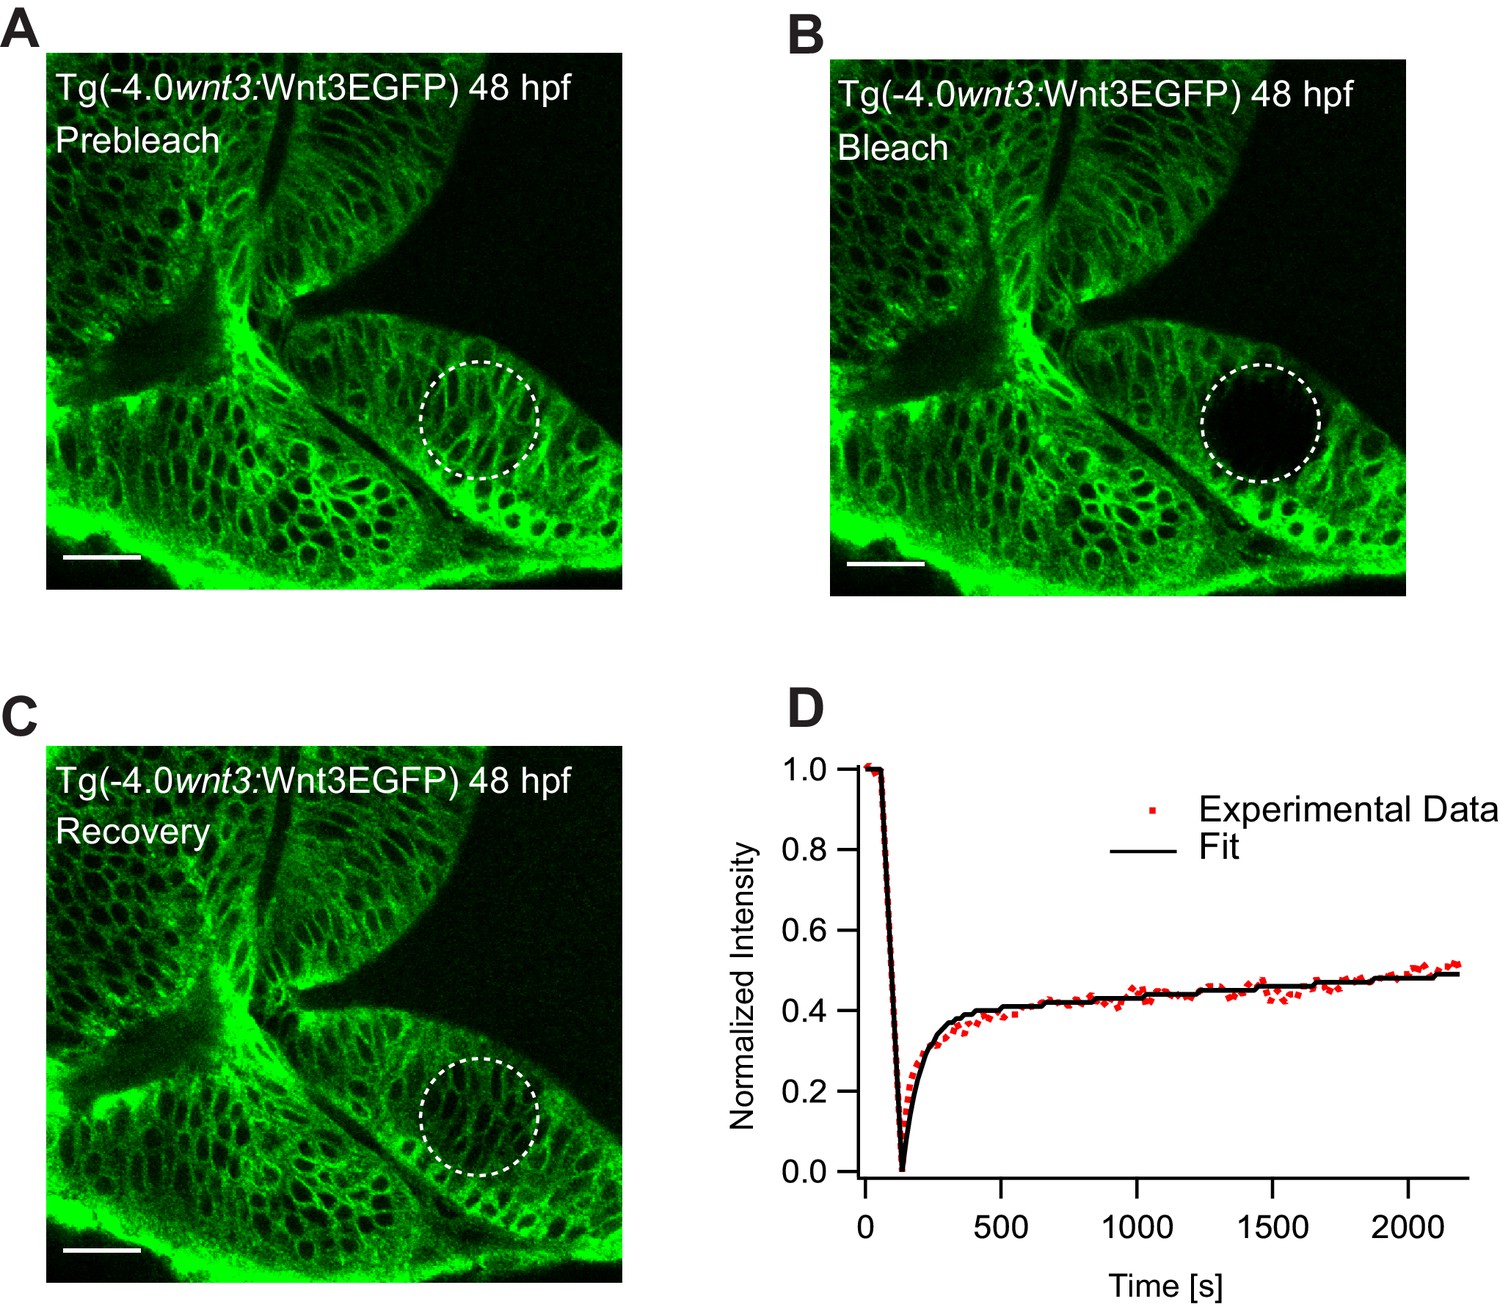
Representative fluorescence recovery of Wnt3EGFP at 48 hpf after photobleaching.
(A) Expression of Wnt3EGFP in Tg(−4.0wnt3:Wnt3EGFP) at 48 hpf before photobleaching. (B) Photobleached region of Wnt3EGFP. (C) Recovery of fluorescence intensity in the bleached region due to diffusion of molecules from the neighboring unbleached regions. (D) Fluorescence recovery curve for Wnt3EGFP with a time constant (τfast) of ~5 min and a mobile component fraction (Fm) of ~0.35. The average apparent global diffusion coefficient (Dglobal) measured for Wnt3EGFP was 0.5 ± 0.2 μm2/s (N = 11). Fluorescence recovery after photobleaching for Wnt3EGFP at a distal target site showed similar recovery dynamics (Figure 5—figure supplement 1) whereas recovery after heparan sulfate proteoglycan disruption showed faster recovery (Figure 5—figure supplement 2). Orientation: anterior to the left. Scale bar 30 μm.
-
Figure 5—source data 1
Individual fluorescence recovery after photobleaching measurements of Wnt3EGFP and secEGFP embryos.
- https://cdn.elifesciences.org/articles/59489/elife-59489-fig5-data1-v2.xlsx
Figure 5—figure supplement 1
Representative fluorescence recovery of Wnt3EGFP at a distal target site after photobleaching.
(A) Expression of Wnt3EGFP in Tg(−4.0wnt3:Wnt3EGFP) 48 hpf before photobleaching. (B) Photobleached region of Wnt3EGFP. (C) Recovery of fluorescence intensity in the bleached region due to diffusion of molecules from the neighboring unbleached regions. (D) Fluorescence recovery curve for Wnt3EGFP with a time constant (τfast) of ~6.5 min and an apparent global diffusion coefficient (Dglobal) of 0.47 μm2/s. Scale bar 30 μm.
Figure 5—figure supplement 2
Representative fluorescence recovery of Wnt3EGFP at a distal target site after heparan sulfate proteoglycan (HSPG) disruption.
(A) Expression of Wnt3EGFP in Tg(−4.0wnt3:Wnt3EGFP) before photobleaching in HSPG disrupted embryos. (B) Photobleached region of Wnt3EGFP. (C) Recovery of fluorescence intensity in the bleached region due to diffusion from the neighboring unbleached regions. (D) Fluorescence recovery curve for Wnt3EGFP with a recovery time (τfast) of ~1.5–2.5 min and a Dglobal of ~1.5–3.75 μm2/s, which is approximately two to three times faster than untreated embryos as shown in Figure 5. Images orientation: anterior to the left. Scale bar 30 μm.
Figure 5—figure supplement 3
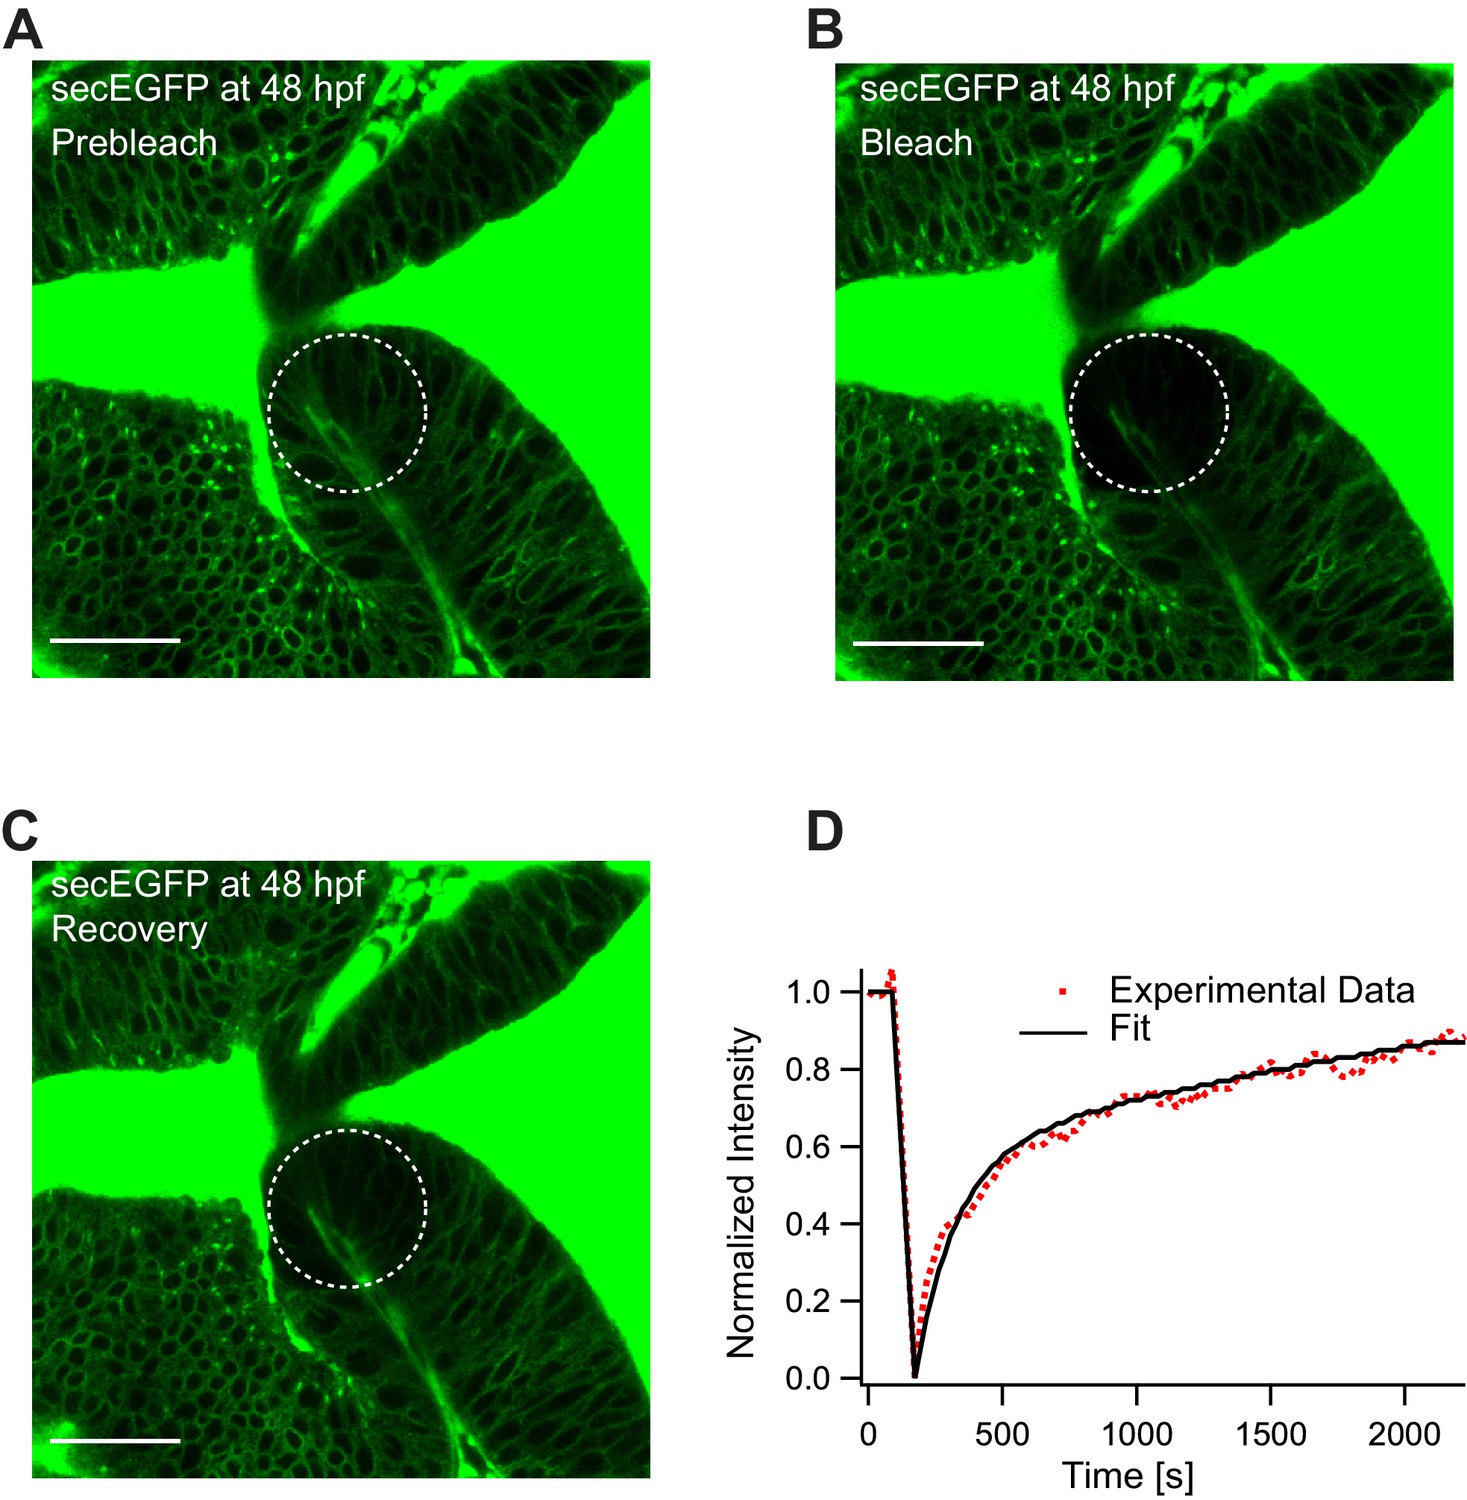
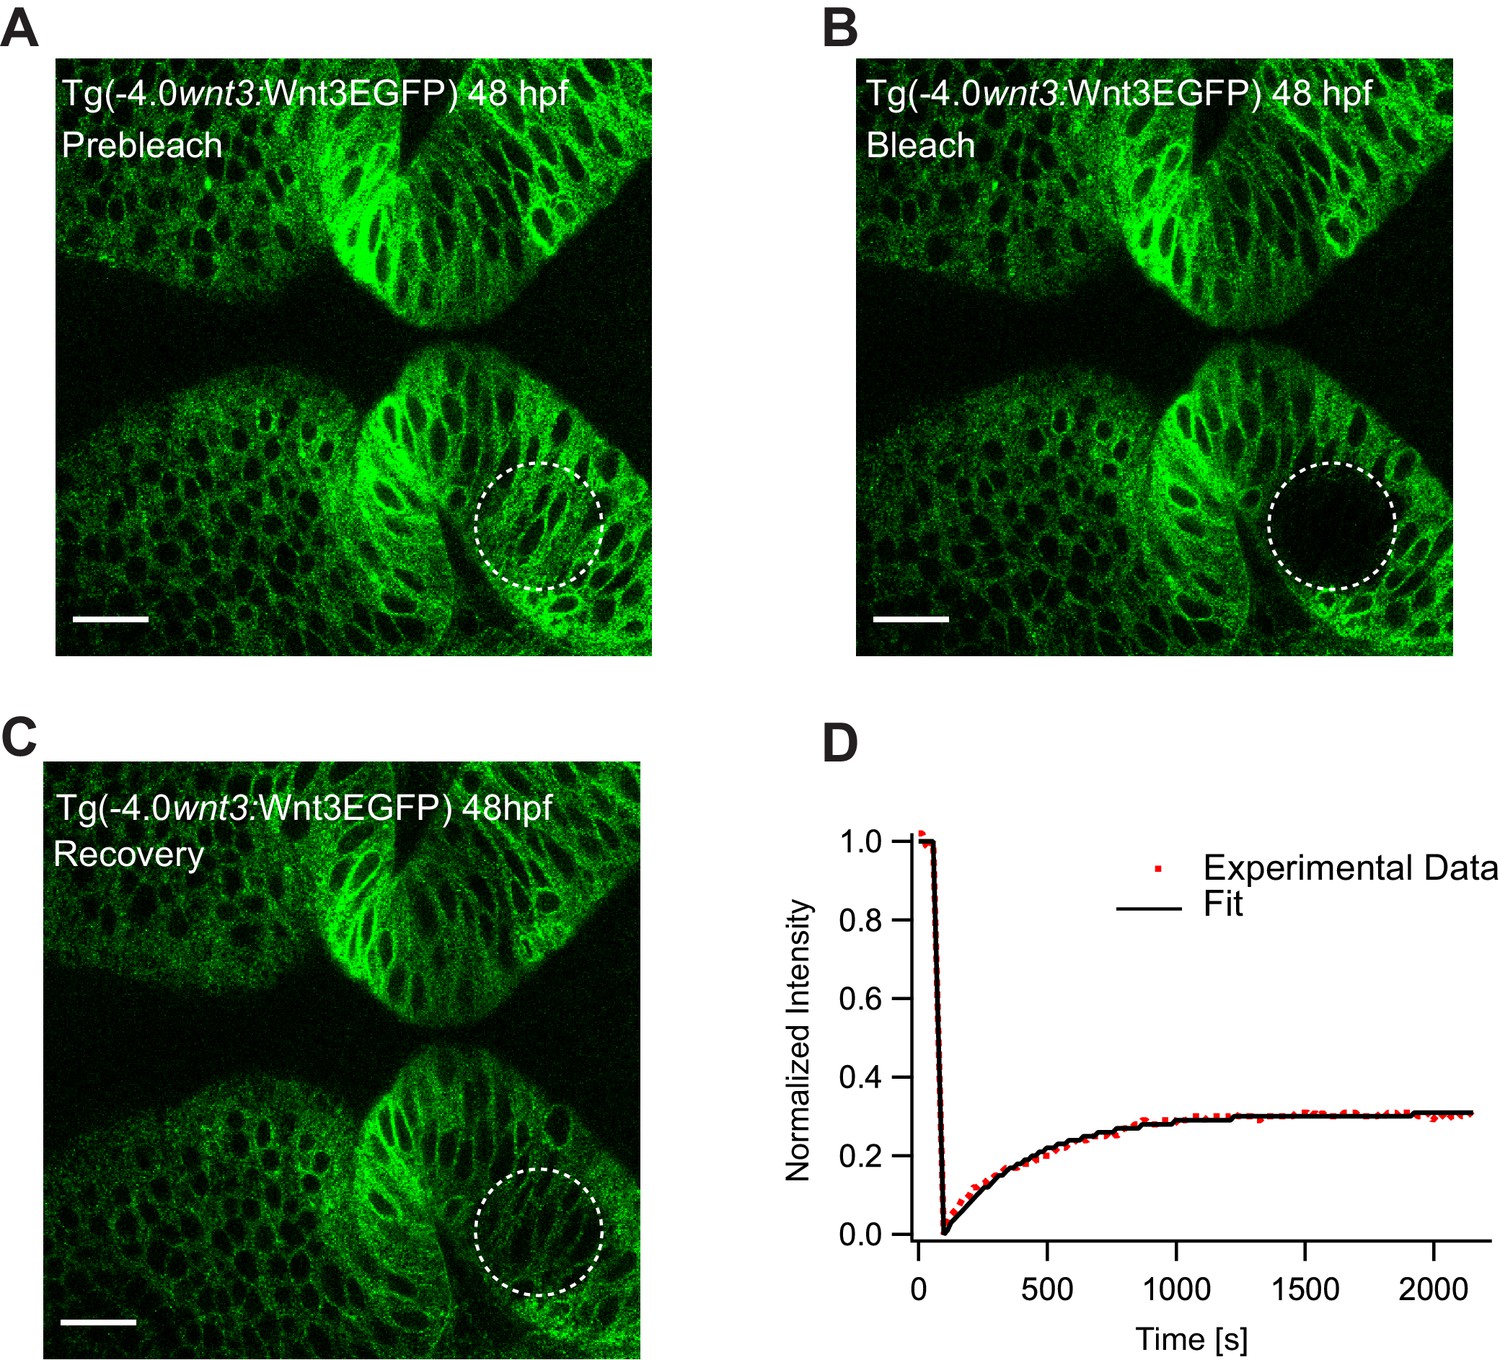
Representative fluorescence recovery of secEGFP after photobleaching at 48 hpf.
(A) Expression of secEGFP before photobleaching. (B) Photobleached region of secEGFP. (C) Recovery of fluorescence intensity in the bleached region due to diffusion of molecules from the neighboring unbleached regions. (D) Fluorescence recovery curve for secEGFP with a quick recovery time (τfast) of ~45 s and a fraction of mobile component (Fm) of ~0.85. The average global diffusion coefficient (Dglobal) measured for secEGFP was 13 ± 4 μm2/s. Images orientation: anterior to the left. Scale bar 30 μm.
Figure 5—figure supplement 4
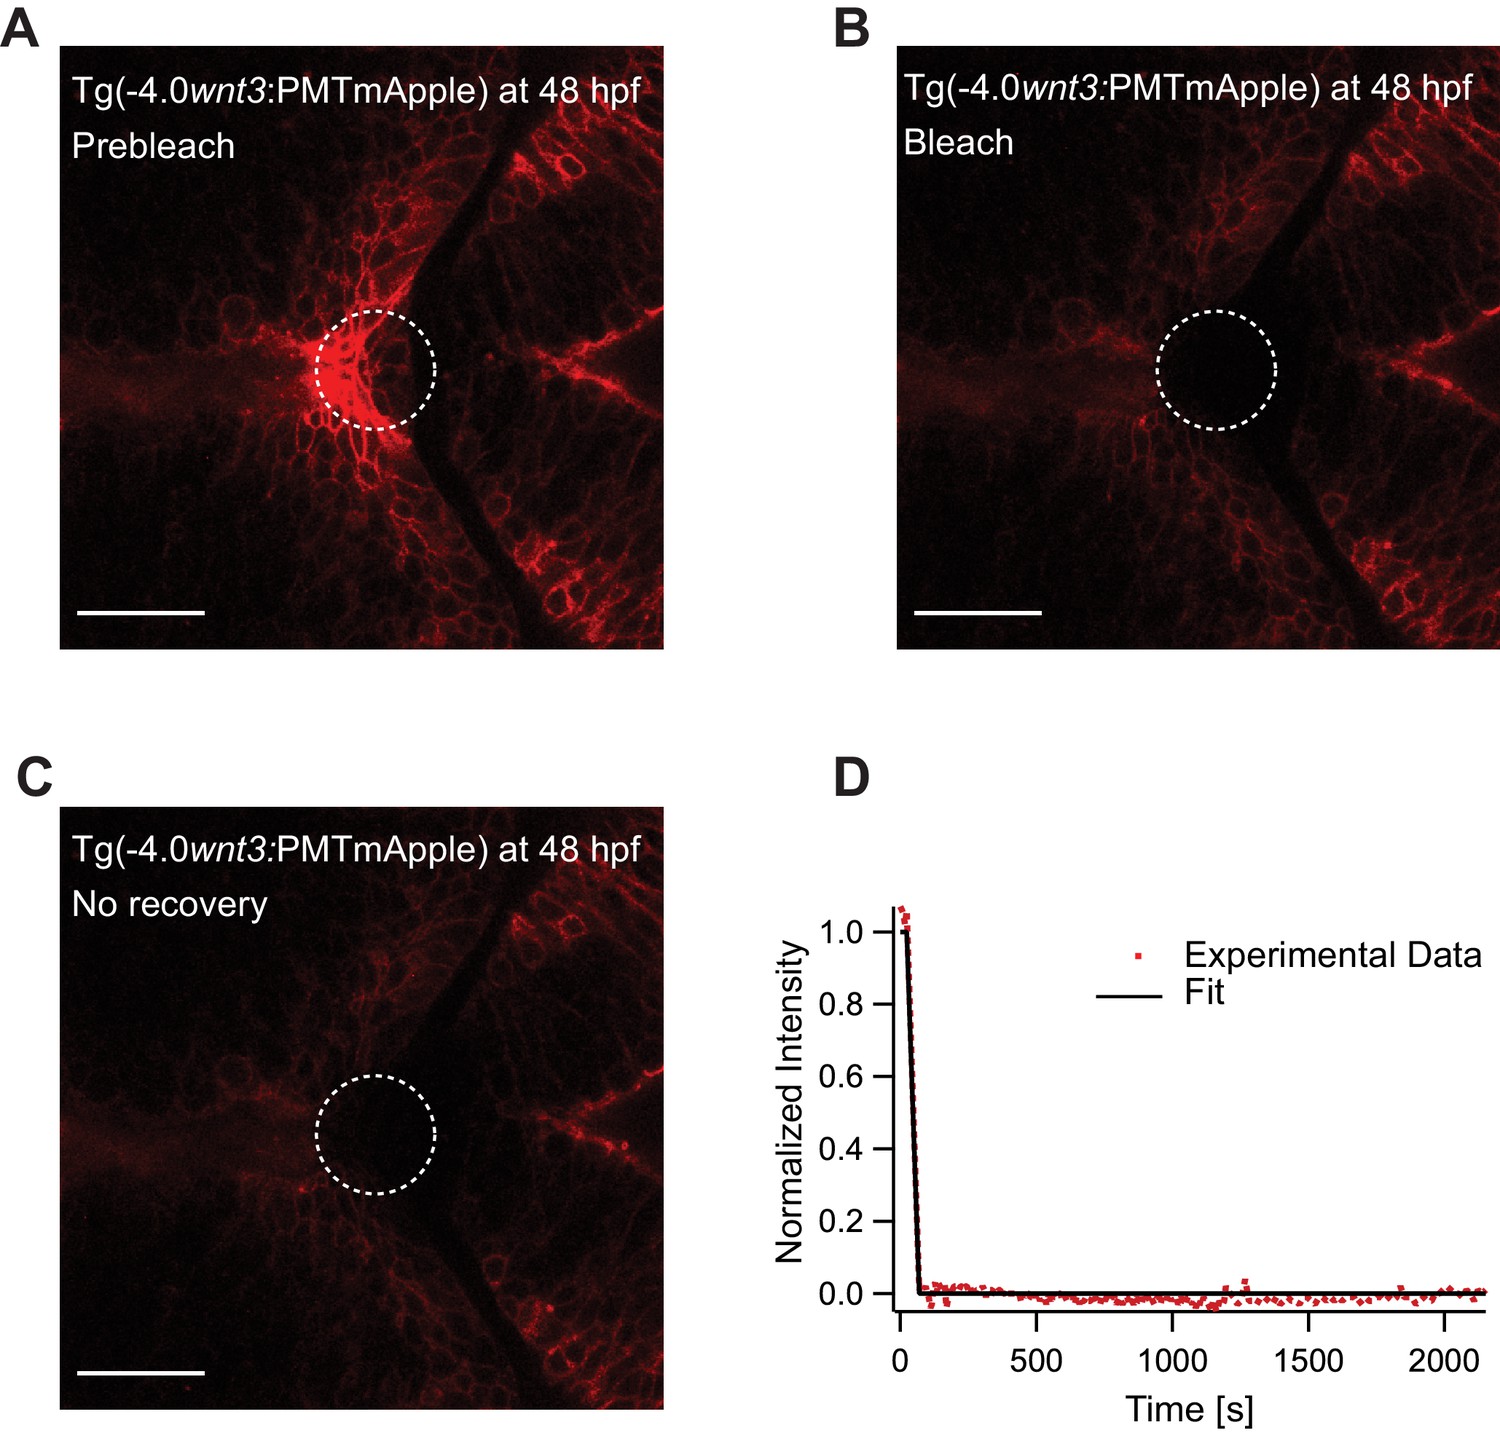
Representative fluorescence recovery of PMTmApple after photobleaching at 48 hpf.
(A) Expression of PMTmApple in Tg(−4.0wnt3:PMTmApple) at 48 hpf before photobleaching. (B) Photobleached region of PMTmApple. (C) No recovery of fluorescence intensity in the bleached region as PMT remains tethered to the cell membrane and does not diffuse. (D) Fluorescence recovery curve for PMTmApple. Images orientation: anterior to the left. Scale bar 30 μm.
Figure 6 with 3 supplements
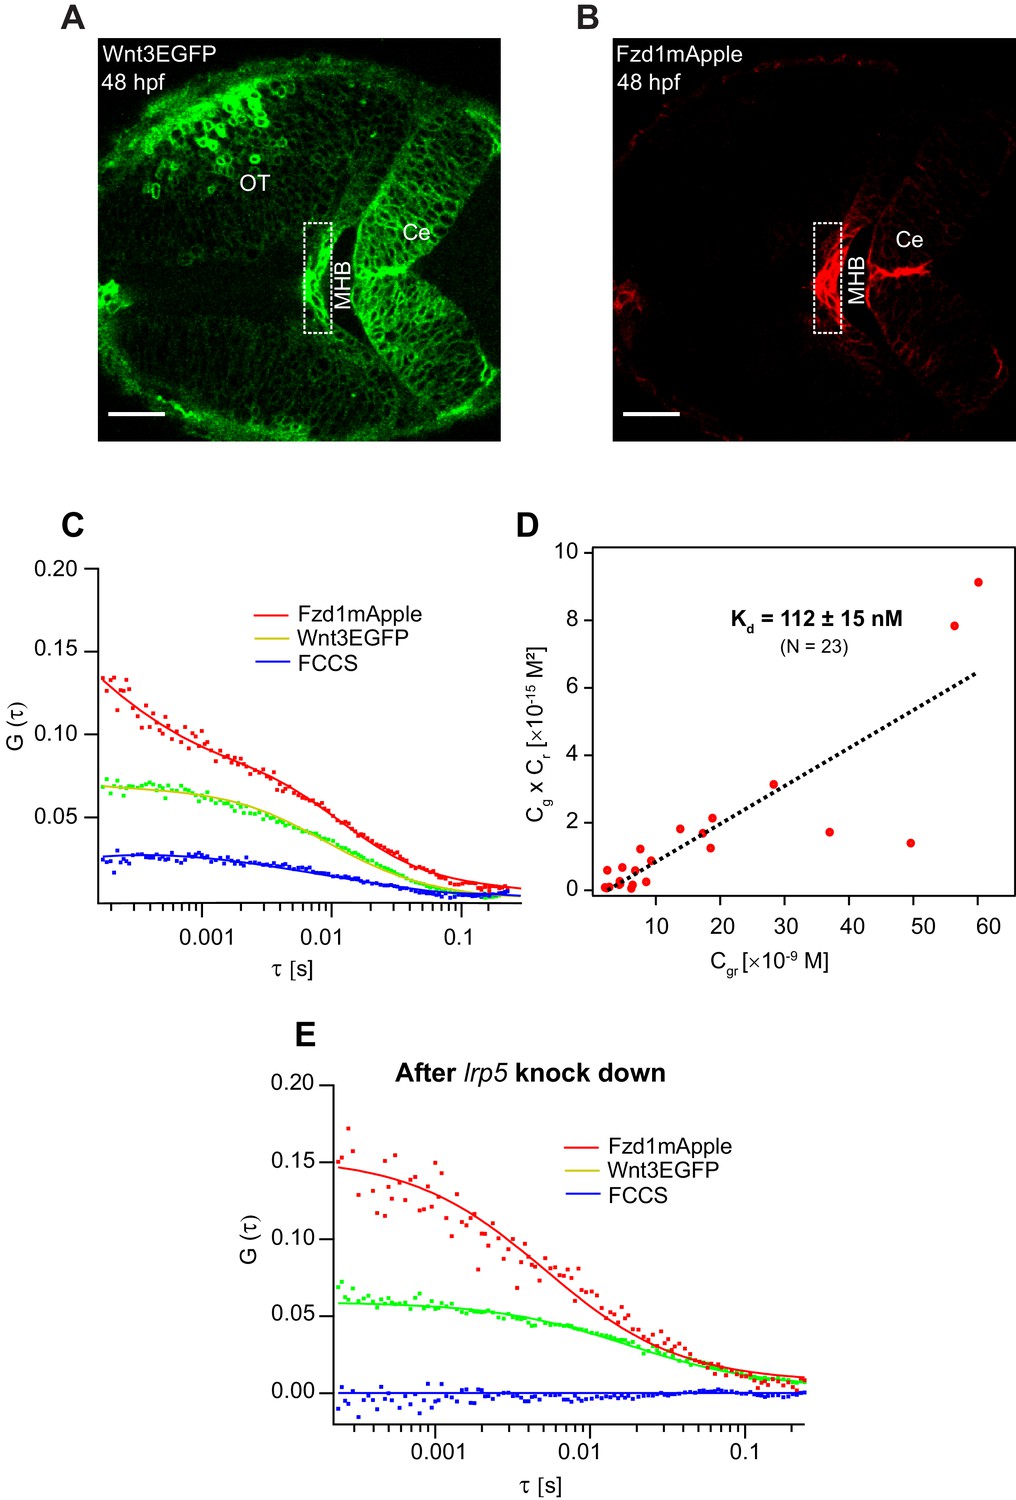
Investigation of in vivo Wnt3-Fzd1 binding by FCCS.
Expression of (A) Wnt3EGFP and (B) Fzd1mApple in the double transgenic [Tg(−4.0wnt3:Wnt3EGFP)×Tg (−4.0wnt3:Fzd1mApple)] (anterior to the left). (C) Representative auto- and cross-correlation functions (dots) and fittings (lines) of a Wnt3EGFP-Fzd1mApple measurement at the indicated region. The cross-correlation function indicates Wnt3EGFP interacts with Fzd1mApple in vivo. (D) Determination of apparent dissociation constant (Kd) for Wnt3-Fzd1 interaction in vivo. Cg, Cr, and Cgr represents the concentration of unbound Wnt3EGFP, unbound Fzd1mApple, and bound Wnt3-Fzd1 molecules respectively. The estimated apparent Kd [Kd = (Cg × Cr)/Cgr] for Wnt3-Fzd1 in vivo is 112 ± 15 nM (N = 23; R2 = 0.85). (E) Representative auto- and cross-correlation functions (dots) and fittings (lines) of a Wnt3EGFP-Fzd1mApple measurement after knocking down lrp5. No cross-correlation indicates Wnt3-Fzd1 interaction is abolished after knockdown of lrp5. Scale bars 30 μm.
-
Figure 6—source data 1
Apparent dissociation constant (Kd) calculation for Wnt3-Fzd1 interaction and fluorescence recovery after photobleaching recovery rates after lrp5 knockdown.
- https://cdn.elifesciences.org/articles/59489/elife-59489-fig6-data1-v2.xlsx
Figure 6—figure supplement 1
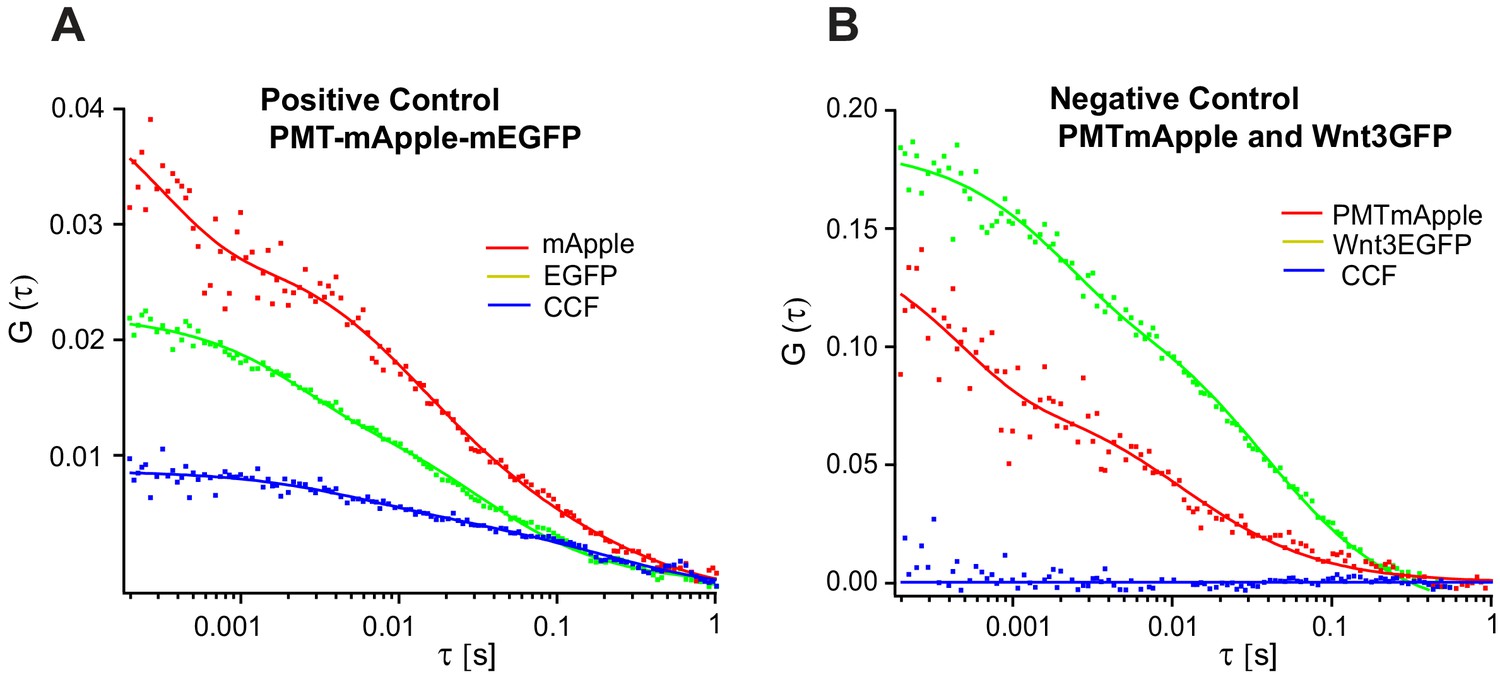
Representative FCCS measurements for positive and negative control in zebrafish.
Representative auto- and cross-correlation functions for (A) PMT-mApple-mEGFP which is a positive control showing a clear cross-correlation and (B) negative control PMT-mApple and Wnt3-EGFP showing no cross-correlations.
Figure 6—figure supplement 2
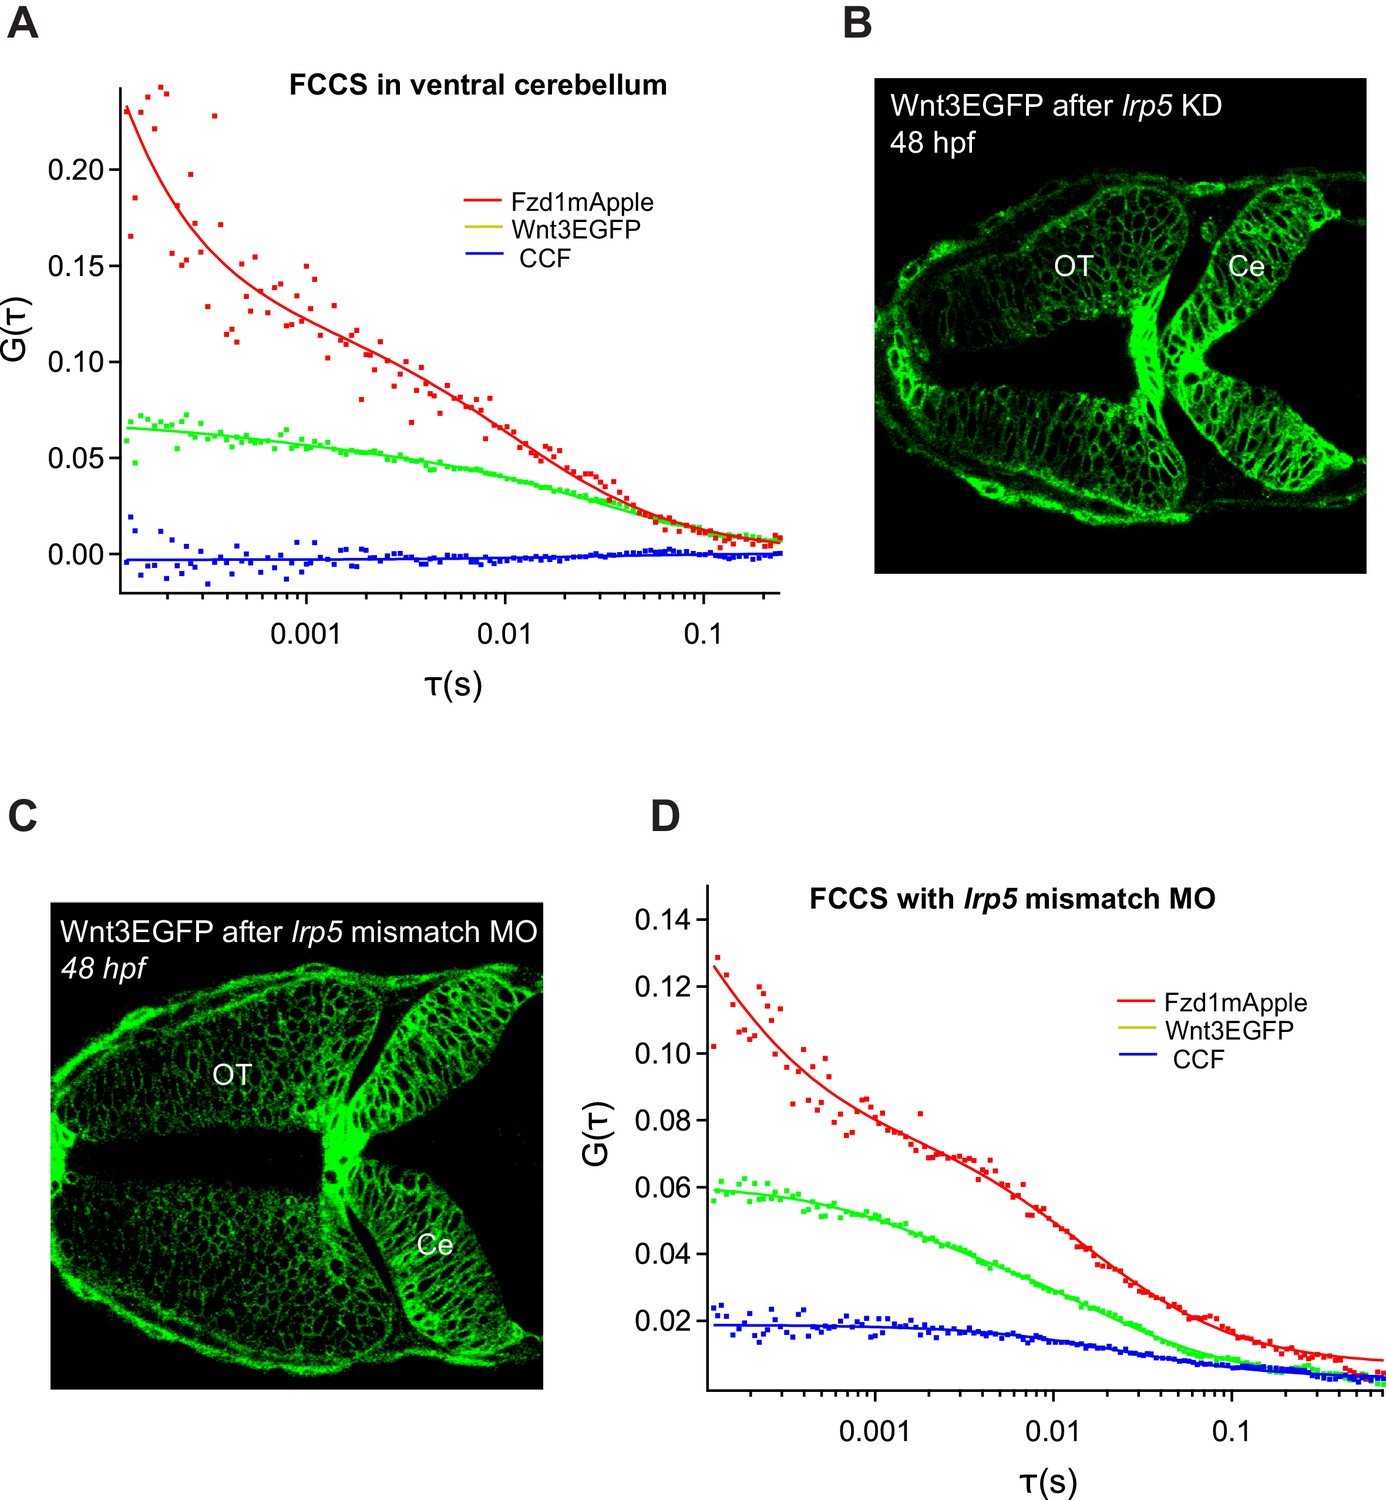
Role of Lrp5 coreceptor in Wnt3-Fzd1 binding.
(A) Representative FCCS measurement for Wnt3EGFP and Fzd1mApple in regions with no Lrp5 expression (ventral cerebellum). No cross-correlations obtained outside midbrain–hindbrain boundary and dorsal cerebellum indicating role of Lrp5 in Wnt3-Fzd1 interaction. (B) Knocking down lrp5 morpholino resulting in deformed optic tectum (OT) and cerebellum (Ce) of the zebrafish brain. (C) Wnt3EGFP after treatment with negative control lrp5 mismatch MO with five nucleotide substitutions showing normal brain development and (D) retaining cross-correlations between Wnt3EGFP and Fzd1mApple.
Figure 6—figure supplement 3
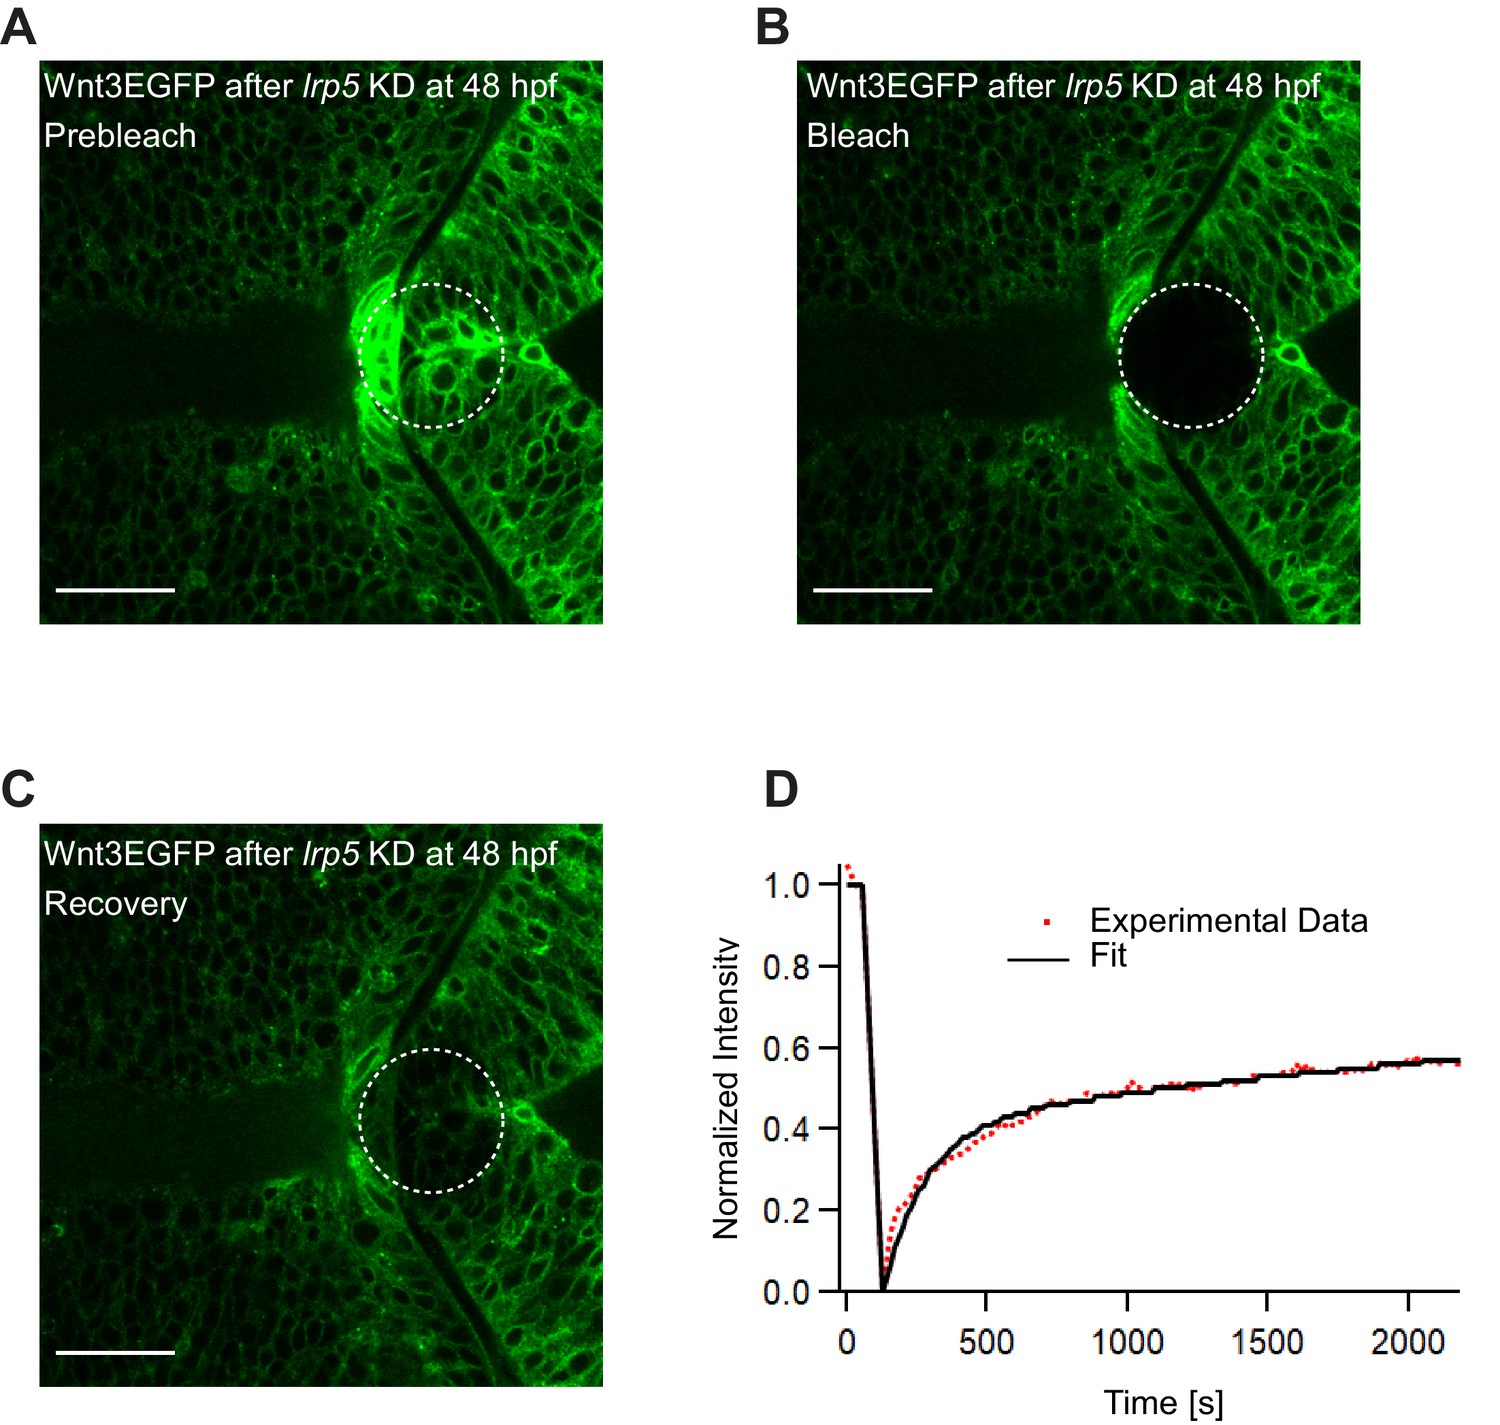
Representative fluorescence recovery of Wnt3EGFP in lrp5 knocked-down embryos at 48 hpf after photobleaching.
(A) Expression of Wnt3EGFP before photobleaching. (B) Photobleached region of Wnt3EGFP. (C) Recovery of fluorescence intensity in the bleached region due to diffusion of molecules from the neighboring unbleached regions. (D) Fluorescence recovery curve for Wnt3EGFP with a recovery time (τfast) of ~150 s and a fraction of mobile component (Fm) of ~0.5. The average global diffusion coefficient (Dglobal) measured for Wnt3EGFP after lrp5 knockdown was 2.8 ± 0.8 μm2/s. Images orientation: anterior to the left. Scale bar 30 μm.
Videos
Video 1
Colocalization of Wnt3EGFP and PMTmApple in Tg(−4.0wnt3:Wnt3EGFP) × Tg(−4.0wnt3:PMTmApple) at 24 hpf.
Video 2
Colocalization of Wnt3EGFP and PMTmApple in Tg(−4.0wnt3:Wnt3EGFP) × Tg(−4.0wnt3:PMTmApple) at 48 hpf.
Video 3
Source (red) and distal target (green) regions of Wnt3 at 24 hpf.
Video 4
Source (red) and distal target (green) regions of Wnt3 at 48 hpf.
Tables
Table 1
Influence of heparan sulfate proteoglycans on the dynamics of Wnt3EGFP, LynEGFP, and secretedEGFP at 48 hpf. Data are mean ± SD.
| Sample | Dfast (µm2/s) | Dslow (µm2/s) | Fslow | No. of measurements |
|---|---|---|---|---|
| Wnt3EGFP | 24.7 ± 4.8 | 0.6 ± 0.3 | 0.6 ± 0.02 | 47 |
| Wnt3EGFP + heparinase | 43.4 ± 7.6 | 0.4 ± 0.2 | 0.6 ± 0.04 | 63 |
| Wnt3EGFP + surfen | 42.0 ± 6.9 | 0.5 ± 0.3 | 0.6 ± 0.08 | 30 |
| LynEGFP | 39.1 ± 11.2 | 2.2 ± 0.6 | 0.7 ± 0.04 | 29 |
| LynEGFP + heparinase | 40.1 ± 9.5 | 2.7 ± 0.7 | 0.6 ± 0.04 | 35 |
| LynEGFP + surfen | 41.4 ± 6.9 | 3.1 ± 0.9 | 0.7 ± 0.06 | 18 |
| SecEGFP | 59.4 ± 9.4 | - | - | 30 |
| SecEGFP + heparinase | 56.9 ± 9.7 | - | - | 30 |
| SecEGFP + surfen | 53.5 ± 8.5 | - | - | 18 |
-
Table 1—source data 1
Tg(−4.0wnt3:Wnt3EGFP) embryos treated by heparinase and surfen.
(A) The expression of Wnt3EGFP after heparinase treatment. (B) Distribution of Dextran-TRITC coinjected with heparinase in the BV of Tg(−4.0wnt3:Wnt3EGFP) embryo. (C) Expression of Wnt3EGFP after surfen treatment. BV, brain ventricle; Ce, cerebellum. Images orientation: anterior to the left. Scale bar 50 μm.
- https://cdn.elifesciences.org/articles/59489/elife-59489-table1-data1-v2.pdf
-
Table 1—source data 2
Individual fluorescence correlation spectroscopy measurements of Wnt3EGFP, LynEGFP, and secEGFP embryos before and after heparan sulfate proteoglycan disruption.
- https://cdn.elifesciences.org/articles/59489/elife-59489-table1-data2-v2.xlsx
Key resources table
| Reagent type (species) or resource | Designation | Source or reference | Identifiers | Additional information |
|---|---|---|---|---|
| Gene (Danio rerio) | fzd1 | Ensembl Zebrafish (GRCZ11) | ENSDART00000179533.2 | Transcript: fzd1-201 |
| Genetic reagent (Danio rerio) | Tg(−4.0wnt3:Wnt3EGFP) | Teh et al., 2015https://doi.org/10.1242/dev.127589 | ZDB-TGCONSTRCT-150922–7 | The transgenic zebrafish line expresses functional Wnt3EGFP driven by the 4 kb wnt3 promoter |
| Genetic reagent (Danio rerio) | Tg(−4.0wnt3:EGFP) | Teh et al., 2015https://doi.org/10.1242/dev.127589 | ZDB-TGCONSTRCT-150922–8 | The transgenic zebrafish line expresses cytosolic EGFP driven by the 4 kb wnt3 promoter |
| Genetic reagent (Danio rerio) | Tg(−4.0wnt3:PLMTmApple) [referred as Tg(−4.0wnt3:PMTmApple) in this paper] | This paper | ZDB-TGCONSTRCT-201104-1 | Plasma membrane targeting sequence tagged with mApple (PMTmApple) in this transgenic line marks the plasma membrane of the Wnt3-producing cells(refer to "Generation of transgenic lines and zebrafish maintenance" for additional details). |
| Genetic reagent (Danio rerio) | Tg(−4.0wnt3:Fzd1mApple) | This paper | ZDB-TGCONSTRCT-201104–2 | The 4 kb wnt3 promoter drives Fzd1mApple expression in Wnt3-producing cells(refer to "Generation of transgenic lines and zebrafish maintenance" for additional details). |
| Genetic reagent (Danio rerio) | Tg(−8.0cldnB:lynEGFP) | Haas and Gilmour, 2006 2 https://doi.org/10.1016/j.devcel.2006.02.019 | ZDB-TGCONSTRCT-070117–15 | |
| Genetic reagent (Danio rerio) | Tg(7xTcf-Xla.Siam:NLS-mCherry) | Moro et al., 2012 | ZDB-TGCONSTRCT-110113–2 | This construct uses seven TCF responsive elements fused to the Xenopus laevis siamois minimal promoter to drive expression of NLS-mCherry |
| Recombinant DNA reagent | pminiTol2-4kbwnt3pro-PMTmApple | This paper | This plasmid is used to generate Tg(−4.0wnt3: PMTmApple) transgenic zebrafish(refer to "Generation of transgenic lines and zebrafish maintenance" for additional details). | |
| Recombinant DNA reagent | pminiTol2-4kb wnt3pro-Fzd1mApple | This paper | This plasmid is used to generate Tg(−4.0wnt3: Fzd1mApple) transgenic zebrafish(refer to "Generation of transgenic lines and zebrafish maintenance" for additional details). | |
| Recombinant DNA reagent | pminiTol2-4kbwnt3pro-secEGFP | This paper | This plasmid together with Tol2 transposase mRNA is microinjected into 1–2 cell stage zebrafish embryo for somatic expression of secGFP in Wnt3-positive domains (refer to "Generation of transgenic lines and zebrafish maintenance" for additional details). | |
| Sequence-based reagent | lrp5MoUp (Gene Tools) | Willems et al., 2015 https://doi.org/10.1371/journal.pone.0131768 | AGCTGCTCTTACAGTTTGTAGAGAG (25) | |
| Sequence-based reagent | lrp5MoDown (Gene Tools) | CCTCCTTCATAGCTGCAAAAACAAG (25) | ||
| Sequence-based reagent | mmlrp5 (Gene Tools) | AGGTGCTGTTAGAGTTTCTAGACAG (25) | ||
| Chemical compound, drug | Heparinase I from Flavobacterium heparinum | Merck | Cat# H2519 | |
| Chemical compound, drug | Surfen Hydrate | Merck | Cat# S6951 | A heparan sulfate antagonist |
| Software, algorithm | Imaris | Oxford Instruments | RRID:SCR_007370 | Check Materials and methods subsection Colocalization analysis |
Additional files
Download links
A two-part list of links to download the article, or parts of the article, in various formats.
Downloads (link to download the article as PDF)
Open citations (links to open the citations from this article in various online reference manager services)
Cite this article (links to download the citations from this article in formats compatible with various reference manager tools)
Wnt3 distribution in the zebrafish brain is determined by expression, diffusion and multiple molecular interactions
eLife 9:e59489.
https://doi.org/10.7554/eLife.59489


