The neural basis for a persistent internal state in Drosophila females
- Princeton Neuroscience Institute, Princeton University, United States
- Department of Computer Science, Princeton University, United States
- Brain & Cognitive Science Department, Massachusetts Institute of Technology, United States
Figures
Figure 1 with 1 supplement
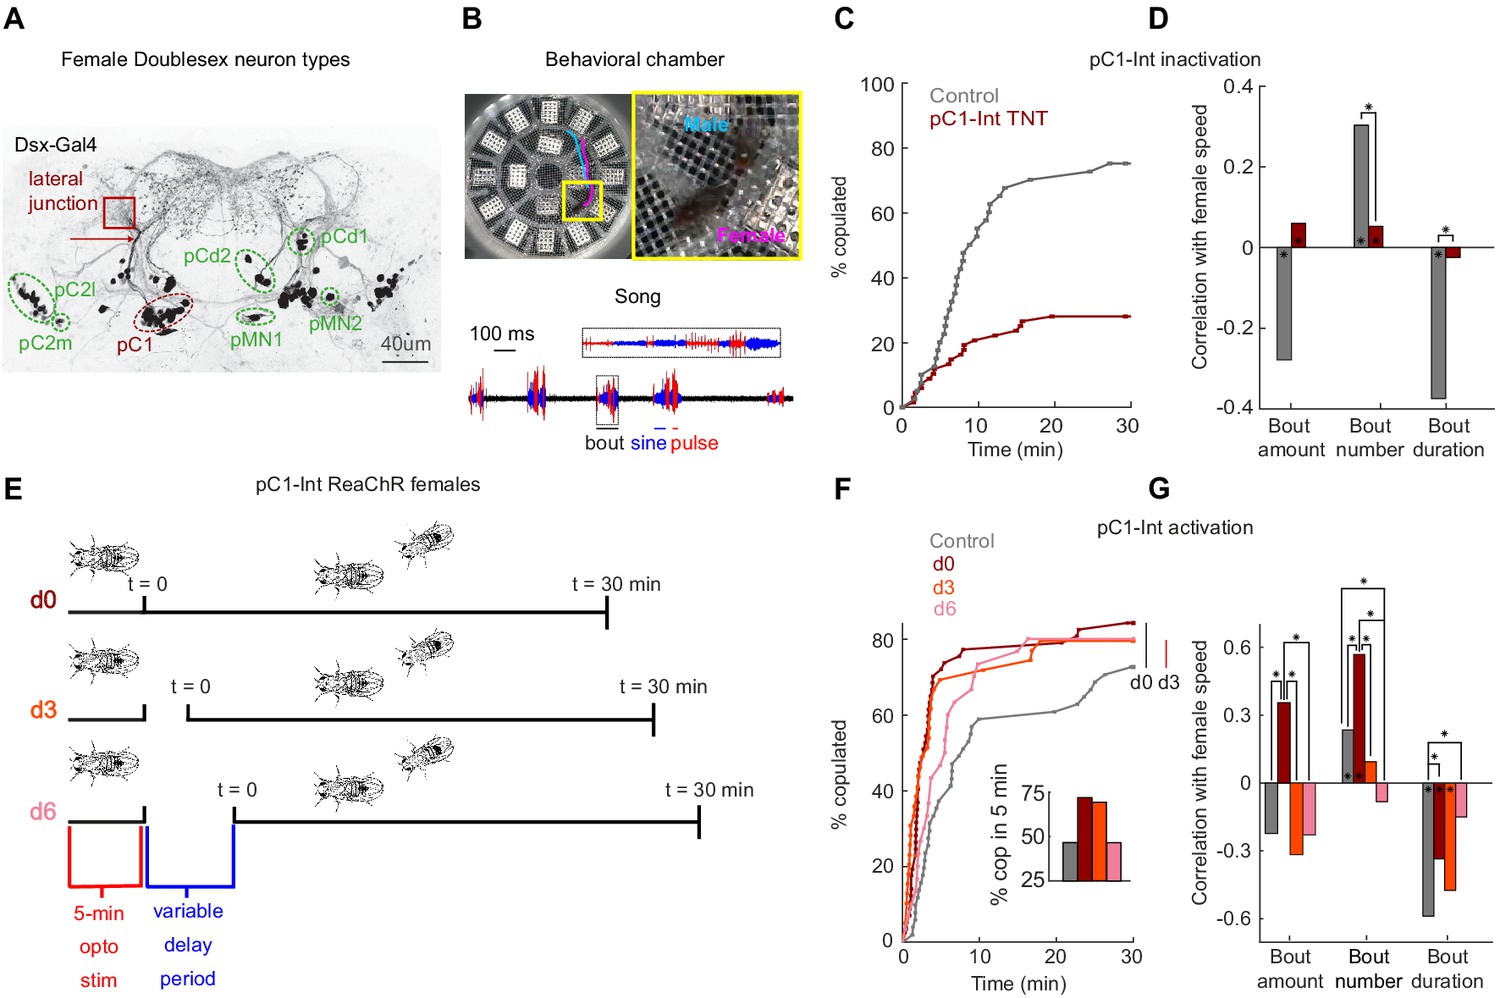
pC1-Int activation has a persistent effect on female receptivity and responses to male courtship song.
(A) Dsx+ neurons in the female central brain. Max z-projection of a confocal stack in which Dsx+ cells are labeled with GFP (adapted from Deutsch et al., 2019). Dsx is expressed in eight morphologically distinct cell types in the female brain (seven types are indicated by circling of their somas; the more anterior cell type aDN [Lee et al., 2002] is not shown). pCd has two morphologically distinct types, pCd1 and pCd2 (Kimura et al., 2015). Many of these cells project to a brain region known as the lateral junction (red square). pC1 cells project to the lateral junction through a thin bundle (red arrow). This bundle was used to identify these cells in the EM dataset (see Figure 3—figure supplement 1). (B) Behavioral chamber (diameter ~25 mm) tiled with 16 microphones to record song. Male and female positions were tracked (a 1.5 s example trace is shown for the male (cyan) and female (magenta)), and male song was automatically segmented into sine and pulse (below). (C) Percent of male/female pairs that copulated as a function of time. Cox proportional hazards regression p=6.3*10−6: pC1-Int TNT (red, n = 68 pairs) compared with controls (gray, n = 40 pairs). (D) Rank correlation between male song (bout amount, number and duration) and female speed for pC1-TNT females (dark red) or control females (gray) paired with wild-type males. Significance between experimental groups was measured using ANOCOVA and multiple comparison correction (*p<0.01). An asterisk on a bar indicates a significant correlation between a single male song measure and female speed (*p<0.01). (E) Experimental design for pC1-Int activation. pC1-Int cells were activated (using ReaChR) for 5 min in a solitary female placed in the behavioral chamber. Following light offset, a wild-type male was introduced at t = 0, following a variable delay period (d0 = no delay; d3 = 3 min delay; d6 = 6 min delay). All behavioral phenotypes were measured at t > 0. (F) Same as (C), but for females expressing ReachR in pC1-Int cells according to the protocol shown in (E). Inset: The percent of pairs copulated between t = 0 and t = 5 min for each condition. pC1-Int activated females in the d0 condition (n = 57) copulated significantly faster than controls (n = 51; vertical black line; p=0.0045, Cox’s proportional hazards regression model, accounting for censoring, as not all flies copulated in 30 min; black vertical line). Time to copulation was also shorter in the d3 group (n = 39 pairs) compared with controls (d0, no ATR), but the difference was not significant after Bonferroni correction (p=0.034; red vertical line), and no significant difference was found between the 6 min delay (n = 30) and control groups (p=0.21). (G) Same as (D), but for females expressing ReachR in pC1-Int cells according to the protocol shown in (E). Asterisks show significance, using the same criteria as in (D). Numbers of pairs are the same as in (F).
Figure 1—figure supplement 1
Tracking behavior with LEAP, receptivity of pCd1 inactivated and activated females, and song production of males paired with pC1-Int activated females.
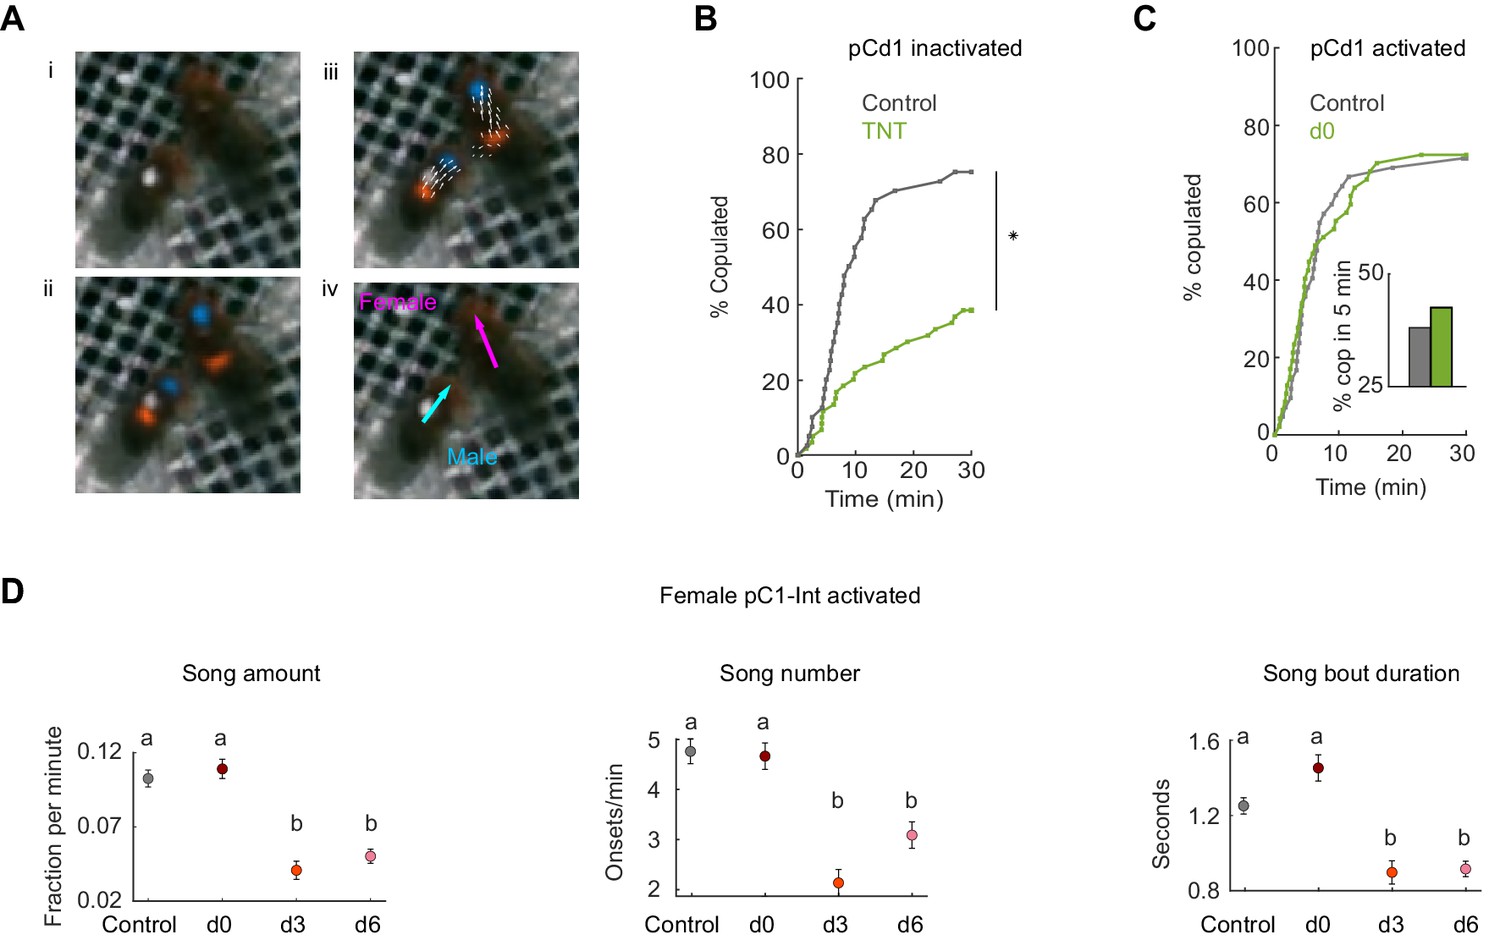
(A) (i) A single video frame of a male (with white painted dot) and a female in the behavioral chamber. (ii) Confidence maps (Pereira et al., 2019) for male and female head (blue) and thorax (red). (iii) Part affinity vector fields (Cao et al., 2017). (iV) Heading of male (cyan) and female (magenta). (B) Percent of pairs that copulated as a function of time (p=0.0001, Cox proportional hazards regression, see Materials and methods; n = 40, 60 pairs for Control, d0). pCd1 > TNT (see Key Resources Table for full genotype). (C) Left: Same as (B) for pCd1 activated female (pCd1 >ReaChR, see Key Resources Table for full genotype). p=0.93, Cox proportional hazards regression, see Materials and methods; n = 42, 47 pairs for Control, d0. Inset: percent of flies copulated in 5 min. (D) For males paired with pC1-Int > ReaChR females: song amount (left), number (middle) and duration are defined as in Clemens et al., 2015, see Materials and methods. Mean and standard error over 1 min windows are shown for each condition.
Figure 2 with 3 supplements
Automated identification of persistent female behaviors following pC1-Int activation.
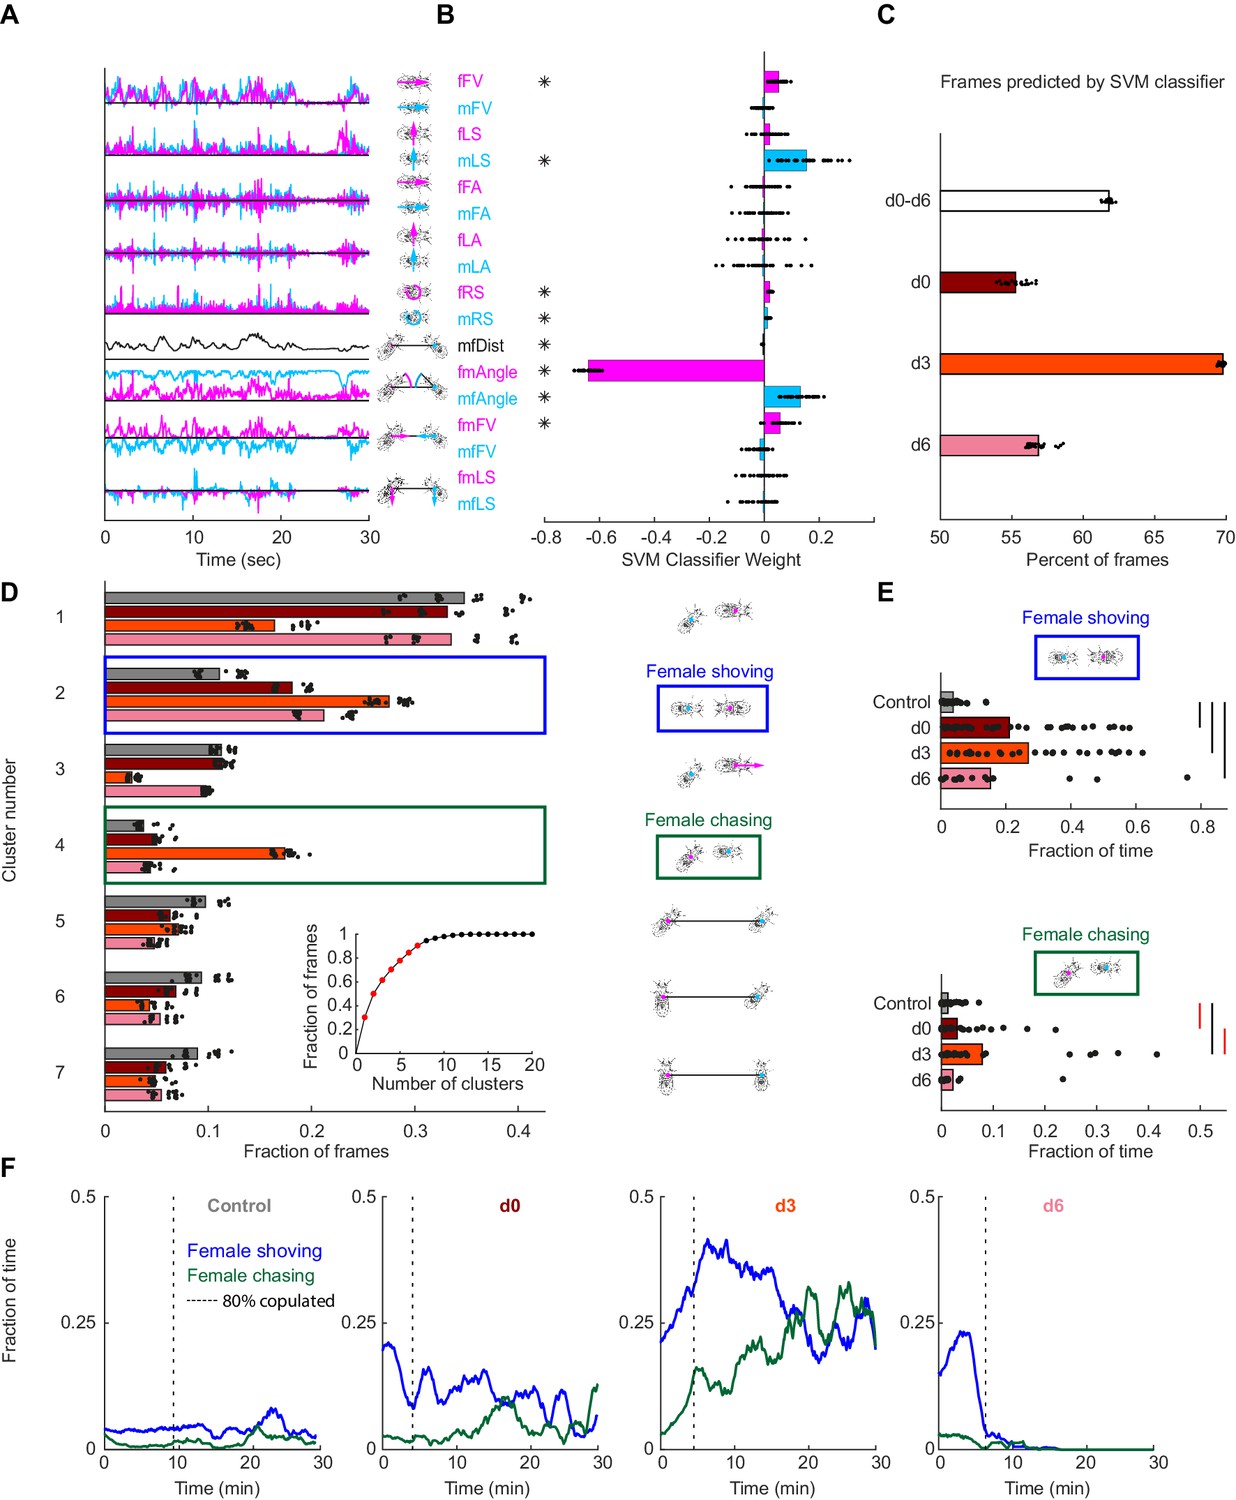
(A) For each video frame, 17 parameters were extracted based on tracking of male/female position and heading (see Materials and methods for parameter definition). An example trace (30 s) is shown for each parameter. (B) 30 independent (using non-overlapping sets of video frames) Support Vector Machine (SVM) classifiers were trained to classify frames (each frame represented by 17 values) as belonging to control or experimental group (all delays d0-d6 considered together; see Materials and methods). Each classifier is represented by 17 points - one for each parameter. Each point is the weight associated with a given parameter for one classifier, and the bar height represents the mean over classifiers (*p<10−4, one-sample t-test with Bonferonni correction for multiple comparisons; see Materials and methods). (C) The percent of frames correctly classified using the SVM classifier. Each dot is the prediction of a single SVM classifier, trained to classify frames as belonging to control or experimental group (d0, d3, d6, or d0-d6 together) – 30 classifiers and their mean plotted for each group. (D) K-means was used to cluster frames based on the eight most significant parameters (marked with asterisks in (B)). The largest 7 clusters include 90.4% of the frames (see inset). Clustering was performed 30 times (black dots; bars = mean), using different but overlapping sets of frames. The same number of frames was taken from each group (see Materials and methods). Cluster 2 (blue box - ‘female shoving’) is more probable following pC1-Int activation (in d0, d3 and d6 conditions) compared to control, while cluster 4 (green box- ‘female chasing’) is more probable in the d3 condition only compared to control. At right, schematic describing the male-female interaction in each cluster, based on the mean values of the weights. (E) JAABA-based classification of shoving (top) and chasing (bottom) behaviors. Each dot represents a single pair of flies. The fraction of time the male-female pair spent shoving (0.037/0.21/0.27/0.15 for control/d0/d3/d6) or chasing (0.013/0.030/0.079/0.022) are shown. Black lines represent significant differences with p<0.05 after Bonferroni correction for multiple comparison. Red lines - significant before, but not after correction for multiple comparisons. (F) Fraction of time females spent chasing or shoving (moving average with a 2-min window), based on JAABA classification in each condition (control, d0, d3, d6). T = 0 is the time the male was introduced (see Figure 1E), and the vertical dashed line indicates the time, for each condition, when 80% of the pairs copulated. Behaviors are not scored after copulation.
Figure 2—figure supplement 1
Detection of female shoving and chasing from male and female movements.
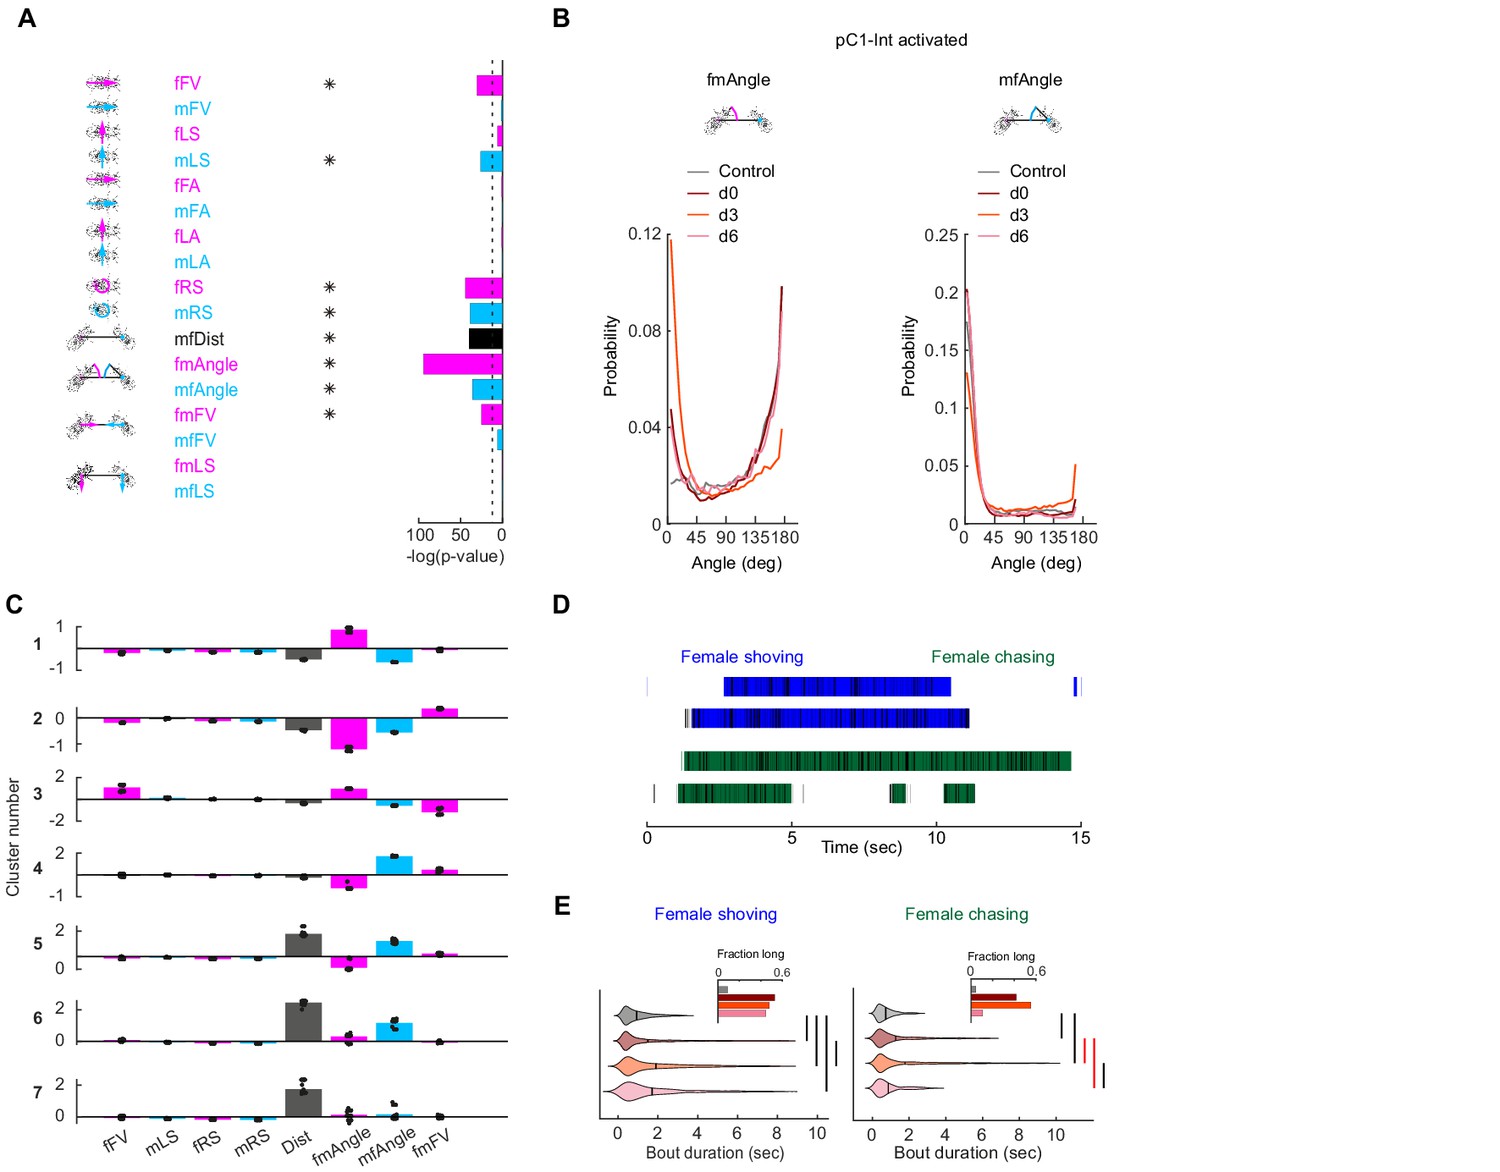
(A) Bar height indicates -log(P-value) for the probability that the mean distribution of SVM (Support Vector Machine) weights (over 30 independent classifiers) associated with each weight (Figure 2B) is significantly different than zero. Natural log is used. Dashed line indicates p-value=10−4. Asterisks indicate weights associated with distributions with p-value<10−4, using Benferroni correction for multiple comparisons. (B) Distribution of fmAngle and mfAngle (Figure 2A) are shown for four experimental conditions (4.5 deg bin size). fmAngle/mfAngle are the absolute number of degrees the female/male needs to turn in order to point to the centroid of the other fly (see cartoons). (C) The weights associated with each behavioral cluster (Figure 2D), for the eight significant weights (A) that were used for clustering. Each dot represents a single clustering repeat (see Materials and methods). (D) Frames that belong to the shoving (blue) or chasing (green) behavioral clusters (Figure 2D) are indicated as black horizontal lines. JAABA classification for the same 15 s is indicated as horizontal bars. (E) Violin plots (MATLAB violin) are shown for bout duration of female shoving (left) and chasing (right) bouts based on JAABA classification. Means are shown as black lines (0.99/1.47/1.88/1.7 s for control/d0/d3/d6). Black vertical line indicates a significant difference between groups (p<0.05, two sample t-test). Red line indicates that the difference is significant only if multiple comparison correction is not applied. Inset: The fraction of all frames in the experiment that belong to long bouts (≥5 s). In the main plots (but not in the insets and not for statistical measures), the smallest and largest 5% bout durations were excluded for each condition.
Figure 2—figure supplement 2
Female shoving and chasing detected using machine learning, and validated by manual inspection.
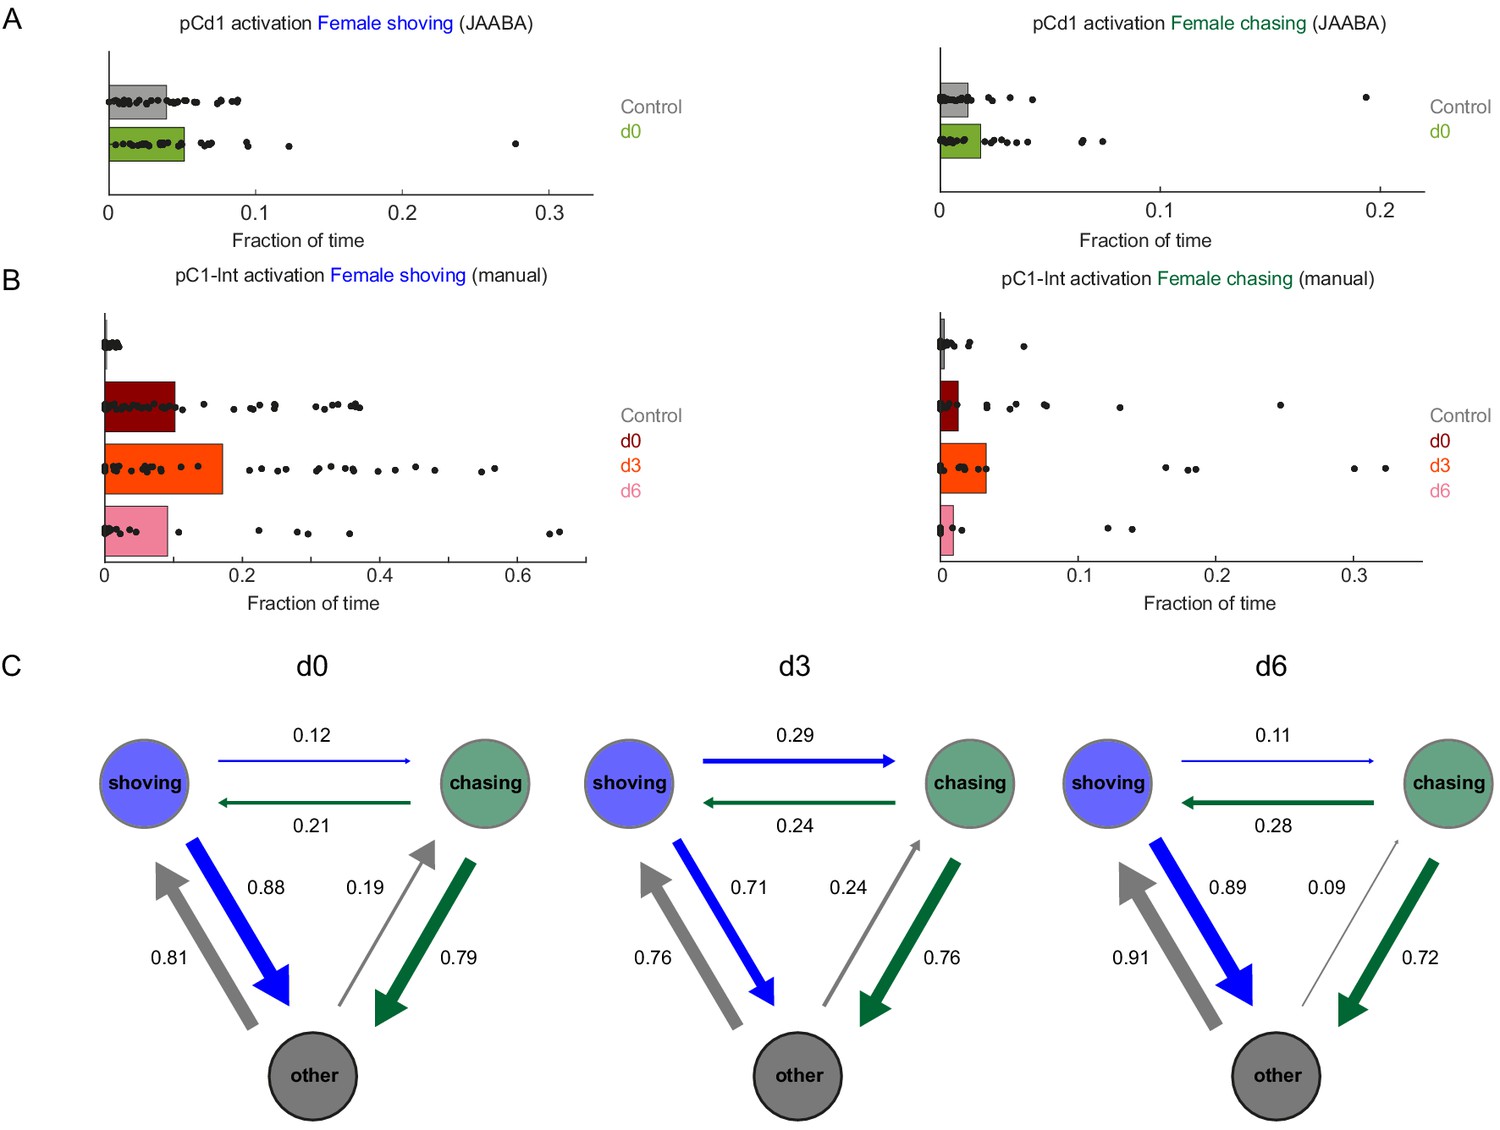
(A) Fraction of time the female spent shoving (left) or chasing (right) following pCd1 activation, based on JAABA classification. (B) Fraction of time the female spent shoving or chasing following pC1-Int activation, based on manual scoring. (C) Conditional probabilities (the probability for a given transition, given that a transition occurred) for chasing, shoving and other (no shoving and no chasing) for the d0, d3, and d6 conditions, following pC1-Int, 5 min activation. Arrow width is proportional to probability. Shoving and chasing classification is based on JAABA.
Figure 2—figure supplement 3
Manually-detected persistent behaviors in females, following pC1-Int activation.
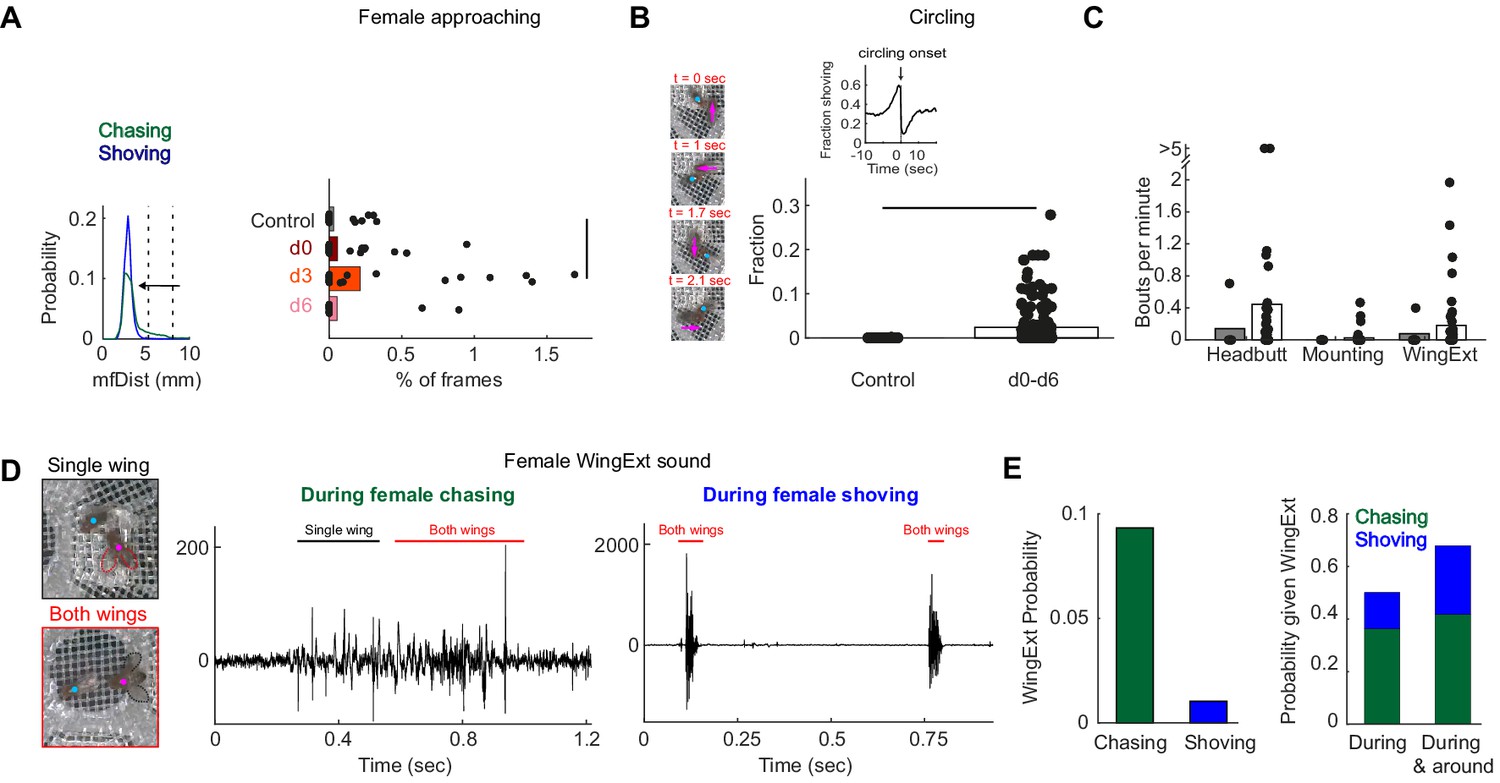
(A) Left: Distribution of mfDist (male-female distance) during female chasing (green) and shoving (blue) for d0-d6 conditions. The horizontal arrow illustrates the criterion used for defining ‘female approaching’ events: the female approaches the male from a large distance (>98 percentile mfDist during shoving or chasing) to short distance (<95 percentile for distance mfDist during shoving/chasing), while continuously heading towards the male (fmAngle <30 deg). Right: The percent of frames for each condition that belong to ‘female approaching’ epochs. Black line indicates significant difference (p<0.05, two sample t-test with Bonferroni correction for multiple comparisons). (B) Left: Four example frames from a single ‘circling’ epoch, separated by 90 deg in the female heading direction (see also Video 3). In this example, a female completed 270 deg in 2.1 s. Right: Fraction of time the male and female spend ‘circling’ based on manual annotation. The difference was statistically significant between the control and conditions d0-d6 taken together (p<0.05, two sample t-test), but not when considering each condition alone. Inset: The fraction of time the female spent shoving (d0–d6) aligned to circling onsets indicates high probability for shoving shortly before circling onset. (C) Number of bouts per minute are shown for manually detected behaviors: ‘female headbutting’, ‘female mounting’ and female extending one or two wings (see Videos 2 and 3). The two points with >5 represent 5.5 and 8.1 bouts per minute. (D) Example frames with female unilateral (top) or bilateral (bottom) wing extension (WingExt). Middle: example sound trace during female chasing with unilateral and bilateral wing extensions. Right: example sound trace during female shoving with bilateral wing extension. Note that the sound evoked by female wing extension during shoving was an order of magnitude larger than the sound evoked when the female extended one or two wings during chasing. (E) Left: Female wing extension was manually detected in 9.3% of all frames (d0-d6 taken together) during chasing epochs, and in 1% of the frames during shoving epochs. Right: 50% of the frames detected as ‘wing extension’ were part of female chasing or shoving, and 67.9% of the frames with female wing extension occurred during or around chasing or shoving bouts (‘around’: 2 s before epoch onset until 2 s after epoch offset).
Figure 3 with 2 supplements
Defining pC1 cell types.
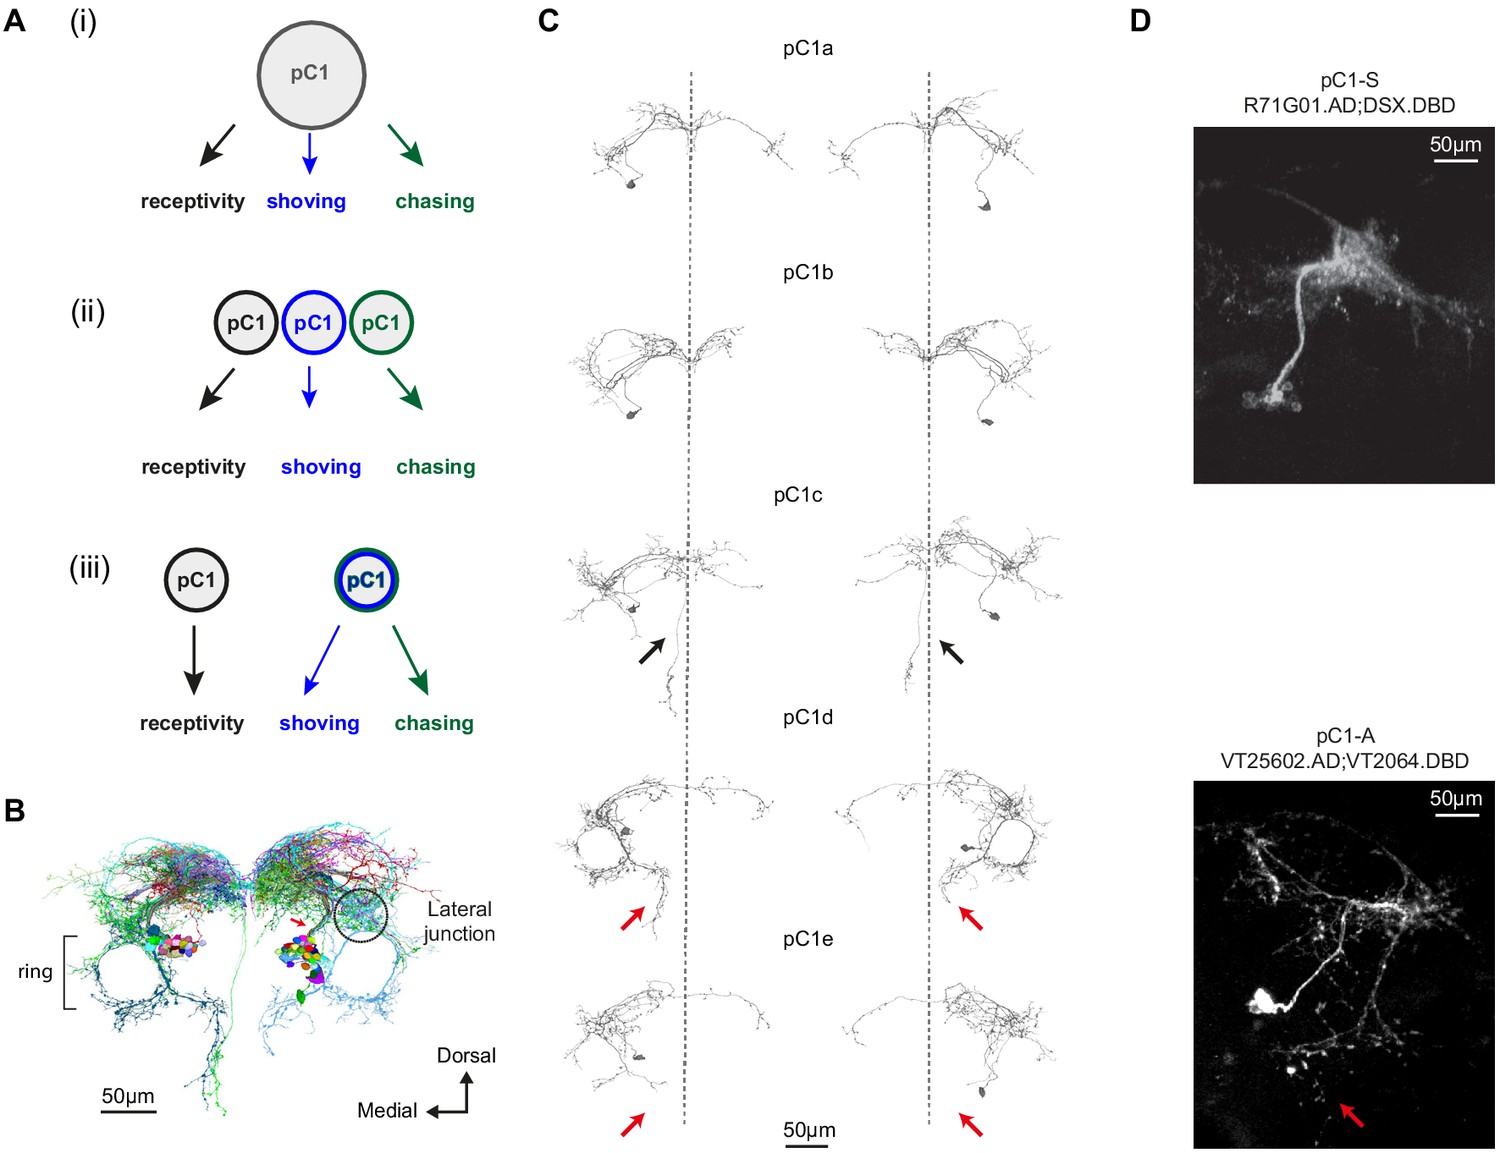
(A) Models of how pC1 cell types control female receptivity, shoving, and chasing. In (i), a homogenous pC1 population drives three distinct behaviors, and in (ii) and (iii) pC1 is a heterogenous group, with different behaviors controlled by different pC1 subsets. (B) EM reconstruction of pC1 cells and other example neurons that pass through a cross section in the pC1 bundle. See Figure 3—figure supplement 1 for all the cells that pass through the pC1 bundle, including neurons that project to the lateral junction (considered pC1 cells), and neurons that do not project to the junction (not considered pC1 cells). (C) Five pC1 cell types identified in FlyWire, mostly consistent with (Wang et al., 2020a). The medial projection in pC1c (see black arrows) is ipsilateral to the soma in one cell and contralateral in the other, likely reflecting variability between individual cells. Both pC1d and pC1e share a horizontal projection from the ring, but only pC1d cells have an extra vertical projection (red arrows indicate difference between pC1d and pC1e projections). The right pC1e cell is also missing part of the ring. (D) (top) Split GAL4 line pC1-S (R71G01.AD∩DSX.DBD; n = 8, 7.7 ± 5 cells per hemisphere) and (bottom) Split GAL4 line pC1-A (VT25602.AD∩VT2064.DBD; n = 7, 2 ± 0 cells per hemisphere). Neurons express GFP and are labeled with anti-GFP, see Key Resources Table for full genotype. pC1-A has a medial projection (red arrow), similar to pC1d neurons found in EM (C); the medial projection was found in 7/7 imaged pC1-A female brains, in both hemispheres. The pC1d and pC1e projections were not found in pC1-S imaged female brains (8/8 brains). The medial projection that is unique to the pC1c subtype was missing in all the 8 pC1-S flies we imaged - therefore, it is likely that pC1-S includes only pC1a and/or pC1b cells.
Figure 3—figure supplement 1
pC1 cells were identified in FlyWire based on morphology.
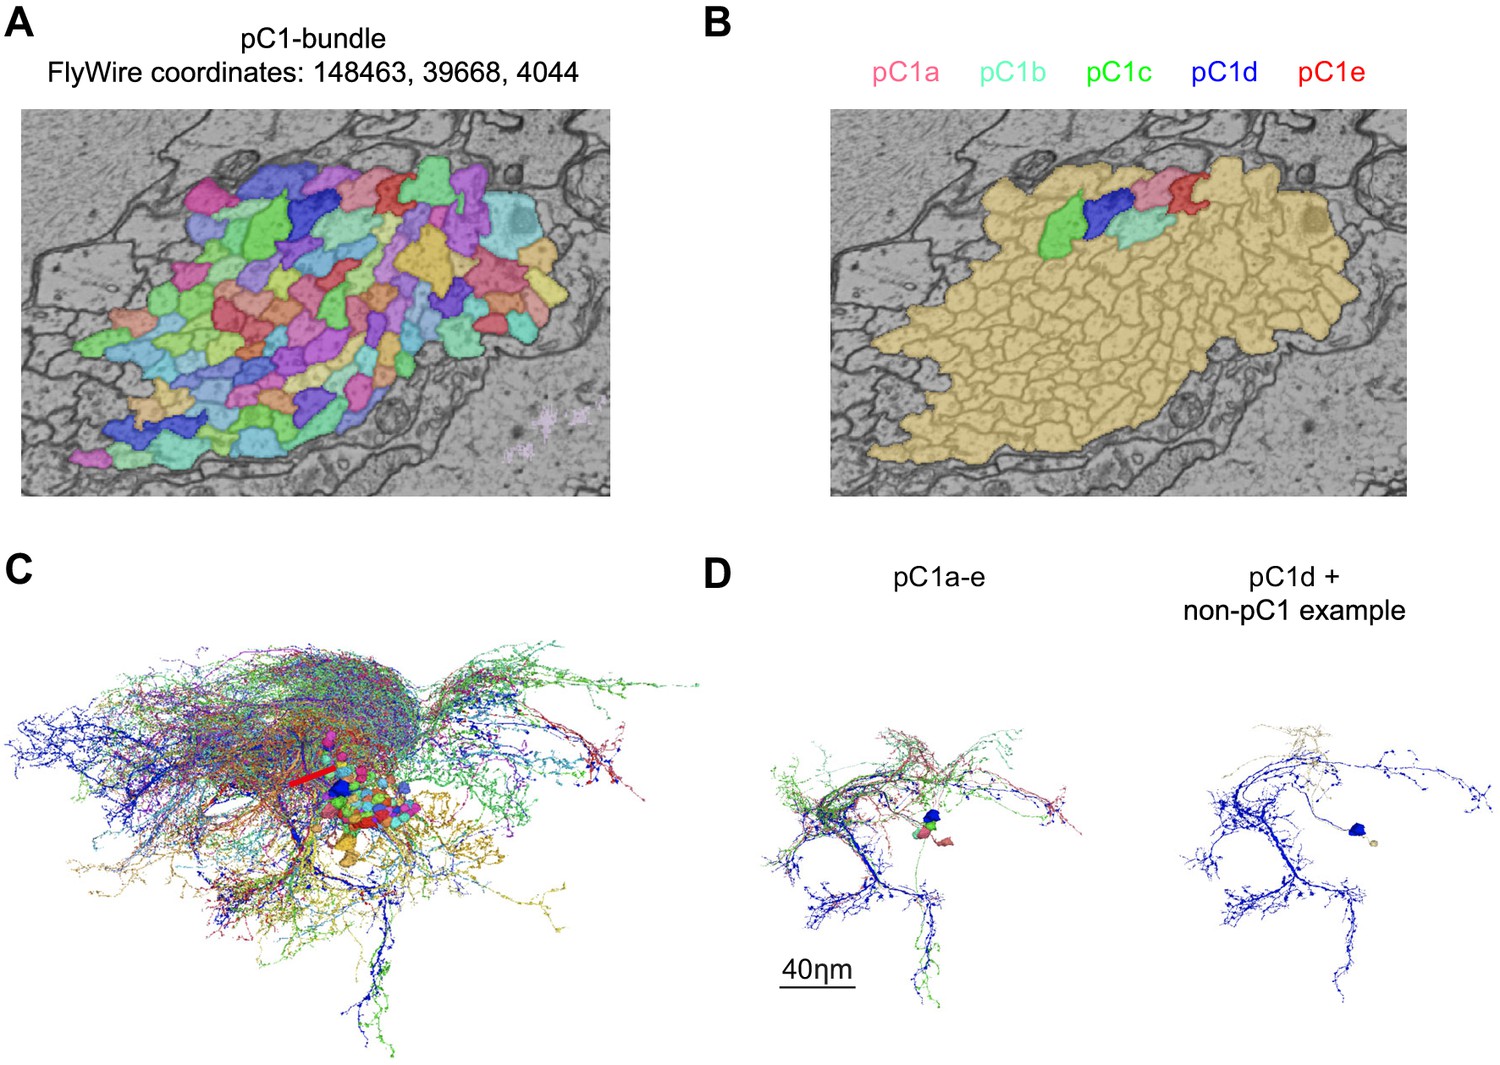
(A) Cross-section of left pC1-bundle. All segments passing through this cross-section or through another cross-section (separated by 140 slices, equal to 5.6 µm; FlyWire coordinates: 148388, 39874, 4080) were proofread. Similarly, two cross-sections were examined in the right hemisphere. Automatically reconstructed segments crossing any of these four cross-sections were proofread and then sorted based on morphology: segments that included a projection to the lateral junction were considered pC1 neurons. but neurons that passed through any of the cross sections, but did not project to the lateral junction (colored in brown) were not further analyzed. (B) Proofread neurons that pass through the cross-section in (A) and also project to the lateral junction. (C) All neurons that pass through the cross-section in (A). (D) Left: pC1a-e. Right: pC1d (shown for orientation) and the most common cell type of the cells that pass through the pC1 bundle, but do not project to the lateral junction.
Figure 3—figure supplement 2
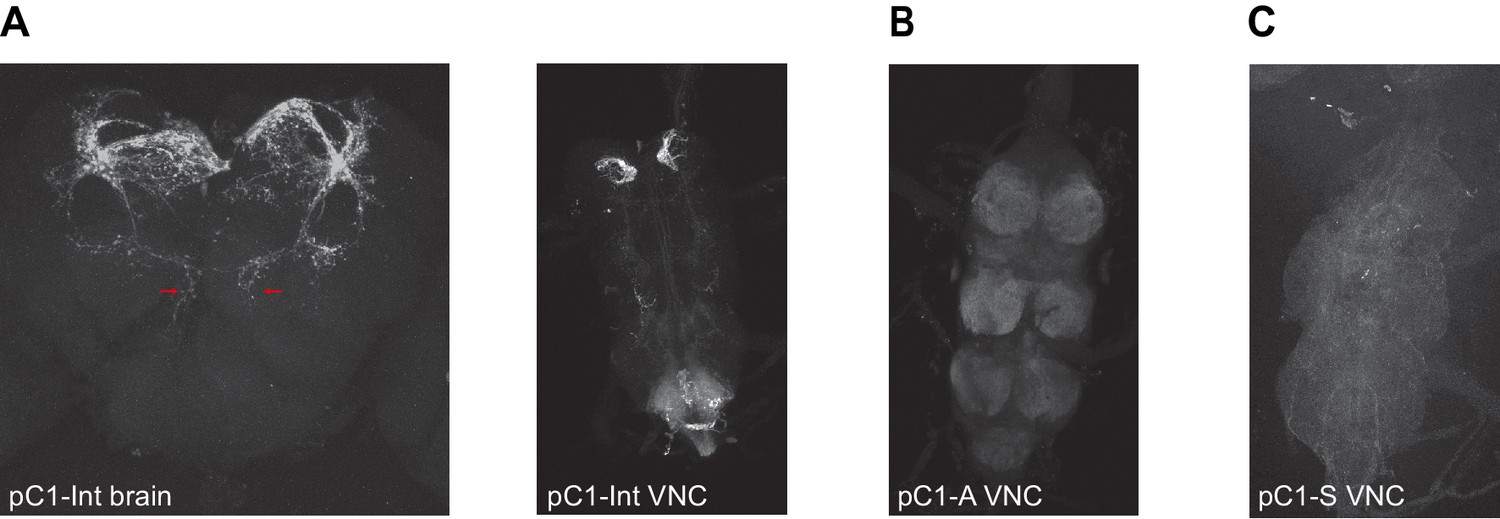
Expression of driver lines pC1-Int, pC1-A, and pC1-S.
(A) pC1-Int line expressing GFP (see Key Resources Table for full genotype). Left: A maximum z-projection is shown for the pC1-Int processes in the female brain. Red arrows mark the medial projections (left and right hemispheres) that exist in pC1d, but not in other pC1 cells types. Right: pC1-Int expression in the female VNC. (B) pC1-A line expressing GFP in the female VNC (see Key Resources Table for full genotype). (C) pC1-S line expressing GFP in the female VNC (see Key Resources Table for full genotype).
Figure 4 with 1 supplement
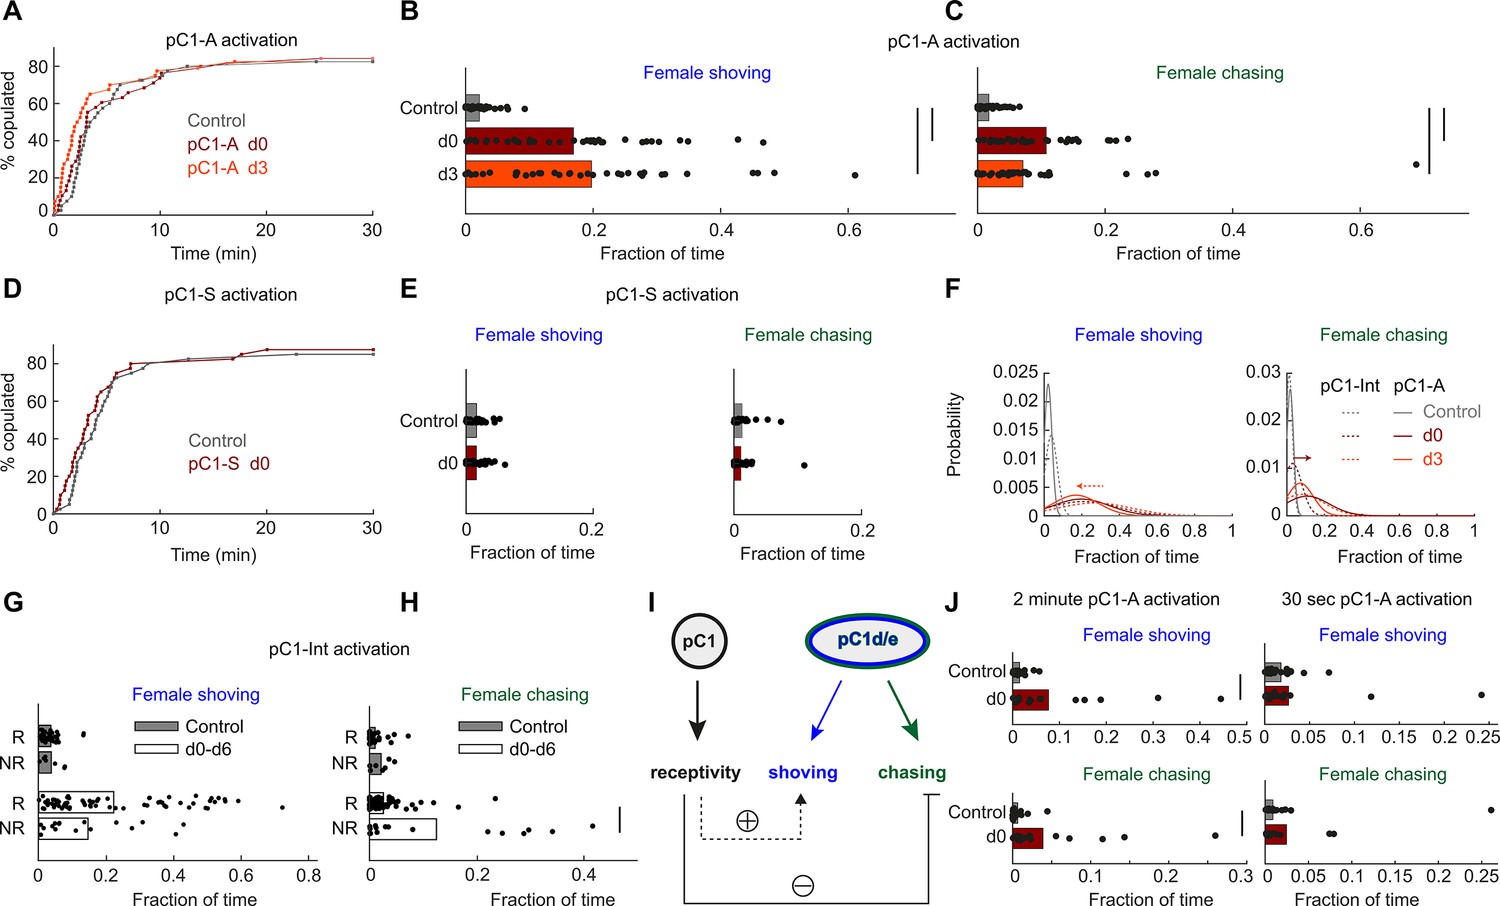
pC1d/e neurons drive female shoving and chasing, but do not affect receptivity.
(A) pC1-A activation did not affect copulation rates in either the d0 or d3 conditions (n = 40, 38, 40 for control/d0/d3; p=0.79 or 0.29 for control vs d0 or d3; Cox proportional hazards regression, see Materials and methods). (B, C) Shoving (B) and chasing (C) probabilities (control/do/d3: 0.02/0.17/0.20 and 0.018/0.11/0.07 for shoving and chasing) were significantly higher in both the d0 and d3 conditions compared to control (two-sample t-test; *p<0.05). (D–E) same as (A–C), but for pC1-S activation. pC1-S activation did not affect either copulation rate (D) or shoving or chasing (E) probabilities (control/do: 0.02/0.02 and 0.01/0.01 for shoving and chasing). (F) Probability distribution of the fraction of time the female spent shoving (left) or chasing (right) following pC1-A activation (solid line) or pC1-Int activation (dashed line). Arrows indicate the difference in peak shoving (at d3; two-sample t-test, p=0.11) or chasing (at d0; two-sample t-test, *p=4.5*10−4) probability, between pC1-Int and pC1-A activation. Bonferroni correction was used for multiple comparisons. (G) Fraction of frames with shoving for pairs in which females copulated (R - Receptive) or did not copulate (NR – Not Receptive) for all experimental conditions taken together (d0–d6). Each dot is a single pair, and the bar value is the mean over all pairs (p=0.92 and 0.13 for control and d0-d6). (H) Same as (G), for female chasing (p=0.13 and p<10−5 for control and d0-d6). (I) Female pC1d/e cells drive persistent shoving and chasing, but do not affect female receptivity. Female receptivity, controlled by a separate pC1 subset labeled in the pC1-Int line, suppresses female chasing, while possibly enhancing female shoving. (J) Shoving and chasing probabilities (control/d0: 0.077/0.015 and 0.039/0.006 for shoving and chasing; p=0.026 and 0.035; n = 20/20 for control/d0) were significantly higher in the d0 condition compared to control following 2 min of pC1-A activation, but not following 30 s (n = 20/21 for control/d0) of pC1-A activation (p=0.52 and p=0.24 for shoving and chasing).
Figure 4—figure supplement 1

Auditory responses in pC1d/e neurons recorded via whole-cell patch clamp.
(A) Left: Experimental setup. A sound tube (similar to Deutsch et al., 2019) was used to deliver sounds during patch clamp experiments. Middle: Image of the pC1-A driver line expressing GFP (see Key Resources Table), used to target pC1d/e cells in patch clamp experiments (arrows point to pC1d/e somas). Right: EM reconstructions of a single pC1d (blue) and a single pC1e cell (red) from FlyWire. (B) Example membrane voltage (Vm) traces of pC1d/e cells responding to pulse trains with different inter-pulse intervals (IPIs). Each trace is a recorded cell in a different individual. The stimulus pattern is shown below Vm traces. (C) Example response (top) to natural song (bottom). (D) Tuning of pC1d/e cells for IPI (left, n = 6 cells), sine frequency (middle, n = 3 cells), and white noise intensity (right, n = 3 cells) - each cell recording comes from a separate fly. The response was calculated as the baseline subtracted Vm integrated over the stimulus duration. Each individual curve corresponds to the trial-averaged responses of a pC1d/e cell from one individual and was normalized to peak at 1.0. IPI tuning is more variable across flies. (E) Comparison of response magnitudes to pulse, sine, and noise stimuli. Responses are normalized to the stimulus that drove the strongest response (n = 3 cells).
Figure 5 with 1 supplement
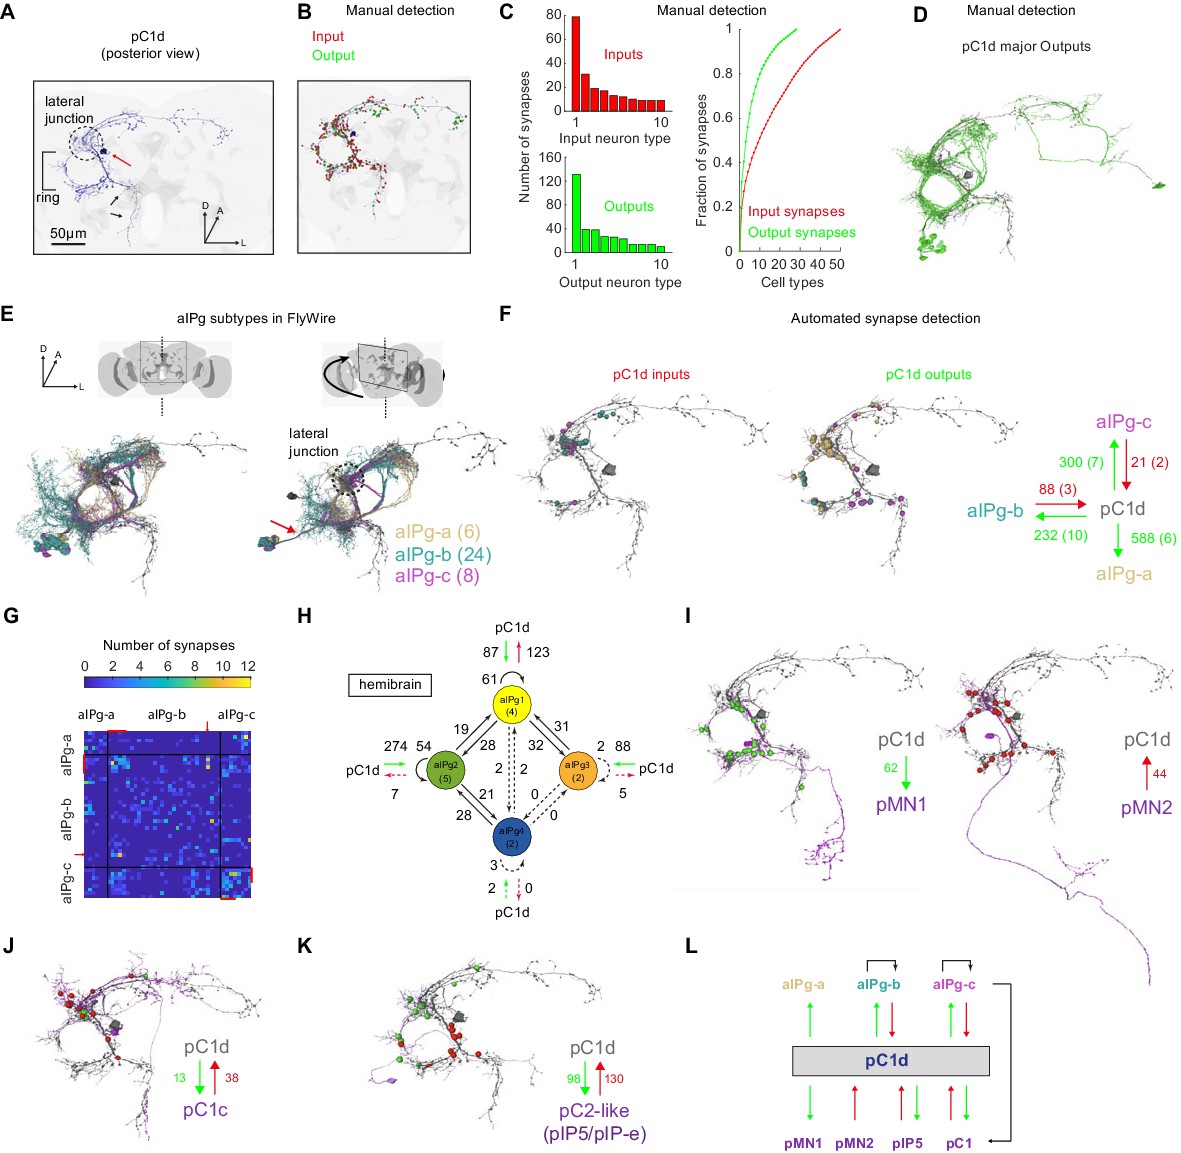
The connectome of pC1d reveals recurrent connections with aIPg neurons.
(A) The left pC1d cell (posterior view) reconstructed in FlyWire following automated segmentation and manual proofreading. The cell body is marked with a red arrow, and the pC1d long medial projection (that does not exist in other pC1 types) is marked with black arrows. (B) Same cell as in (A), with manually detected synapses. Neurons pre-synaptic (inputs to pC1d) are marked in red, and neurons post-synaptic (outputs of pC1d) in green. After excluding segments connected to pC1d with less than three synapses, we counted 417/421 manually-detected input/output synapses (see also Video 4). (C) Left: pC1d inputs (66 cells) and outputs (50 cells) were classified into cell types based on morphology. The number of input (top) or output (bottom) synapses are shown for each cell type, sorted (separately for inputs and outputs) based on the total number of synapses with pC1d for each type. Right: The cumulative fraction of synapses counted as a function of the number of cell types included (calculated separately for inputs/outputs). The three most common output types encompass 49.4% of all output synapses, while the three most common input types encompass 30.5% of all input synapses. (D) The cells that belong to the most common cell types (50% of all output synapses) are shown for pC1d output cells. Note that pC1d has postsynaptic connections with both left (ipsilateral to cells body) and right (contralateral) aIPg cells. (E) Left: Posterior view (same as in (A)) of pC1d (gray) and aIPg cells. Right: rotated view, showing the separation between three subtypes of aIPg cells (6/24/8 for aIPg-a/b/c), sorted according to their projections. See Table 1 for the full list of FlyWire detected aIPg cells in one hemisphere. (F) Synapses between pC1d (gray) and individual example aIPg cells, color coded by aIPg type as in (E). Total synapse count for each type is summarized. Synapses were detected automatically (Buhmann et al., 2019). Only cells with six synapses or more with pC1d are included in the analysis (See Materials and methods and Table 1 for more details). (G) Connection matrix between pairs of aIPg cells. The number of synapses (Buhmann et al., 2019) between a given pair of aIPg cells are indicated with a colorscale. Black lines separate aIPg subtypes. Red lines denote the aIPg cells that are reciprocally connected with pC1d (with si synapses or more each way), and red arrows indicate an aIPg-b cell that is reciprocally connected to cells that form reciprocal connections with pC1d. (H) The number of synapses within and between groups of aIPg cells based on the fly hemibrain connectome (Scheffer et al., 2020). The number in parentheses indicates the number of cells per group (aIPg-1–4). Round arrows indicate within-group connections (e.g. 61 synaptic connections between pairs of aIPg-1 cells). Dotted arrows are shown for weak connections (under five synapses). (I) pC1d connections with Dsx+ pMN1 and Dsx+ pMN2 cells. (J) An example Dsx+pC1 cell (type pC1c) that is recurrently connected to pC1d. (K) pC1d connections with pC2-like cells (with similar morphology as hemibrain pIP5 neurons or Fru+ pIP-e clones from Cachero et al., 2010). (L) pC1d is a hub connecting Dsx+ or Fru+ pC1, pIP5, pMN1, and pMN2 neurons with Fru+ aIPg neurons.
Figure 5—figure supplement 1
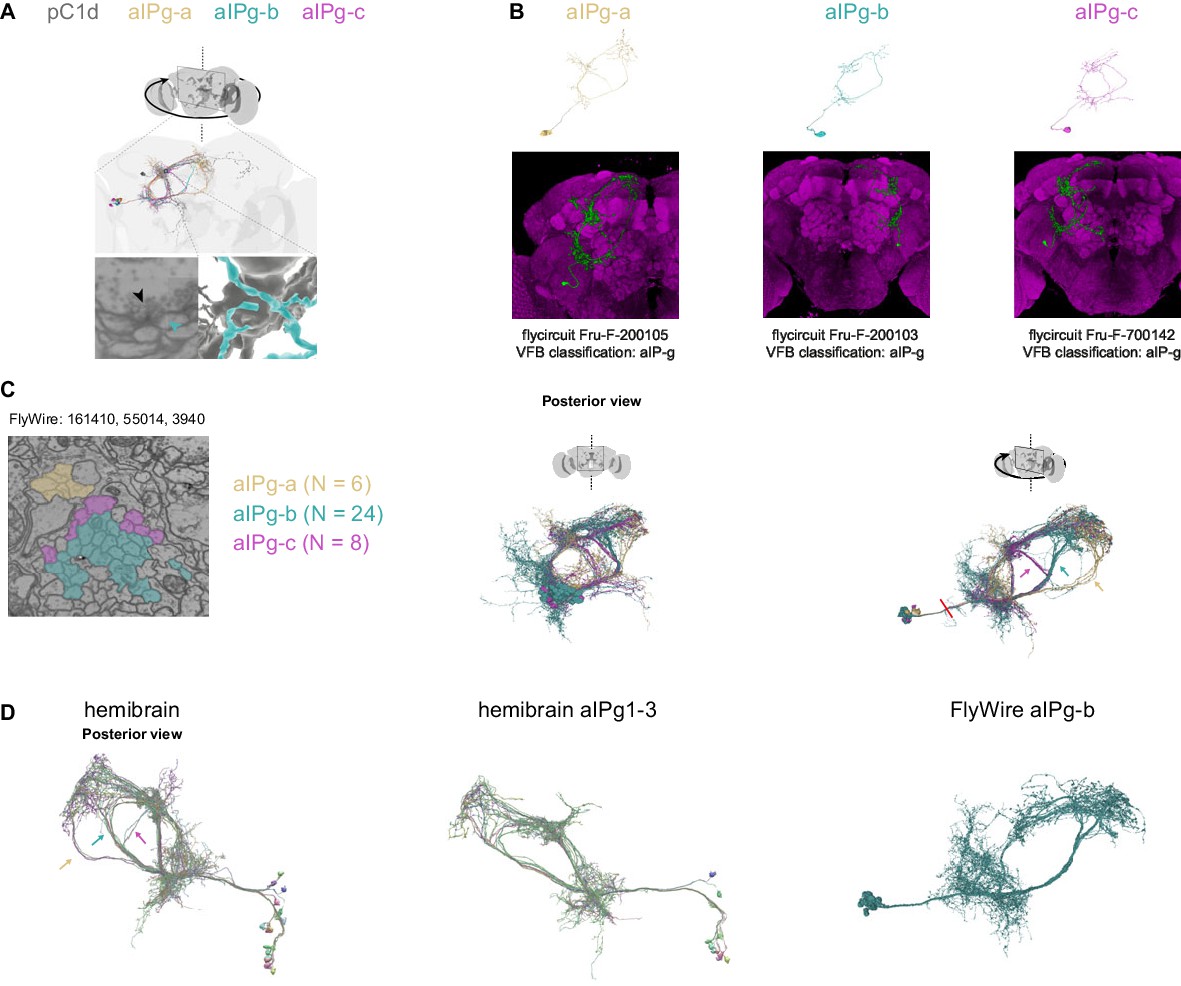
Comparison of aIPg cells identified in FlyWire and Hemibrain.
(A) Example synapse between pC1d and postsynaptic aIPg-b. (B) Top: Example aIPg neurons, one of each type - aIPg-a,b,c from FlyWire (following proofreading). Bottom: Fru+ clones (from http://www.flycircuit.tw/)with similar morphology to aIPg cell types found in FlyWire. These cells were classified as aIP-g in VFB (virtualflybrain.org), following Cachero et al., 2010. (C) Left: A cross-section of the bundle that connects the aIPg cell bodies with their processes (FlyWire coordinate: 160515, 53776, 3390). We checked two cross-sections in the left hemisphere for aIPg cell types (second cross-section FlyWire coordinate: 161278, 55953, 4590). Right: Right: aIPg cells shown in posterior and rotated views. Red line marks the cross-section shown at left. Arrows mark the aIPg-a,b,c projections.(D) Left: Hemibrain (version 1.1) cells that share morphology with aIPg-a (SMP555/556; yellow arrow), aIPg-b (aIPg1-3 and 1 aIPg4; cyan arrow), and aIPg-c (SMP558 and a single aIPg4 cell). Middle: All cells labeled aIPg1-3 in the hemibrain (n = 11). Right: aIPg-b cells in FlyWire, shown in the same orientation as the middle panel. The same FlyWire aIPg-b cells are presented in (C) and (D).
Figure 6 with 1 supplement

pC1d synaptic partners based on automated synapse detection in FlyWire.
(A) The top (≥80 synapses) pC1d inputs (left) and outputs (right). The number of pC1d presynaptic (input) and postsynaptic (output) connections are shown in red/green. The number of input or output cells that are connected to pC1d with six synapses or more (see Materials and methods) are indicated in the purple circles. Cells with shared morphology were identified in hemibrain v1.1 (names shown in blue) for each cell type. As the number of synapses is counted per type and only for cells with six synapses or more, separately for the inputs and outputs, the numbers between the left and right plots do not necessarily match (see Table 1 for more details). (B) Example cells that are connected to pC1d. pC1d_In8 synapses onto pC1d on a branch ipsilateral to pC1d soma, but pC1d_In8 has its soma and dendrites in the contralateral hemisphere. pC1d_Out6 connects to pC1d on a branch contralateral to the pC1d soma. (C) Example pC1d input or output cells in FlyWire, compared to similar cells in the hemibrain v1.1.
Figure 6—figure supplement 1
pC1e synaptic partners based on automated synapse detection in FlyWire.
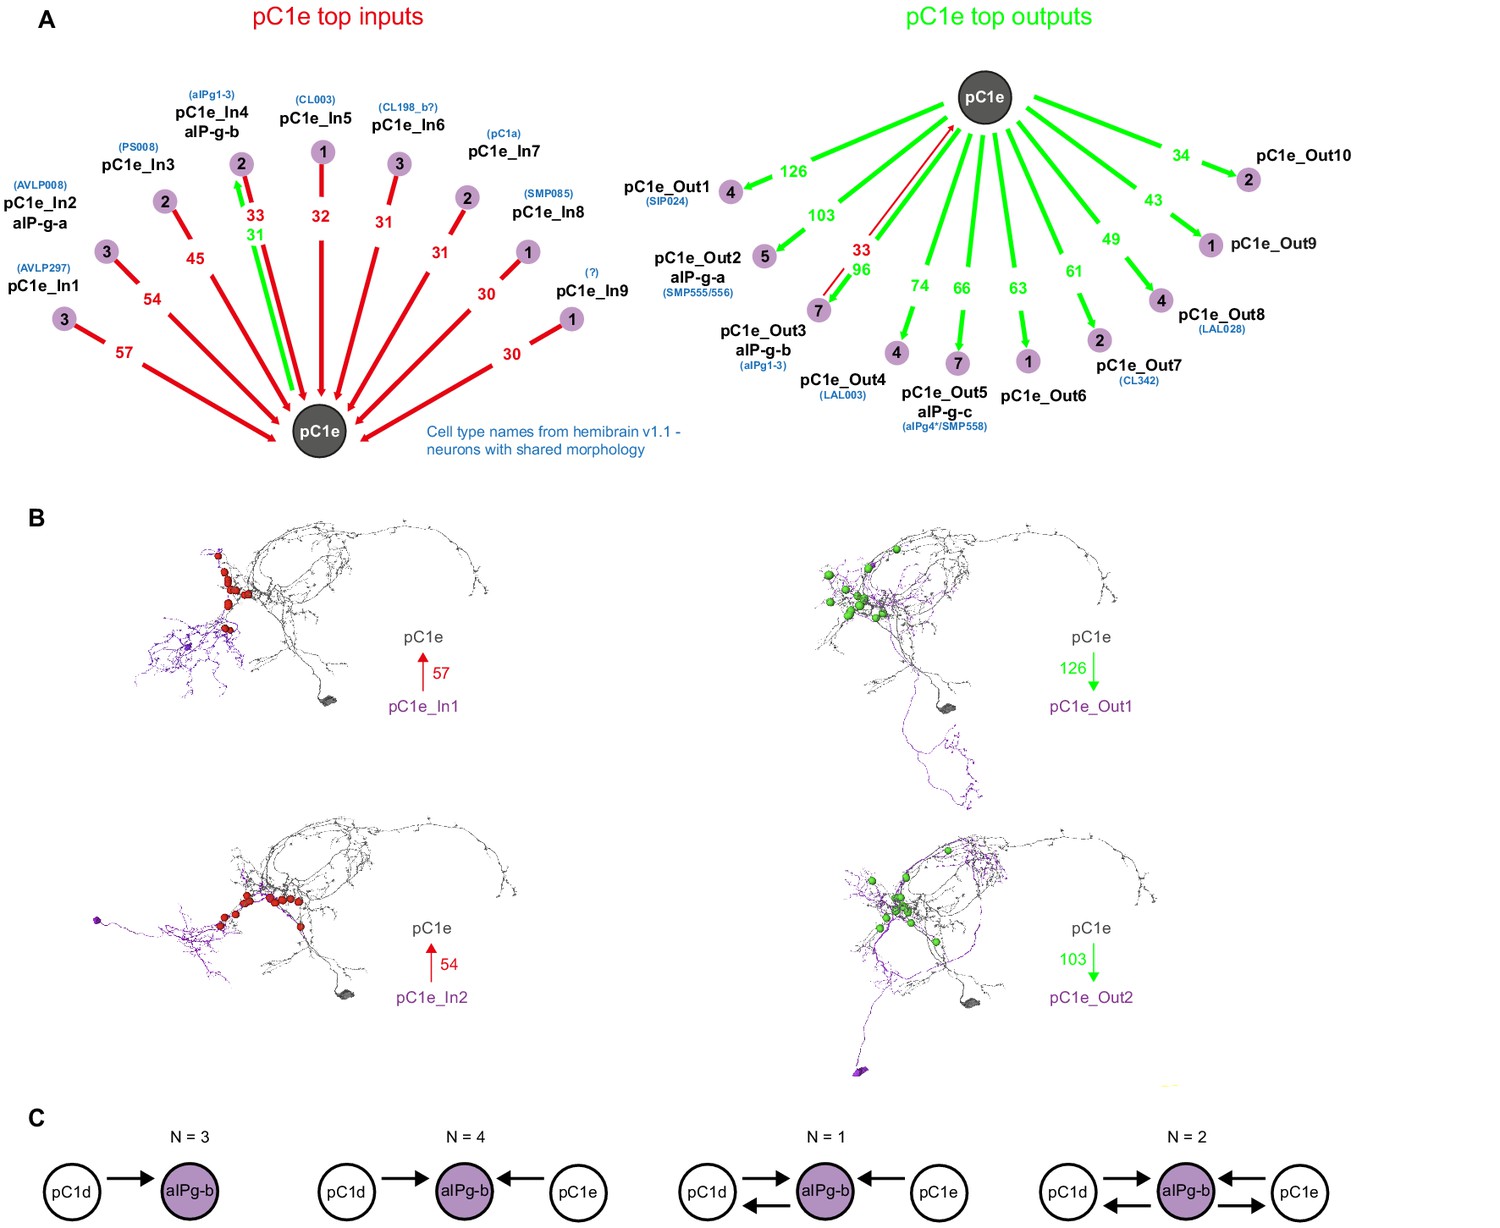
(A) The top (≥30 synapses) pC1e inputs (left) and outputs (right). The number of pC1e presynaptic (input) and postsynaptic (output) connections are shown in red/green. The number of input or output cells that are connected to pC1d with six synapses or more (see Materials and methods) are indicated in the purple circles. Cells with similar morphology were identified in hemibrain v1.1 (names shown in blue) for some of the cell types. (B) Top two input and top two output types (judged by number of synapses) that are connected to pC1e. (C) 10 aIPg-b cells that get inputs from pC1d were sorted based on their synaptic connectivity with both pC1d and pC1e (one pC1d and one pC1e cell, both in the left hemisphere in posterior view). 7 out of the 10 aIP-g cells that are pC1d synaptic partners, also synapse with pC1e.
Figure 7 with 1 supplement
pC1d/e neurons drive persistent neural activity in the central brain.
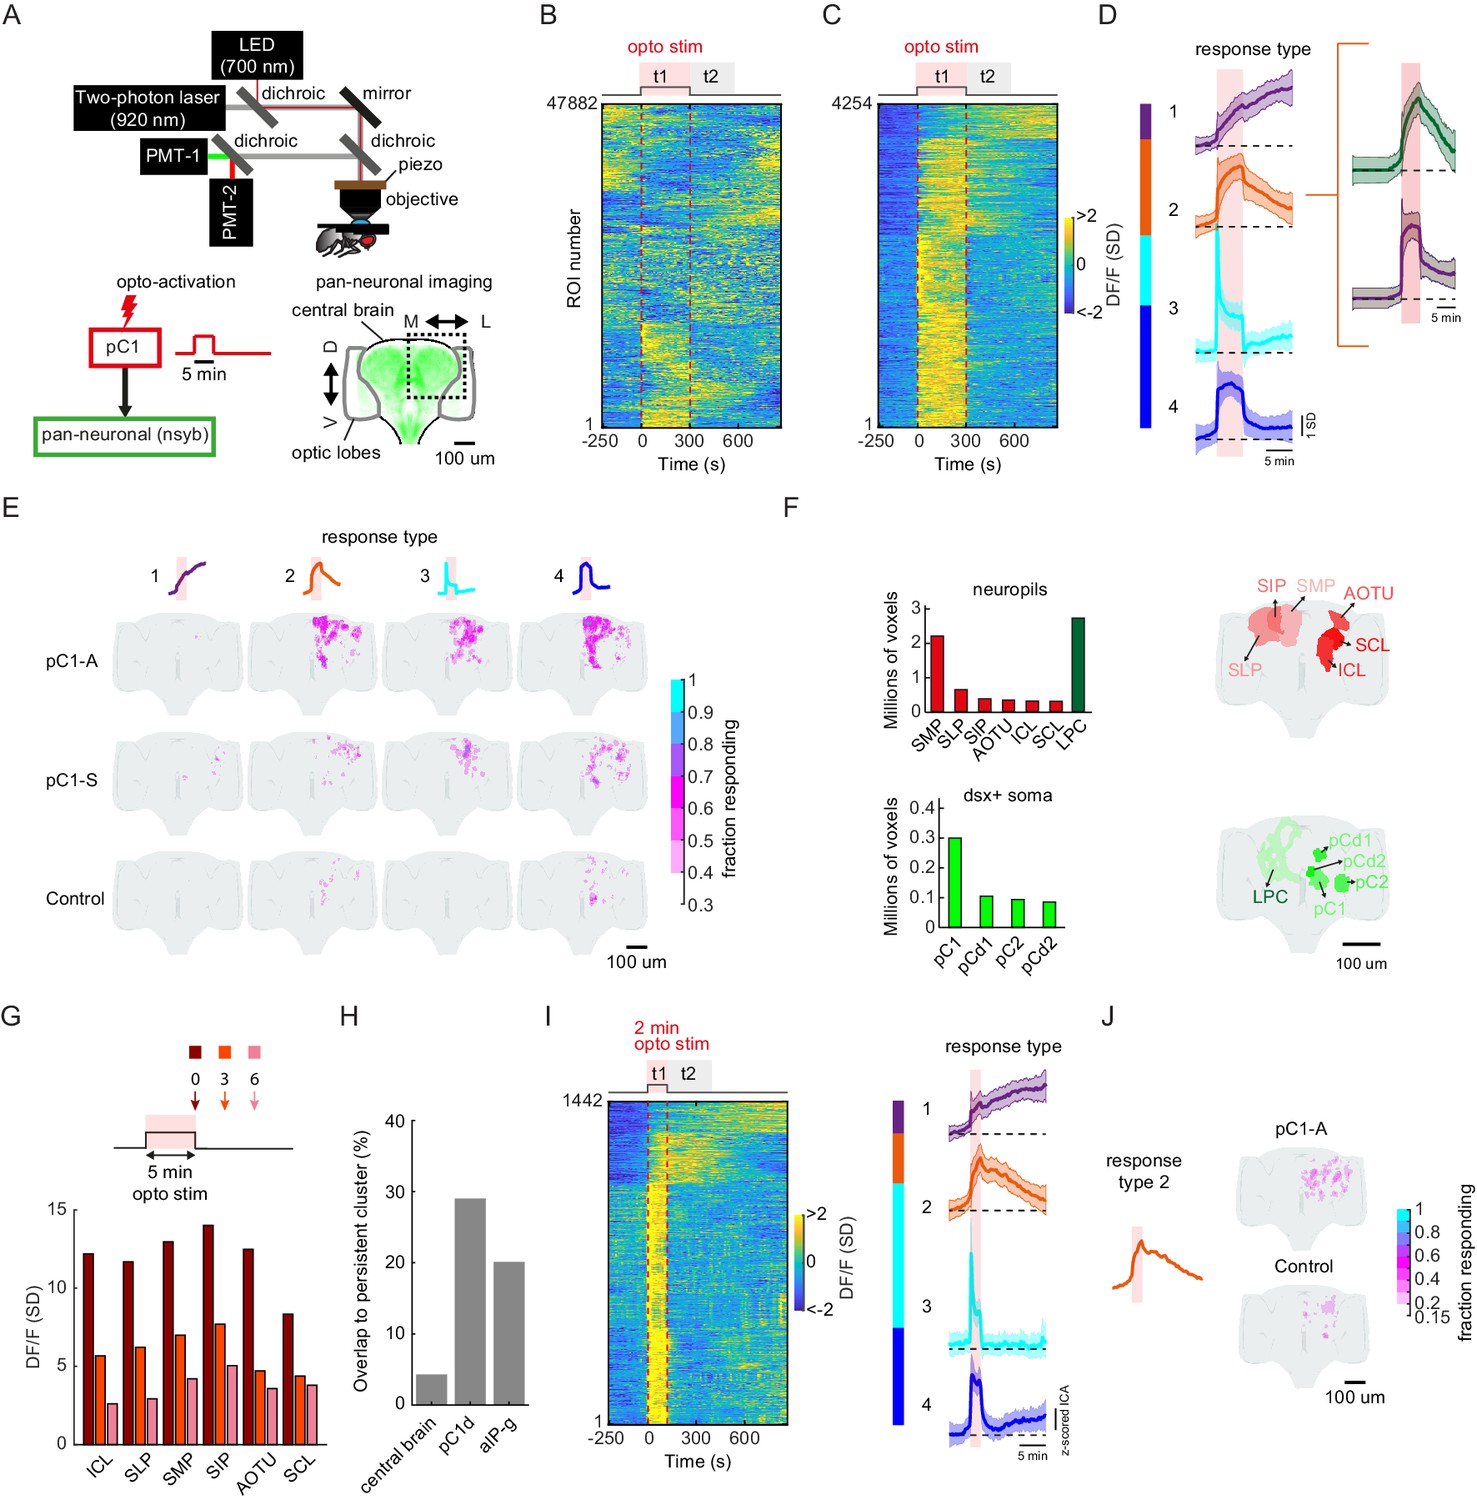
(A) Experimental setup. pC1 cells (pC1-A or pC1-S) expressing csChrimson were activated through the objective using an LED (700 nm). GCaMP6s and tdTomato were expressed pan-neuronally using the nsyb driver, and a custom-designed two-photon microscope was used to image brain activity before, during and after pC1 activation (see Key Resources Table for genotypes and Materials and methods for more details on the experimental setup). (B) Brain activity recorded in response to optogenetic stimuli (n = 28 flies, all genotypes). GCaMP6s signal was motion corrected and 3D-ROI segmented based on correlated activity in neighboring voxels (see Materials and methods). The z-scored signal of all ROIs (n = 47882 ROIs from both pC1-S and pC1-A activation and control experiments) are plotted in units of standard deviations (see scale bar), and shown 5 min before activation, during activation (t1), and 9.5 min post-activation (t2 marks the first 5 min post-activation). Red dashed line depicts the optogenetic stimulus onset and offset. (C) pC1 activation evokes both transient and persistent activity. Subset of ROIs from panel (B) were selected based on mean z-scored activity during (t1) and after photoactivation (t2), and ROIs were sorted by hierarchical clustering of temporal dynamics. We found 4254 responsive ROIs, defined as ROIs with Ft1 > 3σo (σo - standard deviation during baseline, Ft1 is the mean fluorescence during t1), including transient (Ft2 ≤ 3σo, blue and cyan; Ft2 is the mean fluorescence during t2) or persistent (Ft2 >3σo, orange and purple) response types . (D) Mean ± SD for response types 1–4. In response types 1 and 2, the activity level (calcium response) persists after activation offset, while for types 3 and 4, the activity is high during, but not after photoactivation. The two major sub-clusters of response type 2 are shown at right. (E) Maps of transient and persistent activity types. ROIs from response types 1–4 per animal were registered to an in vivo intersex atlas (Pacheco et al., 2021) to generate probability density maps across animals per brain voxel (each voxel is 0.75 × 0.75 × 1 µm3). Activity maps are maximum-projected along the anterior-posterior axis, and overlaid onto the brain template, color coded by the fraction of flies showing activity at each voxel (ranging from 30% to 100%). We considered a voxel to consistently have a particular response type if active in over 30% of flies. Response type 2 shows persistent activity following pC1-A activation, and occupies 4.3% of the volume imaged, compared with 0.6% following pC1-S and 0.2% in control flies. (F) Brain regions containing persistent responses (type 2). We used both anatomical segmentation of the in vivo brain atlas (Pacheco et al., 2021) and segmentation of the Dsx+ circuit (also registered to the same atlas) into processes in the LPC and major groups of cell bodies (pC1, pC2, pCd1, pCd2) to assign ROIs to neuropils (red) or overlap with Dsx+ neurons (green). For each of these regions, we calculated the average number of voxels or volume (across-individuals) occupied by all ROIs belonging to response type 2, following pC1-A activation. Neuropils were sorted by the number of voxels, and the top six neuropils are shown. pC2m and pC2l are shown together as pC2, as they are not always spatially separable in females. For responses in other conditions (pC1-S, control) and other neuropils see Figure 7—figure supplement 1A. (G) Mean response (DF/F) over all flies and ROIs per brain neuropil from (F), at t = 0 (stimulus offset), t = 3 min and t = 6 min. Time points relative to stimulus are shown in arrows in the schematic. Each ROI's activity was z-scored relative to the baseline; therefore, DF/F units are plotted in standard deviation (SD) relative to baseline activity. (H) The percent of voxels that belong to the persistent cluster (response type 2) out of the volume imaged in the central brain (4.3%), out of the voxels that include pC1d (29.04%), or out of the voxels that include aIPg cells (20.14%); see Materials and methods – pC1d and aIPg neurons from FlyWire were registered into the in vivo atlas for comparisons. (I) Shorter duration (2 min) pC1-A activation also evokes both transient and persistent activity. ROIs for both control and pC1-A activation (using the same criteria as in (C)) could also be clustered into four response types (purple, orange, blue, and cyan) similar to (D). (J) Map of persistent activity type 2 upon 2 min pC1-A stimulation.
Figure 7—figure supplement 1
Characterizing neural activity following pC1-A activation.
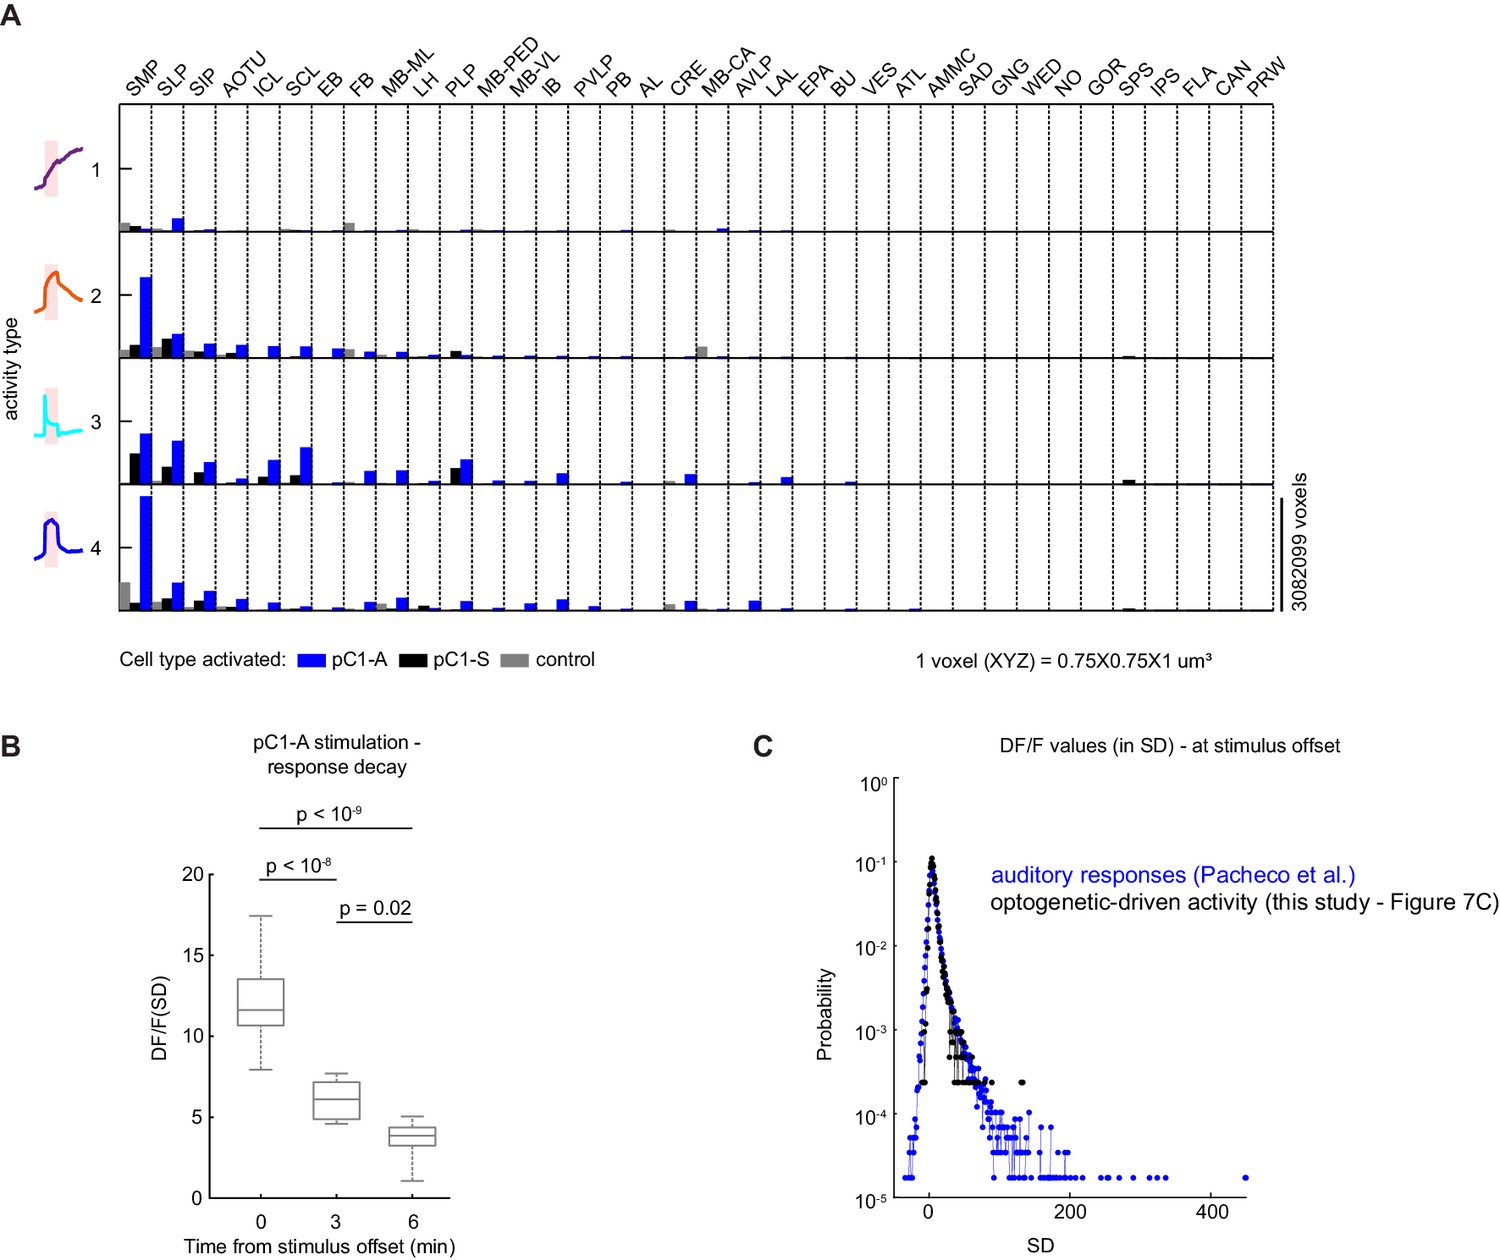
(A) Average number of voxels occupied by all ROIs belonging to each response type (as in Figure 7F) across all 36 central brain neuropils for each condition (pC1-A or pC1-S activation, or controls), sorted from left to right by the amount of response type 2 following pC1-A activation. (B) Distribution of mean ROIs' response (DF/F) per flies at t = 0 (stimulus offset), t = 3 min, and t = 6 min from response type 2 (see Figure 7D) for pC1-A activation. Each ROI's activity was z-scored relative to the baseline; therefore, DF/F units are plotted in standard deviation (SD) relative to baseline activity. p-values: one-way ANOVA with Bonferroni corrections. (C) Sensory-evoked versus optogenetically-evoked responses. Distribution of neural responses to pulse, sine, or white noise auditory stimuli at t0 (auditory stimulus offset) form all auditory ROIs (n = 33 flies, 19,036 ROIs; see Pacheco et al., 2021) - blue, compared with optogenetically-evoked responses at t0 (light offset) for ROIs with either transient or persistent activity - black (data from Figure 7C). Responses were z-scored relative to the baseline; therefore DF/F units are plotted in standard deviation (SD) relative to baseline activity (baseline = −8 to −0.5 s before auditory stimulus onset and −245 to −5 s for before optogenetic light onset).
Figure 8 with 2 supplements
pC1d/e neurons drive persistent neural activity in Dsx+ and Fru+ cells.
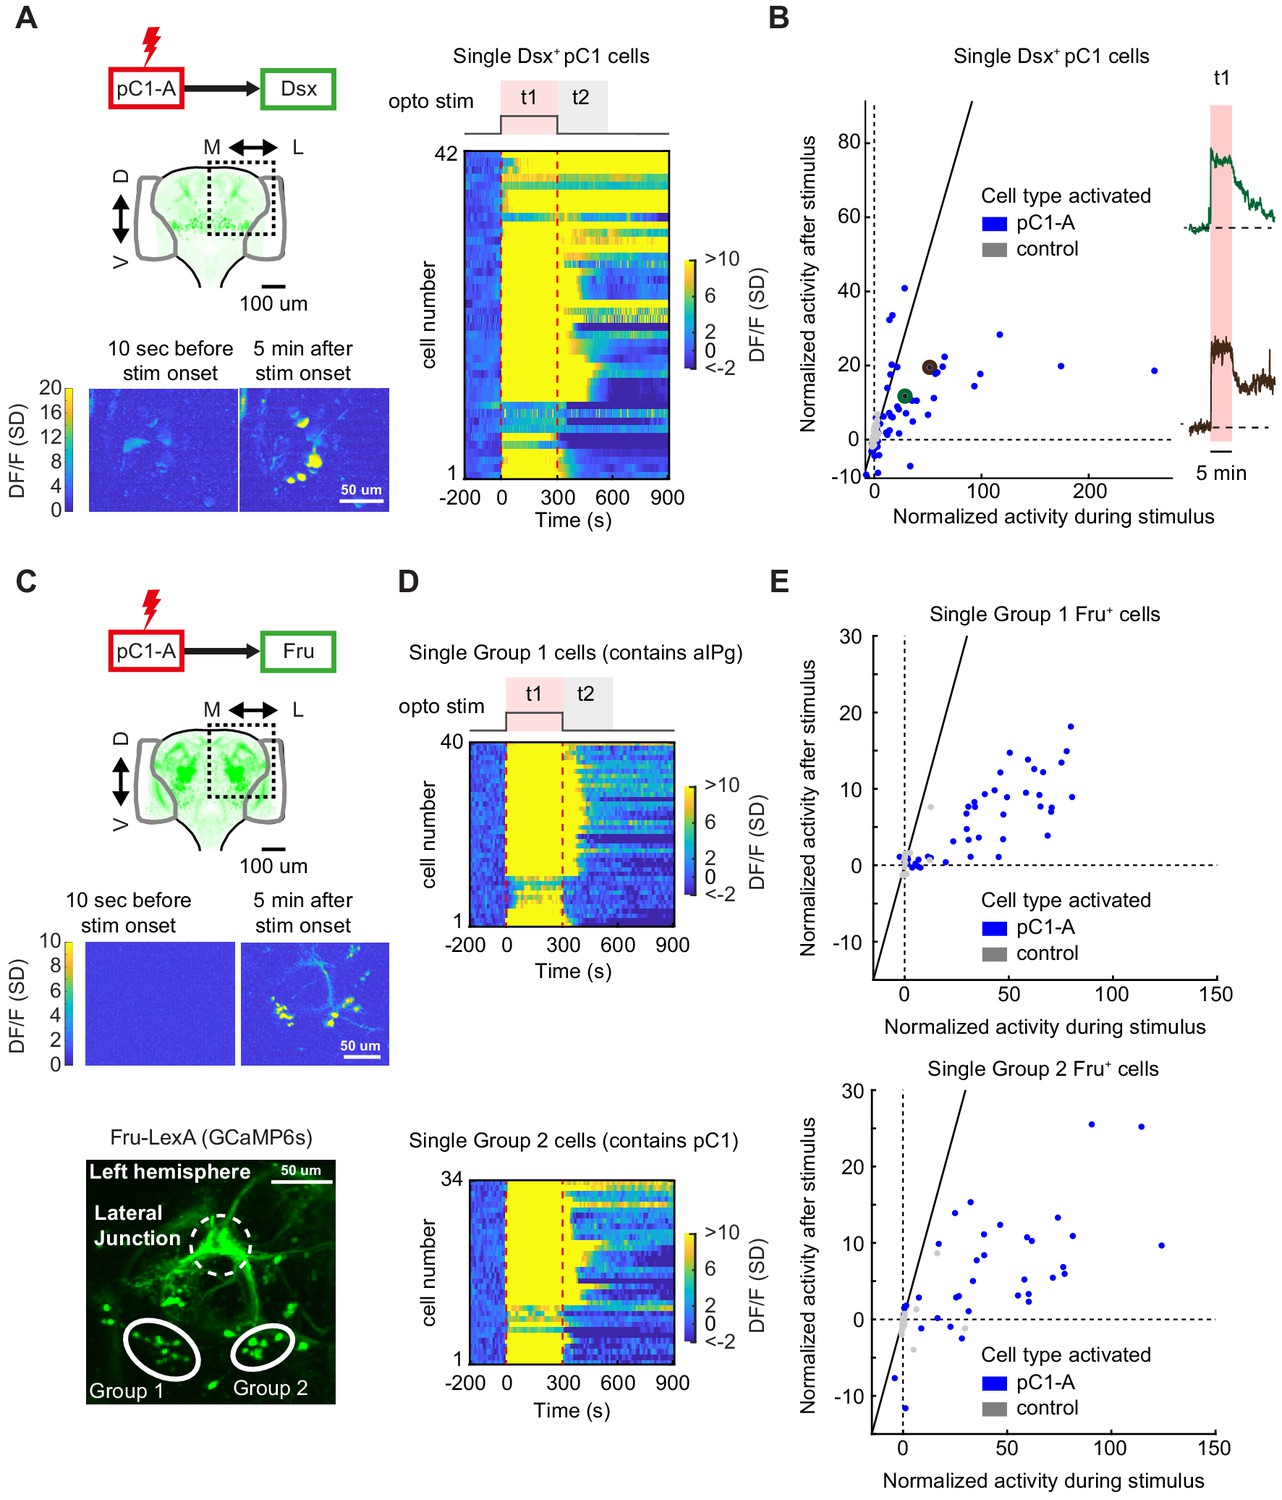
(A) Left: Activation of neurons in the pC1-A line and imaging of neural activity in all Dsx+ cell bodies. Activity in Dsx+ pC1 somas is shown 10 s before stimulus onset and 5 min after stimulus onset for an example experiment. Right: Normalized activity of Dsx+ pC1 somas ((F(t) - F0)/σo; F0 and F(t) are mean Fluorescence during baseline and fluorescence over time, respectively). Chrimson and TdTomato are expressed in pC1-A cells. GCaMP6s is expressed in Dsx+ cells. pC1 somas imaged following pC1-A activation (along with controls) are both shown if Ft1 > 3σo (σo - standard deviation during baseline, Ft1 is the mean fluorescence during t1) (see (B) for full set of imaged pC1 neurons). (B) Left: Mean Calcium response in Dsx+ pC1 somas during t1 (x-axis) versus during t2 (y-axis) for pC1-A activation and control. Normalized activity is defined as (F - Fo)/σo, where Fo is the mean activity during baseline, σo is the standard deviation during baseline, and F is the mean activity during t1 for x and t2 for y. Each dot represents a single segmented soma. Dots above the dashed line represent persistent responses following activation. All imaged pC1 neurons are shown (n = 8 flies, 58 ROIs for pC1-A, n = 5 flies, 25 ROIs for controls). Right: Example traces of (F - Fo)/Fo from two individual pC1 cells, showing different response decays after stimulus offset (matching the results from Figure 7D). Corresponding points are enlarged and marked in green and purple in B (left). (C) Top: Activation of neurons in the pC1-A line and imaging of neural activity in Fru+ cell bodies. Bottom: Spatial pattern of Fru+ cell bodies imaged (here, a left hemibrain is shown (Z-projection of Fru+ neurons expressing GCaMP6s)). Fru+ cell body groups 1 and 2 are defined based on their spatial location - group 1 likely contains Fru+ pC2 and aIPg neuronal cell bodies, whereas group 2 likely contains Fru+ pC1 cell bodies (Figure 8—figure supplement 2). (D) Normalized activity of Fru+ somas from group 1 (Top) or group 2 (Bottom). (E) Mean activity in Fru+ cell bodies from group 1 (left, n = 9 flies, 46 ROIs for pC1-A, n = 5 flies, 13 ROIs for control) and group 2 (right, n = 9 flies, 37 ROIs for pC1-A, n = 5 flies, 24 ROIs for control) during t1 (x-axis) versus during t2 (y-axis) following pC1-A activation and in controls (see Key Resources Table for full genotypes). Data were analyzed and plotted as in (B). Dots above the dashed line represent persistent responses following activation.
Figure 8—figure supplement 1
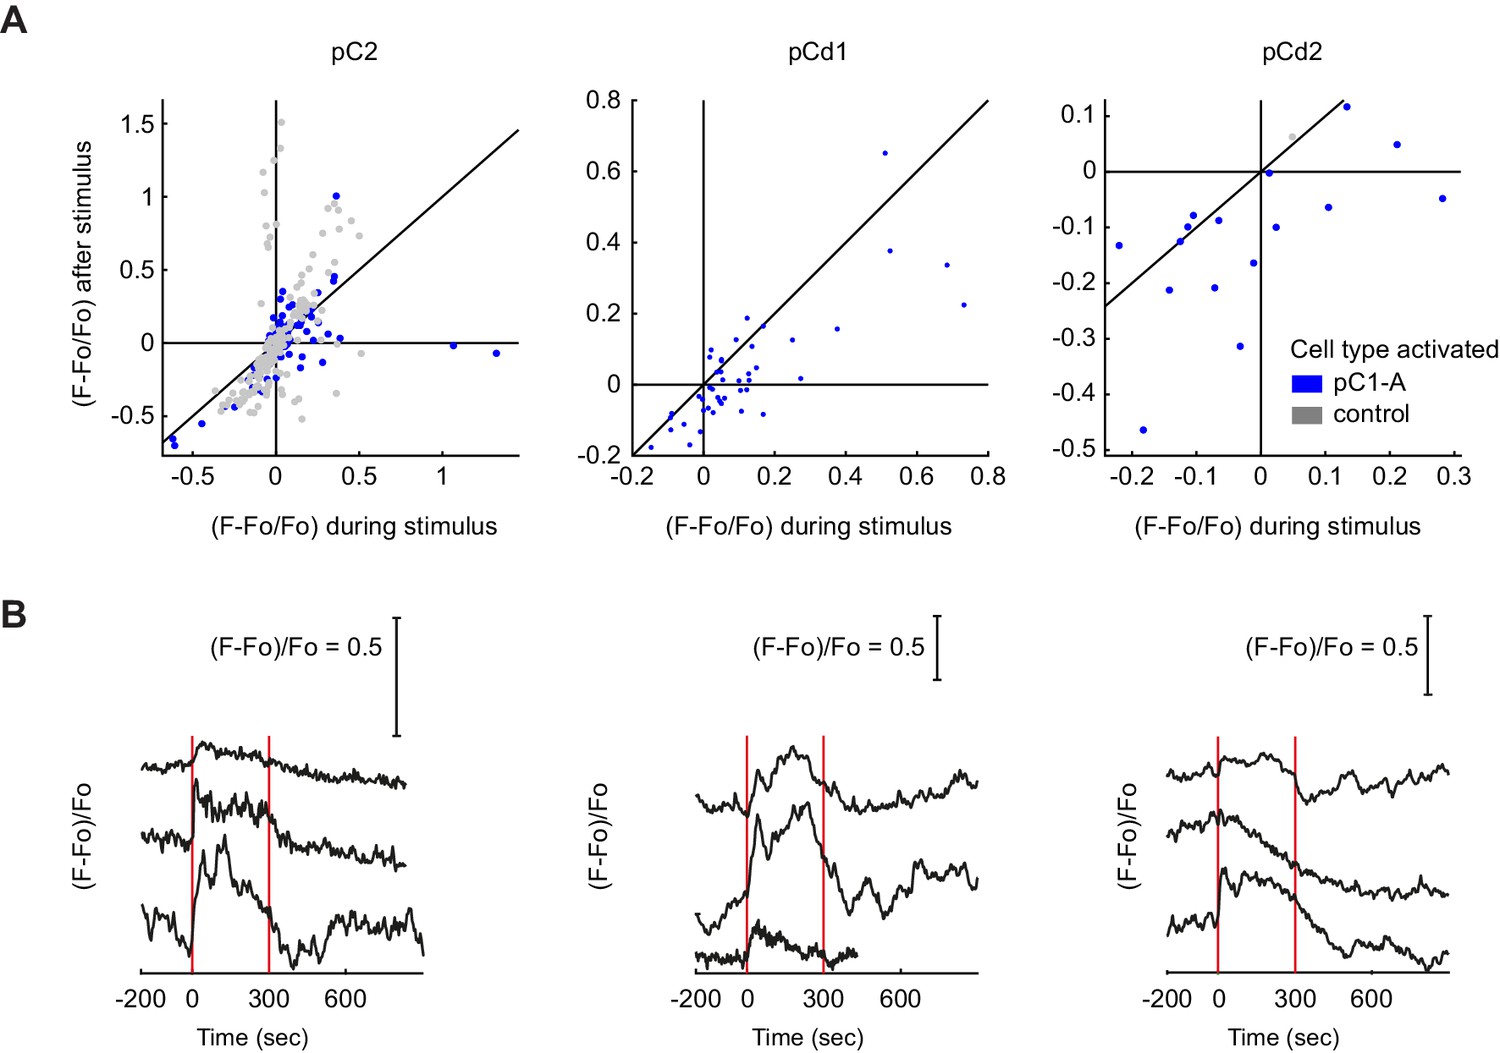
Responses in Dsx+ pC2, pCd1 and pCd2 cells following pC1-A stimulation.
(A) Mean calcium responses during (x-axis) versus after (y-axis) optogenetic stimulus as in Figure 6J for the following Dsx+ cell types: pC2 (n = 12 flies, 154 ROIs for pC1-A, n = 8 flies, 166 ROIs for controls), pCd1 (n = 5 flies, 44 ROIs for pC1-A), and pCd2 (n = 3 flies, 16 ROIs for pC1-A, n = 1 flies, 1 ROIs for controls). Activity units are in (F - Fo)/Fo, where Fo is the mean activity during baseline, and F is the mean activity during or after for x and y axes, respectively. Each dot represents a single cell, and dot colors refer to different conditions (pC1-A activation and controls). (B) Example traces of pC2, pCd1, and pCd2 cells with stimulus-locked transient responses. In some cases, a transient response was locked to stimulus onset.
Figure 8—figure supplement 2
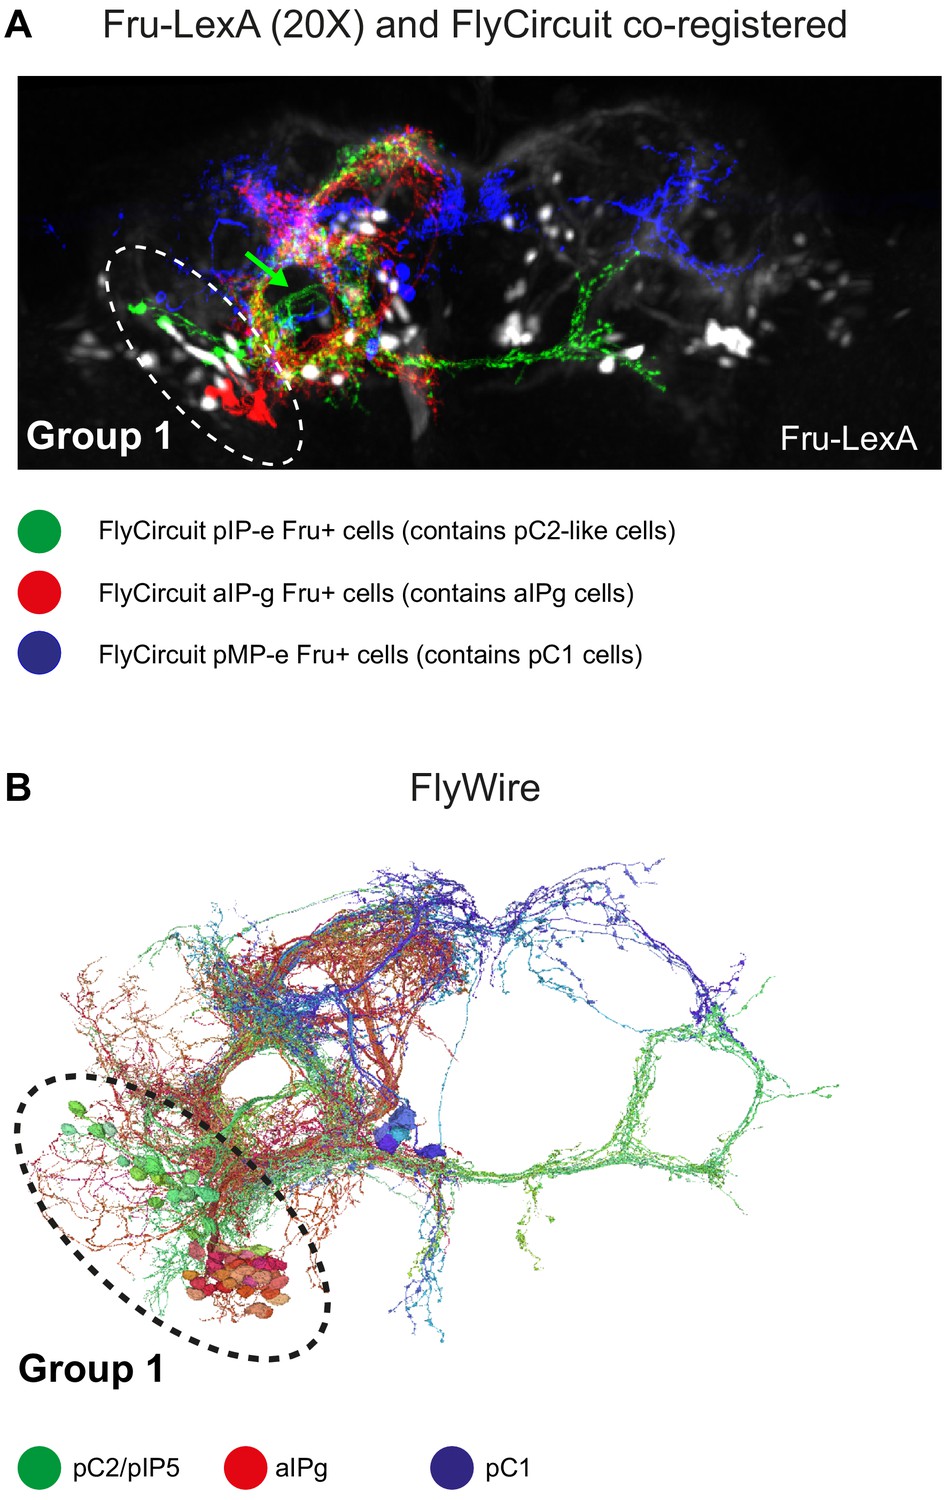
Delineating Fru+ cells in Group 1.
(A) Z-projection of Fru+ neurons (Fru-LexA driving GCaMP6s) from fixed brain (black and white) and Fru+ single neurons that were downloaded from virtualflybrain.org (source: FlyCircuit; Single-cell clones from adult female brains [Cachero et al., 2010]) co-registered to JFRC2 atlas. pC1-like (blue, n = 6; classification: adult female pMP-e), pC2-like (green, n = 6; classification: adult female fruitless pIP-e), and aIP-g (red, n = 6; classification: adult female fruitless aIP-g). Fru+ group 1 cells (using the fru-LexA driver) overlap with registered single clones of pC1-like (pMP-e) and pC2-like (pIP-e) cells. (B) pC1 (blue), pC2/pIP5 (green), and aIPg (red) cells in FlyWire.
Videos
Video 1
Confidence maps (head in blue, thorax in orange) and part affinity vector fields (white arrows) calculated using LEAP (Pereira et al., 2019) for the male and female.
The male has a white painted dot on his back. Male chasing and singing are shown, as well as female shoving. Movie is slowed down four times.
Video 2
A sequence of female shoving and chasing.
The female shoves the male while occasionally extending one or two wings, and then chases the male while occasionally extending a single wing or contacting the male with her front legs. Finally, the male attempts to copulate, the female spreads her wings, and copulation occurs. Movie is in real time. Experimental condition: pC1-Int, d0.
Video 3
Multiple example behaviors: female approaching (Figure 2—figure supplement 3A), shoving and circling (Figure 2—figure supplement 3B), female headbutting and female mounting (Figure 2—figure supplement 3C).
Following female approaching in this example, there is a short epoch of circling. In the ‘shoving and circling’ example, the female shoves the male before a circling behavior starts (See Figure 2—figure supplement 3B, inset). In the female headbutting example, the female extends two wings while headbutting the male, followed by a male jump. In the ‘female mounting’ example, the female positions herself behind the male and climbs on his back. Circling and headbutting examples are from pC1-Int (d0) condition, and female approaching/mounting from pC1-Int (d3) condition.
Video 4
A single pC1d neuron, automatically traced and manually proofread.
Inputs (post-synaptic terminals, manual detection) are shown in red, outputs (pre-synaptic terminals, manual detection) in green (see also Figure 5A–B).
Video 5
pCd (blue) is shown with example aIPg-a,b,c cells.
Synapses (detected manually) are marked in red for inputs (to pC1d) and in green for outputs. Cell type colors (yellow, cyan, magenta) are shown for aIPg-a,b,c as in Figure 5E–F and Figure 5—figure supplement 1.
Video 6
pC1d (blue) is shown with neurons that have a similar morphology as known female Doublesex-expressing cells.
Video 7
Maximum z-projection (60 μm in Z) of the calcium response in a female expressing GCaMP6s pan-neuronally.
Calcium response ((F(t) -Fo/Fo), color coded) is shown 5 min before, 5 min during and 9.5 min after pC1-A activation (using csChrimson). The movie is sped up 20 times.
Video 8
Maximum Z-projection of the calcium response in a female expressing GCaMP6s in Dsx+ cells.
pC1 cells in the left hemisphere are shown. Calcium level ((F(t) -Fo/Fo), color coded) is shown 5 min before, 5 min during and 9.5 min after pC1-A activation (using csChrimson). The movie is sped up 20 times.
Tables
Key resources table
| Reagent type (species) or resource | Designation | Source or reference | Identifiers | Additional information |
|---|---|---|---|---|
| Genetic reagent (D. melanogaster) | NM91 | Coen et al., 2014 | A gift from Peter Andolfatto | |
| Genetic reagent (D. melanogaster) | Dsx-Gal4 (III) | Rideout et al., 2010 | A gift from Stephen Goodwin | |
| Genetic reagent (D. melanogaster) | Dsx-LexA::P65 (III) | Zhou et al., 2015 | A gift from Bruce Baker | |
| Genetic reagent (D. melanogaster) | UAS-2xEGFP (II) | BDSC: 6874; RRID:BDSC_6874 | ||
| Genetic reagent (D. melanogaster) | R71G01-LexA (II) | Pan et al., 2012 | BDSC: 54733; RRID:BDSC_54733 | |
| Genetic reagent (D. melanogaster) | R41A01-LexA (II) | Zhou et al., 2014 | BDSC: 54787; RRID:BDSC_54787 | |
| Genetic reagent (D. melanogaster) | 8xLexAop2-FLP (II) | BDSC: 55820; RRID:BDSC_55820 | ||
| Genetic reagent (D. melanogaster) | UAS > STOP > TNT (III) | Stockinger et al., 2005 | A gift from Barry Dickson | |
| Genetic reagent (D. melanogaster) | UAS-ReachR (III) | Inagaki et al., 2014 | BDSC: 53749; RRID:BDSC_53749 | |
| Genetic reagent (D. melanogaster) | VT25602.p65ADZp (II) | Wu et al., 2019 | A gift from Barry Dickson | |
| Genetic reagent (D. melanogaster) | VT2064.ZpGAL4DBD (III) | Wu et al., 2019 | A gift from Barry Dickson | |
| Genetic reagent (D. melanogaster) | UAS(FRT.mCherry) ReachR (III) | Inagaki et al., 2014 | BDSC: 53740; RRID:BDSC_53740 | A gift from David Anderson |
| Genetic reagent (D. melanogaster) | R71G01-p65.AD (II) | Dionne et al., 2018 | BDSC: 70798; RRID:BDSC_70798 | A gift from Gerry Rubin |
| Genetic reagent (D. melanogaster) | Dsx.DBD (III) | Pavlou et al., 2016 | A gift from Stephen Goodwin | |
| Genetic reagent (D. melanogaster) | 10xUAS-IVS-myr::GFP (II) | BDSC: 32198; RRID:BDSC_32198 | ||
| Genetic reagent (D. melanogaster) | W+,NorpA (X) | BDSC: 9048; RRID:BDSC_9048 | ||
| Genetic reagent (D. melanogaster) | VT25602-Gal4 (III) | A gift from Barry Dickson | ||
| Genetic reagent (D. melanogaster) | R57C10-LexA (II) | BDSC: 52817; RRID:BDSC_52817 | A gift from Gerry Rubin | |
| Genetic reagent (D. melanogaster) | 8xLexAop- mCD8tdTomato (III) | A gift from Yuh Nung Jan | ||
| Genetic reagent (D. melanogaster) | 13xLexAop-IVS- GCaMP6s (III) | BDSC: 44274; RRID:BDSC_44274 | ||
| Genetic reagent (D. melanogaster) | 10xUAS-IVS-Syn21- Chrimson-tdT-3.1 (X) | Hoopfer et al., 2015 | A gift from Allan Wong | |
| Genetic reagent (D. melanogaster) | 13xLexAop2-IVS- Syn21-opGCaMP6s (X) | A gift from Allan Wong | ||
| Genetic reagent (D. melanogaster) | 20xUAS-IVS- CsChrimson.mVenus (X) | BDSC: 55134 RRID:BDSC_55134 | A gift from Vivek Jayaraman | |
| Genetic reagent (D. melanogaster) | Fru[P1.LexA] (III) | BDSC: 66698 RRID:BDSC_66698 | A gift from Bruce Baker | |
| Antibody | Mouse anti-brp | mAb DSHS - developmental studies Hybridoma bank | #nc82; RRID:AB_2314866 | (1:20 dilution) |
| Antibody | Chicken anti-GFP (Polyclonal) | Invitrogen | #A10262, RRID:AB_2534023 | (1:2000 dilution) |
| Antibody | Rabbit anti-dsRed (Polyclonal) | Takara Bio | #632496, RRID:AB_10013483 | (1:500 dilution) |
| Antibody | Goat anti-mouse Alexa-Flour 568 (Polyclonal) | Invitrogen | #A-11004, RRID:AB_2534072 | (1:400 dilution) |
| Antibody | Goat anti-chicken Alexa-Flour 488 (Polyclonal) | Invitrogen | #A11039, RRID:AB_142924 | (1:300 dilution) |
| Antibody | Goat anti-rabbit Alexa-Flour 633 (Polyclonal) | Invitrogen | #A-21070, RRID:AB_2535731 | (1:400 dilution) |
| Chemical compound, drug | All trans-Retinal | Sigma-Aldrich | #R2500 | |
| Software, algorithm | MATLAB | Mathworks | RRID:SCR_001622 | |
| Software, algorithm | SLEAP | https://sleap.ai/ | ||
| Software, algorithm | Illustrator | Adobe | RRID:SCR_010279 |
Additional files
-
Supplementary file 1
FlyWire cells identified and proofread for this study.
This Table contains FlyWire segment IDs for each cell, cell names where identified, and links to the cells in FlyWire.
- https://cdn.elifesciences.org/articles/59502/elife-59502-supp1-v3.xlsx
-
Transparent reporting form
- https://cdn.elifesciences.org/articles/59502/elife-59502-transrepform-v3.docx
Download links
A two-part list of links to download the article, or parts of the article, in various formats.
Downloads (link to download the article as PDF)
Open citations (links to open the citations from this article in various online reference manager services)
Cite this article (links to download the citations from this article in formats compatible with various reference manager tools)
The neural basis for a persistent internal state in Drosophila females
eLife 9:e59502.
https://doi.org/10.7554/eLife.59502


