Structural analysis of the Legionella pneumophila Dot/Icm type IV secretion system core complex
- Life Sciences Institute, University of Michigan, United States
- Department of Pathology, Microbiology, and Immunology, Department of Pathology, Vanderbilt University Medical Center, United States
- Department of Microbiology and Immunology, University of Michigan, United States
- The Veterans Affairs Tennessee Valley Healthcare System, United States
- Department of Cell and Developmental Biology, University of Michigan, United States
Figures
Figure 1 with 3 supplements
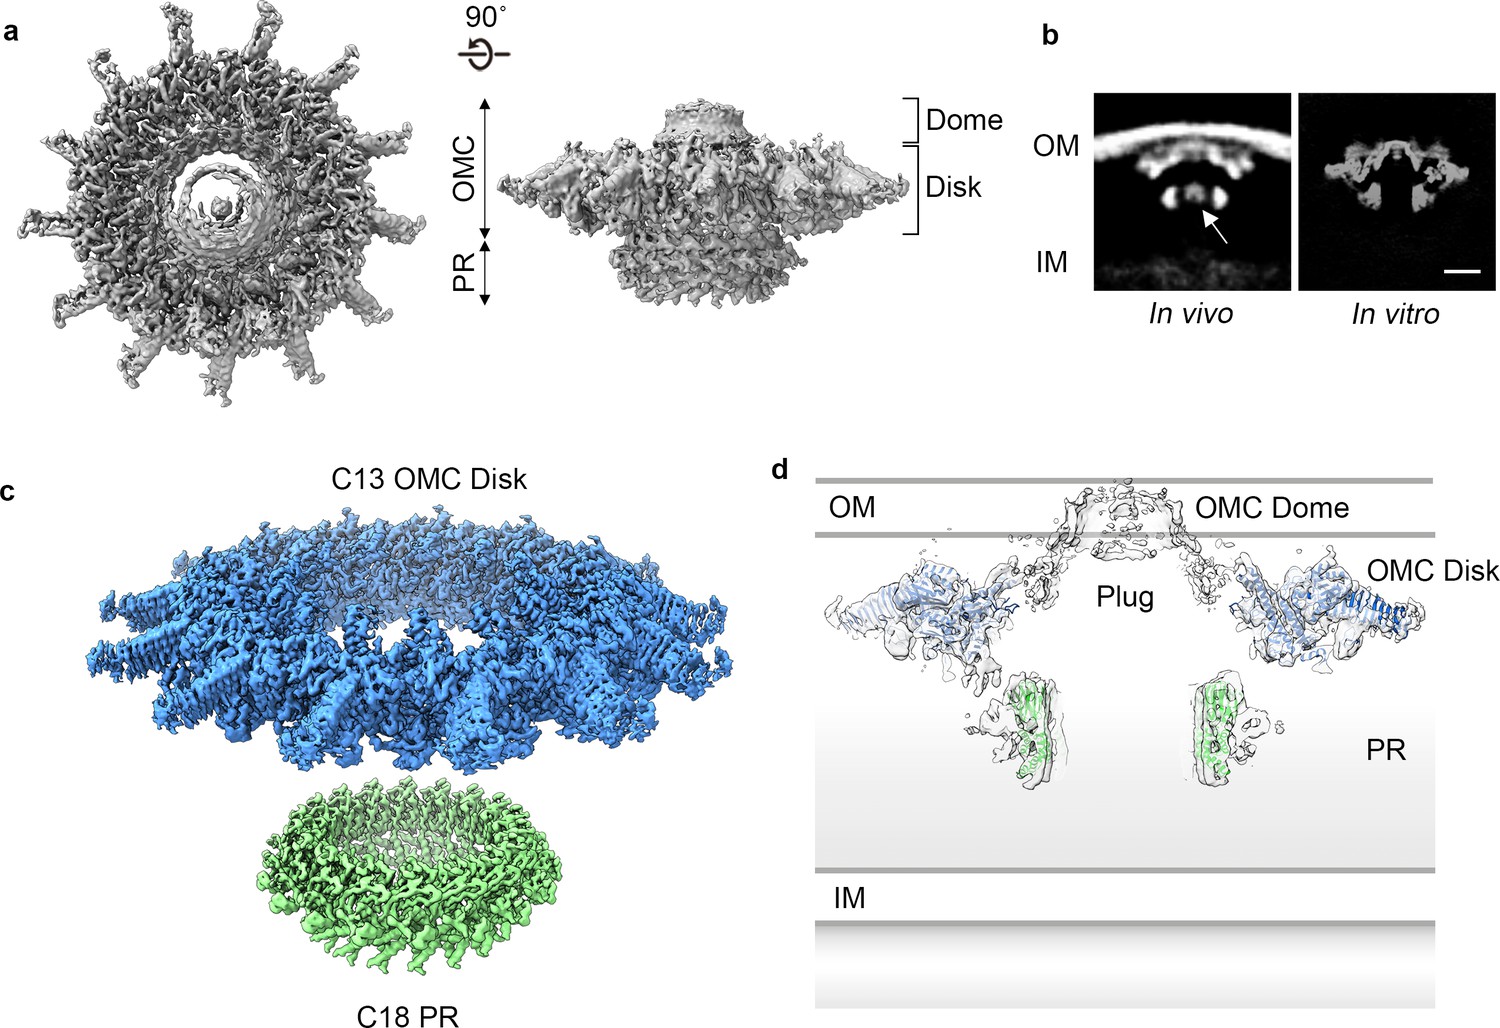
Cryo-EM structure of the L. pneumophila Dot/Icm T4SS.
(a) Reconstruction of the L. pneumophila Dot/Icm T4SS particles at 4.6 Å with no symmetry applied reveals two parts, the outer membrane cap (OMC), composed of a central dome and flat disk, and a periplasmic ring (PR). (b) Comparison of the central sections through the longitudinal plane of the T4SS 3D density determined by cryo-ET of intact L. pneumophila (left panel, EMD 0566) (Ghosal et al., 2019) with arrow indicating plug density or by cryo-EM of purified particles (this study) (right panel). OM, Outer Membrane, IM, Inner Membrane, Scale bar 10 nm. (c) Combined high resolution structures of the L. pneumophila Dot/Icm T4SS that include the 3.5 Å OMC disk (blue) with 13-fold symmetry and the 3.7 Å PR (green) with 18-fold symmetry. (d) Central axial slice view showing how atomic models of the OMC disk (blue) and PR (green) fit into the C1 3D map of the Dot/Icm T4SS (light gray).
Figure 1—figure supplement 1
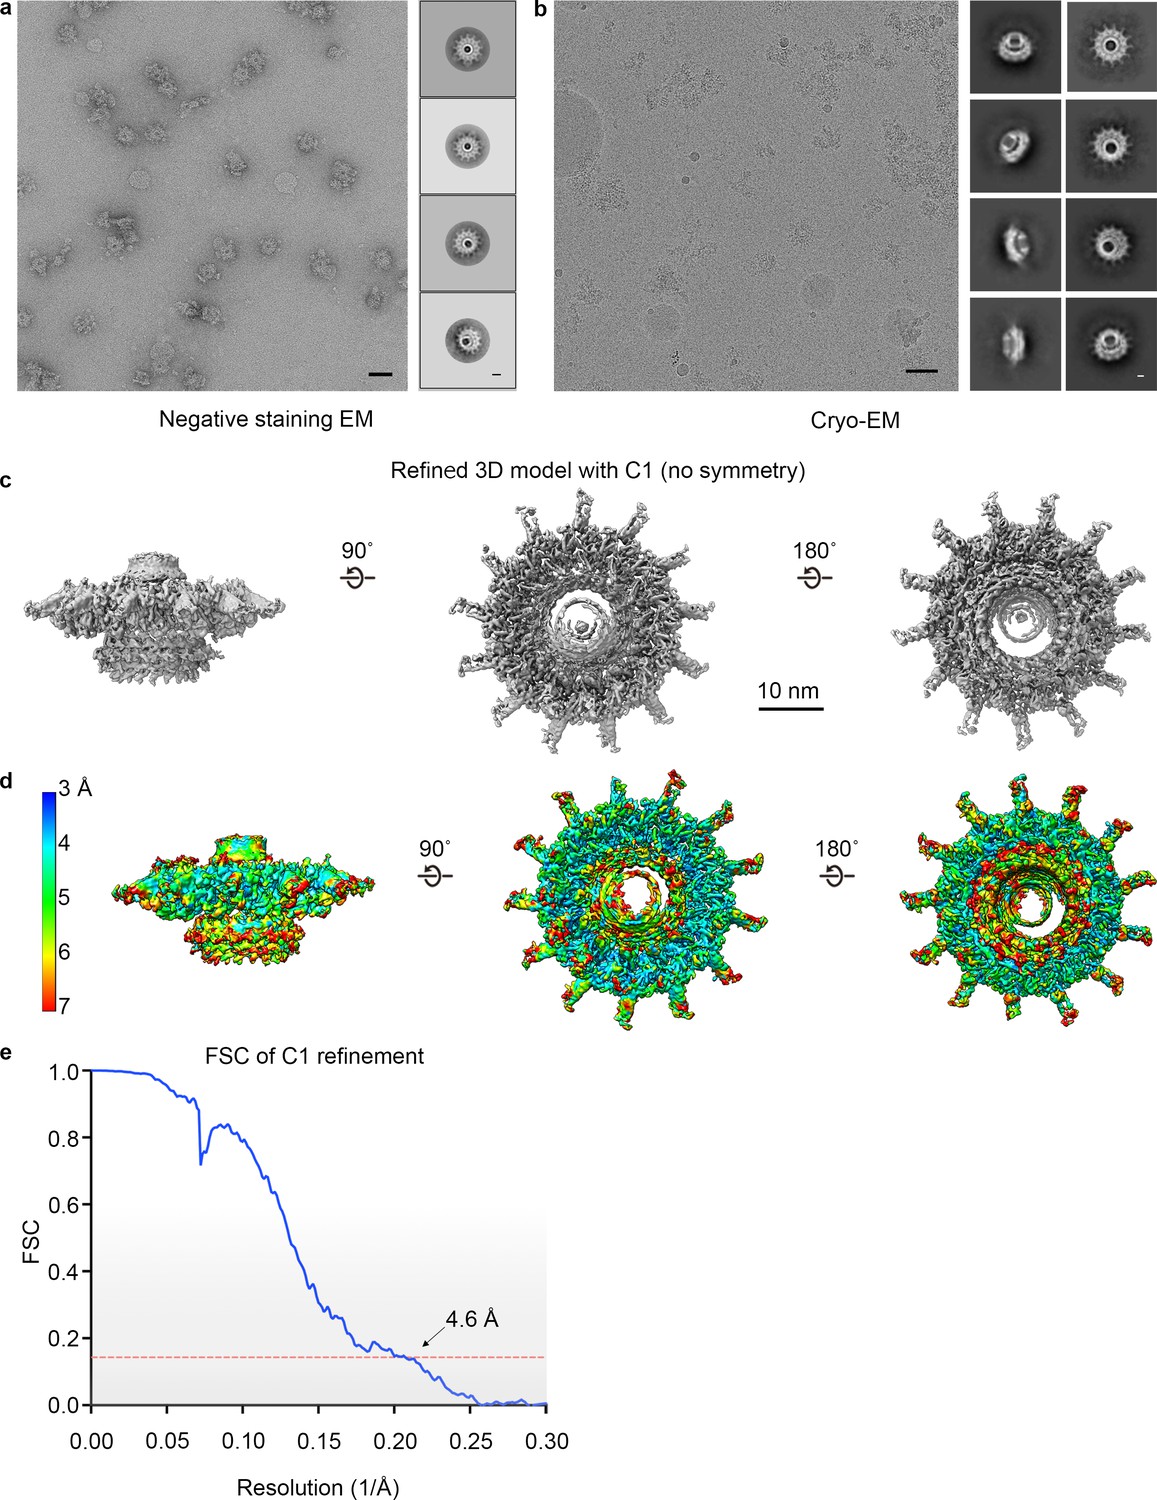
Asymmetric reconstruction of the Dot/Icm T4SS.
(a) A representative image of the Lp Dot/Icm T4SS particles in negative stain EM (scale bar = 50 nm) and subsequent 2D class averages (scale bar = 20 nm). (b) A representative image of the Lp Dot/Icm T4SS particles in cryo-EM (scale bar = 50 nm) and subsequent 2D class averages (scale bar = 10 nm). (c–d) The Dot/Icm T4SS map was reconstructed with no symmetry applied to a resolution of 4.6 Å and reveals the outer membrane cap (OMC), composed of a dome and a flat disk, and the periplasmic ring (PR). (d) The local resolution of the C1 map extends to ~4.0 Å in the best resolved portions of the map.
Figure 1—figure supplement 2
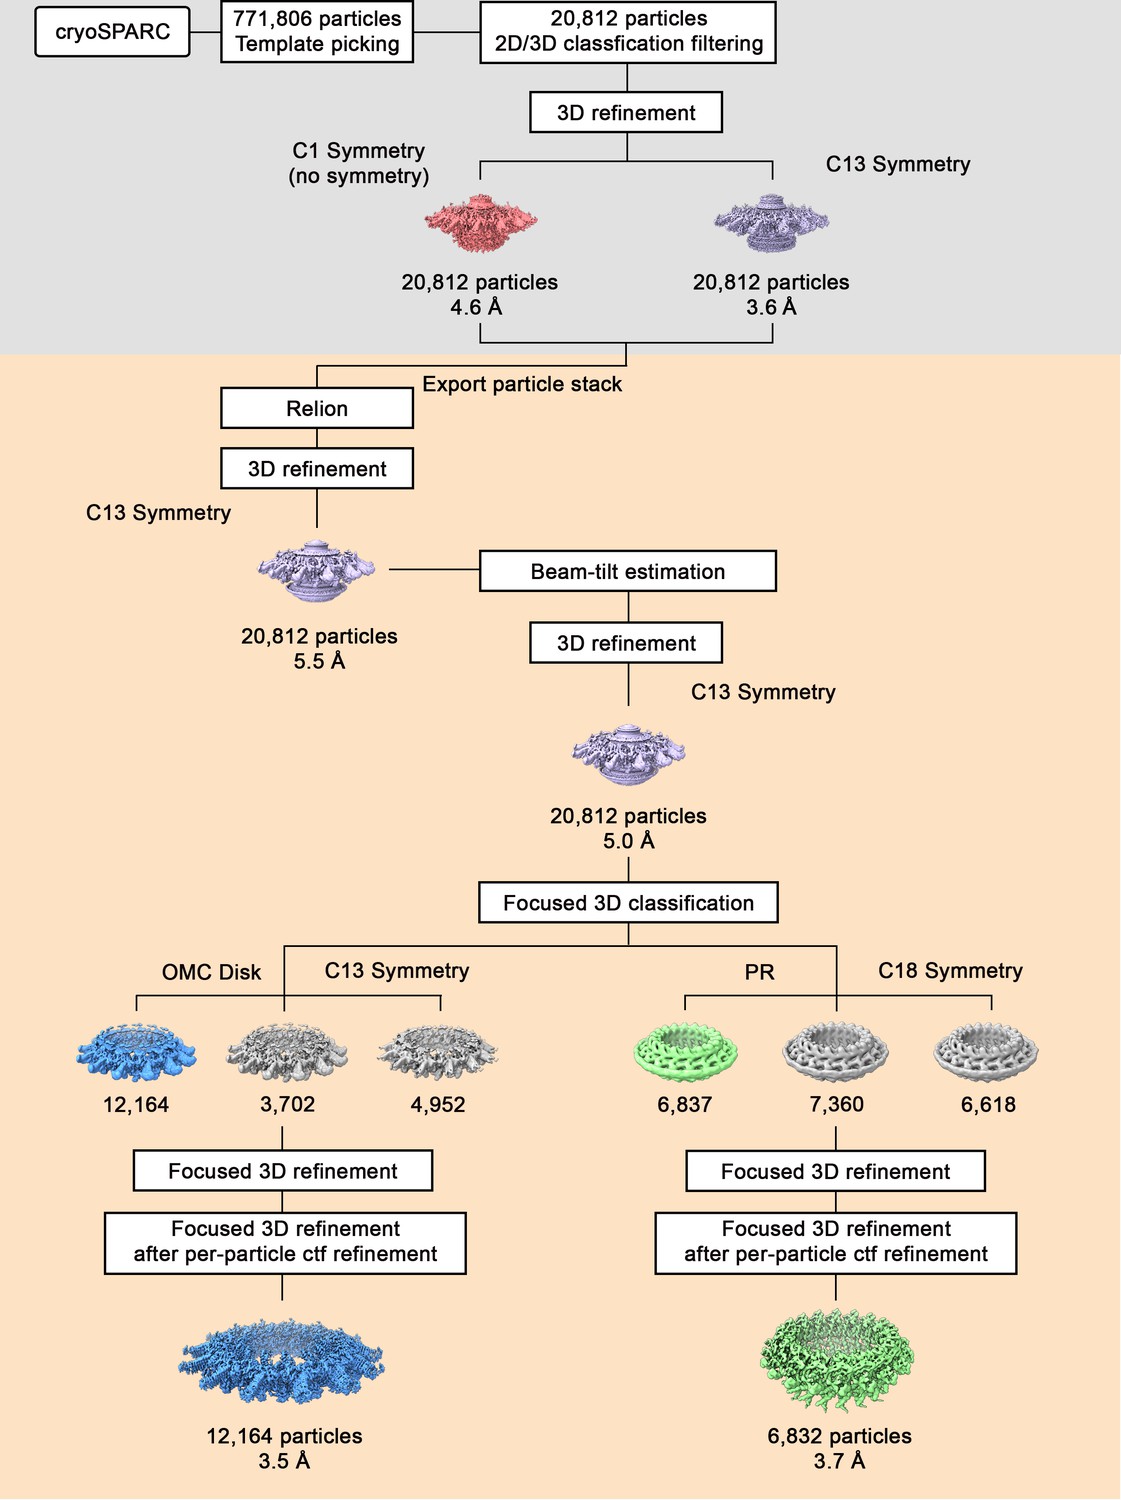
Flow chart of cryo-EM processing steps.
Using template picking in cryoSPARC,~770,000 Dot/Icm T4SS particles were selected. The processing steps done in cryoSPARC are on a gray background, and the processing steps done using RELION are on a tan background. After 2D and 3D classification, the best class of ~20,000 particles was chosen for further refinement with and without C13 symmetry, resulting in reconstruction of 3D maps at 4.6 Å and 3.6 Å, respectively. The particle stack used in the refinement job in cryoSPARC was exported into Relion for further processing, such as CTF-refinement and focused refinement. The 3.6 Å 3D model with C13 symmetry was used as an initial model for 3D structure determination in Relion using auto-3D refinement with C13 symmetry, resulting in reconstruction of 3D map of 5.5 Å resolution. The CTF-refinement beam tilt estimation was applied, followed by another round of 3D refinement, improving the resolution to 5.0 Å. Focused 3D classification (without alignment) was used to determine higher resolution maps of the OMC disk (with 13-fold symmetry) and the PR (with 18-fold symmetry). The maps of the OMC disk and PR were further refined using focused 3D refinement (with local refinement), resulting in 3D maps of the OMC disk (13-fold symmetry) and the PR (18-fold symmetry) at 3.5 Å and 3.7 Å, respectively.
Figure 1—figure supplement 3
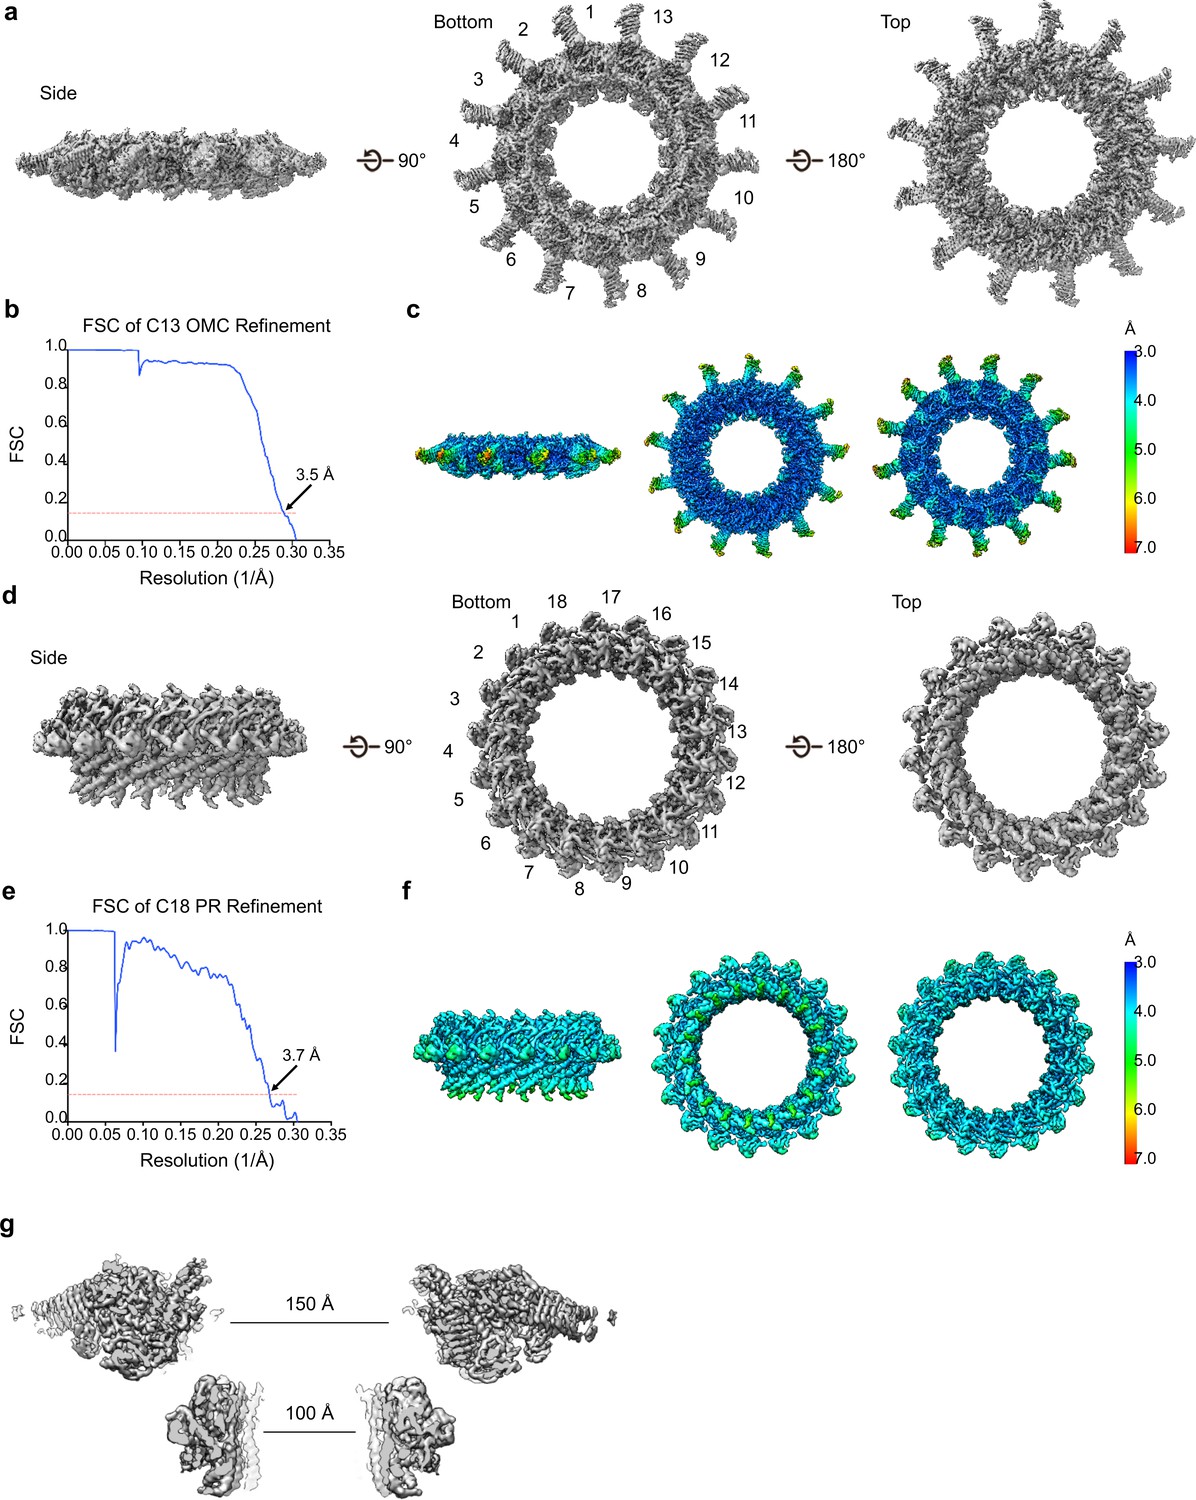
Symmetric reconstructions of the OMC and PR of the Dot/Icm T4SS.
(a–b) The OMC disk has been reconstructed to 3.5 Å resolution using C13 symmetry. The cryo-EM density map of the Dot/Icm T4SS OMC disk showing the side, bottom, and top faces of the OMC. (c) The local resolution of the OMC extends to 3.0 Å in the best resolved portions of the map. (d–e) The PR has been reconstructed to 3.7 Å using C18 symmetry. (f) The local resolution of the PR extends to ~4.0 Å in the best resolved regions of the map. (g) A channel runs through the center of the Dot/Icm T4SS that is ~150 Å in diameter in the OMC and ~100 Å in diameter in the PR.
Figure 2 with 2 supplements
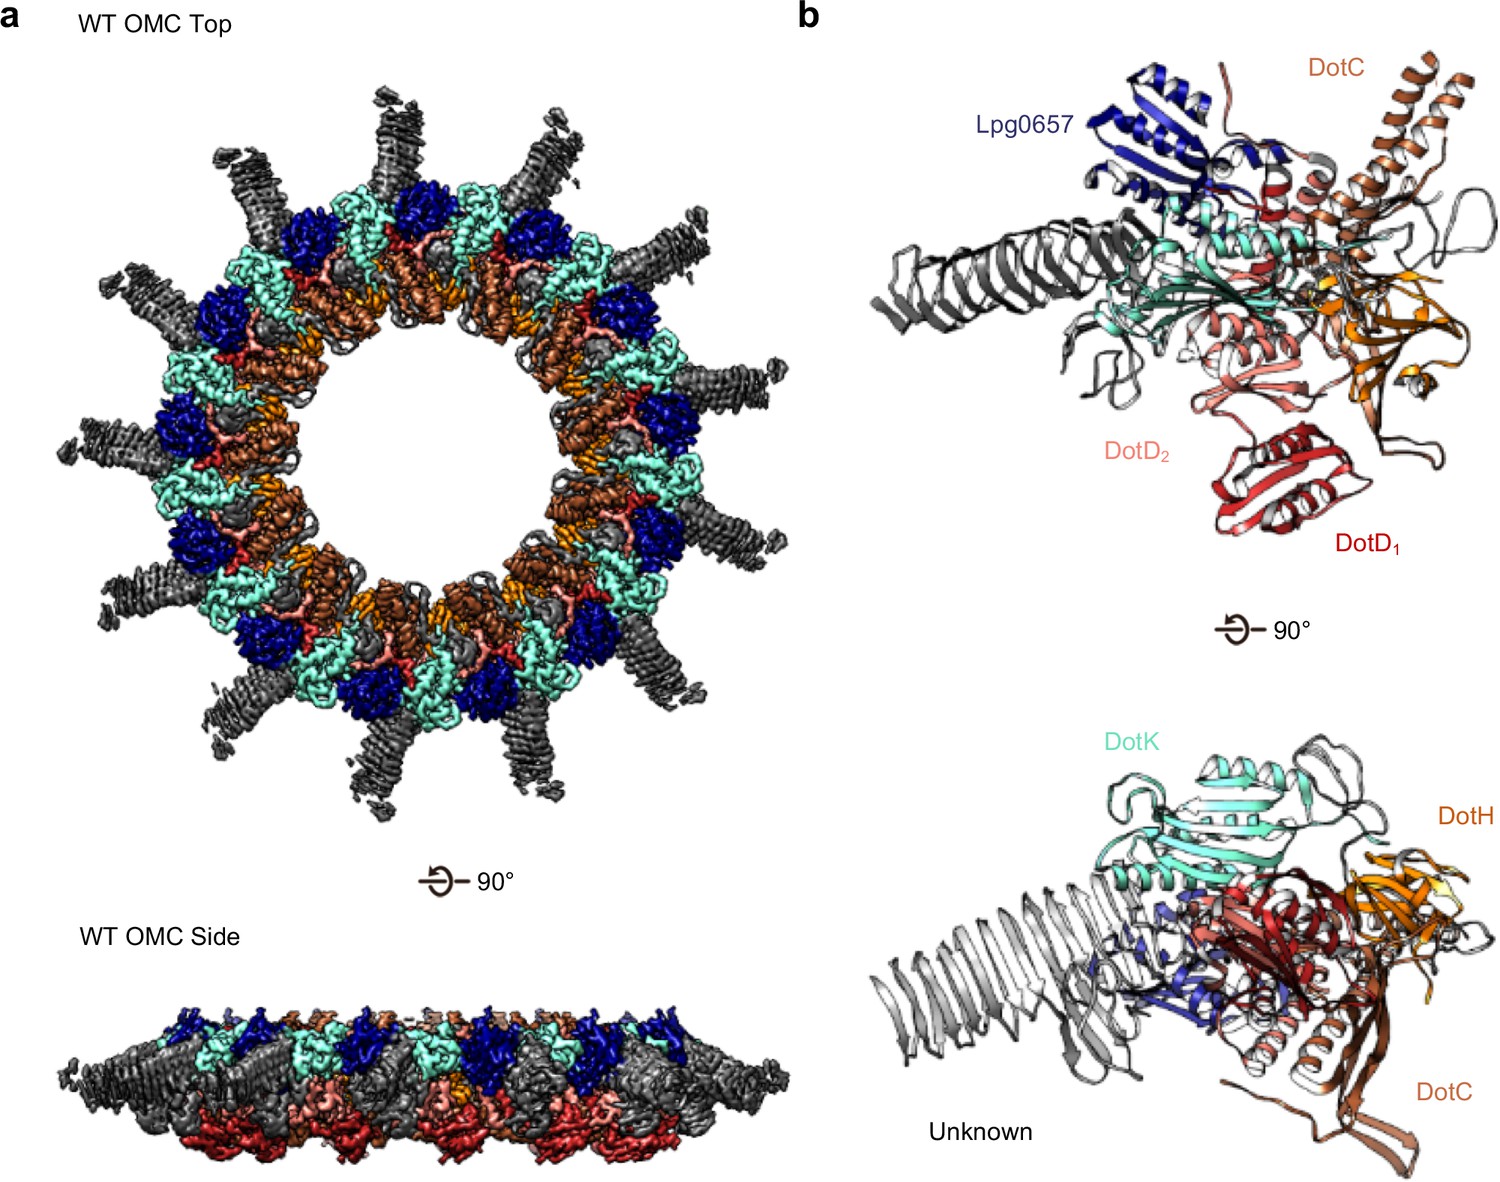
The OMC disk of the Dot/Icm T4SS.
(a) The OMC disk of the Dot/Icm T4SS was reconstructed from samples that were purified from the WT strain (b) We have defined an asymmetric unit that is comprised of DotC (brown), DotD1 (red), DotD2 (salmon), DotH (orange), DotK (cyan), Lpg0657 (blue), and three unknown chains (gray).
Figure 2—figure supplement 1
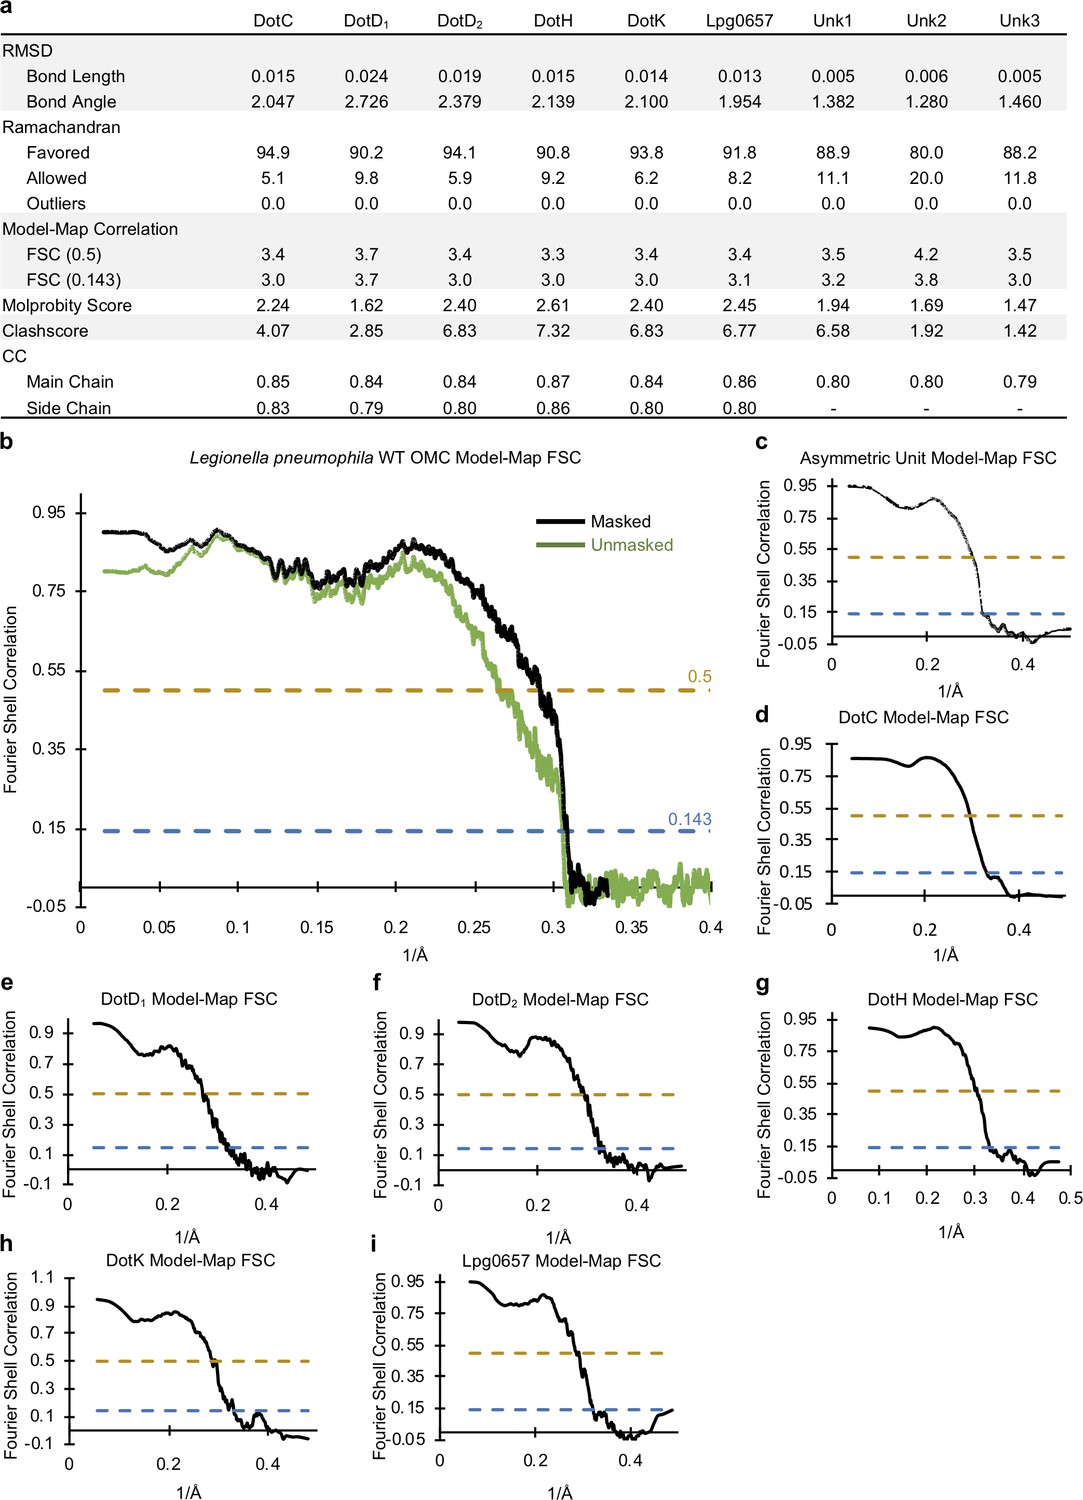
Correlation between the OMC cryo-EM map and models.
(a) Statistics for each model that was constructed indicate their relative quality. (b) A model-map correlation curve for the entire OMC is shown with the unmasked data shown in green and the masked data shown in black. (c–i) The model-map correlation was also determined for each individual protein structure that was solved within the OMC.
Figure 2—figure supplement 2
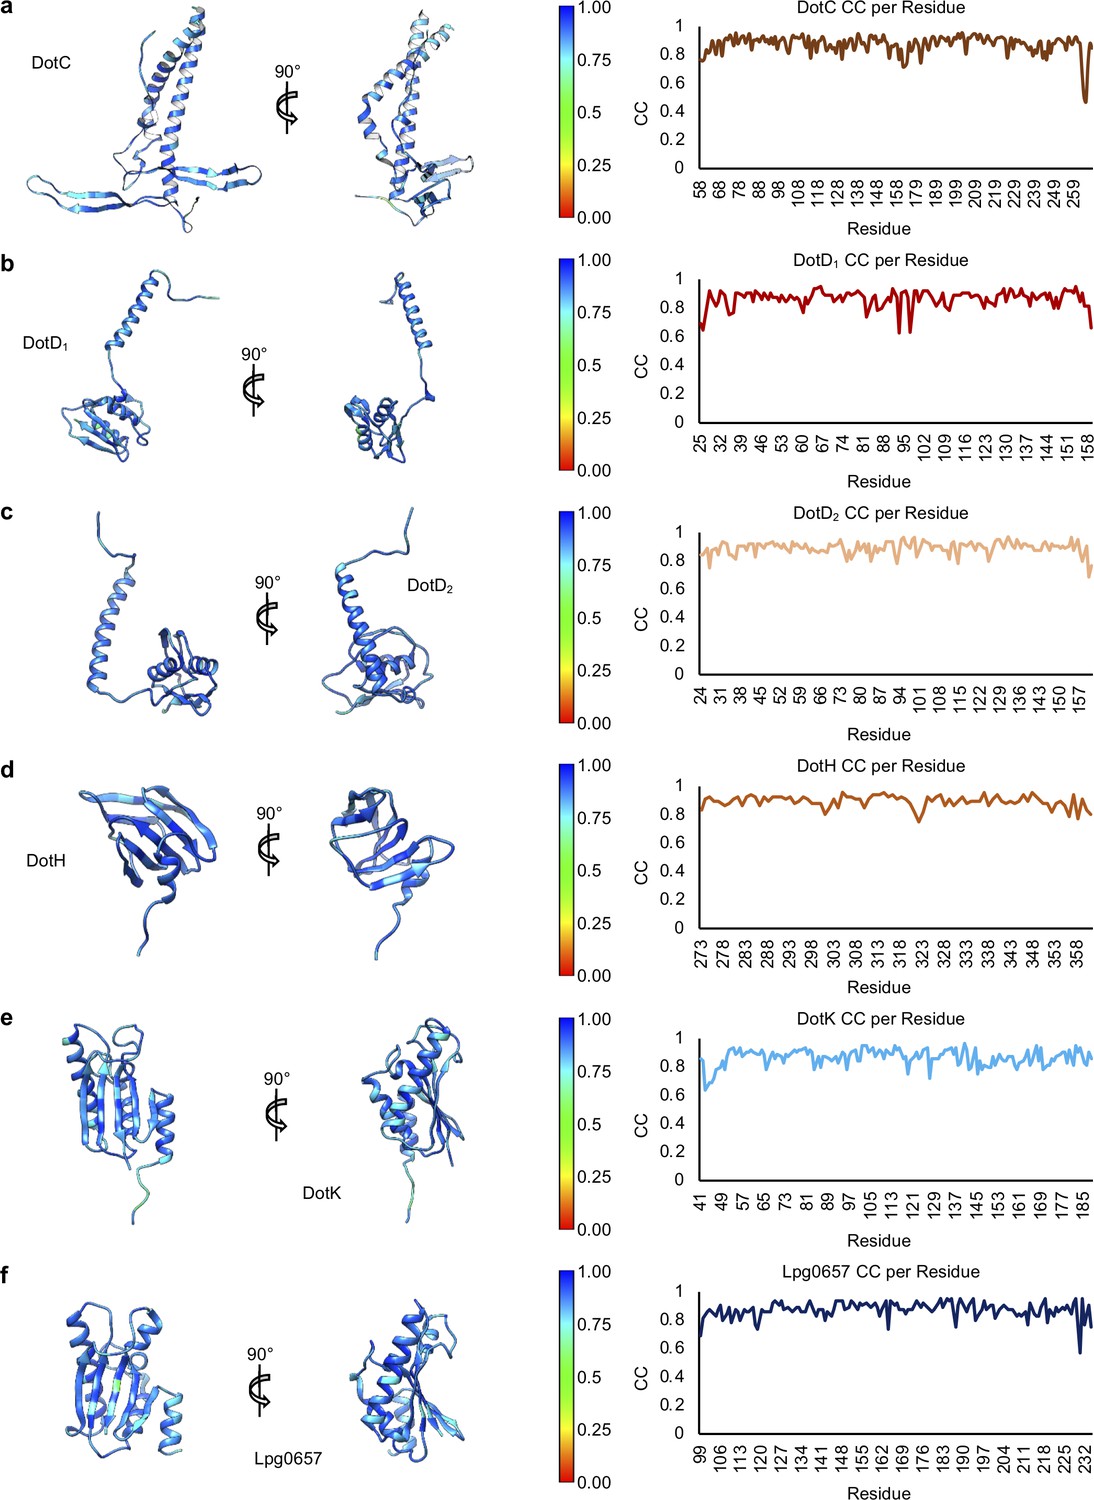
Model-map correlation for each protein within the OMC.
(a–f) The correlation coefficient for each protein within the OMC is depicted as a heat map on the corresponding structure and is plotted against the residue number.
Figure 3
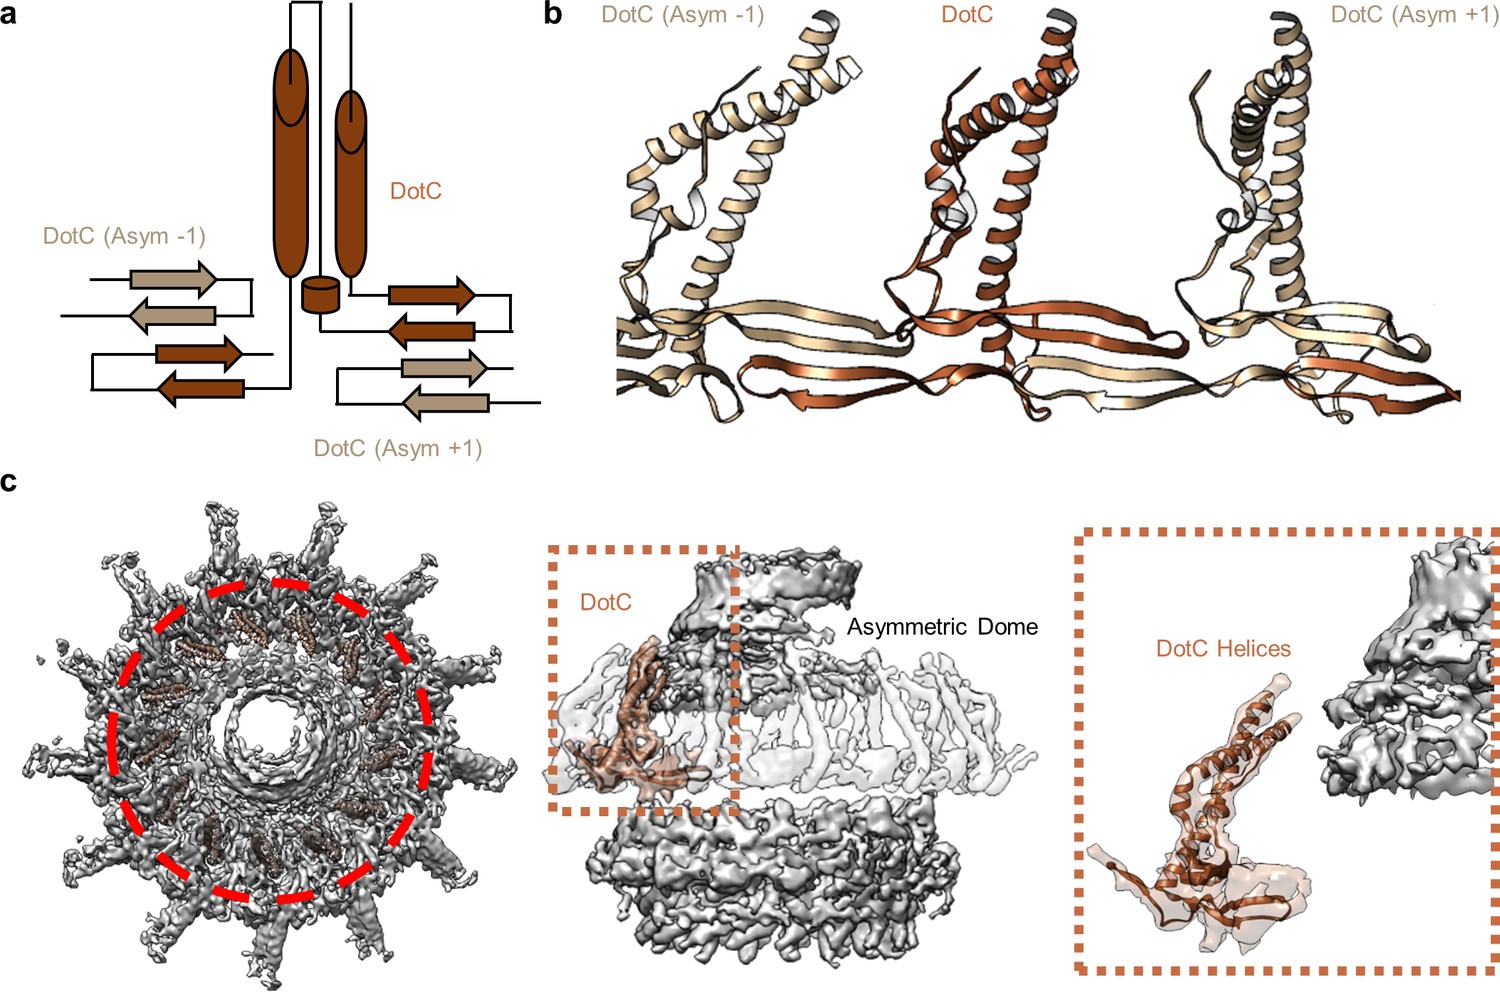
DotC forms a nearly uninterrupted β-sheet about the center of the complex.
(a) DotC is composed of two large α-helices and two β-sheets. (b) These sheets are formed between asymmetric units and comprise a predominantly electrostatic structure that lines the central chamber. (c) DotC is adjacent to the poorly resolved portion of the C1 map (circled with a red dotted line, left). The positioning of DotC is such that a gap exists between it and the asymmetric portion of the map (brown dotted line, center). This results in a small predicted interface between DotC and the central dome (right).
Figure 4

Components in the center of the Dot/Icm T4SS.
(a–b) On the peripheral side, DotC is observed with two copies of DotD, shown in red and salmon. (c) The two copies of DotD vary little in their overall organization, deviating by an RMSD of only 0.6 Å within the C-terminal domain as shown in the inset. (d) Both copies of DotD observed within this map adopt a fold that is similar to the previously reported crystal structure as well as related VirB7 homologs. (e) The interface that is formed between DotD1 and DotD2 is formed by a number of electrostatic and polar interactions as shown in the inset. (f) The N-terminal α-helices of DotD1 and DotD2 form the bulk of the interface observed with DotC, made up of a hydrophobic interface as shown in the inset.
Figure 5
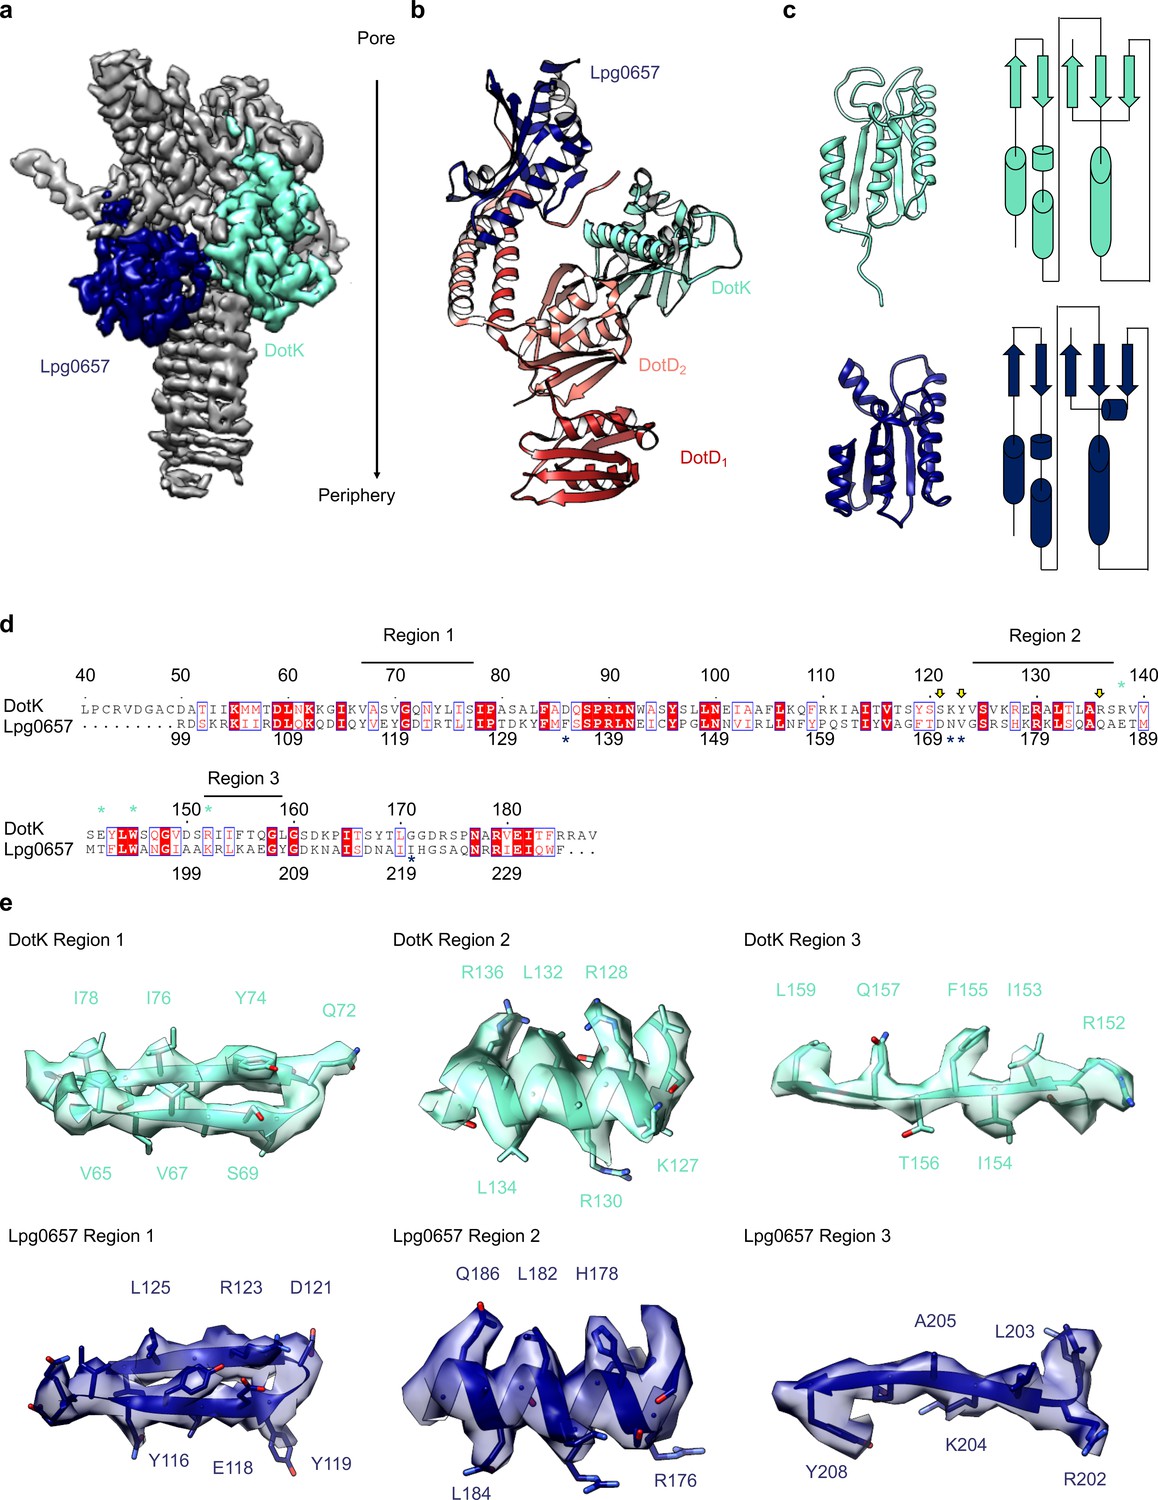
Components of the Dot/Icm T4SS near the outer membrane.
(a) Two nearly identical folds were discovered on the outer membrane side of the OMC that correspond to DotK (cyan) and Lpg0657 (blue). (b) DotK and Lpg0657 arrange such that each contacts both copies of DotD within the asymmetric unit, although they use different surfaces to mediate this interaction. (c) The two folds have a nearly identical topology. Proteins colored as in panel (a). (d) Although these folds are very similar, at least three regions could be used to distinguish between the two proteins in this map. (e) Characteristic density is observed for each protein and supports the assignment of each protein within the map.
Figure 6
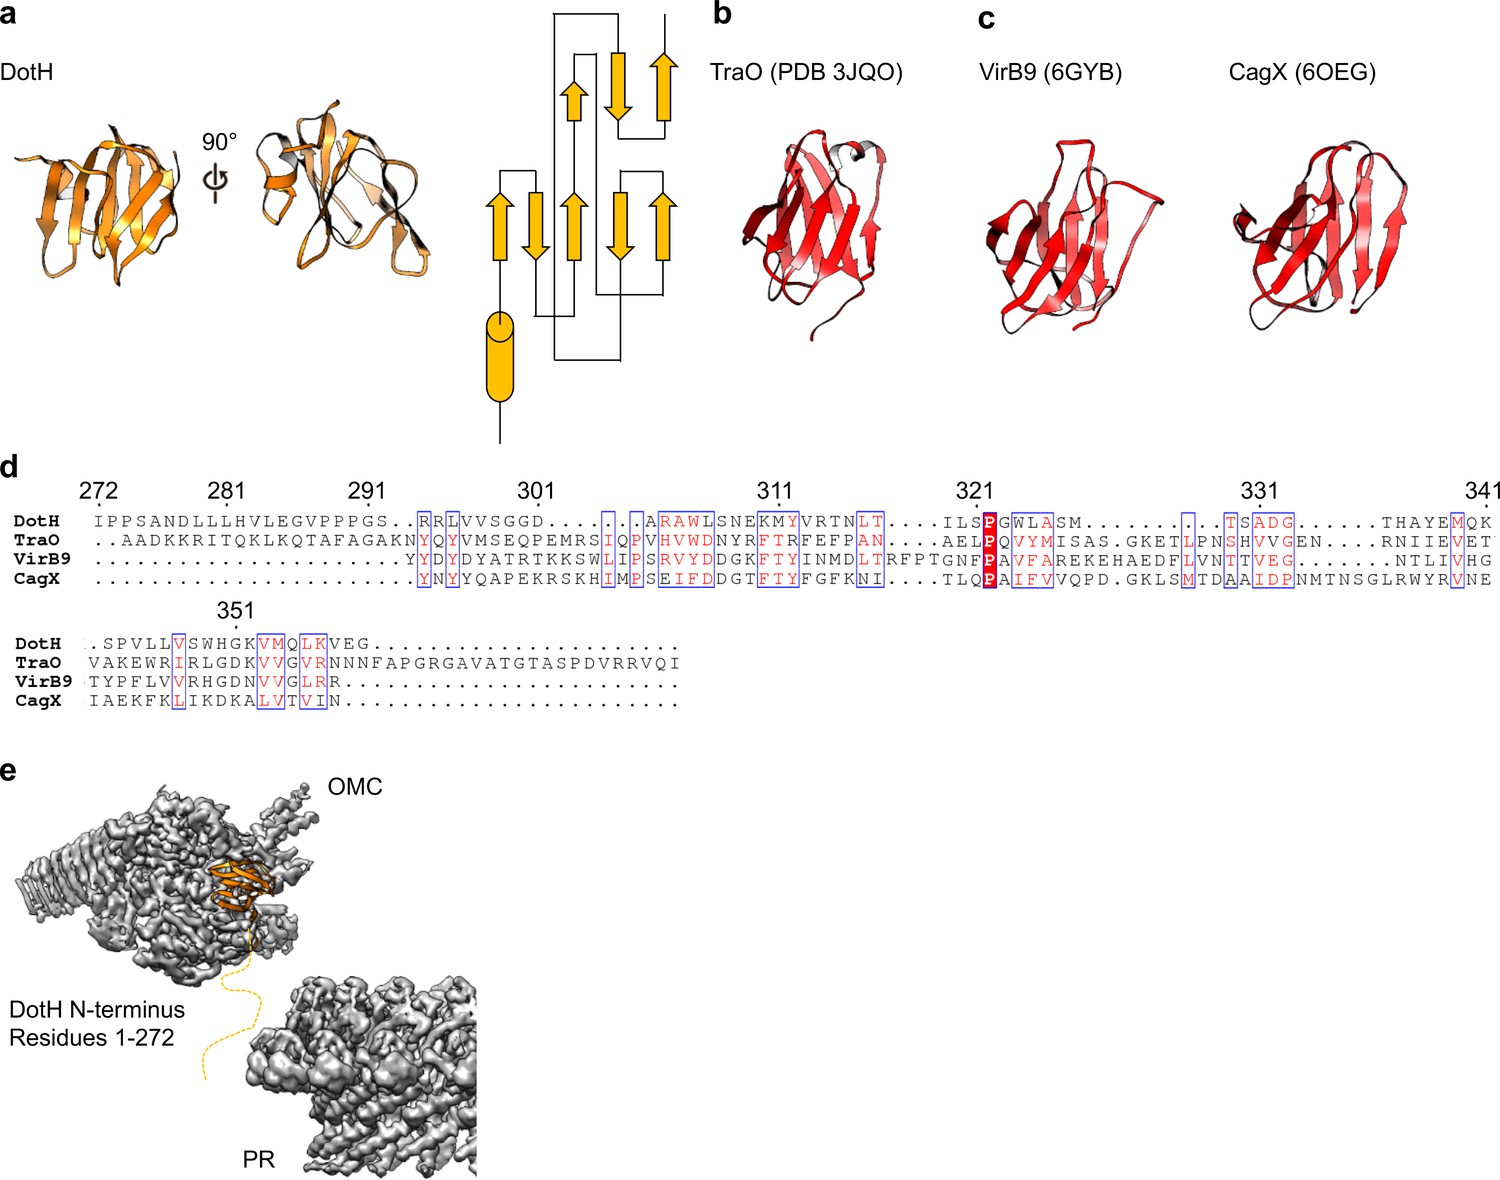
DotH is a VirB9 homolog and positioned in the center of the map.
(a) The C-terminal domain of DotH was discovered within the center of the OMC map and consists of a β-sandwich fold. (b) The structure is similar to other T4SS proteins such as the C-termini of TraO, VirB9, and CagX. (c) Though the structures are similar, little sequence similarity (d) is observed throughout the family. (e) DotH is positioned such that the N-terminus (consisting of 272 residues) is positioned between the OMC and PR.
Figure 7
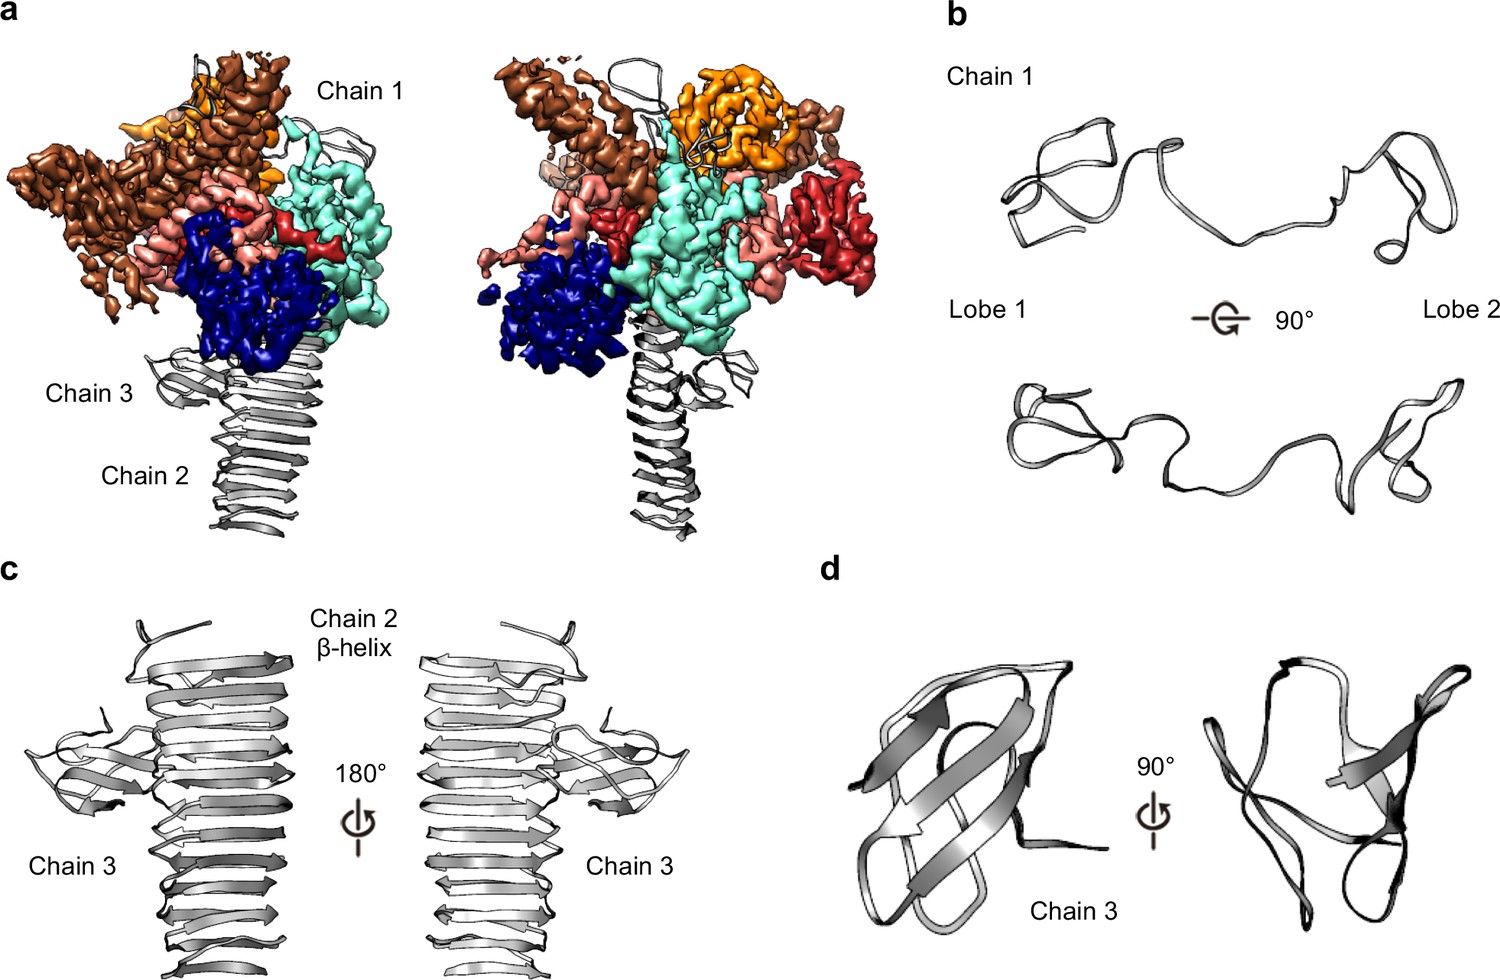
Three unknown components were modeled as polyalanine chains.
(a) Three chains were constructed as polyalanine models, denoted as chain 1–3 and shown in gray. (b) Chain 1 is observed near the outer membrane and consists of loops forming two lobes. (c) Chain 2 consists of a long β-helix that interacts with chain 3. (d) Chain 3 is a small globular fold that is comprised of only β-strands.
Figure 8 with 4 supplements
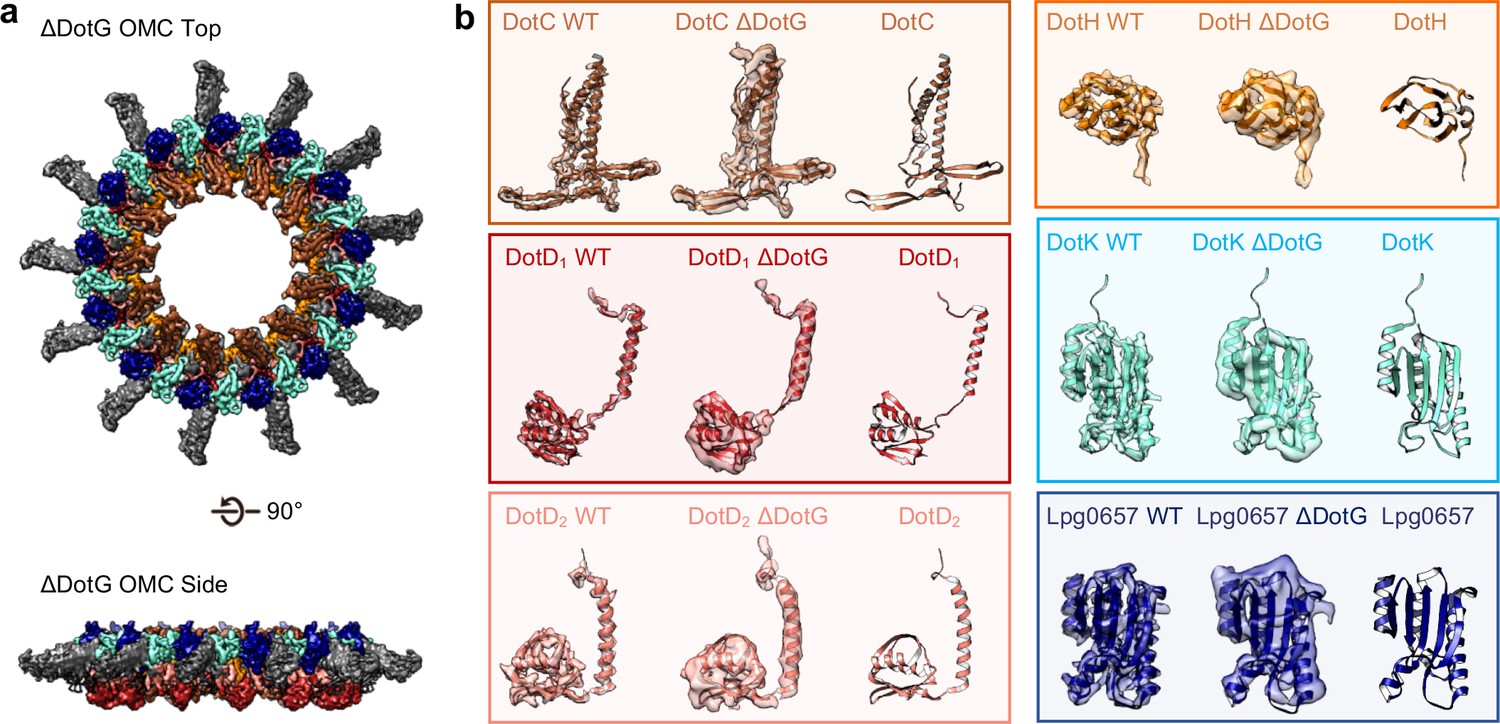
The OMC disk of the ΔDotG T4SS.
(a) The OMC disk of the ΔDotG T4SS was reconstructed from samples that were purified from a strain lacking DotG (ΔdotG). (b) All proteins within the asymmetric unit adopt nearly identical orientations in complexes identified from the WT and mutant strain. (Colored as in panel a).
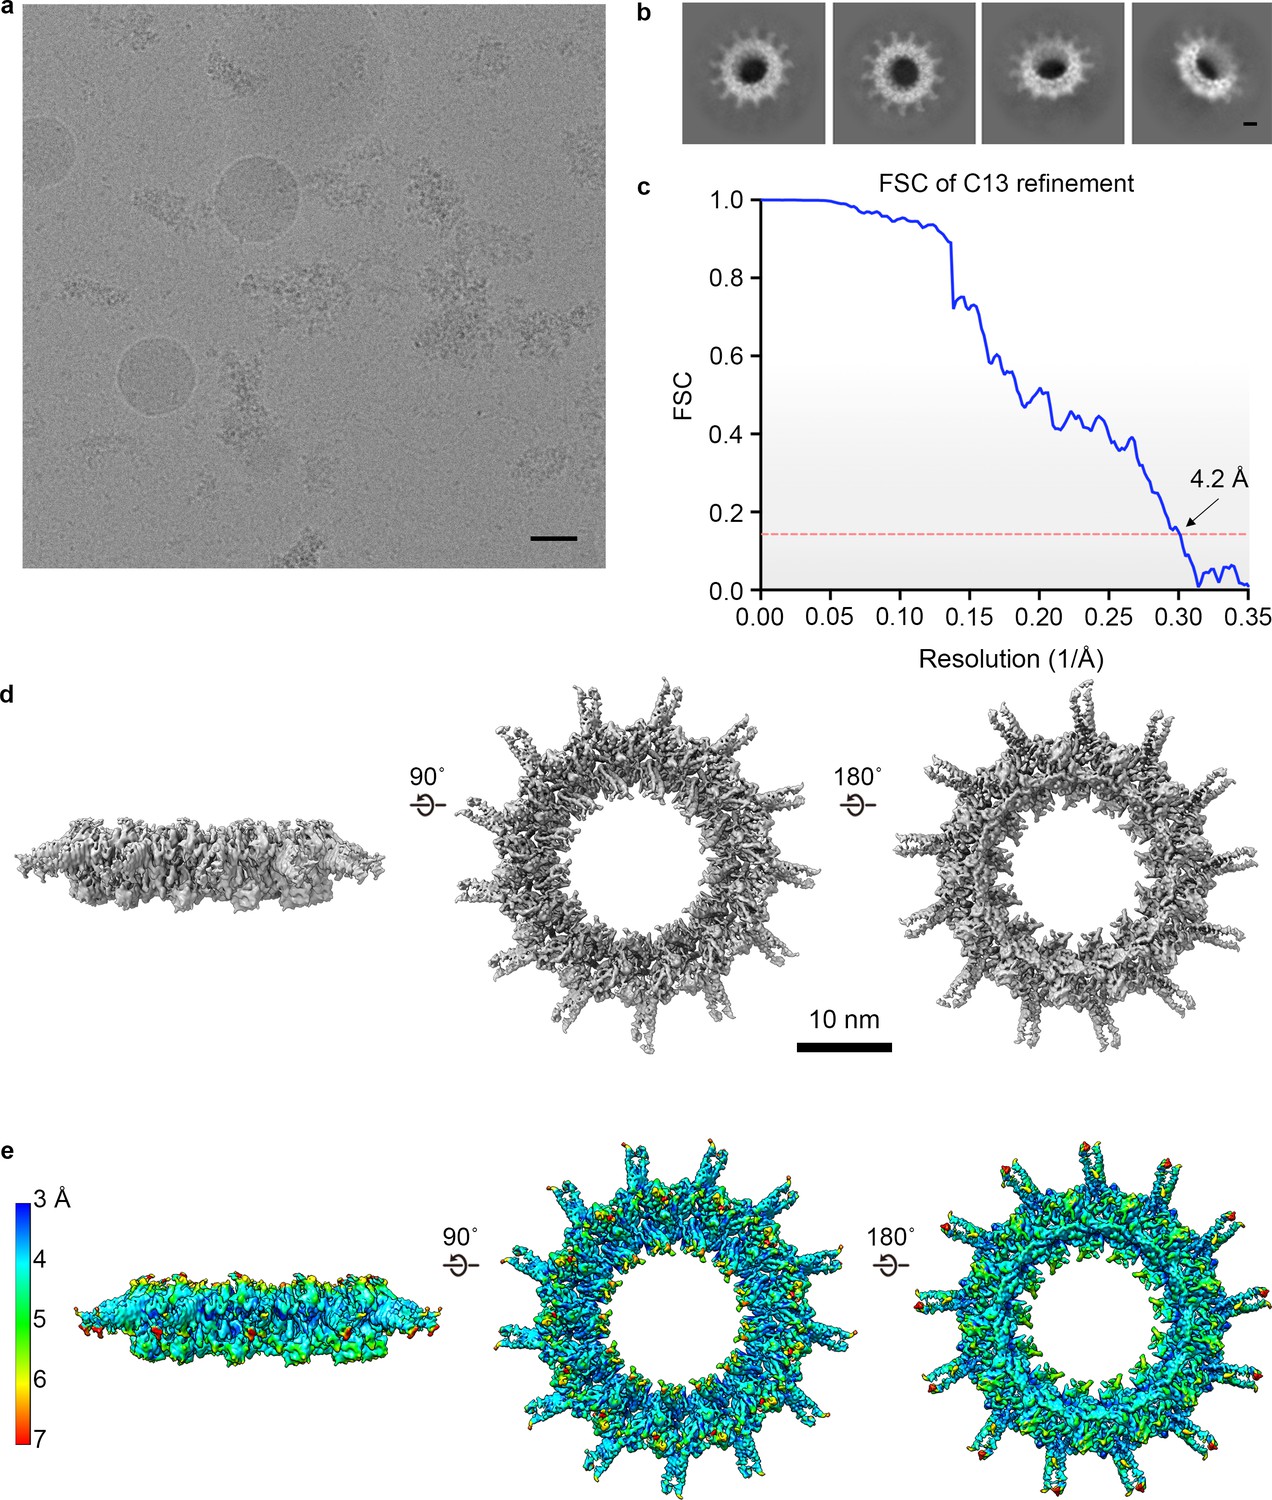
Figure 8—figure supplement 1
3D reconstruction of the T4SS purified from a ΔdotG mutant.
(a) A representative image of the Lp ΔDotG T4SS particles in cryo-EM (scale bar = 50 nm) and (b) subsequent 2D reconstructions (Scale bar = 10 nm). (c) Silver-stained gel from the T4SS samples used in this study. Lanes (L to R) are molecular weight markers, wild type, and ΔDotG complexes. (d–e) The map was reconstructed with C13 symmetry applied to a resolution of 4.2 Å and reveals only the outer membrane cap (OMC) disk region (f) The local resolution of the map extends to ~4.1 Å in the best resolved portions of the map.
Figure 8—figure supplement 2
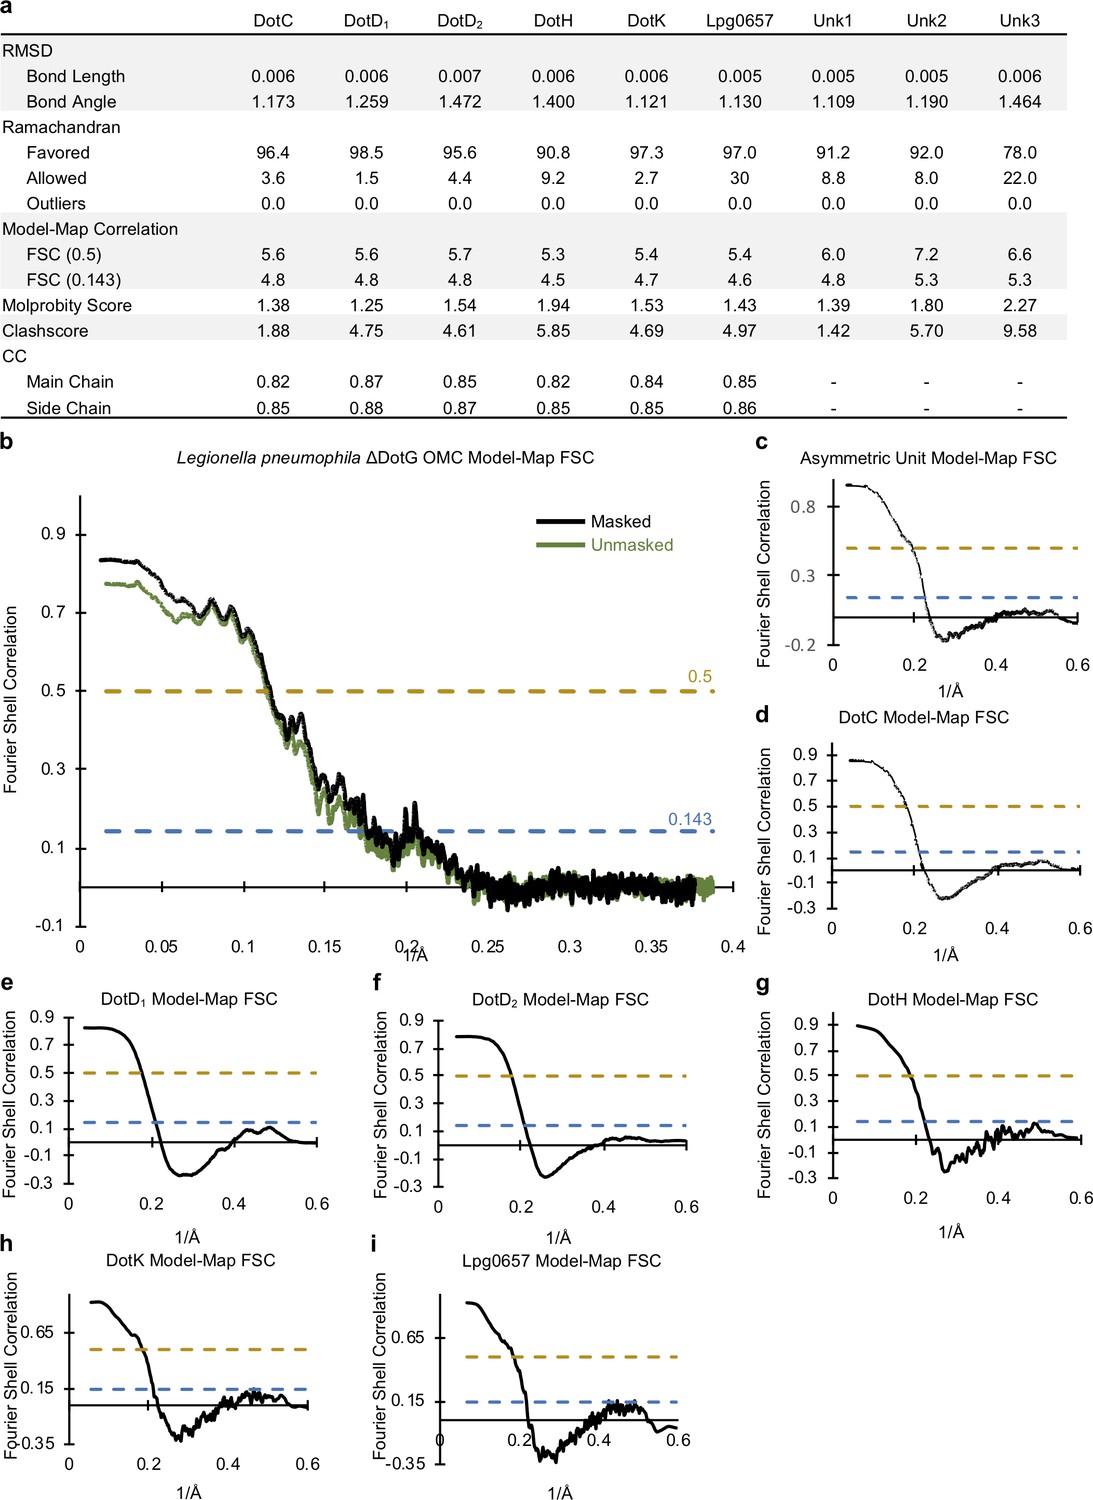
Correlation between the Lp ΔDotG OMC cryo-EM map and models.
(a) Statistics for each model that was constructed indicate their relative quality. (b) A model-map correlation curve for the entire Lp ΔDotG OMC is shown with the unmasked data shown in green and the masked data shown in black. (c–i) The model-map correlation was also determined for each individual protein structure that was solved within the Lp ΔDotG OMC.
Figure 8—figure supplement 3

Model-map correlation for each protein within the Lp ΔDotG OMC.
(a–f) The correlation coefficient for each protein within the Lp ΔDotG OMC is depicted as a heat map on the corresponding structure and is plotted against the residue number.
Figure 8—figure supplement 4
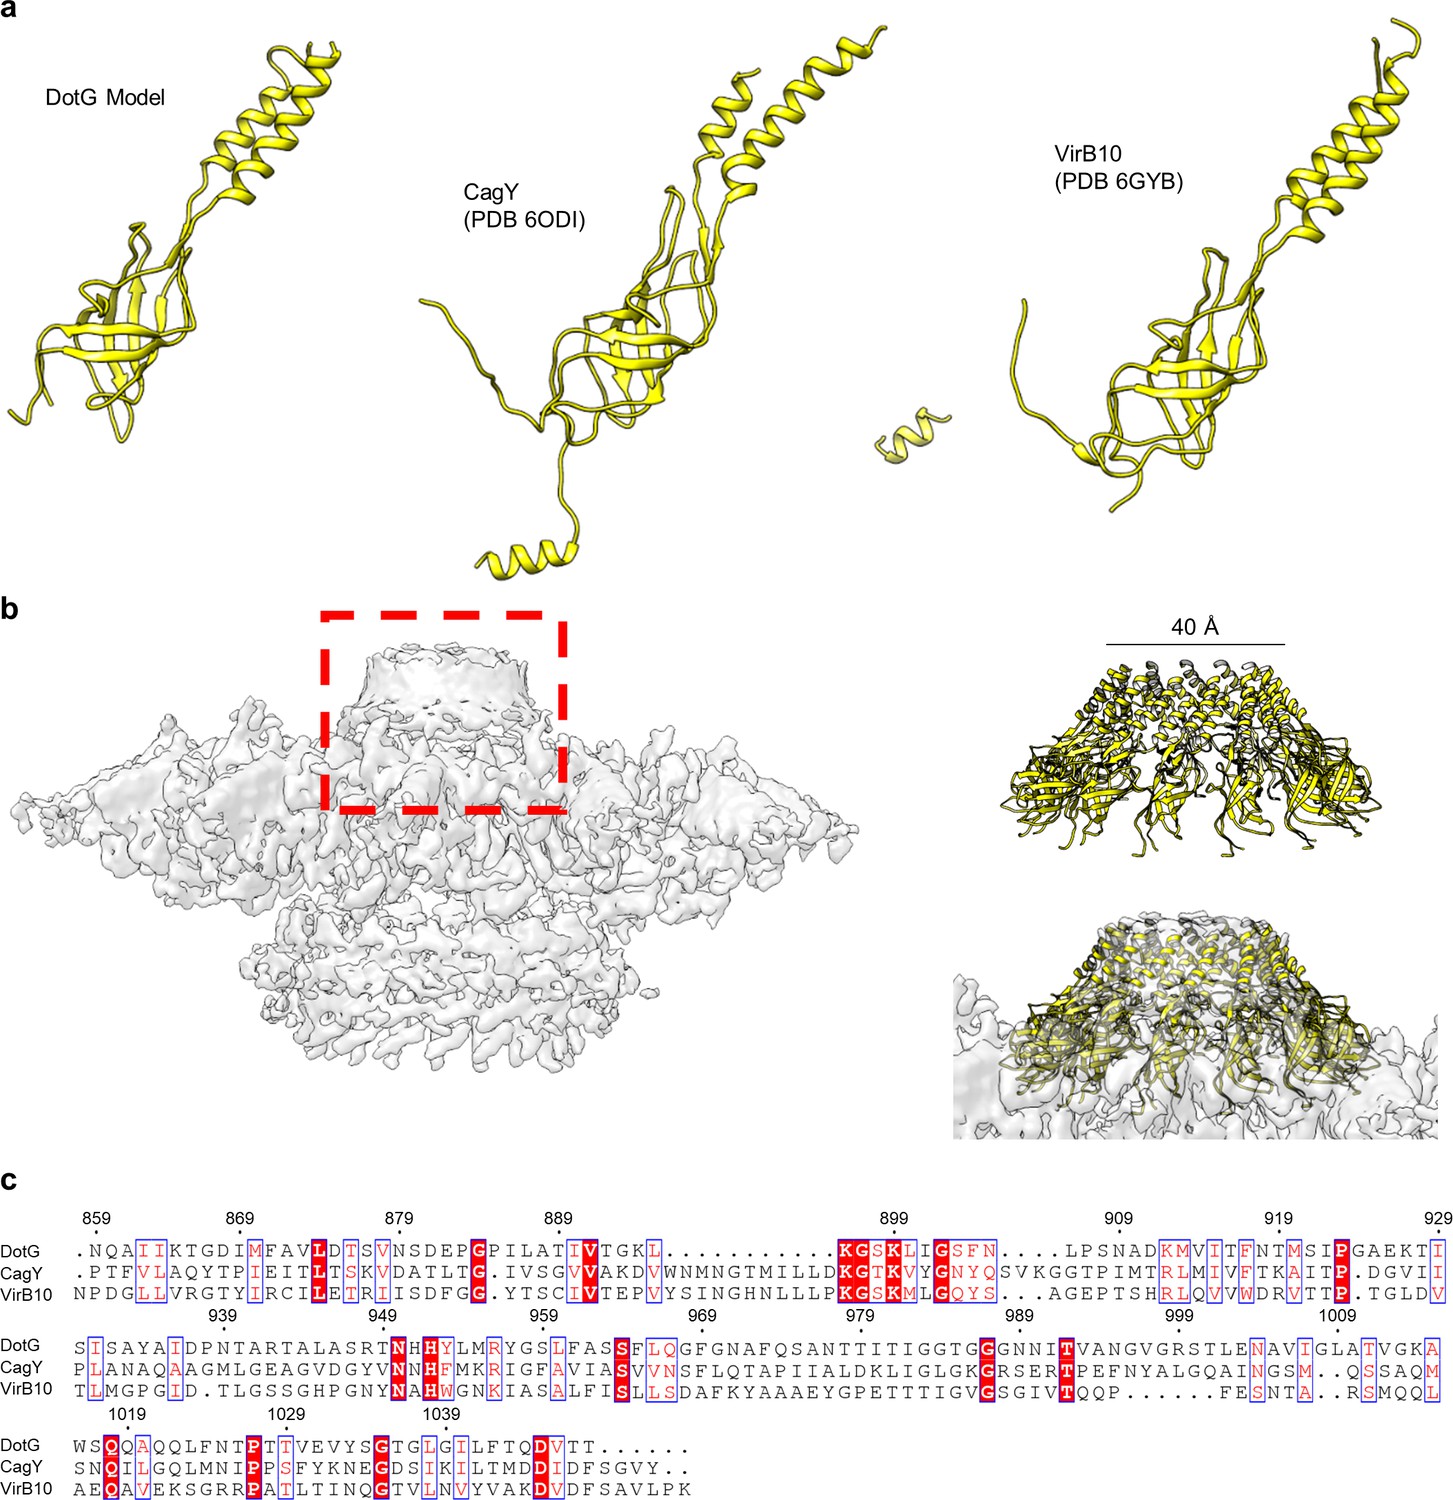
Homology model of proposed dome component DotG.
(a) The C-terminus of DotG is one of the few components of the Dot/Icm T4SS that is predicted to have homology to other systems, in this case to H. pylori CagY and X. citri VirB10. (b) Atop the OMC is a low-resolution dome that contains no clear symmetry (gray). A model of the C-terminus of DotG with C13 symmetry applied fits well into this dome suggesting a pore size of ~40 Å (yellow). (c) Sequence homology suggests the C-terminus of DotG is structurally similar to H. pylori CagY and X. citri VirB10.
Figure 9
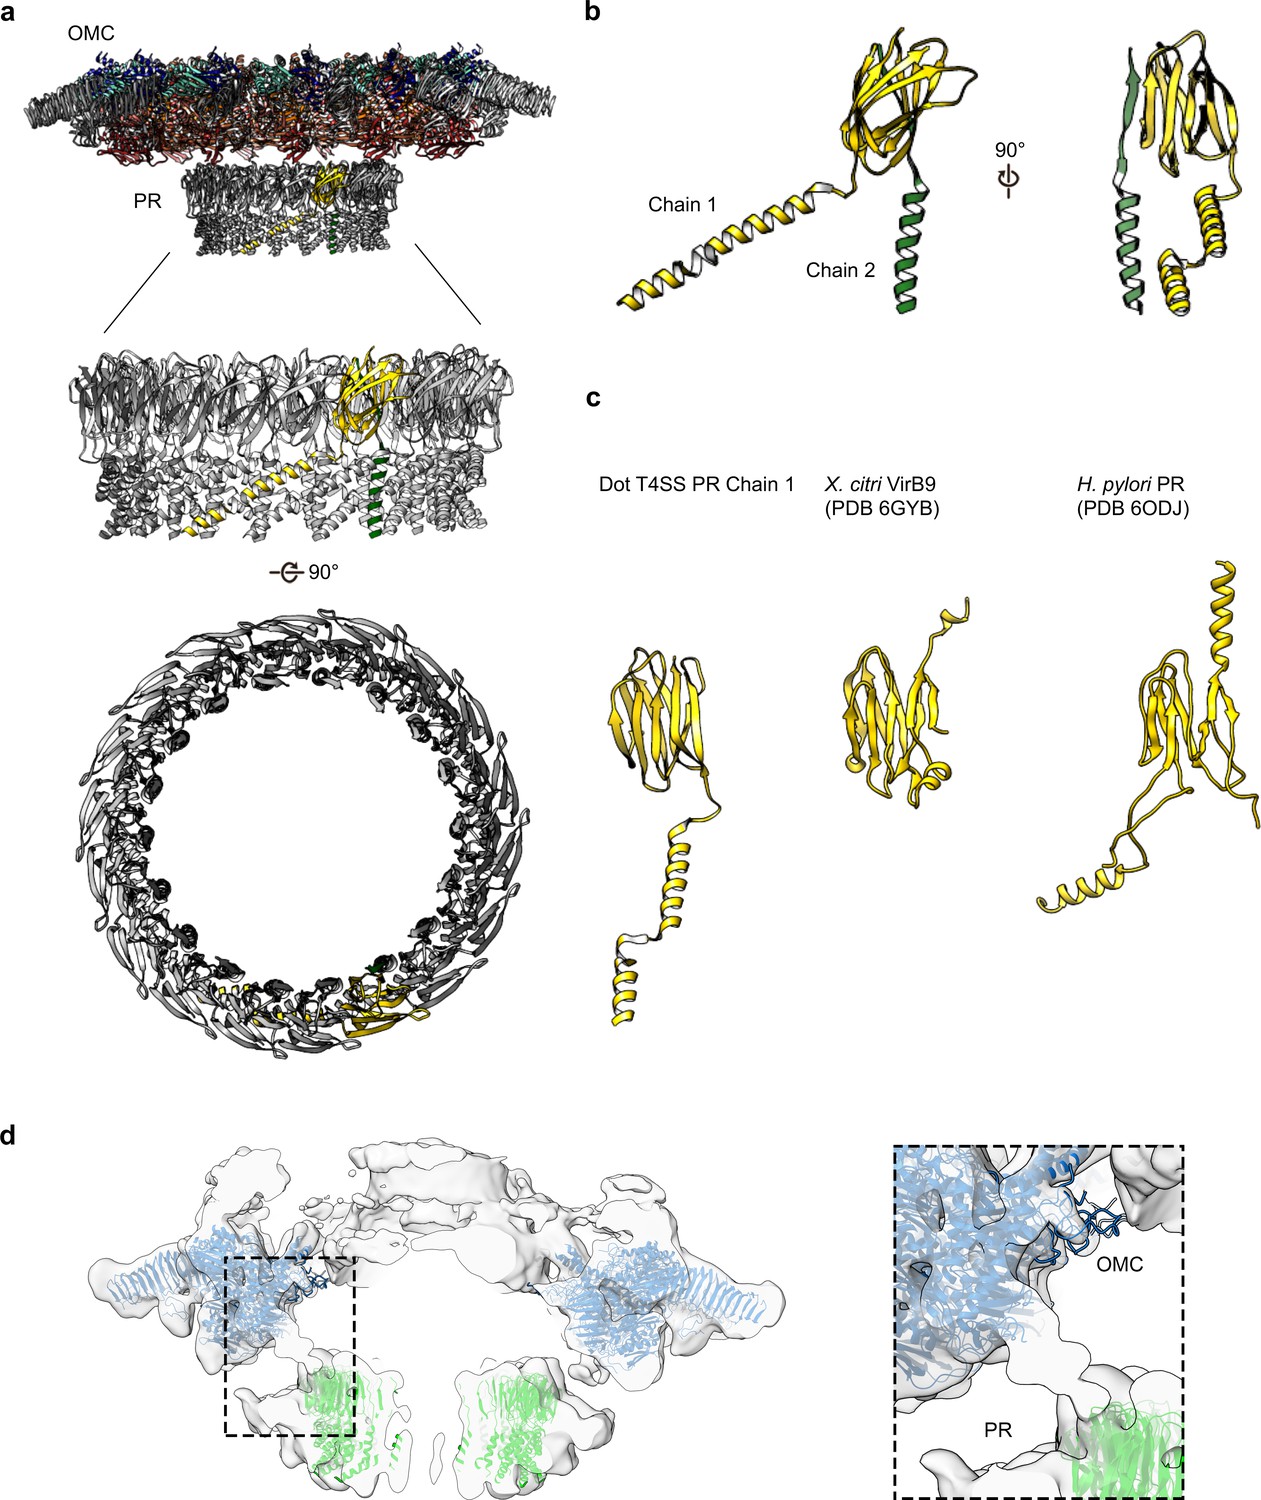
The PR of the Dot/Icm T4SS.
(a) The Dot/Icm T4SS is comprised of two features known as the outer membrane cap (OMC) and the periplasmic ring (PR). Within the asymmetric unit of the PR we have modeled two chains (shown in yellow and green). (b) Chain 1 of the PR, shown in yellow, consists of two β-sheets and two α-helices. Chain 2, shown in green, consists of one β-strand and one α-helix. (c) Chain 1 of the Dot/Icm T4SS contains a globular fold that is similar to the N-terminus of VirB9 from X. citri and the core fold of the polyalanine model that was modeled in the PR of the Cag T4SS from H. pylori. (d) The physical connection between the OMC disk (blue) and PR (green) is shown with atomic models fit into the cryoEM reconstruction with no symmetry applied (gray).
Figure 10
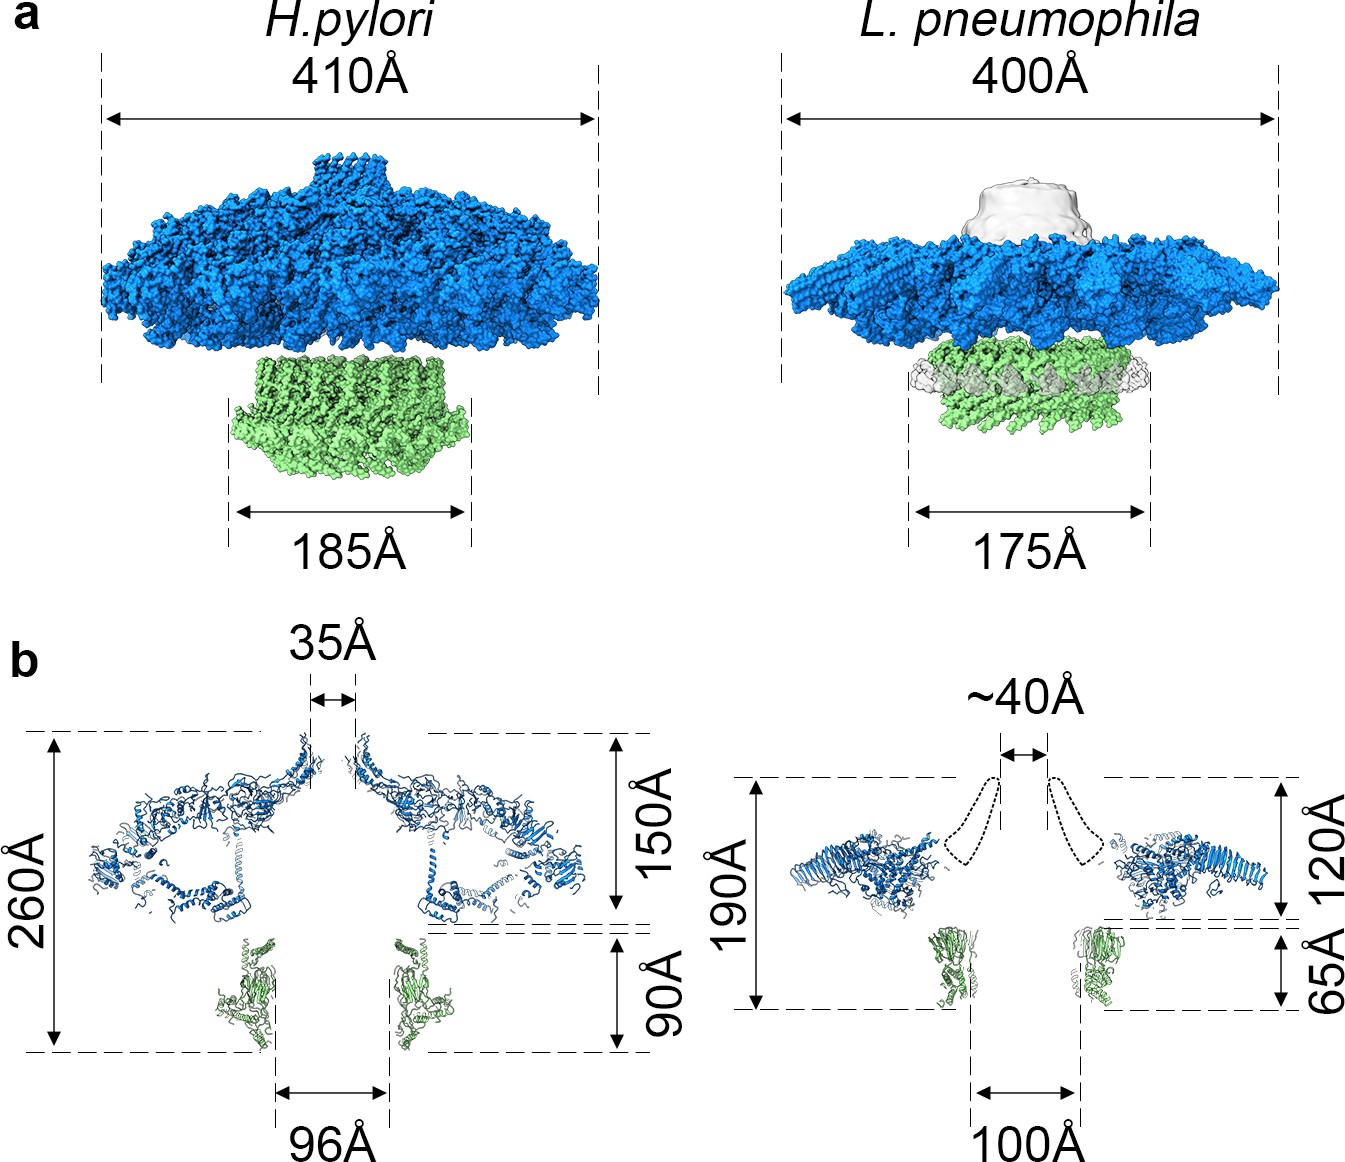
Comparison of H. pylori Cag T4SS and L. pneumophila Dot/Icm T4SS.
(a) Surface view of atomic models for Hp Cag T4SS (left) and Lp Dot/Icm T4SS (right). OMC, blue; PR, green. For Lp Dot/Icm T4SS, C1 EM density is shown in gray for density not included in atomic models. (b) Secondary structure of Hp Cag T4SS (left) and Lp Dot/Icm T4SS (right). For Lp Dot/Icm T4SS, dome region outline is shown as a dotted line.
Tables
Table 1
Dot proteins present in isolated complex sample isolated from wild type strain (Lp02).
| Spectral Counts† | ||||
|---|---|---|---|---|
| Identified proteins | Gene Number* | Prep 1 | Prep 2 | Prep 3 |
| DotG‡ | Q5ZYC1 | 112 | 114 | 195 |
| DotF | Q5ZYC0 | 94 | 69 | 101 |
| DotA | Q5ZS33 | 38 | 65 | 60 |
| DotO | Q5ZYB6 | 37 | 38 | 47 |
| DotH | Q5ZYC2 | 28 | 19 | 28 |
| IcmF | Q5ZYB4 | 15 | 18 | 36 |
| IcmX | Q5ZS30 | 19 | 13 | 28 |
| DotL | Q5ZYC6 | 10 | 26 | 20 |
| DotC | Q5ZS44 | 9 | 11 | 16 |
| DotD | Q5ZS45 | 11 | 9 | 14 |
| DotB | Q5ZS43 | 16 | 11 | 7 |
| Lpg0657 | Q5ZXS4 | 6 | 4 | 16 |
| DotM | Q5ZYC7 | 2 | 14 | 3 |
| DotK | Q5ZYC5 | 2 | 6 | 10 |
| IcmW | Q5ZS31 | 5 | 7 | 5 |
| DotN | Q5ZYB7 | 2 | 6 | 4 |
| DotI | Q5ZYC3 | 1 | 3 | 5 |
| IcmS | Q5ZYD0 | 4 | 1 | |
| IcmT | Q5ZYD1 | 1 | 1 | 3 |
| IcmV | Q5ZS32 | 1 | 1 | 2 |
-
*UniProtKB Accession Number.
†Proteins were identified by searching the MS/MS data against L. pneumophila (UniProt; 2930 entries) using Proteome Discoverer (v2.1, Thermo Scientific). Search parameters included MS1 mass tolerance of 10 ppm and fragment tolerance of 0.1 Da. False discovery rate (FDR) was determined using Percolator and proteins/peptides with a FDR of ≤1% were retained for further analysis. Complete results are in Supplementary file 1 in supplementary material.
-
‡Predicted core T4SS components and additional components identified in this structure are in bold.
Table 2
Dot proteins present in isolated complex sample isolated from ΔdotG deletion strain.
| Spectral Counts† | |||||
|---|---|---|---|---|---|
| Identified proteins | Gene Number* | Prep 1 | Prep 2 | Prep 3 | |
| IcmF | Q5ZYB4 | 28 | 85 | 72 | |
| DotA | Q5ZS33 | 20 | 94 | 63 | |
| IcmX | Q5ZS30 | 15 | 88 | 25 | |
| DotH‡ | Q5ZYC2 | 11 | 81 | 25 | |
| DotC | Q5ZS44 | 12 | 58 | 17 | |
| DotO | Q5ZYB6 | 16 | 27 | 38 | |
| Lpg0657 | Q5ZXS4 | 7 | 43 | 13 | |
| DotL | Q5ZYC6 | 8 | 15 | 32 | |
| DotB | Q5ZS43 | 10 | 23 | 13 | |
| DotK | Q5ZYC5 | 6 | 26 | 6 | |
| DotD | Q5ZS45 | 3 | 27 | 6 | |
| IcmW | Q5ZS31 | 5 | 9 | 9 | |
| DotI | Q5ZYC3 | 1 | 10 | 4 | |
| IcmV | Q5ZS32 | 2 | 1 | 11 | |
| DotU | Q5ZYB3 | 1 | 5 | 2 | |
| DotM | Q5ZYC7 | 0 | 2 | 6 | |
| IcmS | Q5ZYD0 | 2 | 2 | 4 | |
-
*UniProtKB Accession Number.
†Proteins were identified by searching the MS/MS data against L. pneumophila (UniProt; 2930 entries) using Proteome Discoverer (v2.1, Thermo Scientific). Search parameters included MS1 mass tolerance of 10 ppm and fragment tolerance of 0.1 Da. False discovery rate (FDR) was determined using Percolator and proteins/peptides with a FDR of ≤1% were retained for further analysis. The complete results are shown in Supplementary file 2 in the supplemental material.
-
‡Predicted core T4SS components and additional components identified in this structure are in bold.
Key resources table
| Reagent type (species) or resource | Designation | Source or reference | Identifiers | Additional information |
|---|---|---|---|---|
| Strain, strain background (Legionella pneumophila) | Lp02; WT | PMID:23717549 | ||
| Strain, strain background (Legionella pneumophila) | ΔdotG | This paper | ΔdotG deletion-insertion mutant | |
| Recombinant DNA reagent | pKD3 (plasmid) | Sigma Aldrich | RRID:AddGene_45604 | template plasmids for frt-flanked cat cassette |
| Sequence-based reagent | dotG-F | This paper | PCR primers | aaagcactccacctaagcctacag |
| Sequence-based reagent | dotG-R | This paper | PCR primers | aaaaattagccaagcccgacctg |
| Sequence-based reagent | dotG-P0 | This paper | PCR primers | aaatcatgcaactcaaggtagaagggttataa gcaaatgtgtgtaggctggagctgcttc |
| Sequence-based reagent | dotG-P2 | This paper | PCR primers | tatccgccatcaaattaaattgttgtaacatcct ggcatatgaatatcctccttagttcc |
| Commercial assay or kit | ProteoSilver Plus Silver Stain Kit | Sigma Aldrich | PROTSIL2-1KT | |
| Software, algorithm | Leginon | PMID:15890530 | ||
| Software, algorithm | MotionCor2 | PMID:28250466 | ||
| Software, algorithm | CTFFind4 | PMID:26278980 | ||
| Software, algorithm | cryoSPARC | PMID:28165473 | ||
| Software, algorithm | RELION | PMID:27685097 PMID:30412051 | ||
| Software, algorithm | Coot | PMID:20383002 | ||
| Software, algorithm | UCSF Chimera | PMID:15264254 PMID:29340616 | ||
| Software, algorithm | PHENIX | PMID:29872004 | ||
| Software, algorithm | DALI server | PMID:31263867 |
Appendix 1—table 1
Map reconstruction and model refinement.
| Cryo-EM data collection and processing | ||||
|---|---|---|---|---|
| EMDB accession codes | Dot/Icm T4SS OMC WT EMD-22068 | Dot/Icm T4SS PR WT EMD-22069 | Dot/Icm T4SS EMD-22070 | Dot/Icm T4SS OMC ΔDotG EMD-22071 |
| Data Collection and Processing | ||||
| Magnification | 18,000 | 18,000 | 29,000 | |
| Voltage (kV) | 300 | 300 | 300 | |
| Total Electron Dose (e-/Å2) | 58.1 | 58.1 | ~65.0 | |
| Defocus Range (µM) | −1 ~ −3 | −1 ~ −3 | −1.5 ~ −2.5 | |
| Pixel Size (Å) | 1.64 | 1.64 | 1.07 | |
| Processing Software | cryoSPARC/Relion | cryoSPARC /Relion | cryoSPARC/Relion | |
| Symmetry | C13 | C18 | C13 | |
| Initial Particles (number) | 771,806 | 771,806 | 120,367 | |
| Final Particles (number) | 12,200 | 6,850 | 6,342 | |
| Map Sharpening B Factor | −40.63 | −52.51 | −55.3 | |
| Map Resolution (Å) | 3.5 | 3.7 | 4.2 | |
| FSC Threshold | 0.143 | 0.143 | 0.143 | |
| Model Refinement and Validation | ||||
| Refinement | ||||
| Initial Model Used | 3ADY, 3LDT | N/A | N/A | N/A |
| Model Resolution | ||||
| FSC (0.5) | 3.4 | 3.9 | 3.6 | 7.3 |
| FSC (0.143) | 3.2 | 3.6 | 3.2 | 4.2 |
| Model Composition (Residues) | 15,548 | 3,168 | 18,716 | 15,548 |
| DotC | 58–161, 173–268 | - | 58–161, 173–268 | 58–161, 173–268 |
| DotD1 | 25–159 | - | 25-159 | 25-159 |
| DotD2 | 2–161 | - | 2–161 | 2–161 |
| DotH | 273–361 | - | 273–361 | 273–361 |
| DotK | 41–180 | - | 41–180 | 41–180 |
| Lpg0657 | 99–234 | - | 99–234 | 99–234 |
| Unk OMC Chain 1 | 1-70 | - | 1-70 | 1-70 |
| Unk OMC Chain 2 | 1–127 | - | 1–127 | 1–127 |
| Unk OMC Chain 3 | 1-52 | - | 1-52 | 1-52 |
| Unknown PR | - | 1–32, 1–144 | 1–32, 1–144 | - |
| Bond RMSD | ||||
| Bond Length (Å) | 0.014 | 0.007 | 0.01 | 0.016 |
| Bond Angle (°) | 1.868 | 1.06 | 1.27 | 1.723 |
| Validation | ||||
| Molprobity Score | 2.41 | 1.17 | 2.70 | 2.44 |
| Clashscore | 6.9 | 0.47 | 6.94 | 21.63 |
| Ramachandran (%) | ||||
| Favored | 91.5 | 91.5 | 92 | 87.7 |
| Allowed | 8.5 | 8.5 | 8 | 12.3 |
| Outliers | 0.0 | 0.0 | 0.0 | 0.0 |
| B Factor | 94.6 | 60.7 | 152.1 | 341.9 |
| PDB Accession Codes | 6 × 62 | 6 × 64 | 6 × 65 | 6 × 66 |
Additional files
-
Supplementary file 1
Proteins that copurify with Dot T4SS.
a UniProtKB Accession Number b Proteins were identified by searching the MS/MS data against L. pneumophila (UniProt; 2930 entries) using Proteome Discoverer (v2.1, Thermo Scientific). Search parameters included MS1 mass tolerance of 10 ppm and fragment tolerance of 0.1 Da. False discovery rate (FDR) was determined using Percolator and proteins/peptides with a FDR of ≤1% were retained for further analysis. c Dot/Icm T4SS components are in bold.
- https://cdn.elifesciences.org/articles/59530/elife-59530-supp1-v2.xlsx
-
Supplementary file 2
Proteins that copurify with ΔDotG T4SS.
aUniProtKB Accession Number bProteins were identified by searching the MS/MS data against L. pneumophila (UniProt; 2930 entries) using Proteome Discoverer (v2.1, Thermo Scientific). Search parameters included MS1 mass tolerance of 10 ppm and fragment tolerance of 0.1 Da. False discovery rate (FDR) was determined using Percolator and proteins/peptides with a FDR of ≤1% were retained for further analysis.cDot/Icm T4SS components are in bold.
- https://cdn.elifesciences.org/articles/59530/elife-59530-supp2-v2.xlsx
-
Transparent reporting form
- https://cdn.elifesciences.org/articles/59530/elife-59530-transrepform-v2.docx
Download links
A two-part list of links to download the article, or parts of the article, in various formats.
Downloads (link to download the article as PDF)
Open citations (links to open the citations from this article in various online reference manager services)
Cite this article (links to download the citations from this article in formats compatible with various reference manager tools)
Structural analysis of the Legionella pneumophila Dot/Icm type IV secretion system core complex
eLife 9:e59530.
https://doi.org/10.7554/eLife.59530


