Nonlinearities between inhibition and T-type calcium channel activity bidirectionally regulate thalamic oscillations
- Department of Pharmacology, University of Virginia, United States
- Department of Neurosurgery, Massachusetts General Hospital, United States
- Department of Psychology, Harvard University, United States
- Princeton Neuroscience Institute, Princeton University, United States
- Department of Neurology, Stanford University, United States
Figures
Figure 1
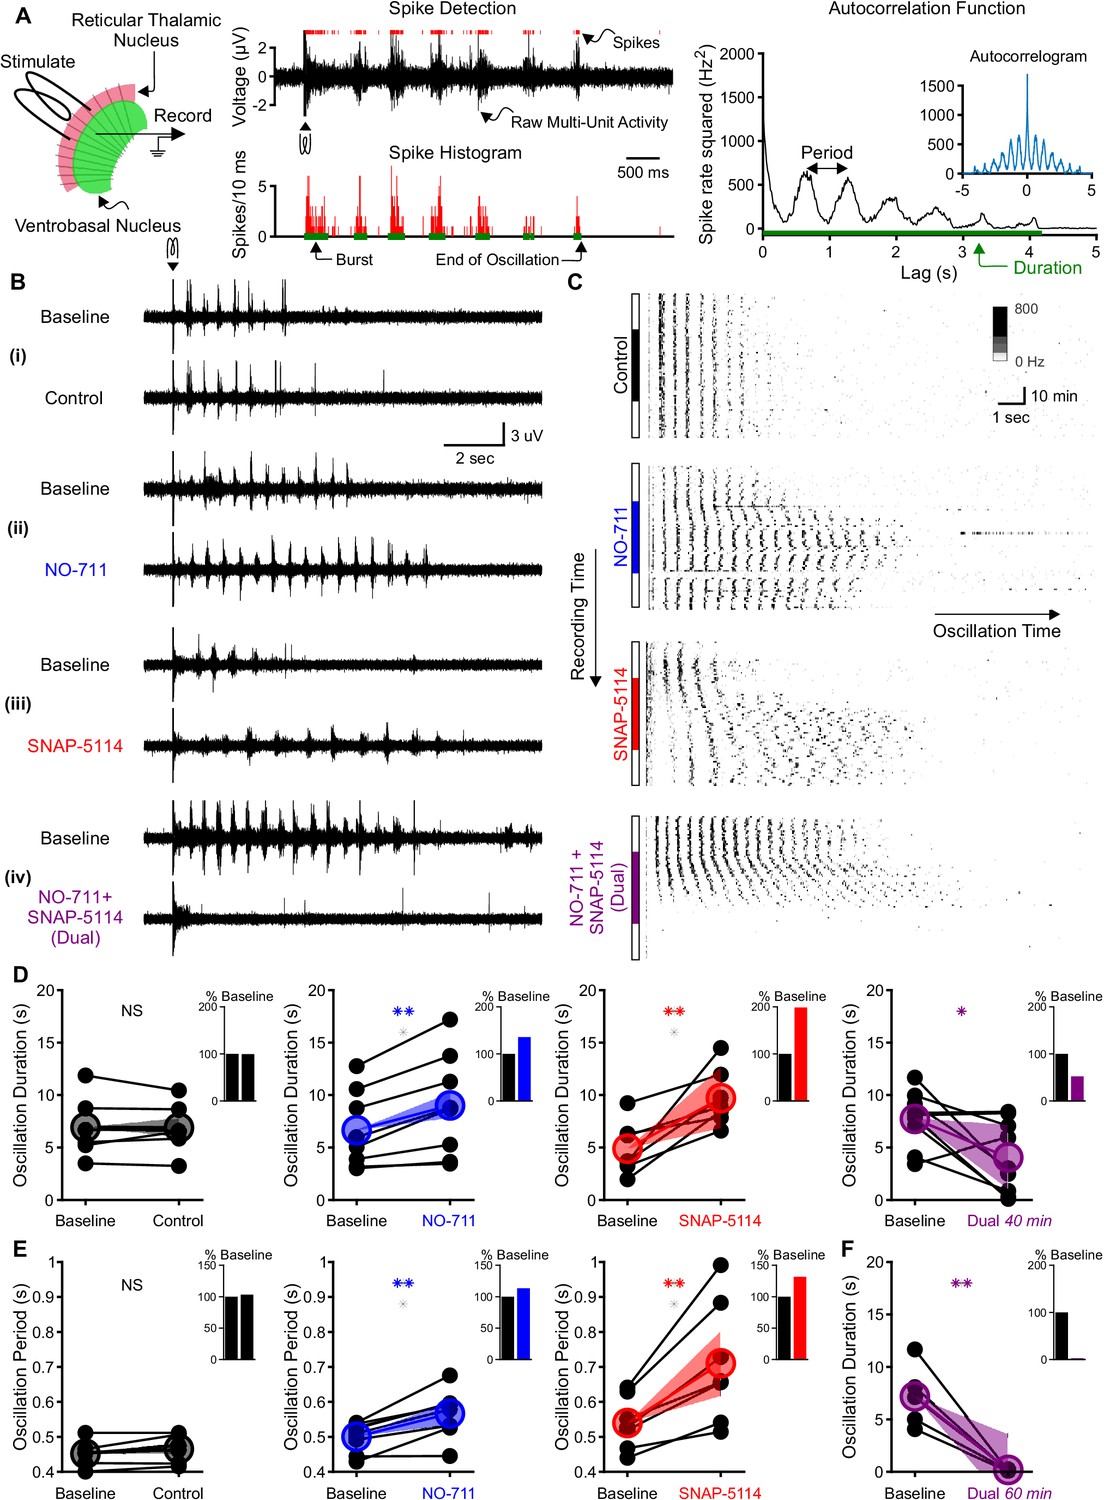
Individual GAT1 or GAT3 blockade strengthens thalamic oscillations, but dual GAT1+GAT3 blockade abolishes oscillations.
(A) Slice recording setup and sample analysis. Acute thalamic slices were bathed in bicuculline to block GABAA receptors. A brief voltage stimulus (0.5 ms, 10 V) was applied with a bipolar electrode placed in either the reticular thalamic nucleus or the adjacent internal capsule to evoke epileptiform oscillations recorded extracellularly in the ventrobasal complex. Spikes were detected, binned, and grouped into bursts. The oscillation duration was measured from the spike histogram and the oscillation period was computed from the autocorrelation function of binned spikes. (B) Example evoked epileptiform oscillations at baseline and 40 min after perfusing with (i) control (no drug added), (ii) 4 µM NO-711 (GAT1 blocker), (iii) 100 µM SNAP-5114 (GAT3 blocker) or (iv) dual 4 µM NO-711+100 µM SNAP-5114. (C) Example PSTHs over the entire course of a single control, GAT1-, GAT3-, and dual-block experiment. Oscillations were evoked every 60 s, but only the first 17 s after stimulation are shown. Drugs were perfused for 40 min after 20 min of baseline, followed by 20 min of washout. (D–F) Oscillation measures for all slices. Colored circles denote the mean value, colored lines denote the mean change; and shaded areas denote the 95% confidence intervals for the mean change. (D) Oscillation duration did not change following control perfusion, but increased following NO-711 or SNAP-5114 perfusion. Dual NO-711+SNAP-5114 perfusion reduced oscillation duration (*p<0.05, **p<0.01, paired-sample t-test). Inset shows mean change relative to baseline. (E) Oscillation period did not change following control perfusion and lengthened following NO-711 or SNAP-5114 perfusion (**p<0.01, paired-sample t-test). (F) After 60 min of dual NO-711 + SNAP-5114 perfusion, oscillations were abolished in all slices (**p<0.01, paired-sample t-test).
-
Figure 1—source data 1
Oscillation measures in response to different GABA transporter blockade conditions.
Oscillation durations for each slice that was perfused with control, NO-711 (GAT1 blockade), SNAP-5114 (GAT3 blockade) or combined NO-711+ SNAP-5114 (dual blockade) (Figure 1D). Oscillation periods for each slice that was perfused with control, NO-711 or SNAP-5114 (Figure 1E). Oscillation durations for each slice that was perfused with combined NO-711+ SNAP-5114 for 60 min (Figure 1F). Phase 1 is baseline and phase 2 is drug perfusion.
- https://cdn.elifesciences.org/articles/59548/elife-59548-fig1-data1-v2.zip
Figure 2 with 1 supplement
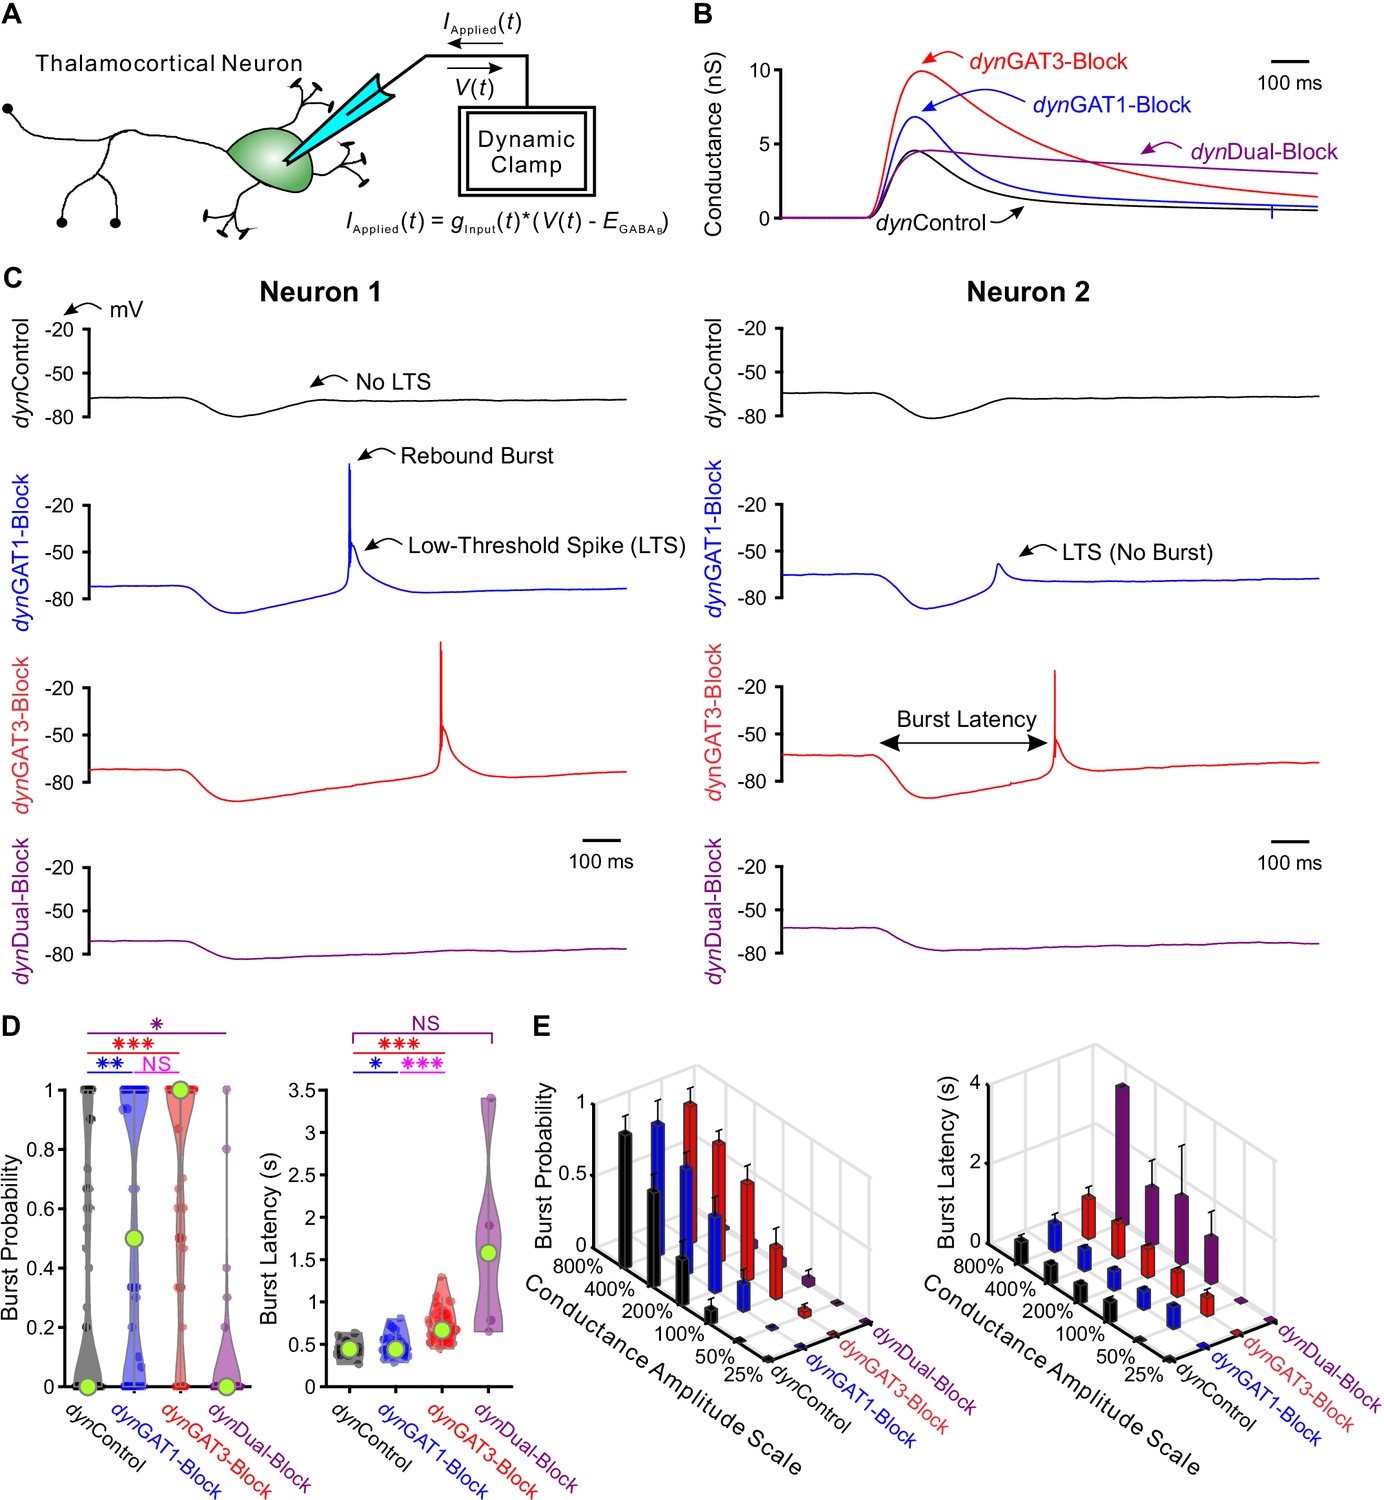
Post-inhibitory, low-threshold rebound spikes and bursts in thalamocortical neurons are bidirectionally modulated by GABAB receptor-mediated conductance waveforms.
(A) Dynamic clamp setup. A thalamocortical neuron was patched in the whole-cell configuration. The applied current was computed from the instantaneous voltage and a command conductance waveform over time to simulate GABAB receptor activation. (B) Command GABAB receptor conductance waveforms (dynIPSCs, amplitudes scaled by 200%) that emulated different GAT blockade conditions based on GABAB IPSCs isolated with voltage clamp (Beenhakker and Huguenard, 2010). (C) Sample voltage responses of two neurons to the four different dynIPSCs shown in (B). (D) Distributions of post-inhibitory rebound burst measures over all 47 recorded neurons across dynIPSCs shown in (B). For burst latency, only responsive neurons are included. Relative to dynControl responses, rebound burst probability increased following either dynGAT1- or dynGAT3-Block, but decreased following dynDual-Block (*p<0.05, **p<0.01, ***p<0.001, Friedman’s test for burst probability, repeated-measures ANOVA and paired-sample t-test for burst latency). (E) Mean burst measures over all 47 recorded neurons, across four different dynIPSC waveforms and six different conductance amplitude scales. Error bars denote 95% confidence intervals.
-
Figure 2—source data 1
LTS and burst features in response to IPSCs recorded with dynamic clamp (dynIPSCs).
Analyzed LTS and burst features for each recorded IPSC response. Averaged LTS and burst features for each neuron, for dynIPSCs scaled by 200% (Figure 2D, Figure 2—figure supplement 1B). Averaged LTS and burst features for each neuron, for dynIPSCs across all conductance amplitude scales (Figure 2E, Figure 2—figure supplement 1C).
- https://cdn.elifesciences.org/articles/59548/elife-59548-fig2-data1-v2.zip
Figure 2—figure supplement 1
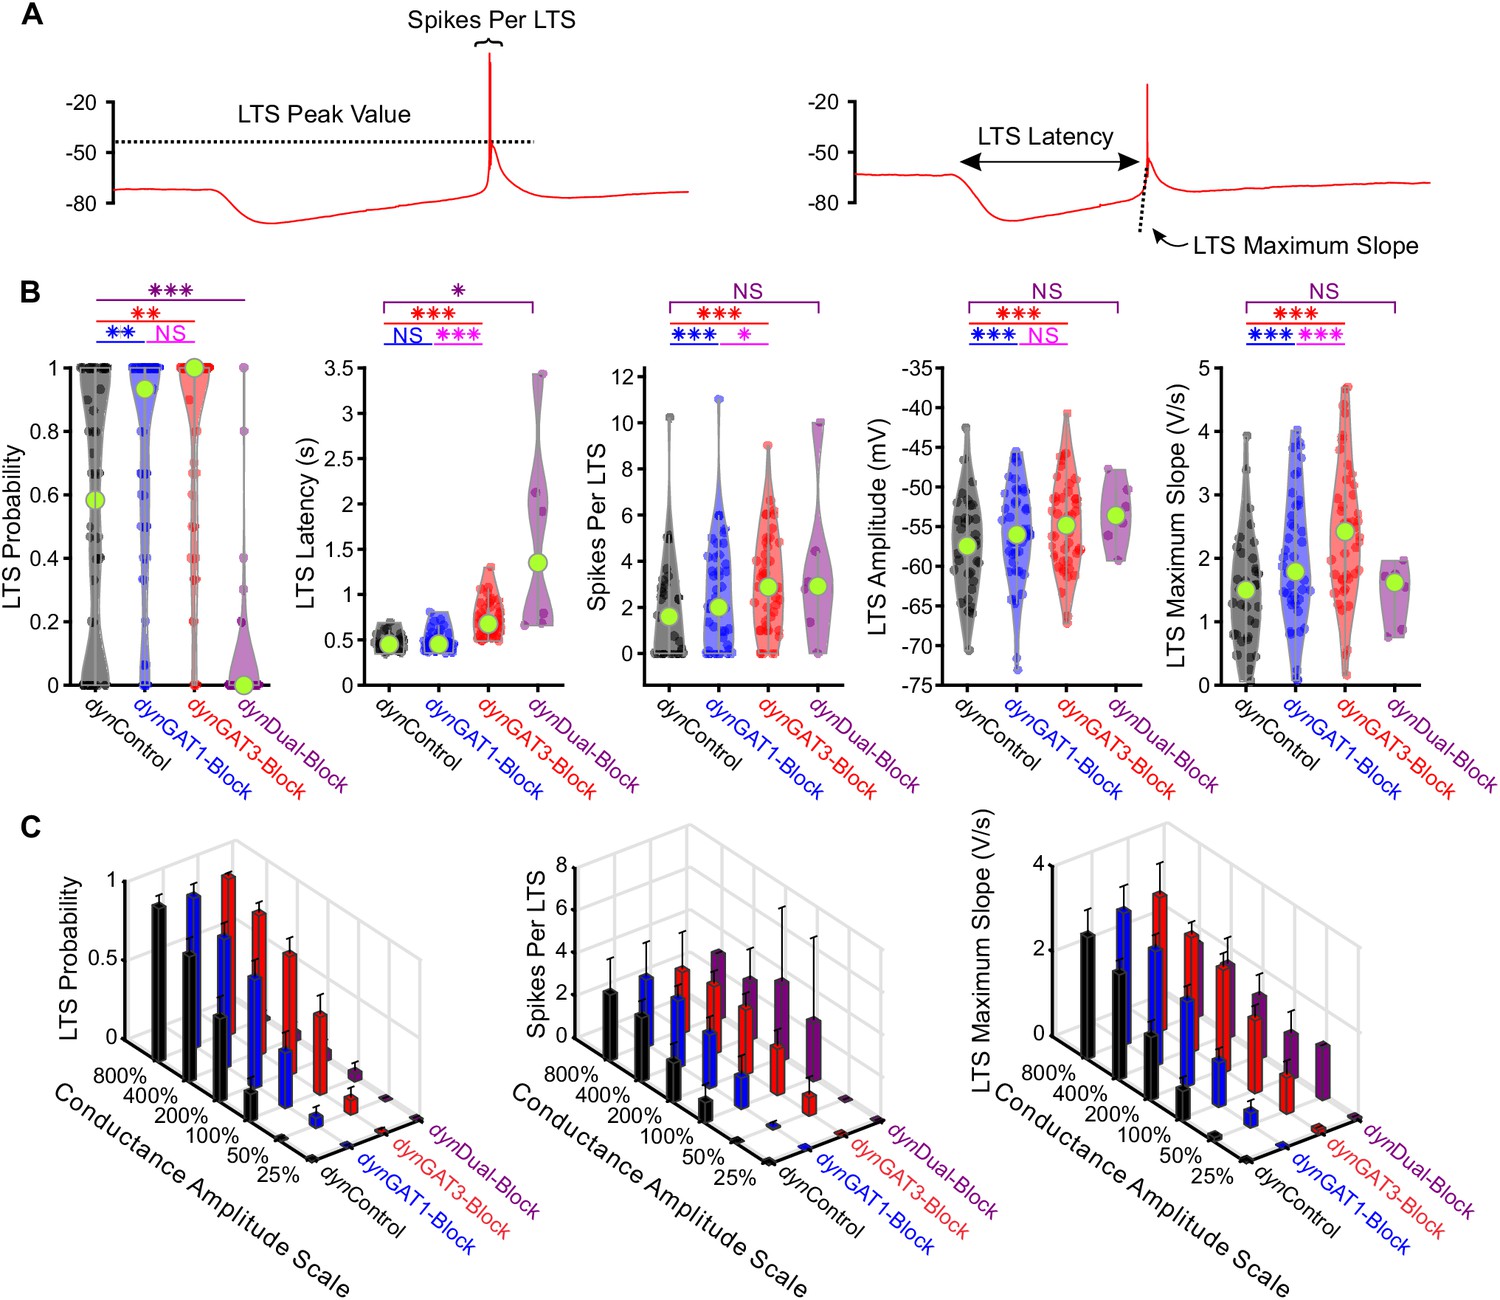
Post-inhibitory, low-threshold rebound spikes and bursts in thalamocortical neurons are bidirectionally modulated by GABAB receptor-mediated conductance waveforms.
(A) Depiction of post-inhibitory rebound LTS measures in (B) and (C). (B) Distributions of post-inhibitory rebound LTS measures over all 47 recorded neurons across dynIPSCs shown in Figure 2B. For LTS features, only responsive neurons are included. (*p<0.05, **p<0.01, ***p<0.001, Friedman’s test for LTS probability and latency, repeated-measures ANOVA otherwise). (C) Mean LTS measures over all 47 recorded neurons, across four different dynIPSC waveforms and six different conductance amplitude scales. Error bars denote 95% confidence intervals.
Figure 3 with 1 supplement
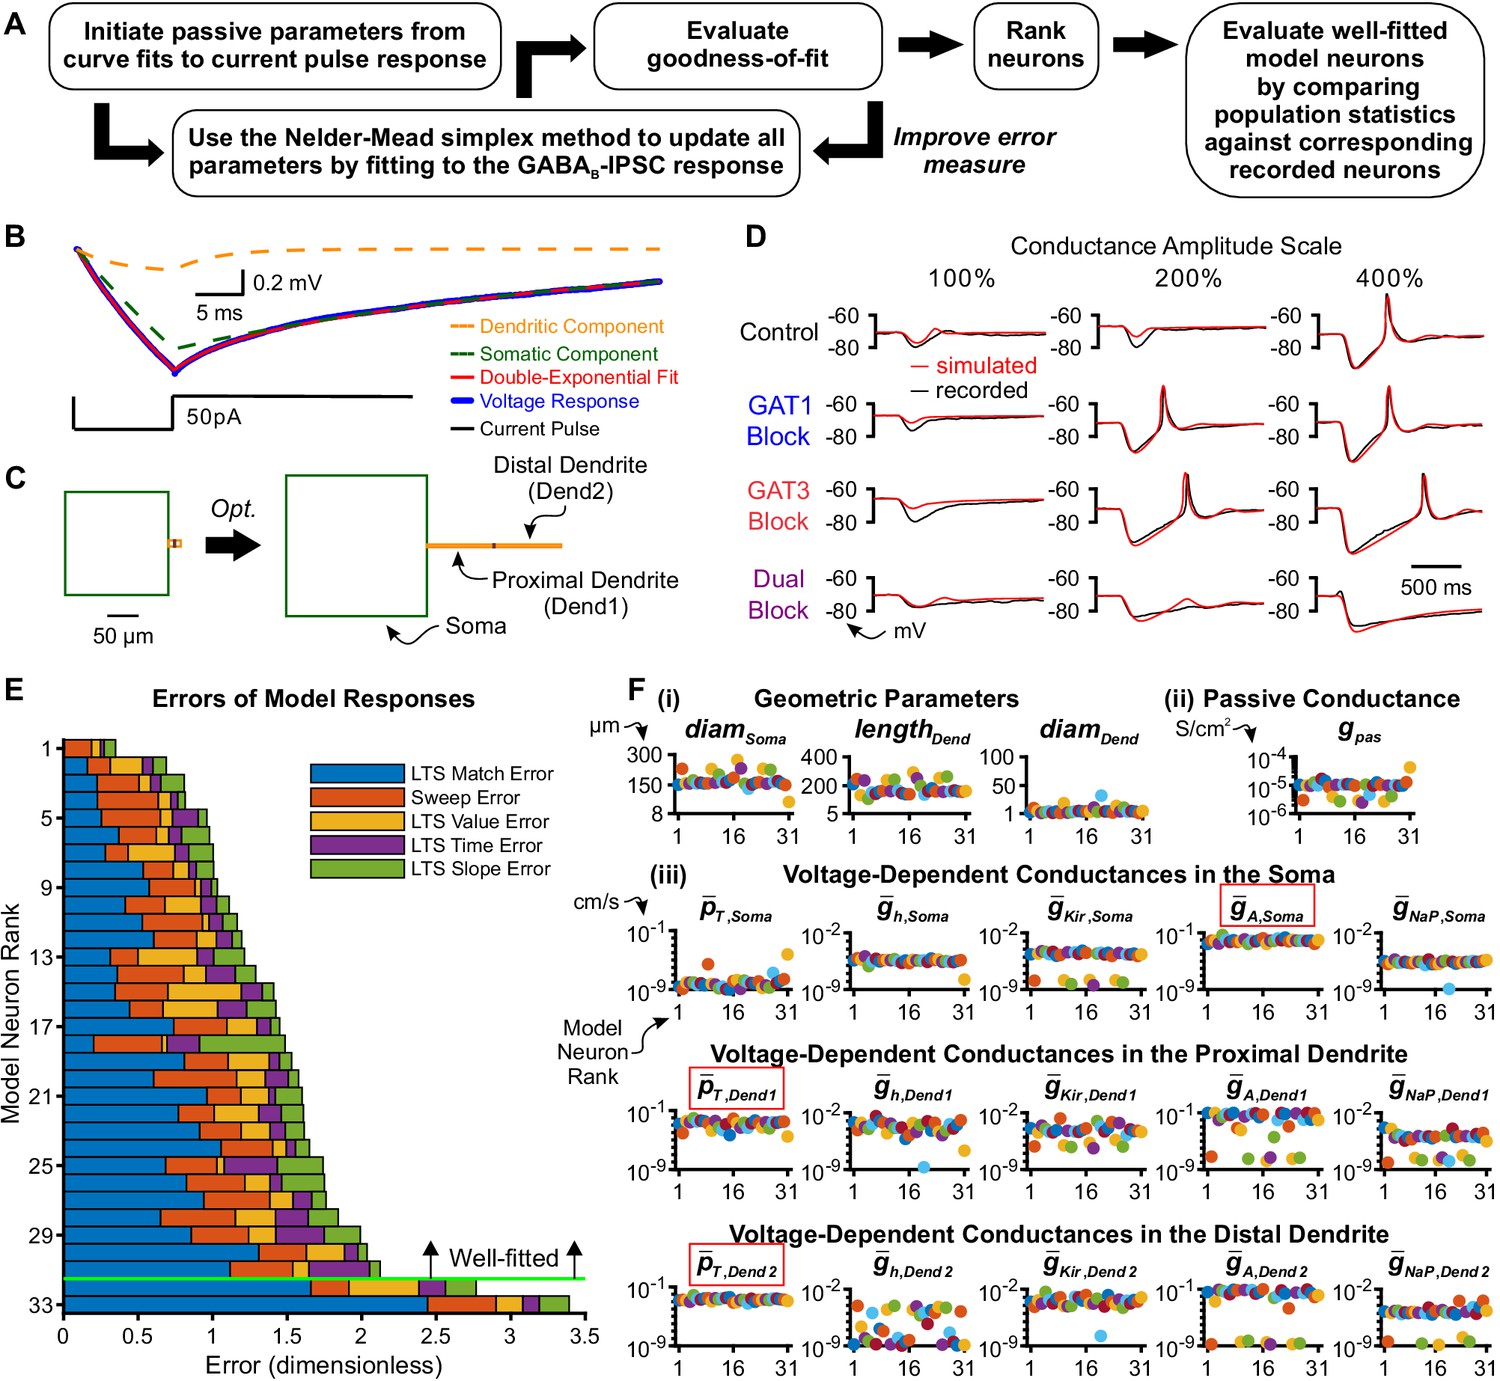
Model thalamocortical neurons reproduce GABAB IPSC and rebound responses.
(A) Model optimization workflow. (B) Sample double-exponential curve fits (red) to averaged current pulse responses (blue) for an example neuron. The dashed lines correspond to the curves representing the somatic compartment (green) and dendritic compartment (orange). (C) Ball-and-stick geometries estimated from the two exponential components shown in (B) (Johnston and Wu, 1994) were converted to cylindrical, three compartment models (left), which were then optimized (right). (D) Fits of simulated simIPSC responses to recorded dynIPSC responses, for the same example neuron. (E) The 33 model neurons that underwent optimization were ranked by a weighted average of five different types of errors (see Materials and methods). The 31 highest ranked model neurons were considered well-fitted. The example neuron in (D) had rank 6. (F) Final values of parameters that could vary for the 31 well-fitted model neurons. Note that the T channel density is invariably high in the dendrites and the A-type potassium channel density is invariably high in the soma among all model neurons (red boxes). Geometric parameters are in µm, maximal conductance densities () and conductance densities () are in S/cm2 and maximal permeability densities () are in cm/s. The x axis is the model neuron rank in (E). We distinguish among (i) geometric parameters, (ii) voltage-independent passive parameters and (iii) voltage-dependent active parameters.
-
Figure 3—source data 1
Parameters and errors for optimized model thalamocortical neurons.
- https://cdn.elifesciences.org/articles/59548/elife-59548-fig3-data1-v2.zip
Figure 3—figure supplement 1
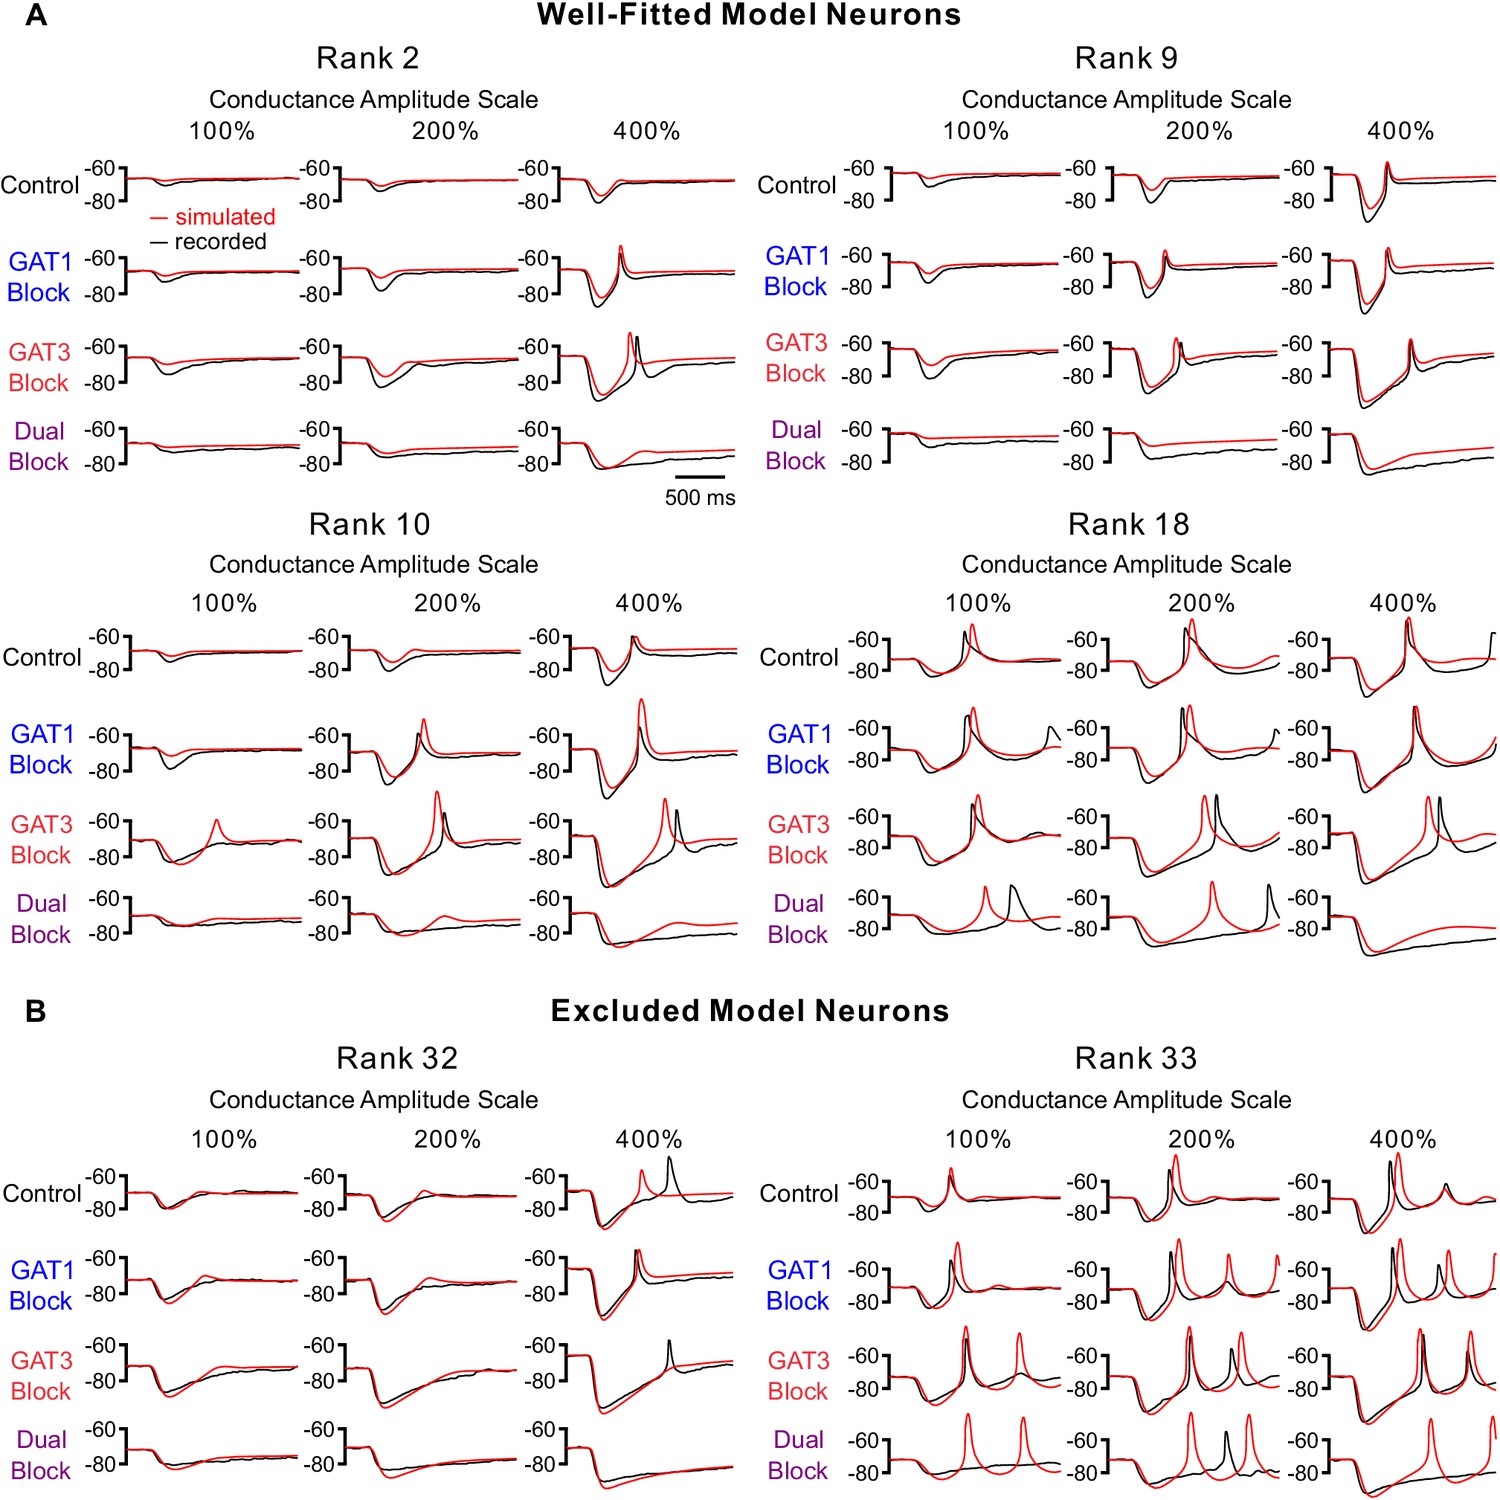
Additional fits of simulated simIPSC responses to recorded dynIPSC responses for selected neurons.
(A) Additional fits for well-fitted model neurons. Neuron ranks correspond to those in Figure 3E. Note that we only show 12 of the 60–180 comparisons used to derive the total error shown in Figure 3E. (B) Fits for excluded model neurons. Rank 32 appears to be well fitted in root-mean-square error. However, this neuron was excluded because of a high LTS match error. As our primary interest was resolving how dynamic inhibition influenced LTS production, we weighed LTS match more heavily.
Figure 4 with 1 supplement
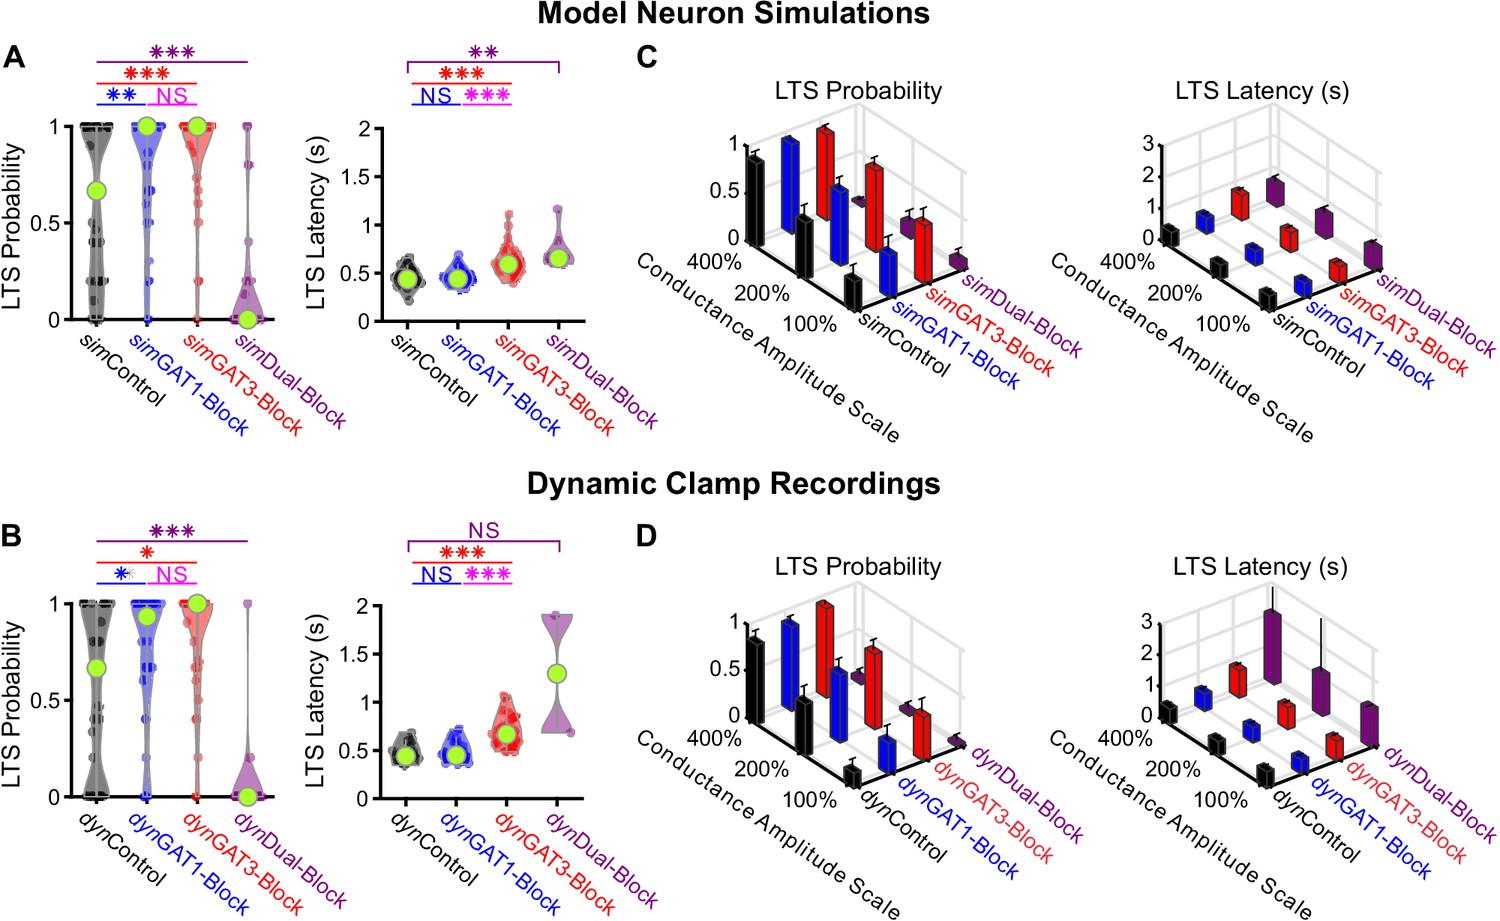
Well-fitted model and recorded neurons show similar low-threshold rebound spike probabilities and latencies in response to different GABAB IPSC waveforms.
(A) Distributions of post-inhibitory, low-threshold rebound spike measures over the 31 well-fitted model neurons across GABAB IPSC waveforms shown in Figure 2B (*p<0.05, **p<0.01, ***p<0.001, repeated-measures ANOVA for LTS probability, Friedman’s test for LTS latency). (B) Same as (A) but for the corresponding 31 recorded neurons (Friedman’s test). (C) Mean low-threshold rebound spike measures over all 31 model neurons, across four different GABAB IPSC waveforms and three different conductance amplitude scales. Error bars denote 95% confidence intervals. (D) Same as (C) but for the corresponding 31 recorded neurons.
-
Figure 4—source data 1
Simulated and recorded LTS and burst features across well-fitted neurons.
Analyzed LTS and burst features for each simulated IPSC response with fast sodium-potassium mechanism (HH2.mod) inserted. Averaged LTS and burst features for each recorded and model neuron, for dynIPSCs scaled by 200% (Figure 4A–B, Figure 4—figure supplement 1A–B). Averaged LTS and burst features for each recorded and model neuron, for dynIPSCs across all conductance amplitude scales (Figure 4C–D, Figure 4—figure supplement 1C–D).
- https://cdn.elifesciences.org/articles/59548/elife-59548-fig4-data1-v2.zip
Figure 4—figure supplement 1
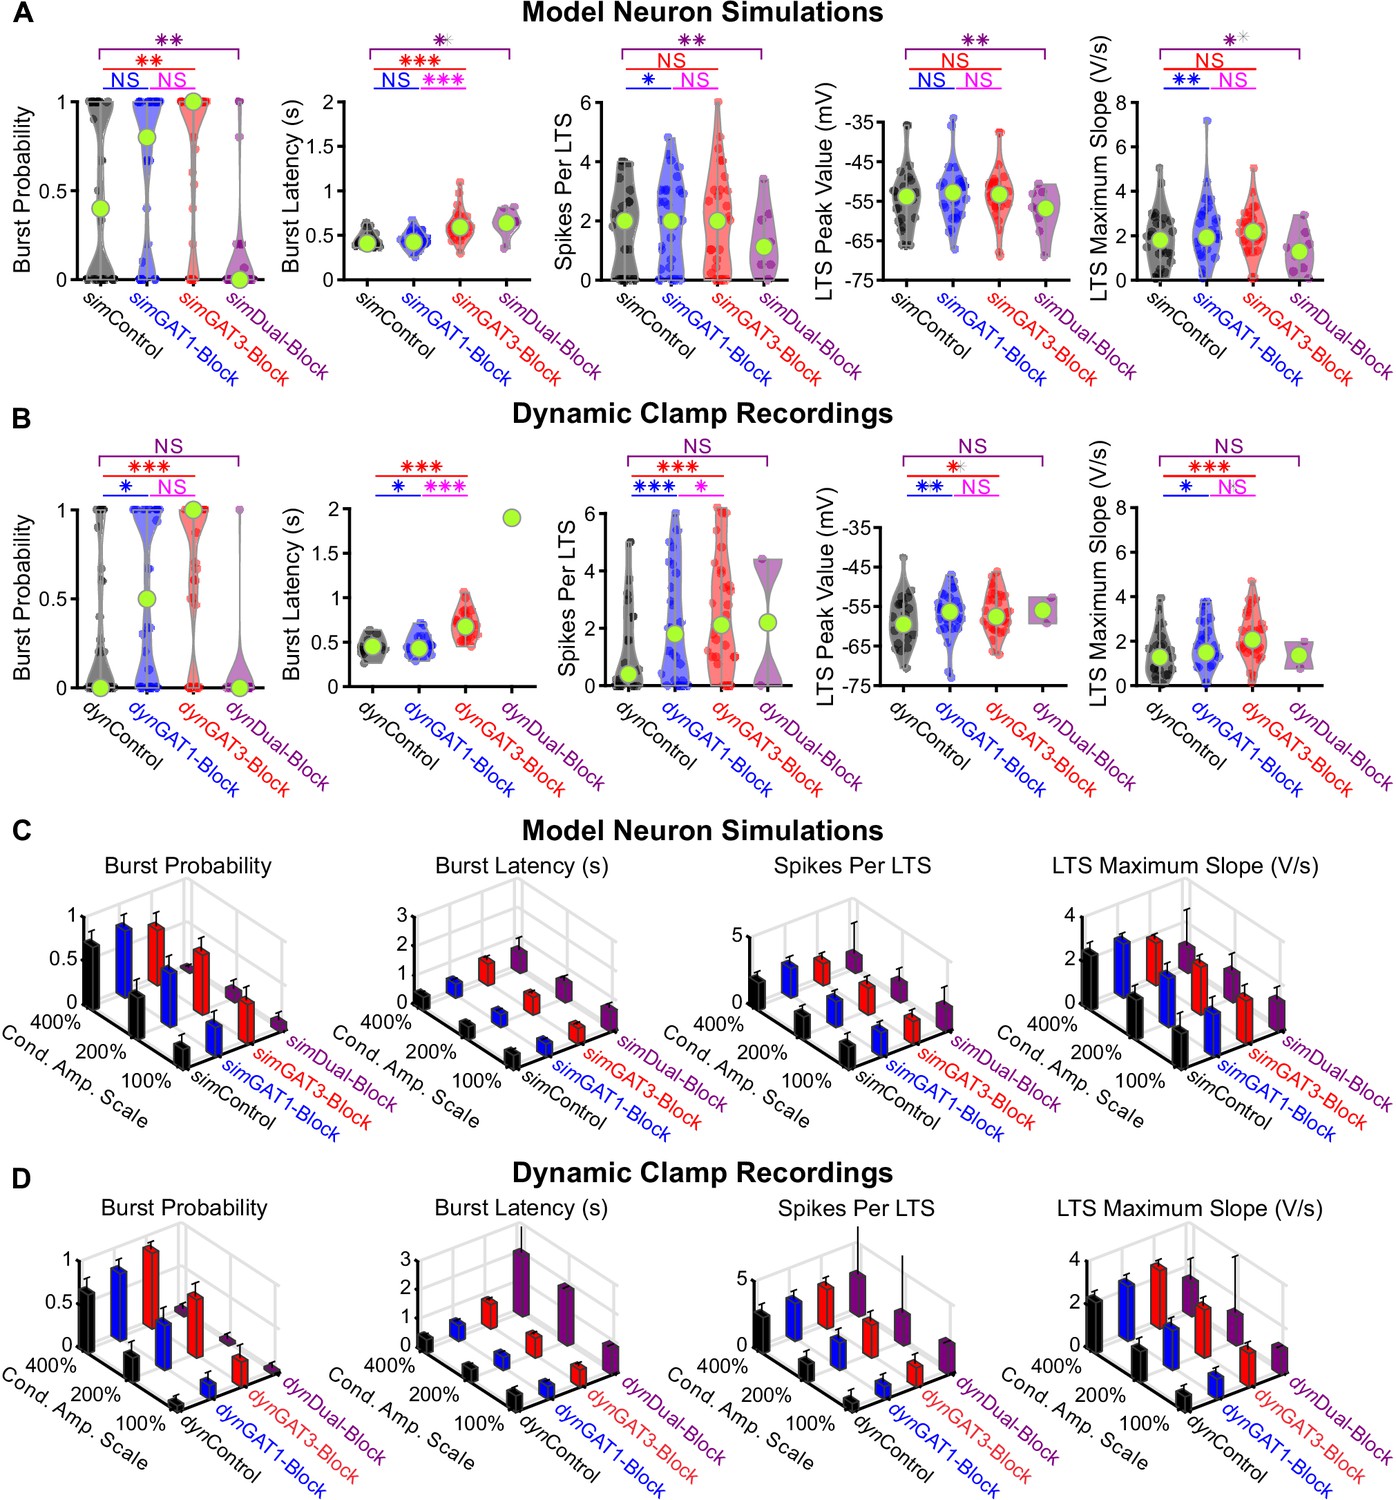
Comparison of other low-threshold rebound spike or rebound burst measures between well-fitted model and recorded neurons.
(A) Distributions of LTS or burst measures over the 31 well-fitted model neurons across GABAB IPSC waveforms shown in Figure 2B (*p<0.05, **p<0.01, ***p<0.001, Friedman’s test). (B) Same as (A) but for the corresponding 31 recorded neurons (Repeated-measures ANOVA for burst latency, spikes per LTS and LTS peak value, Friedman’s test otherwise). (C) Mean LTS or burst measures over all 31 model neurons, across four different GABAB IPSC waveforms and three different conductance amplitude scales. Error bars denote 95% confidence intervals. (D) Same as (C) but for the corresponding 31 recorded neurons.
Figure 5 with 1 supplement
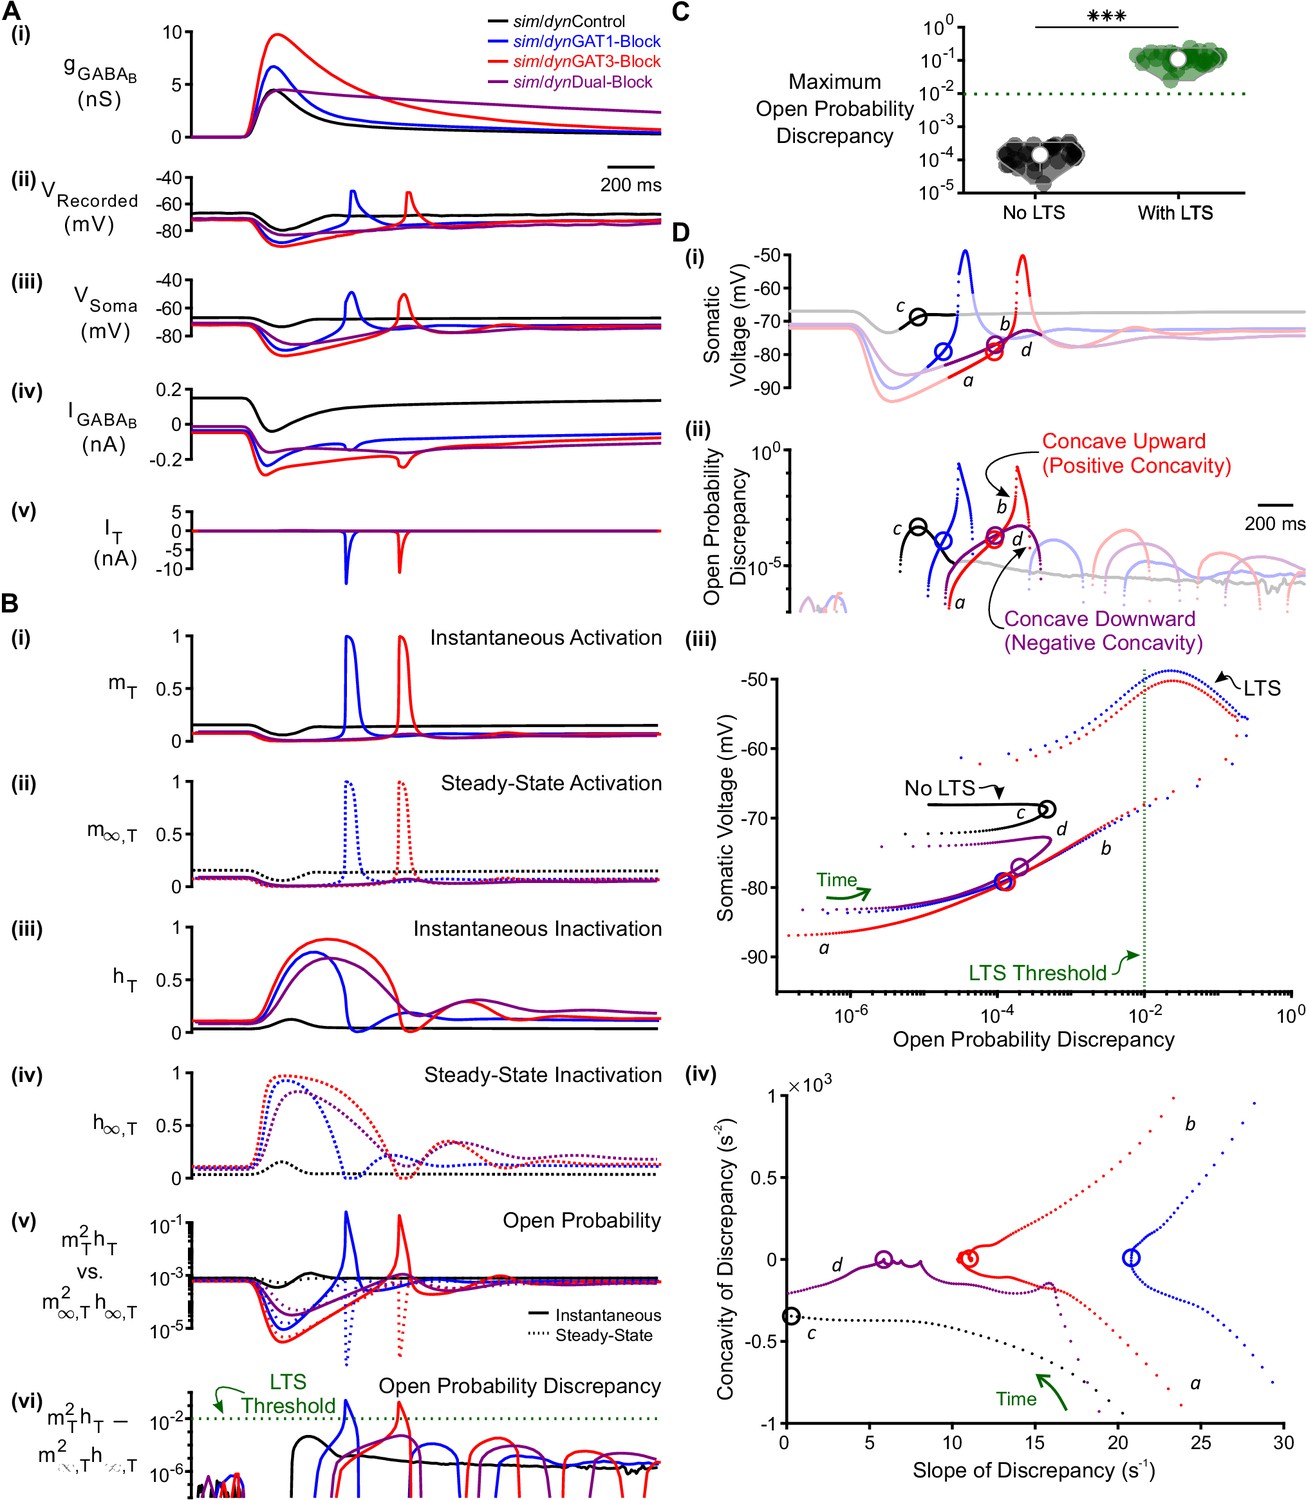
T-type calcium channel open probability discrepancy predicts LTS production following GABAB IPSC waveforms.
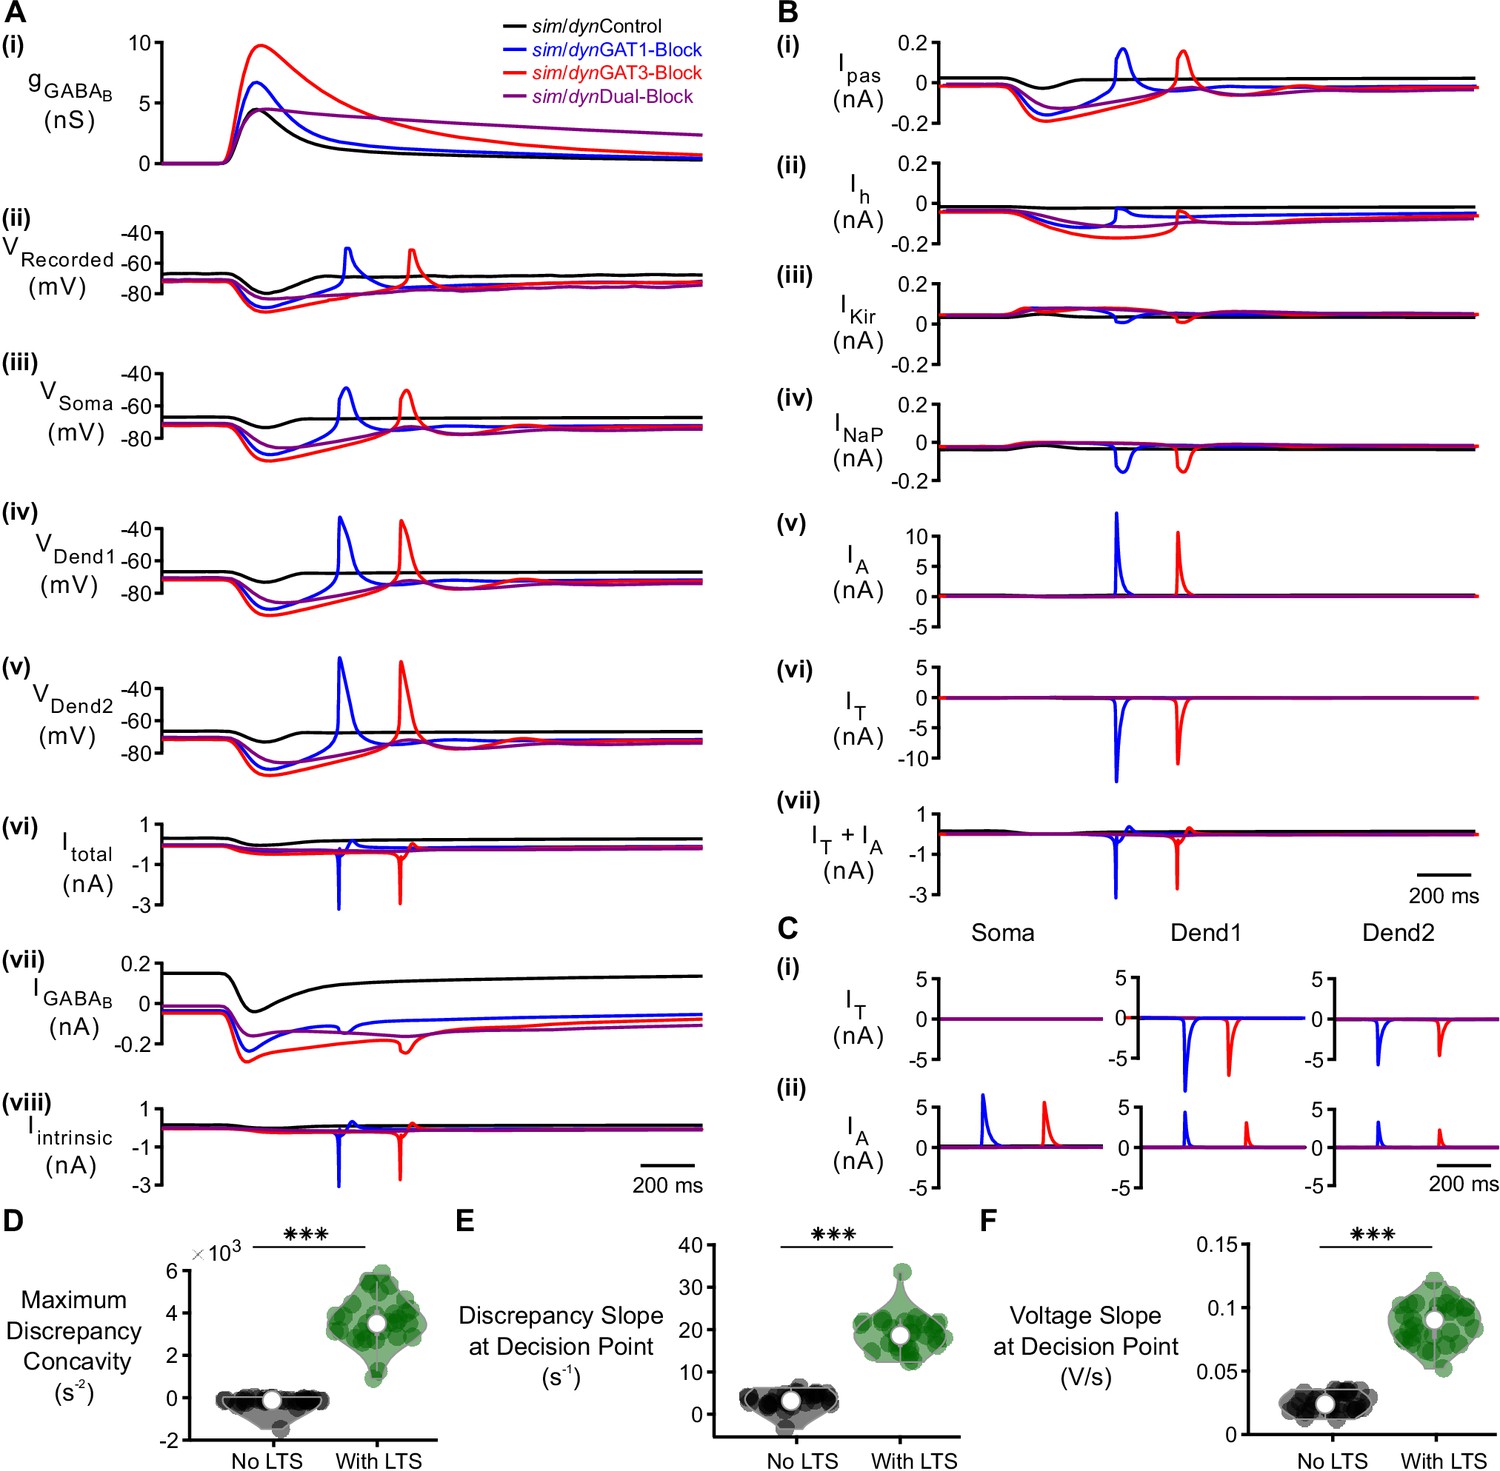
(A) The LTS response was correlated with the presence of large T-type calcium currents. (i) Command sim/dynIPSCs as in Figure 2B. (ii) Voltage responses of Neuron 1 of Figure 2C recorded using dynamic clamp. (iii-v) Simulated responses of the corresponding model neuron (same as Figure 3D), including: (iii) somatic voltage, (iv) GABAB receptor current, (v) T current. Currents were summed over all three compartments. (B) A combination of T channel activation (high ), T channel recovery (high ) and inactivation lag ( different from ) appeared to be necessary for T channel opening ( much higher than ). State variables for the distal dendritic T channel (other two compartments are similar), including: (i) instantaneous activation gating variable, (ii) steady-state activation gating variable, (iii) instantaneous inactivation gating variable, (iv) steady-state inactivation gating variable, (v) instantaneous open probability (solid line) versus steady-state open probability (dotted line), (vi) difference of instantaneous versus steady-state open probability (open probability discrepancy). Note that only positive discrepancies are plotted. The green dotted line here [also in (C) and (D) (iii) ] denotes the observed LTS threshold. (C) The maximum open probability discrepancy was higher in LTS-producing responses (***p<0.001, n = 31 cells, paired-sample t-test). (D) Within the first voltage peak following hyperpolarization highlighted in both (i) somatic voltage curves and (ii) dendritic T channel open probability discrepancy curves, LTS-producing responses followed trajectories different from LTS-lacking responses in either (iii) the voltage vs. open probability discrepancy phase plot or (iv) the concavity versus slope of discrepancy phase plot. The slope and concavity are the first and second derivatives of log10(open probability discrepancy), respectively. Sample points plotted are 1 ms apart. Circles denote the decision points where either zero (or maximal negative) concavity is reached in the open probability discrepancy curves. Labels a, b, c, d are explained in the text.
-
Figure 5—source data 1
Open probability discrepancy measures for all simulated traces.
Analyzed open probability discrepancy measures and LTS features for each simulated IPSC response with no fast sodium-potassium mechanism inserted. These are averaged for each model thalamocortical neuron, for traces with and without an LTS (Figure 5C, Figure 5—figure supplement 1).
- https://cdn.elifesciences.org/articles/59548/elife-59548-fig5-data1-v2.zip
Figure 5—figure supplement 1
Detailed analysis of factors contributing to LTS production following GABAB IPSCs.
(A) The LTS response was present across all three compartments, appeared largest in the distal dendrite and correlated with the presence of large intrinsic channel currents. (i) Command sim/dynIPSCs as in Figure 2B. (ii) Voltage responses of Neuron 1 of Figure 2C recorded using dynamic clamp. (iii-viii) Simulated responses of the corresponding model neuron (same as Figure 3D), including: (iii) somatic voltage, (iv) proximal dendritic voltage, (v) distal dendritic voltage, (vi) total current, (vii) GABAB receptor current, (viii) total intrinsic channel current. Currents were summed over all three compartments. (B) T-type calcium currents and A-type potassium currents were at least an order of magnitude larger than other intrinsic currents, with the T currents contributing to LTS initiation. The temporal overlap between the T and A currents has been shown to be important for controlling the LTS amplitude and width (Pape et al., 1994; Pape and McCormick, 1995; Amarillo et al., 2014). Intrinsic currents were summed over all three compartments and include: (i) passive leak current, (ii) hyperpolarization-activated cationic current, (iii) inward-rectifying potassium current, (iv) persistent sodium current, (v) A-type fast-transient potassium current, (vi) T-type calcium current. A sum of A and T currents is shown in (vii) and resembled (A) (viii). (C) Comparison of A and T currents across compartments. T currents were much larger in the dendrites and A currents were slightly elevated in the soma. The dominance of T-type calcium current in dendritic compartments is consistent with experimental findings (Munsch et al., 1997; Williams and Stuart, 2000; Zhou et al., 1997) and prior models (Destexhe et al., 1998). (D) The maximum open probability discrepancy concavity in the LTS region, (E) the slope of open probability discrepancy at the decision point, and (F) the slope of somatic voltage at the decision point were all higher in LTS-producing responses (***p<0.001, n = 31 cells, paired-sample t-test).
Figure 6

Manipulation of the T-type calcium channel inactivation time constant modulates LTS production.
(A) Simulated responses as in Figure 5 with the T channel inactivation time constant halved. The T channel open probability discrepancy failed to reach threshold and no LTS was produced following any simIPSC waveform. The green dotted line denotes the observed LTS threshold from Figure 5C. In the voltage vs. open probability discrepancy phase plot, only the first voltage peak following hyperpolarization is shown. (B) Simulated responses as in Figure 5 with doubled. The T channel open probability discrepancy increased and LTSs appeared following simDual-Block. Note that there is still no LTS produced following simControl.
Figure 7 with 1 supplement
Manipulation of GABAB IPSC kinetics bidirectionally modulates low-threshold rebound spike production.
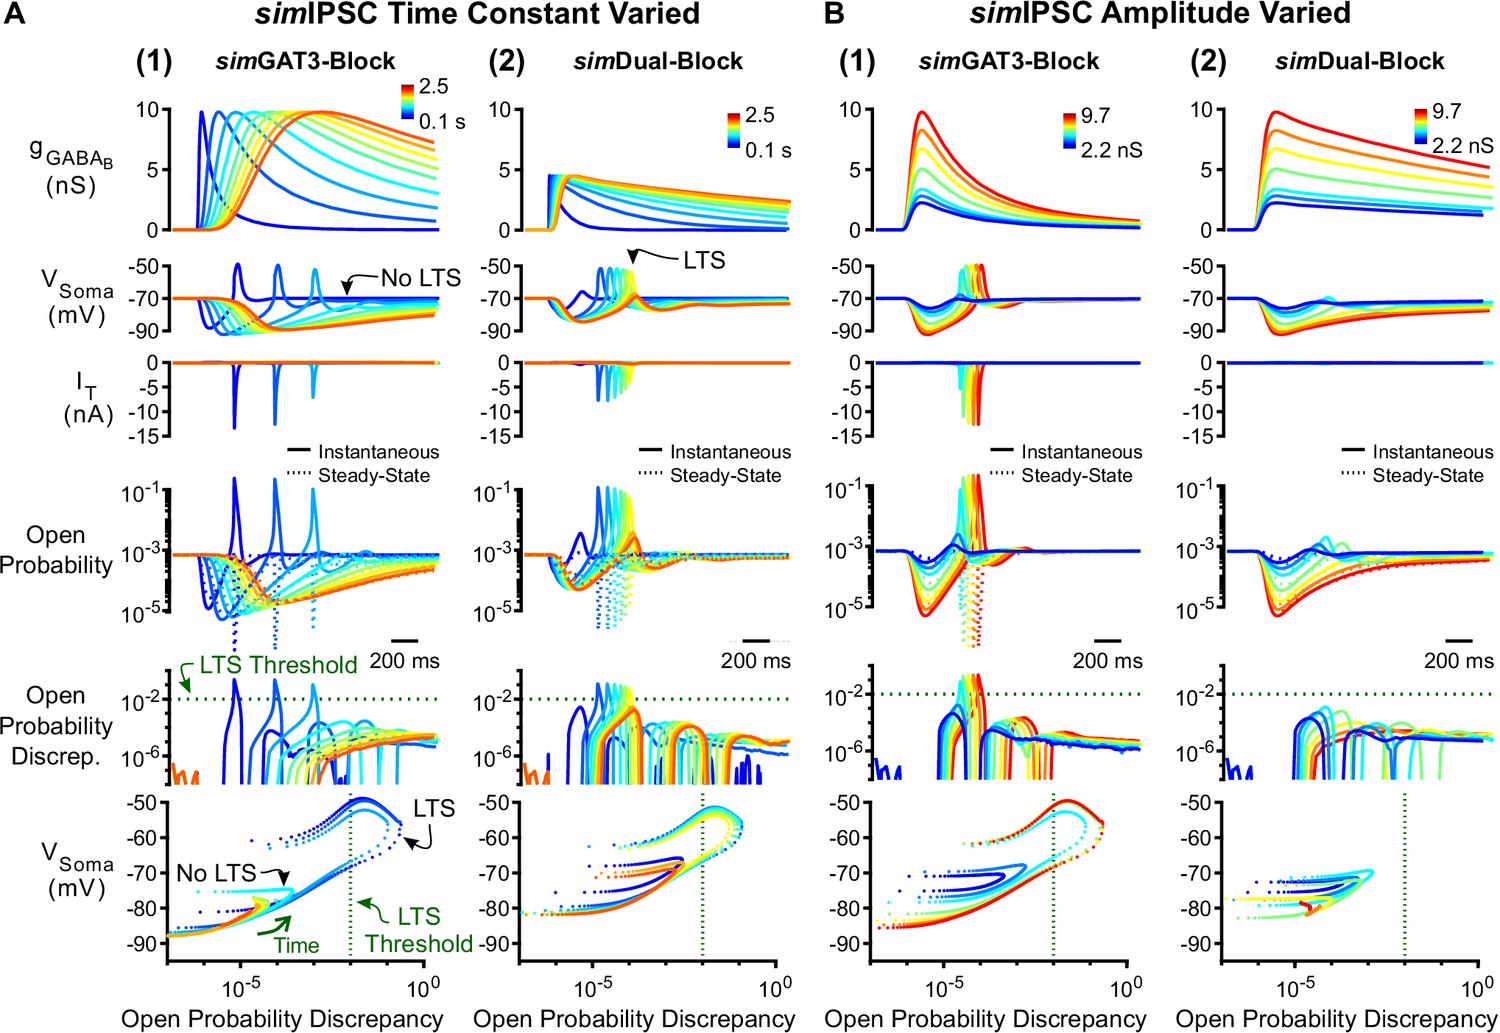
(A) (1) LTS responses to the simGAT3-Block waveform (blue) gradually disappeared as the time constant was increased (with amplitude fixed) to that of the simDual-Block waveform (red). The green dotted line denotes the observed LTS threshold from Figure 5C. (2) LTS responses to the sDual-Block waveform (red) gradually appeared as the time constant of the waveform was decreased (with amplitude fixed) to that of the sGAT3-Block waveform (blue). (B) (1) LTS responses gradually appeared as the amplitude of the simGAT3-Block waveform was increased (with time constant fixed). (2) Robust LTS responses never appeared as the amplitude of the simDual-Block waveform is increased (with time constant fixed). This panel provides an explanation for the stark contrast between dynGAT3-Block and dynDual-Block in Figure 2E.
Figure 7—figure supplement 1
Manipulation of GABAB IPSC kinetics controlled for overall level of inhibition modulates low-threshold rebound spike production.
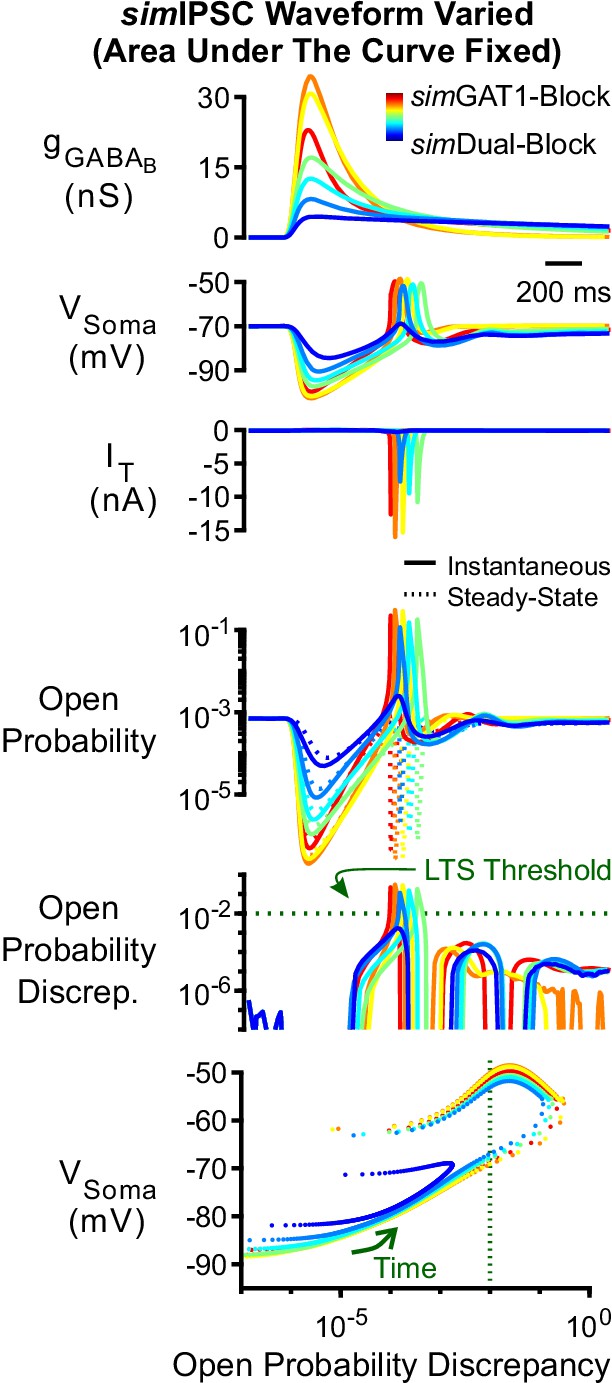
LTS responses to the simDual-Block waveform (blue) gradually appeared as all parameters of the waveform were shifted (with area under the curve fixed) to that of the simGAT3-Block waveform (yellow), then to the simGAT1-Block waveform (dark red). The green dotted line denotes the observed LTS threshold from Figure 5C.
Figure 8 with 1 supplement
GABAB-receptor mediated conductance waveforms modulate oscillations produced by two-cell model thalamic networks.
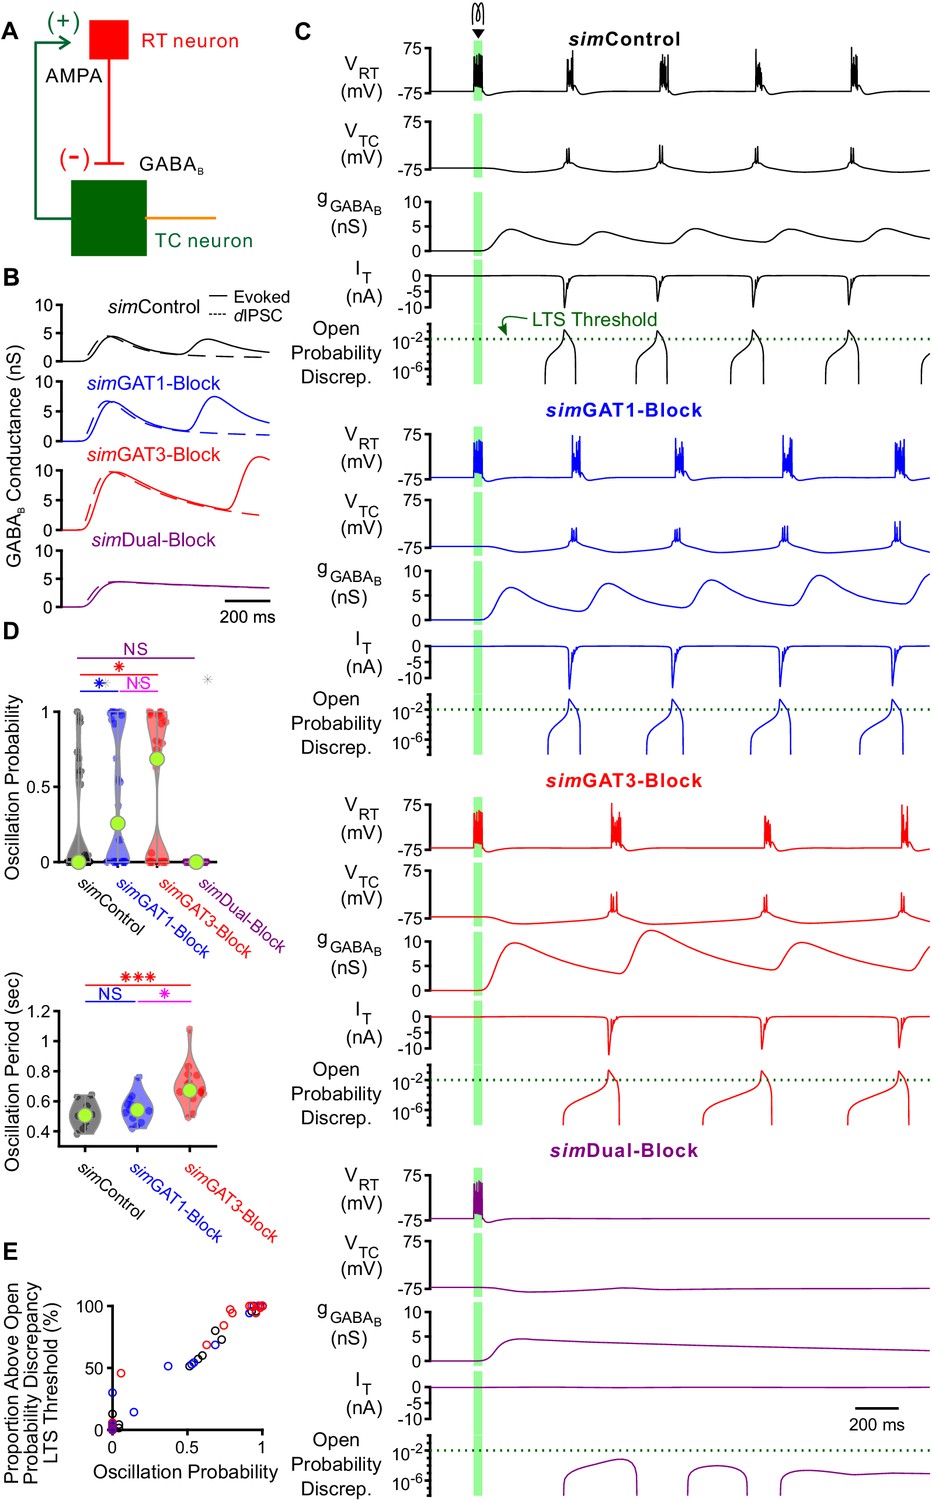
(A) Schematic of a two-cell model network. A reticular thalamic (RT) neuron projected a GABAB receptor-mediated inhibitory synapse (-) to a thalamocortical (TC) neuron, which reciprocally projected an AMPA receptor-mediated excitatory synapse (+) to the reticular thalamic neuron. (B) Evoked GABAB conductance waveforms in network model TC neurons (solid lines) were similar to GABAB dynIPSC waveforms (dashed lines). (C) Example two-cell network responses under different GABAB receptor conditions. Model TC neuron parameters corresponded to the example neuron of Figure 3. A brief (40 ms, 0.2 nA) current stimulus was applied to the reticular thalamic neuron, evoking an initial burst of 12 spikes. Oscillations were evoked under some but not all GABAB receptor conditions. A total of 24 model TC neurons produced oscillations in response to stimulation. The green dotted line denotes the observed LTS threshold from Figure 5C. (D) Distributions of oscillation measures over all 24, two-cell networks. Oscillation probability was increased when either simGAT1-Block parameters or simGAT3-Block parameters were used, but decreased when simDual-Block parameters were used (*p<0.05, ***p<0.001, Friedman’s test). (E) Proportion of simulations with the TC neuron’s maximum T channel open probability discrepancy between 2 and 3 s after stimulation passing the LTS threshold shown in (C) correlated well with oscillation probability. Each circle denotes a different two-cell network using a specific simIPSC color-coded as in (C). Responses across two-cell networks were heterogeneous.
-
Figure 8—source data 1
Oscillation measures for two-cell model thalamic networks using different GABAB receptor activation waveforms (simIPSCs).
Oscillation measures for each network simulation. Averaged oscillation measures for each two-cell network (Figure 8D).
- https://cdn.elifesciences.org/articles/59548/elife-59548-fig8-data1-v2.zip
Figure 8—figure supplement 1
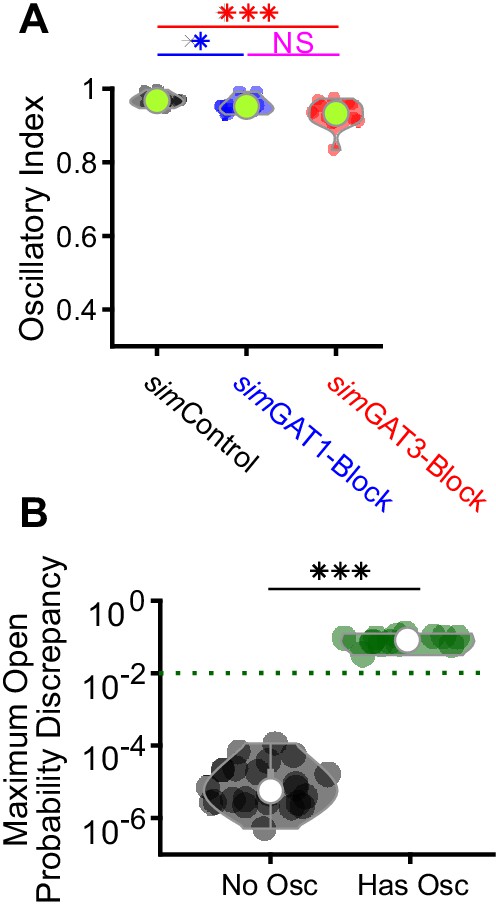
Additional information on two-cell model thalamic networks.
(A) Distributions of oscillation index over all 24, two-cell networks. These values were artificially high because two-cell network oscillations are highly stereotyped. (*p<0.05, ***p<0.001, Friedman’s test). (B) The average maximum open probability discrepancy of TC neurons between 2 and 3 s after stimulation was higher for simulations having oscillations than for simulations without oscillations (***p<0.001, n = 24 networks, paired-sample t-test). The green dotted line denotes the observed LTS threshold from Figure 5C.
Figure 9
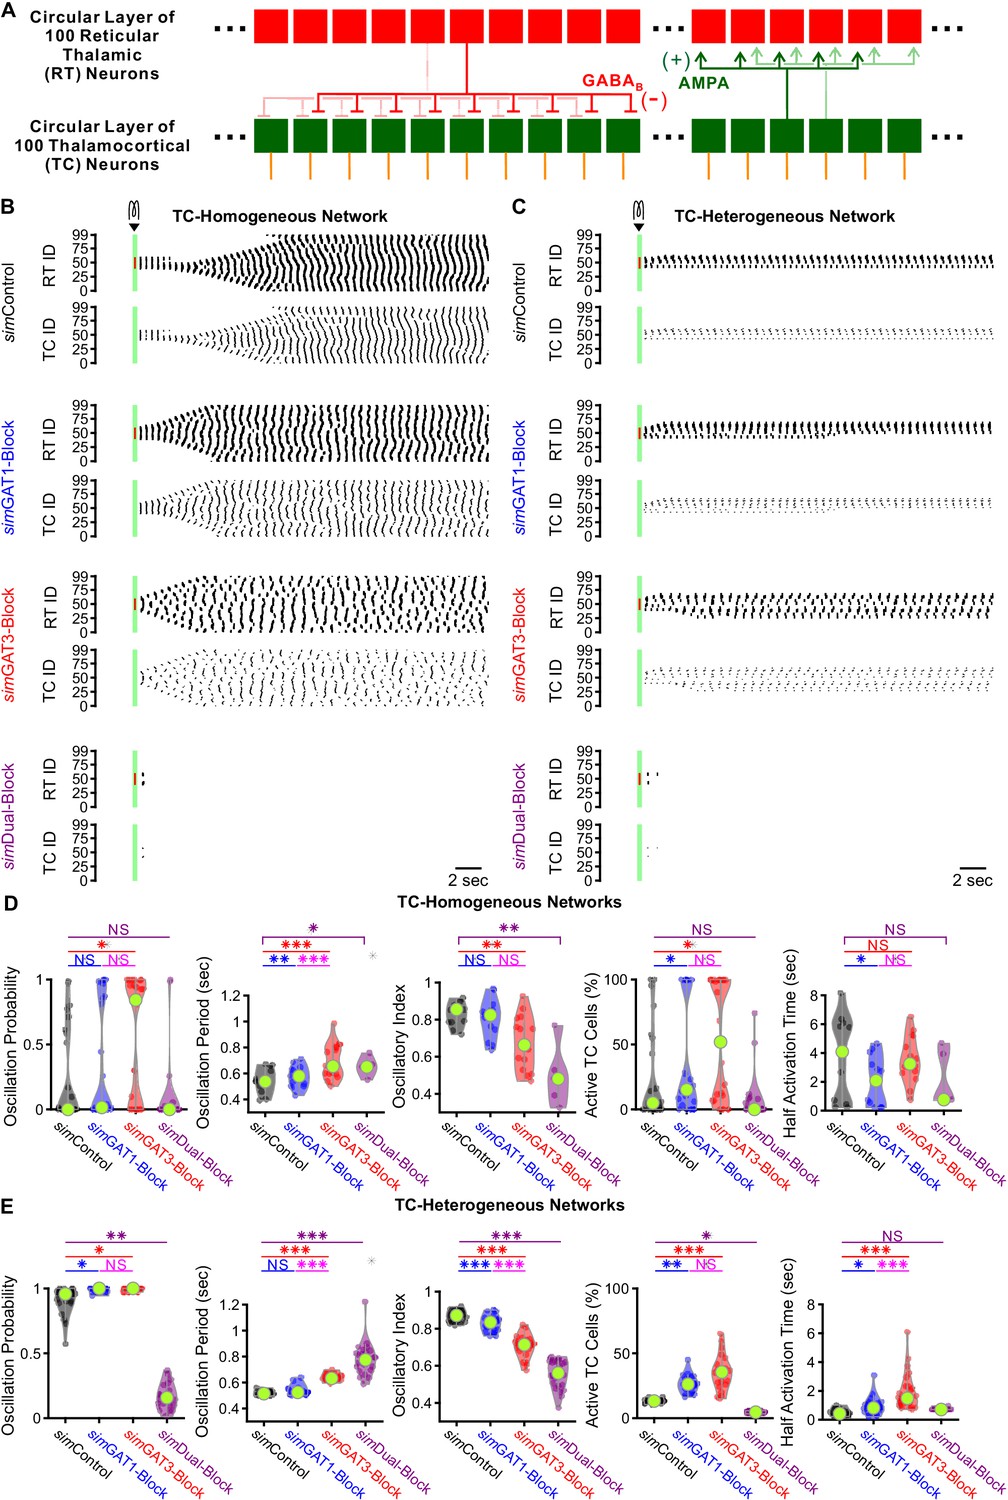
GABAB-receptor-mediated conductance waveforms modulate oscillations produced by 200 cell model thalamic networks.
(A) Schematic of a 200 cell model network. Each reticular thalamic (RT) neuron projected GABAB receptor-mediated inhibitory synapses (-) to nine nearby thalamocortical (TC) neurons. Each TC neuron projected AMPA-receptor-mediated synapses (+) to five nearby reticular thalamic neurons. (B) Sample spike raster plots of a TC-homogenous network, using model TC neuron parameters corresponding to the example neuron of Figure 3. A brief (40 ms, 0.2 nA) current stimulus was applied to each of the center 20 reticular thalamic neurons. Spikes within the stimulation period are red; all other evoked spikes are black. (C) Sample spike raster plots of a TC-heterogeneous network, using model TC neuron parameters corresponding to the 24 model TC neurons used in Figure 8. Relative to TC-homogeneous networks, activity was more localized for TC-heterogeneous networks. (D) Distributions of oscillation measures over all 24 TC-homogeneous 200 cell networks (*p<0.05, **p<0.01, ***p<0.001, repeated-measures ANOVA for oscillation period and half activation time, Friedman’s test otherwise). (E) Distributions of oscillation measures over 24 randomly ordered, TC-heterogeneous 200 cell networks. Oscillation probability, oscillation period and percent of active cells increased when simGAT3-Block parameters were used, but decreased when simDual-Block parameters were used (repeated-measures ANOVA for oscillatory index, Friedman’s test otherwise).
-
Figure 9—source data 1
Oscillation measures for 200 cell model thalamic networks using different GABAB receptor activation waveforms (simIPSCs).
List of candidate model thalamocortical neurons. Oscillation measures for each network simulation, for both TC-homogeneous and TC-heterogeneous networks. Averaged oscillation measures for each TC-homogeneous 200 cell network (Figure 9D). Averaged oscillation measures for each TC-heterogeneous 200 cell network (Figure 9E).
- https://cdn.elifesciences.org/articles/59548/elife-59548-fig9-data1-v2.zip
Author response image 1

Individual GAT1 or GAT3 blockade strengthens thalamic oscillations, but dual GAT1+GAT3 blockade abolishes oscillations.
Spectrograms for example evoked epileptiform oscillations at baseline and 40 minutes after perfusing with (i) control (no drug added), (ii) 4 µM NO-711 (GAT1 blocker), (iii) 100 µM SNAP-5114 (GAT3 blocker) or (iv) dual 4 µM NO-711+100 µM SNAP-5114. These are the same example oscillations as in Figure 1B. A bin width of 100 ms was used. Importantly, these analyses do not rely on any spike detection algorithms.
Author response image 2
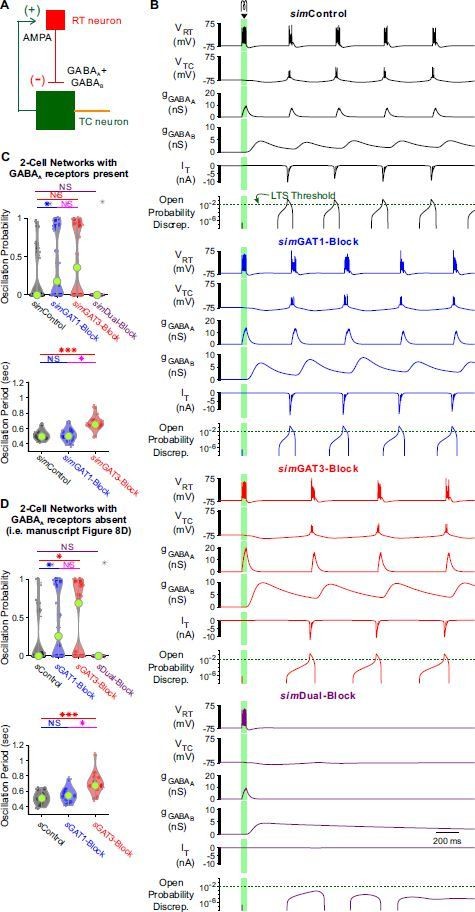
With GABAA receptors present, GABAB-receptor mediated conductance waveforms still modulate oscillations produced by 2-cell model thalamic networks.
(A) Schematic of a 2-cell model network with GABAA receptors present (cf. Figure 8A). (B) Example 2-cell network responses under different GABAB receptor conditions. The same TC model neuron and simulation conditions as that in Figure 8C were applied, except for the addition of a GABAA conductance with maximal amplitude 2 times that of the maximal GABAB conductance. The green dotted line denotes the observed LTS threshold from Figure 5C. (C) Distributions of oscillation measures over the same 24, 2-cell networks as in Figure 8D. Compared to Figure 8D, 2-cell network simulations with GABAA receptors present had a lower oscillation probability and a smaller oscillation period (* p < 0.05, *** p < 0.001, Friedman’s test). The differences across simIPSCs were generally the same as in Figure 8D. (D) Figure 8D reproduced here for ease of comparison.
Author response image 3

GABAB-receptor mediated conductance waveforms modulate oscillations produced by 200-cell model thalamic networks with GABAA receptors present.
(A) Schematic of a 200-cell model network with GABAA receptors present (cf. Figure 9A). (B) Sample spike raster plots of the same TC-heterogeneous network and the same simulation conditions as that in Figure 9C, except for the addition of a GABAA conductance with maximal amplitude 2 times that of the maximal GABAB conductance. (C) Distributions of oscillation measures over the same 24 randomly ordered, TC-heterogeneous 200-cell networks as in Figure 9E (* p < 0.05, ** p < 0.01, *** p < 0.001, Friedman’s test for oscillation period and half activation time, repeated-measures ANOVA otherwise). The differences across simIPSCs were generally the same as in Figure 9E. (C) Figure 9E reproduced here for ease of comparison.
Author response image 4
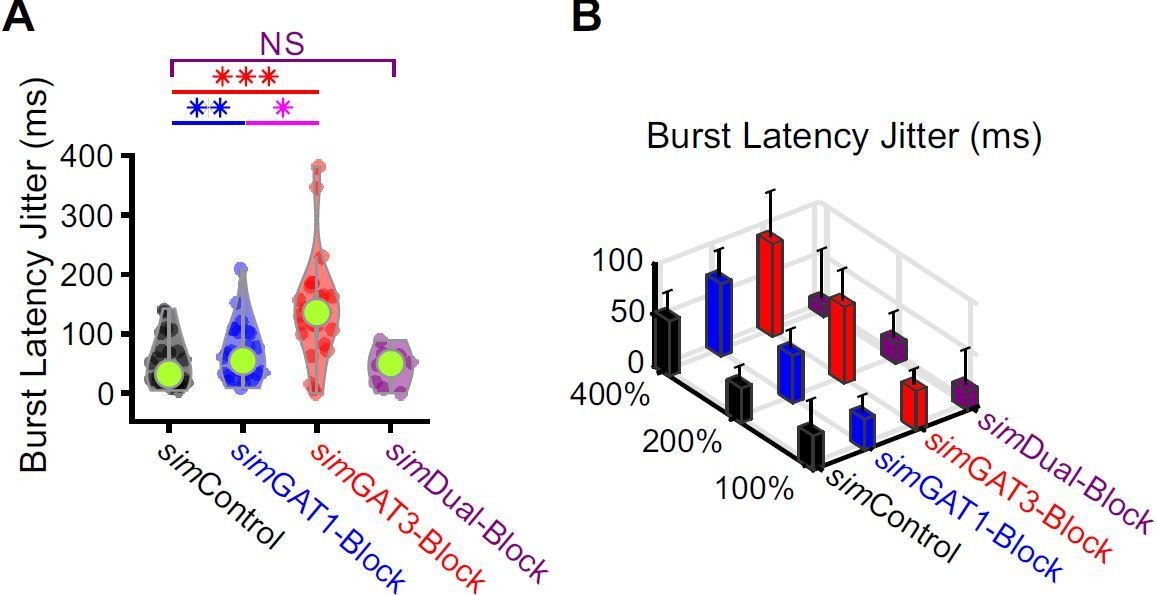
Burst latencies were more variable following simIPSCs corresponding to single GAT blockade across well-fitted model neurons.
(A) Distributions of burst latency jitter (standard deviation of burst latencies across all trials) over the 31 well-fitted model neurons across GABAB IPSC waveforms shown in Figure 2B (* p < 0.05, ** p < 0.01, *** p < 0.001, Friedman’s test). (B) Burst latency jitter averaged over all 31 model neurons, across 4 different GABAB IPSC waveforms and 3 different conductance amplitude scales. Error bars denote 95% confidence intervals.
Videos
Video 1
Voltage and T-type calcium channel open probability discrepancy trajectories in response to simGAT3-Block and simDual-Block GABAB IPSCs.
Simulated traces for the example neuron of Figure 3, resampled at 1 ms intervals, in response to either simGAT3-Block (red) or simDual-Block (purple), as shown in Figure 5. Traces over simulation time are shown for (A) somatic voltage, (B) distal dendritic T channel activation gating variable, (C) distal dendritic T channel inactivation gating variable and (D) distal dendritic T channel open probability discrepancy. (E) Phase plot of somatic voltage versus distal dendritic T channel open probability discrepancy. (F) Phase plot of the concavity versus slope of the distal dendritic T channel open probability discrepancy. Note that only positive discrepancy values are plotted. All traces are aligned in Video time to the decision points (circles), defined as the point at which the open probability discrepancy curve either reaching an inflection point (zero concavity) or maximal negative concavity. Note that the traces for instantaneous and steady-state activation gates in (B) overlap on this time scale. In (E-F), only the first voltage peak following hyperpolarization is shown. The time points shown correspond to those with larger marker sizes in (A-D). Following either simGAT3-Block or simDual-Block, the open probability discrepancy curve reaches an inflection point with zero concavity. However, only following simGAT3-Block does the open probability discrepancy curve reach a significantly positive concavity, drive past the LTS threshold (10−2) and produce a rebound low-threshold spike (LTS). Note that the slope of the open probability discrepancy curve at the decision point is higher for simGAT3-Block than for simDual-Block.
Video 2
Voltage and T-type calcium channel open probability discrepancy trajectories in response to all pharmacological GABAB IPSCs.
Same as Video 1 but in response to all simIPSCs shown in Figure 5. (A-F) See descriptions for Video 1. Note that following simControl (black), the maximum concavity for the open probability discrepancy curve is negative, so its trajectory in the open probability discrepancy concavity versus slope phase plot (F) never reaches above the y = 0 line. For other simIPSCs, note that the slope of the open probability discrepancy curve at the decision point is higher for LTS-producing trajectories [simGAT1-Block (blue) and simGAT3-Block (red)] than for an LTS-lacking trajectory [simDual-Block (purple)].
Video 3
Voltage and T-type calcium channel open probability discrepancy trajectories in response to GABAB IPSCs with two different time constants.
Simulated traces for the example neuron of Figure 3, resampled at 1 ms intervals, in response to GABAB IPSCs using the simDual-Block waveform, but with time constants set to 2.0 (yellow) or 2.3 (orange) s. These two time constants correspond to the last LTS success and the first LTS failure, respectively, in Figure 7A2. (A-F) See descriptions for Video 1.
Video 4
Voltage and T-type calcium channel open probability discrepancy trajectories in response to GABAB IPSCs with varying time constants.
Same as Video 3 but in response to all GABAB IPSC time constants shown in Figure 7A2. (A-F) See descriptions for Video 1. There appears to be a threshold for the slope of the open probability discrepancy curve that differentiates between an LTS-producing trajectory and an LTS-lacking trajectory.
Tables
Table 1
Average change of LTS and burst features relative to dynControl responses.
For LTS and burst probability, Friedman’s test with multiple comparison was used across all four groups. Due to the lack of LTS response to dynDual-Block, the comparison between dynControl and dynDual-Block for all other LTS and burst features was conducted separately using the paired-sample t-test. Across dynControl, dynGAT1-Block and dynGAT3-Block responses, Friedman’s test with multiple comparison was used for LTS latency and repeated-measures ANOVA with multiple comparison was used otherwise.
| dynGAT1-Block | dynGAT3-Block | dynDual-Block | |
|---|---|---|---|
| Burst Probability | +63%, p=0.0018 | +106%, p=1.7×10⁻⁷ | −82%, p=0.030 |
| Burst Latency | +4.6%, p=0.034 | +58%, p=1.1×10⁻⁹ | no change, p=0.066 |
| LTS Probability | +26%, p=0.0080 | +39%, p=0.0015 | −88%, p=4.8×10⁻⁶ |
| LTS Latency | no change, p=0.97 | +53%, p=3.7×10⁻⁹ | +254%, p=0.044 |
| Spikes Per LTS | +62%, p=1.3×10⁻⁶ | +93%, p=9.3×10⁻⁷ | no change, p=0.095 |
| LTS Peak Value (mV) | +2.5 ± 0.5 mV, p=1.4×10⁻⁴ | +3.3 ± 0.8 mV, p=5.2×10⁻⁴ | no change, p=0.33 |
| LTS Maximum Slope | +52%, p=2.6×10⁻⁹ | +82%, p=1.4×10⁻⁹ | no change, p=0.068 |
Table 2
Parameter values of GABAB-mediated inhibitory conductance waveforms used in dynamic clamp experiments.
These values (with the amplitudes scaled by 200%) correspond to the conductance templates shown in Figure 2B. , amplitude coefficient; , rise time constant; , fast decay time constant; , slow decay time constant; , weighting factor for the two decay terms.
| dynControl | 16.00 | 52.00 | 90.10 | 1073.20 | 0.952 |
| dynGAT1-Block | 24.00 | 52.00 | 90.10 | 1073.20 | 0.952 |
| dynGAT3-Block | 8.88 | 38.63 | 273.40 | 1022.00 | 0.775 |
| dynDual-Block | 6.32 | 39.88 | 65.80 | 2600.00 | 0.629 |
Additional files
Download links
A two-part list of links to download the article, or parts of the article, in various formats.
Downloads (link to download the article as PDF)
Open citations (links to open the citations from this article in various online reference manager services)
Cite this article (links to download the citations from this article in formats compatible with various reference manager tools)
Nonlinearities between inhibition and T-type calcium channel activity bidirectionally regulate thalamic oscillations
eLife 9:e59548.
https://doi.org/10.7554/eLife.59548


