Cryo-EM structure of the lysosomal chloride-proton exchanger CLC-7 in complex with OSTM1
- Structural Biology Program, Memorial Sloan Kettering Cancer Center, United States
Figures
Figure 1 with 3 supplements
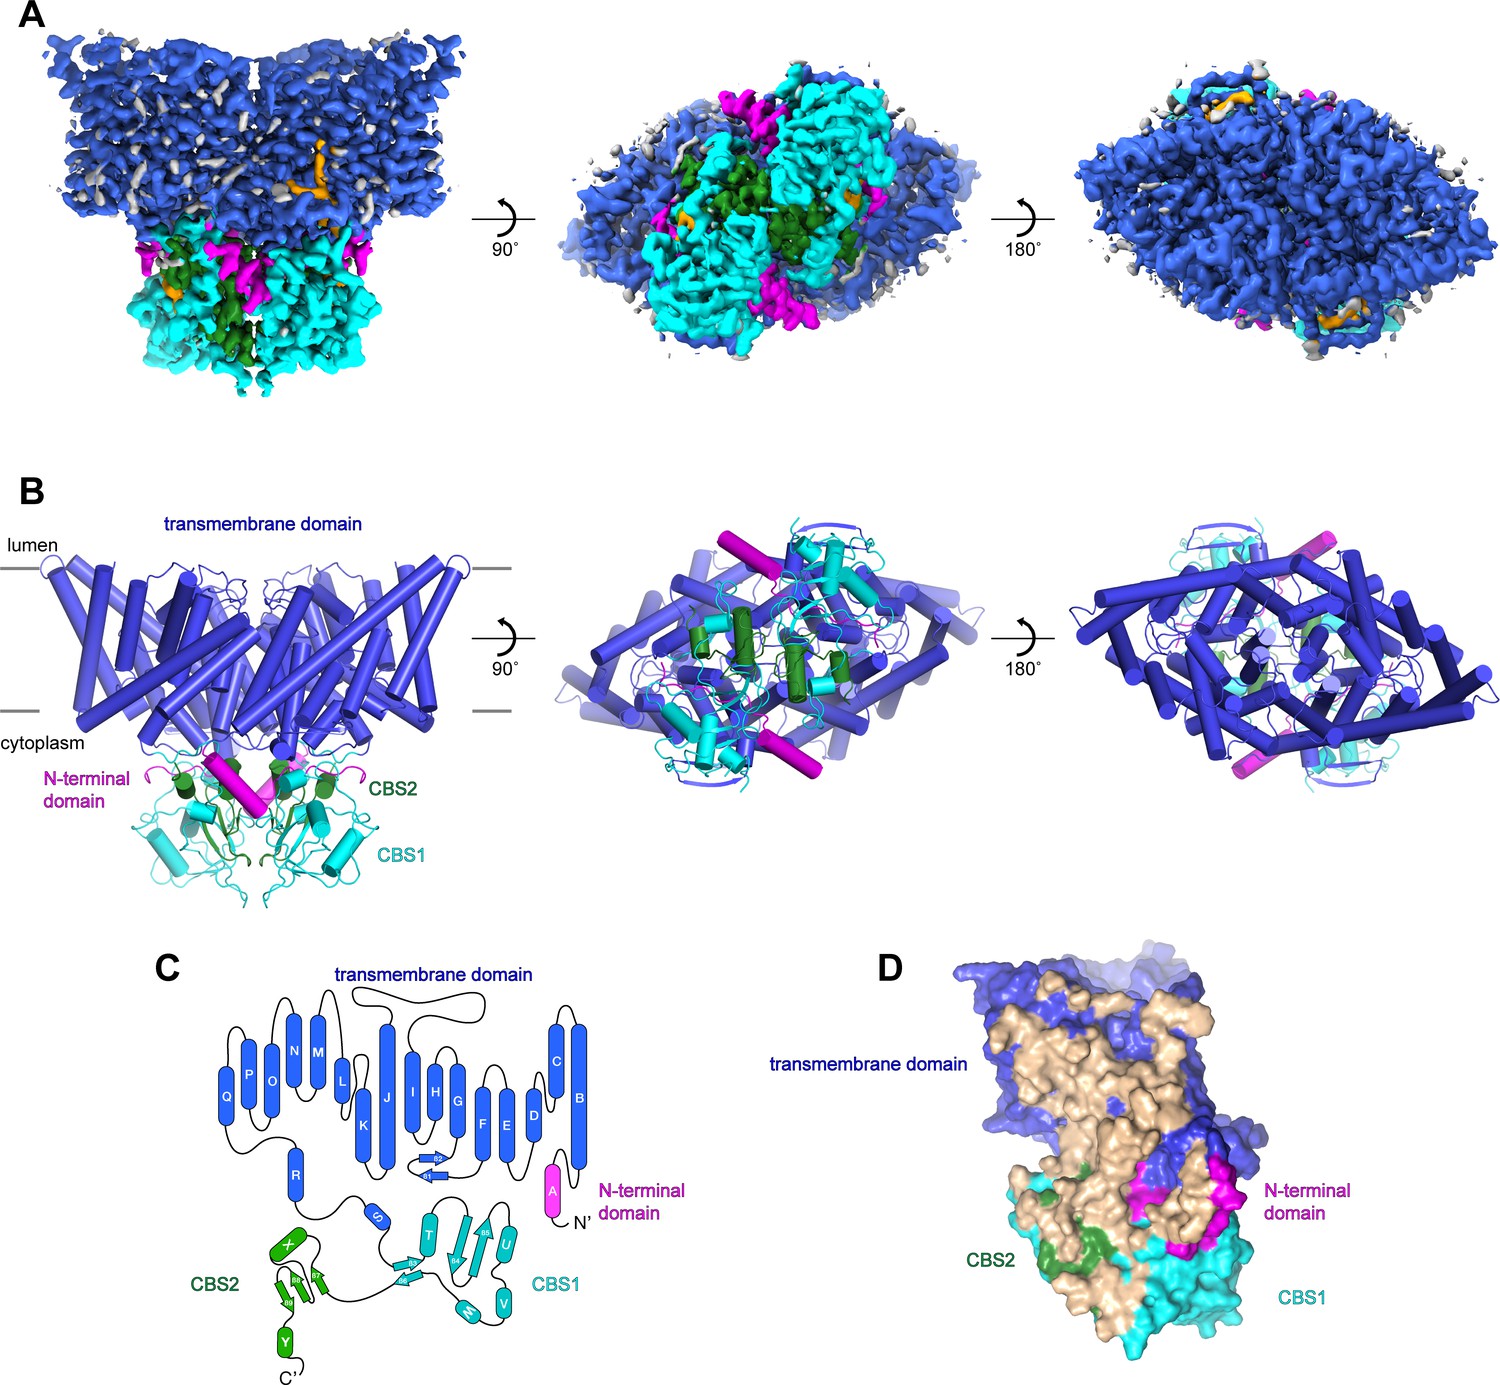
Structure of chicken CLC-7.
(A–B) Cryo-EM density map (A) and structure (B) of ggCLC-7 viewed from within the membrane (left), the cytoplasm (middle) and the lysosomal lumen (right) colored by domain with N-terminal domain in magenta, transmembrane domain in blue, CBS1 in cyan and CBS2 in green. Modeled non-protein densities are colored orange and unmodeled non-protein densities are colored grey in A. (C) Domain topology of ggCLC-7 colored by domain as in A. (D) Dimer interface with interacting residues colored in wheat.
Figure 1—figure supplement 1
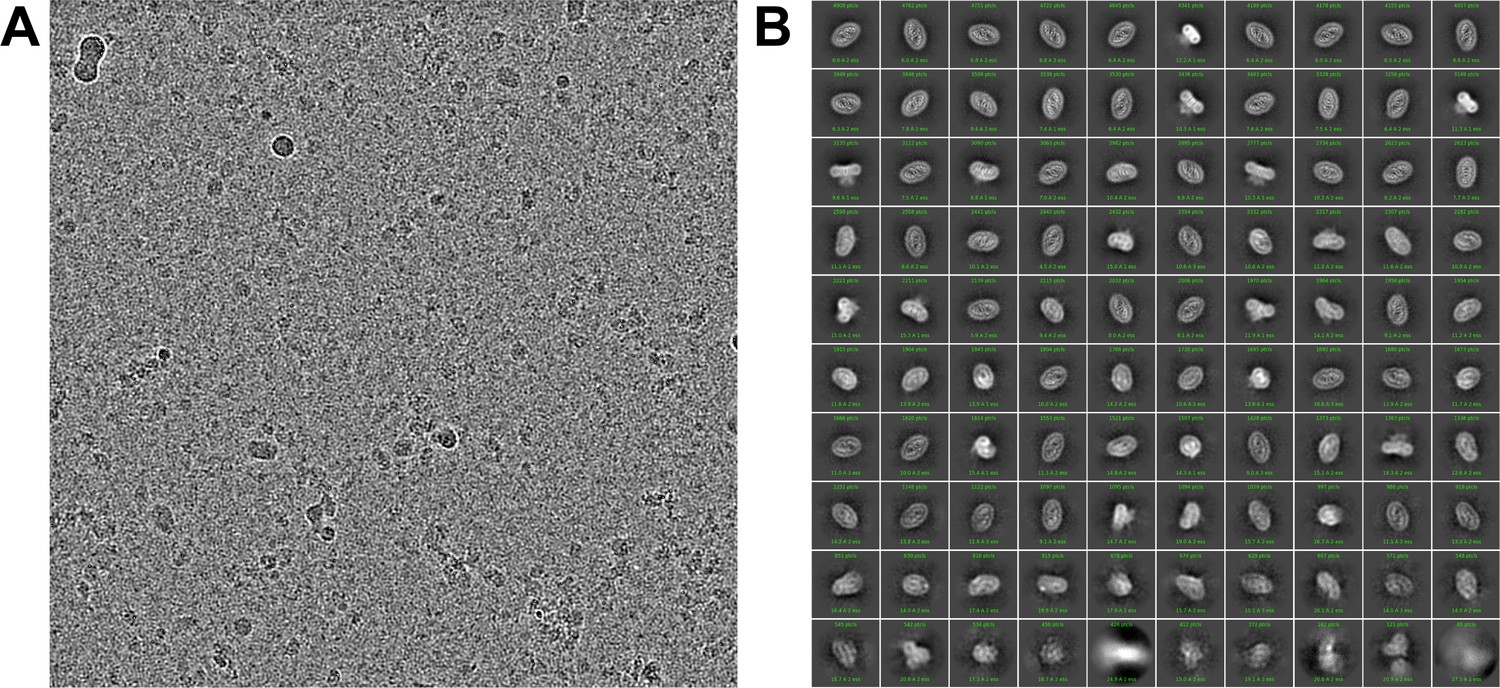
Cryo-EM analysis of human CLC-7.
(A) Representative cryo-EM image of hsCLC-7. (B) Two-dimensional class averages.
Figure 1—figure supplement 2
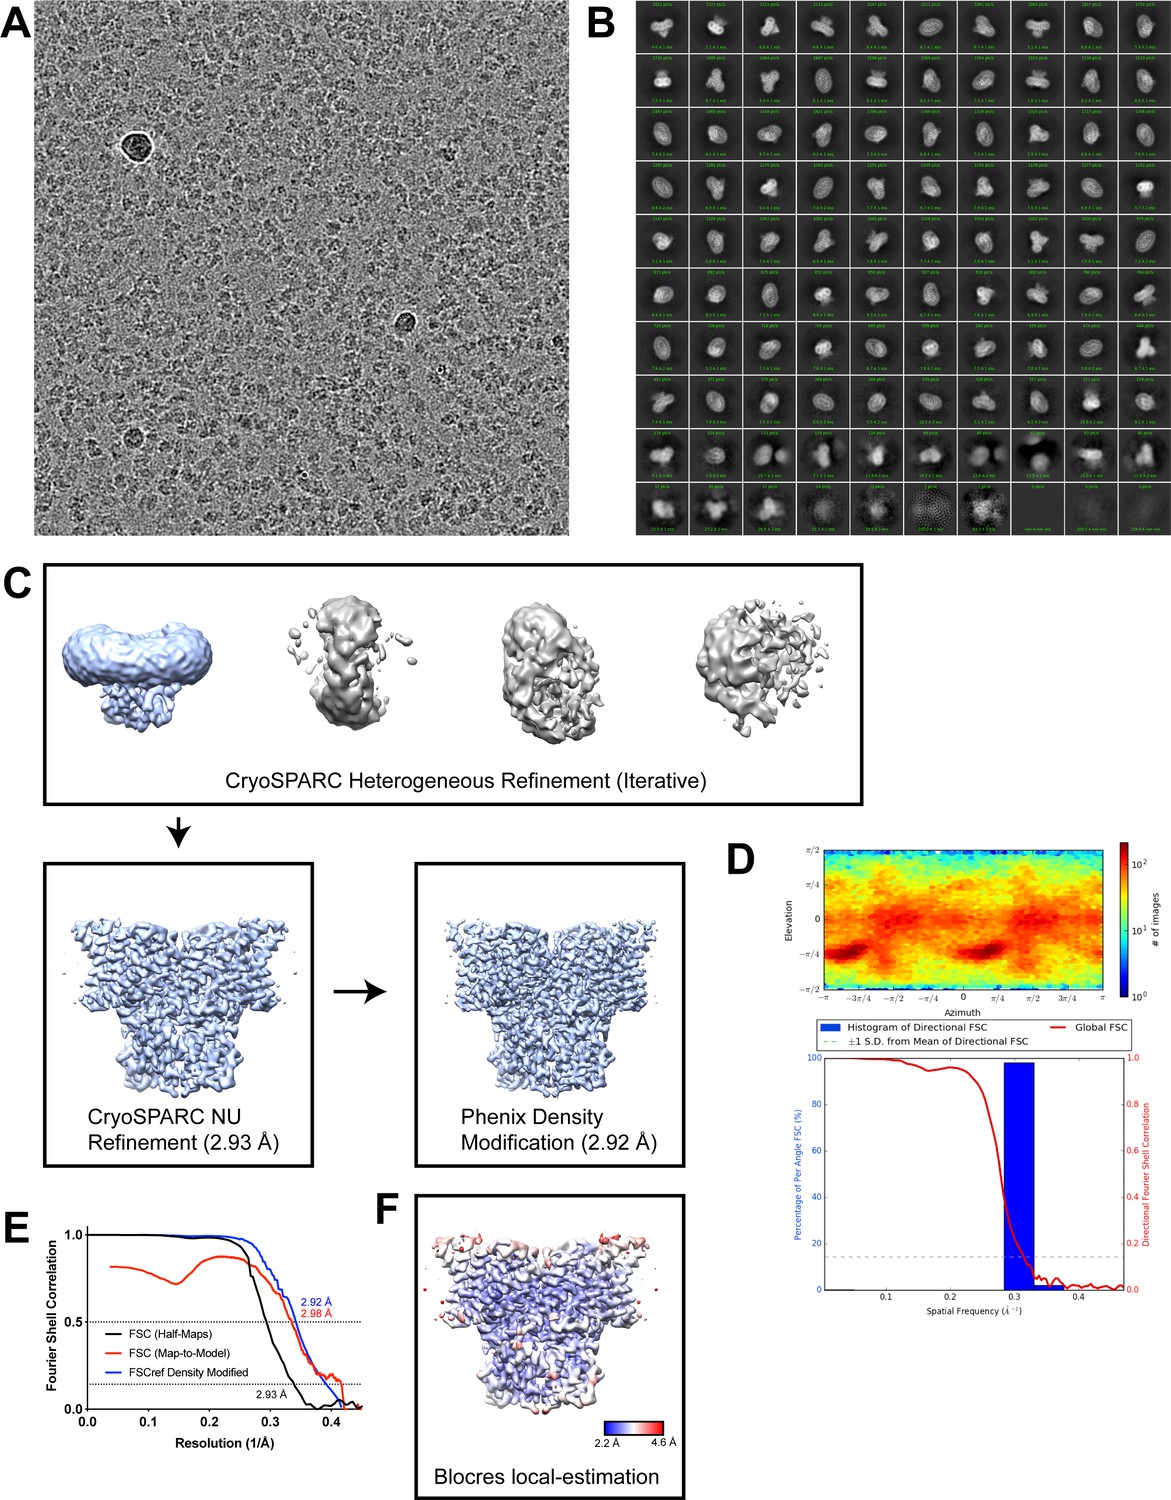
Cryo-EM analysis of chicken CLC-7.
(A) Representative cryo-EM image of ggCLC-7. (B) Two-dimensional class averages. (C) Simplified image processing workflow. (D) Angular distribution and ThreeDFSC anisotropy plots. (E) Fourier shell correlation (FSC) of two unfiltered half-maps for ggCLC-7 (black), cross-correlation plot of two unfiltered half-maps following density modification (red) and FSC of map-to-model fit of ggCLC-7 with density modified map (blue). (F) ggCLC-7 density map colored by local resolution calculated with blocres (Heymann, 2018).
Figure 1—figure supplement 3
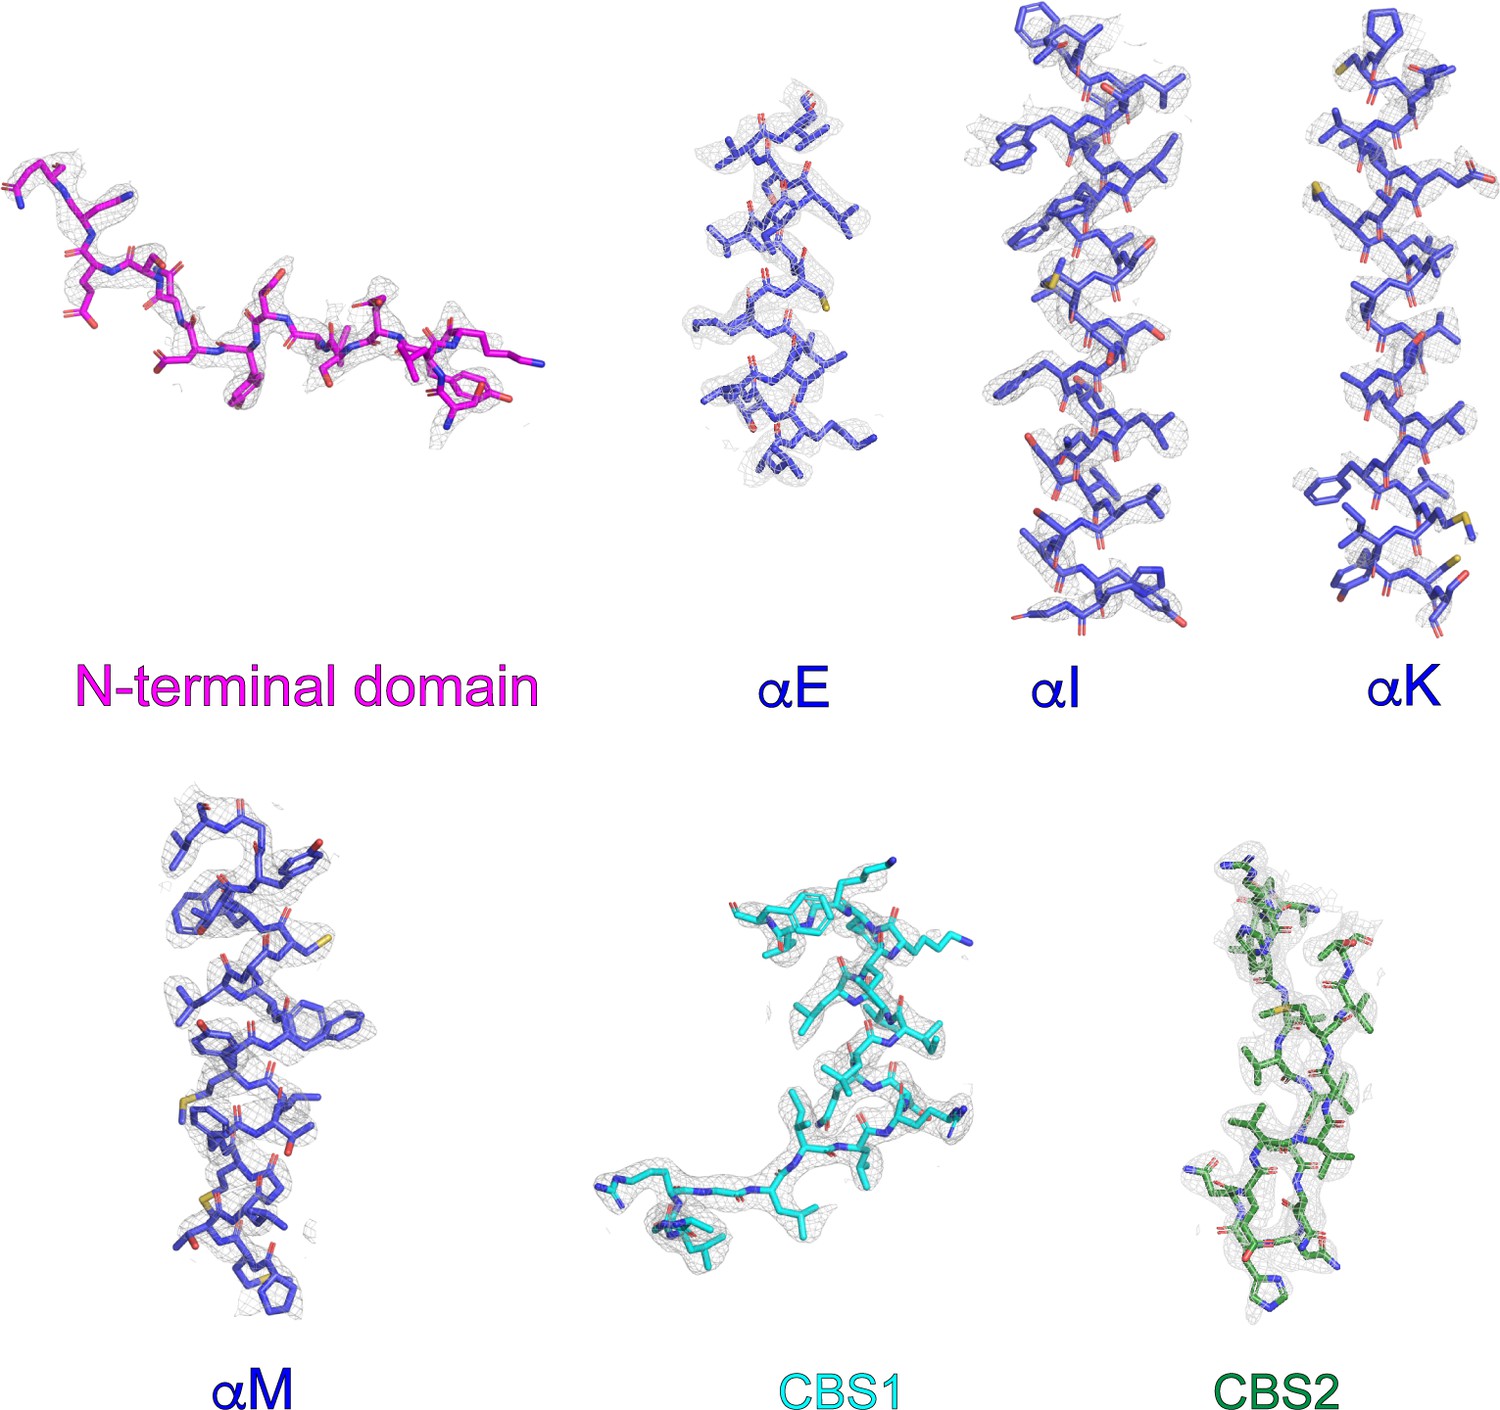
Representative cryo-EM density and model of chicken CLC-7.
Representative sections of cryo-EM density shown as grey mesh displayed at 10 σ threshold. Refined coordinates are shown as sticks.
Figure 2 with 1 supplement
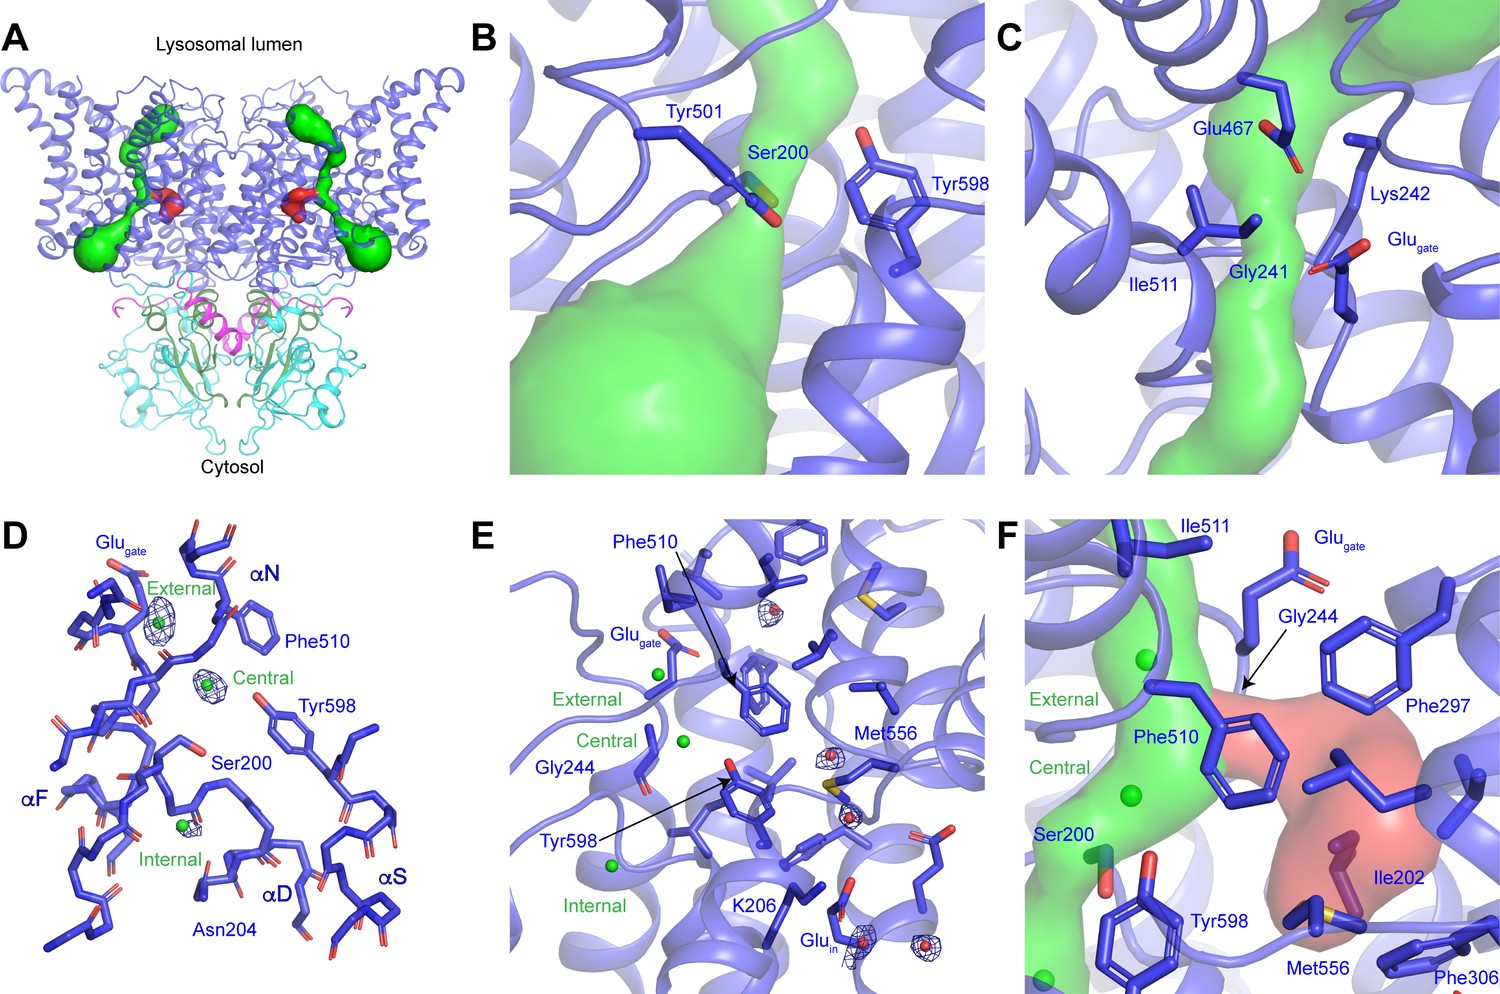
CLC-7 ion-conduction pathways.
(A) Each protomer of ggCLC-7 contains a Cl--conduction pathway, displayed as a green surface, and a putative H+-conduction pathway, displayed as a red surface. The N-terminal domain is colored in magenta, transmembrane domain in blue, CBS1 in cyan and CBS2 in green. (B) The cytosolic constriction of the Cl--conduction pathway formed by Ser200, Tyr501 and Tyr598 narrows the pathway to a minimum radius of 0.6 Å. (C) Two constrictions exist near the luminal entrance to the pathway formed by Glugate (Glu243), Lys242 and Ile511 and by Gly241, Lys242, Glu467. (D) Cl--binding sites (shown as green spheres) in the ggCLC-7 ion conduction pathway. Experimental cryo-EM density is shown as blue mesh countered at 10 σ threshold. Conserved residues are shown in sticks. (E) Ordered water molecules (shown as red spheres) are resolved in the hydrophobic gap between Glugate and Gluin and in the solvent-filled cavity in which Gluin resides. Experimental cryo-EM density is shown as blue mesh contoured at 7 σ threshold. (F) A potential H+-conduction pathway, shown as red surface, extends from near the central Cl--binding site through into the hydrophobic gap. The access from the Cl- pathway is lined by Gly244, Phe297 and Phe510. The pathway is separated from the cytosol by a constriction formed by Ile202, Phe306 and Met556.
Figure 2—figure supplement 1
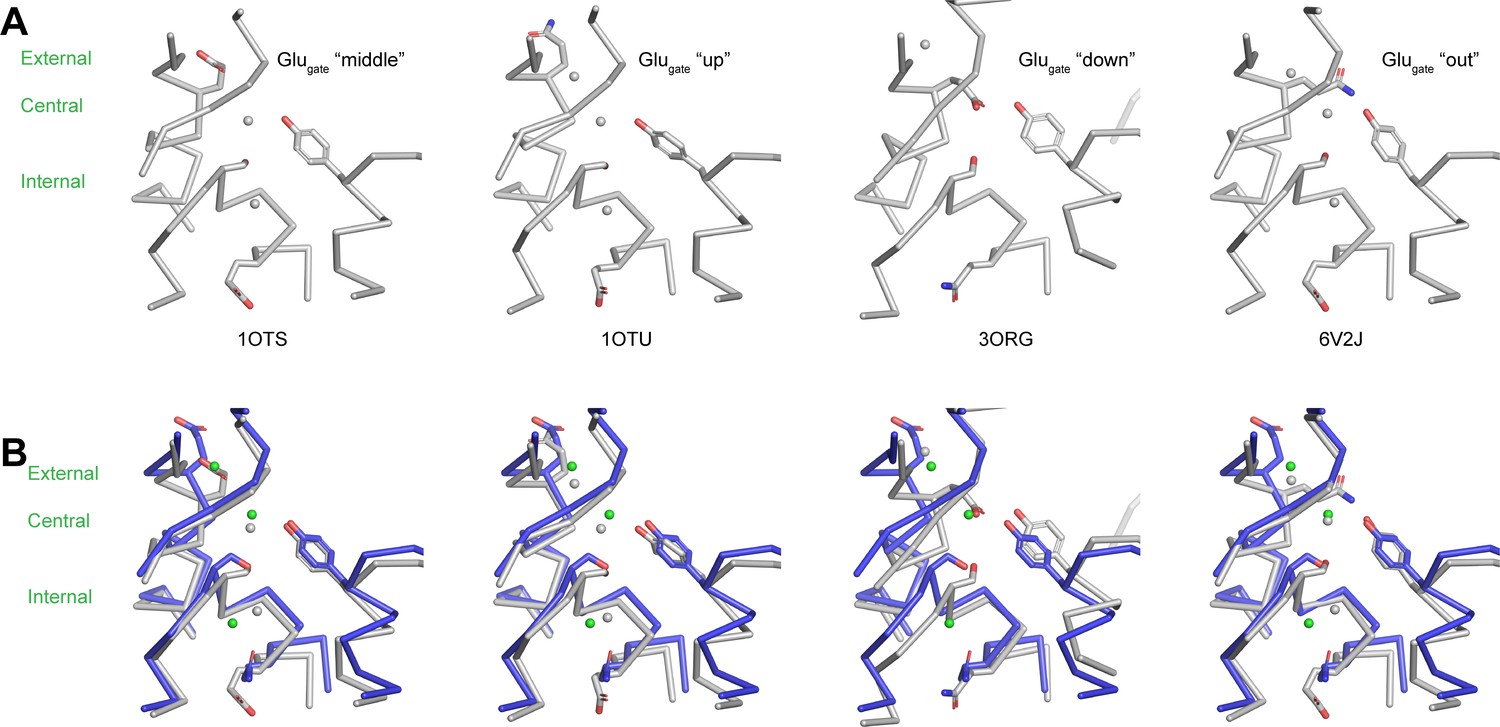
Gating glutamate and the Cl--conduction pathway.
(A) Structures of the Cl--conduction pathways of ecCLC (1OTS), ecCLC E148Q (1OTU), cmCLC (3ORG) and ecCLC QQQ (6V2J). Cl--binding sites are displayed as grey spheres. (B) Comparison of the Cl--conduction pathway of ggCLC-7 with the Cl--conduction pathways of ecCLC, ecCLC E148Q, cmCLC and ecCLC QQQ. ggCLC-7 is colored by domain and ecCLC, ecCLC E148Q, cmCLC and ecCLC QQQ are colored in grey. Cl--binding sites are displayed as spheres.
Figure 3 with 1 supplement
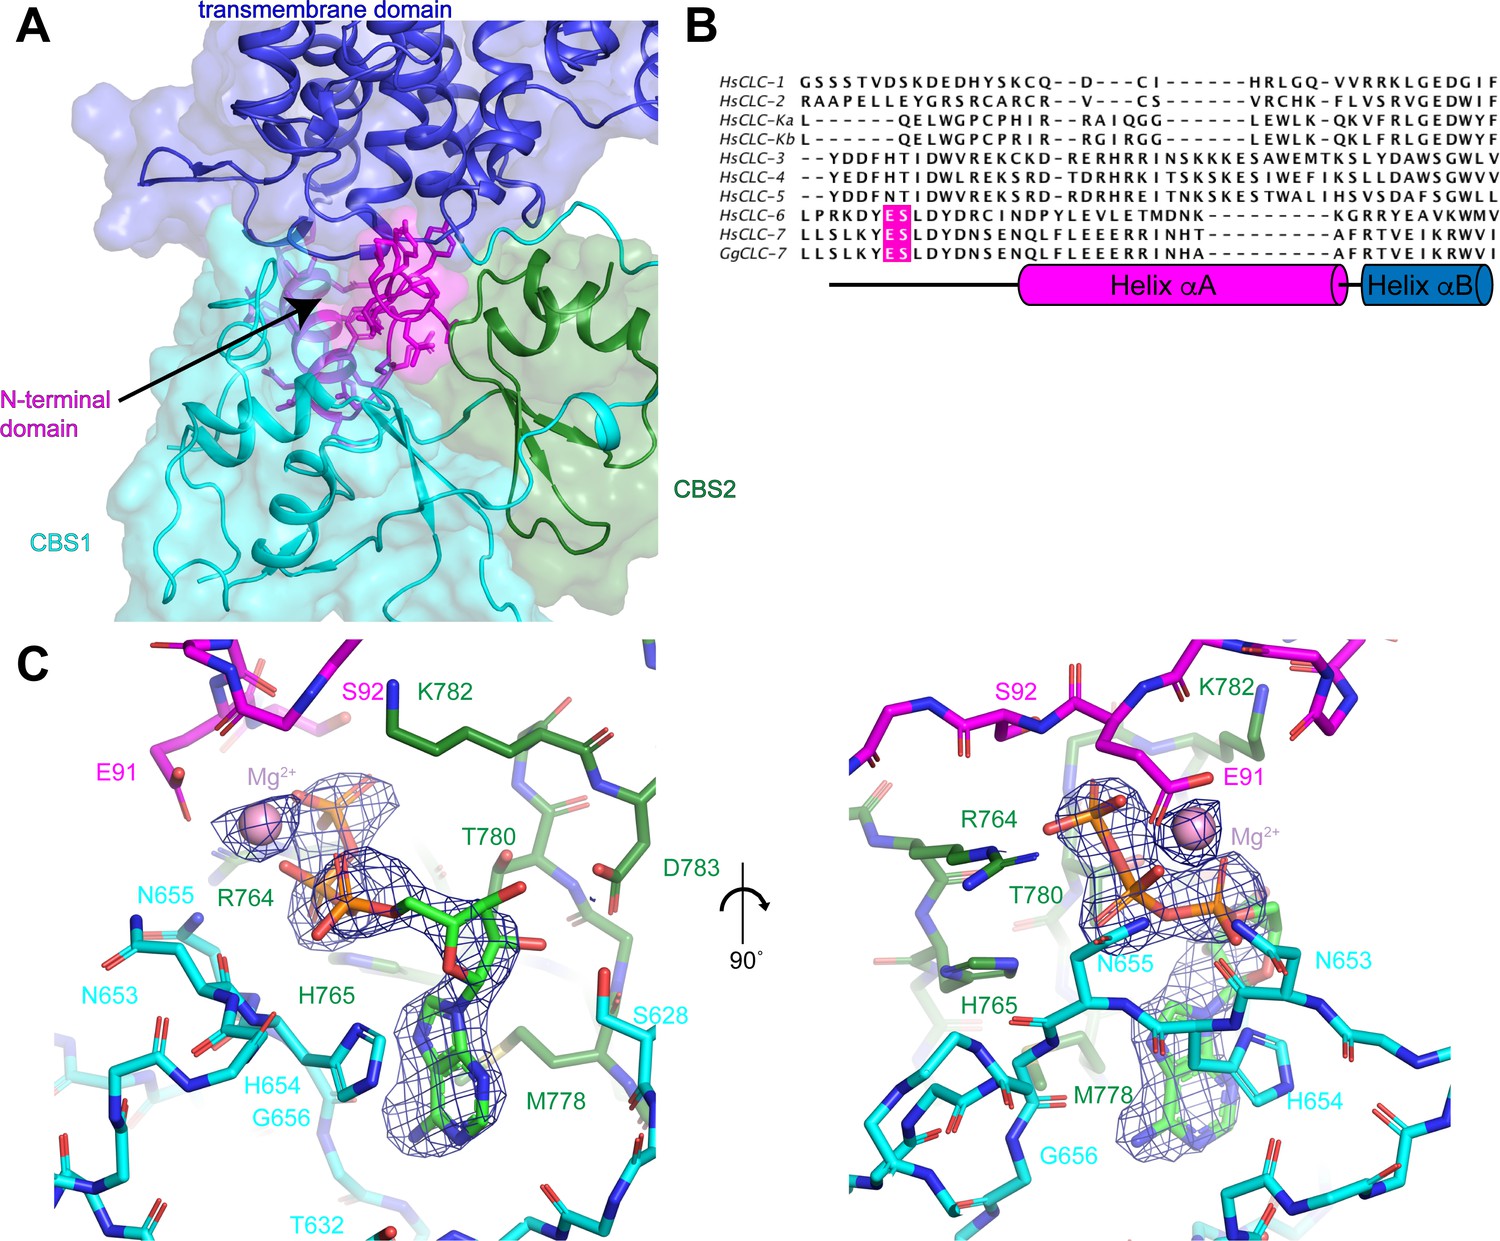
N-terminal domain and the ATP-binding site.
(A) The N-terminal domain resides at the interface between the transmembrane domain, CBS1 and CBS2. N-terminal domain is colored in magenta, transmembrane domain in blue, CBS1 in cyan and CBS2 in green. (B) Sequence alignment of N-terminal domain of ggCLC-7 with human CLC-1, CLC-2, CLC-Ka, CLC-Kb, CLC-3, CLC-4, CLC-5, CLC-6, CLC-7. Positions of ATP coordinating Glu91 and Ser92 in ggCLC-7 are highlighted in magenta. (C) Two views of the ATP binding site in the cytoplasmic domain of ggCLC-7. Side chains that interact with ATP are shown as sticks. Experimental cryo-EM density is shown as blue mesh contoured at 12 σ threshold. Mg2+ ion shown as a pink sphere.
Figure 3—figure supplement 1
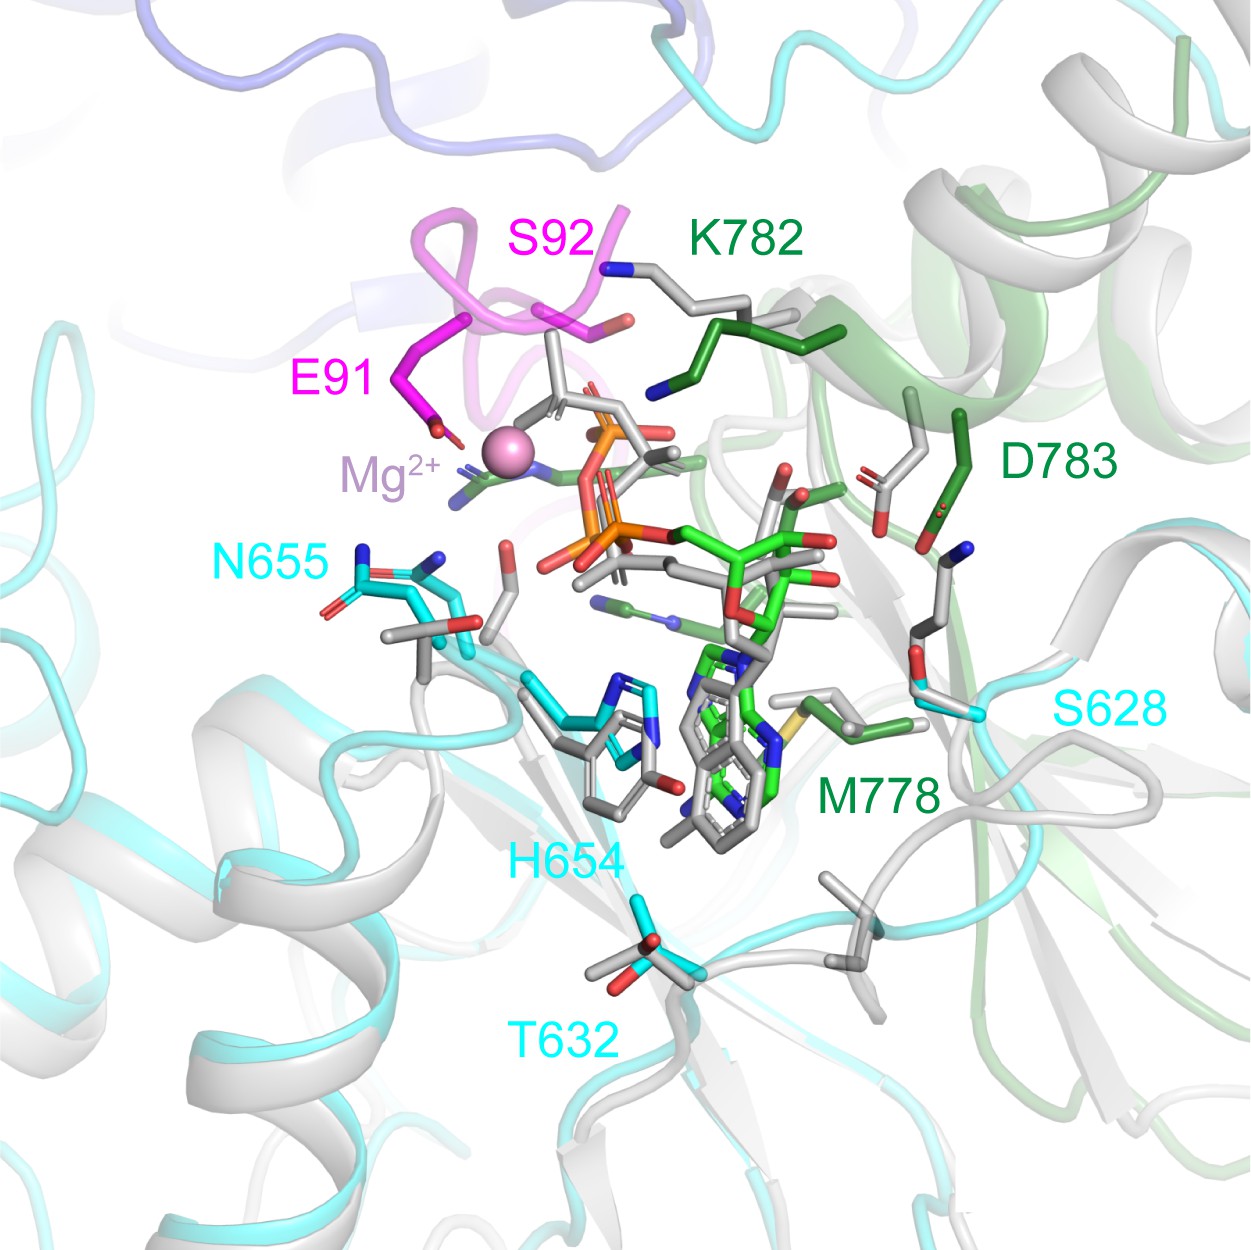
Comparison of ATP-binding sites in ggCLC-7 and hsCLC-5.
ATP-binding sites in ggCLC-7 (colored by domain) and hsCLC-5 (2J9L) (grey). Residues are labeled according to ggCLC-7 sequence. Mg2+ ion shown as a pink sphere.
Figure 4 with 1 supplement
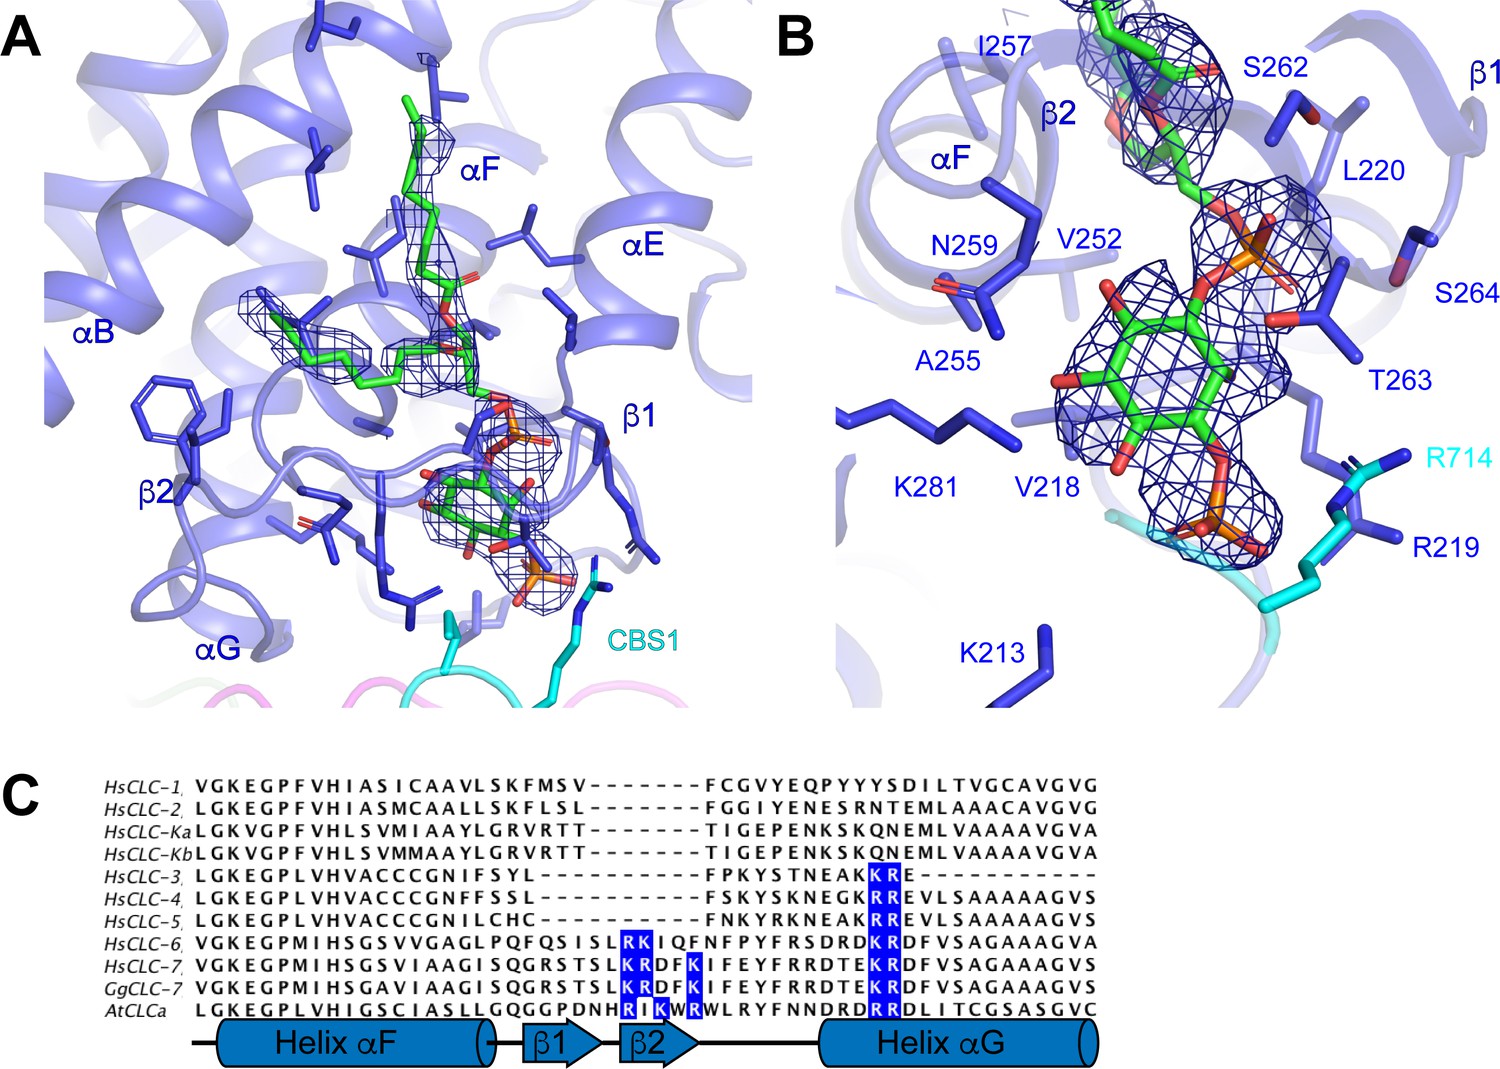
Phosphatidylinositol 3-phosphate binding site.
(A) PI3P molecule shown as sticks. ggCLC-7 N-terminal domain is colored in magenta, transmembrane domain in blue, CBS1 in cyan and CBS2 in green with residues that interact with PI3P shown as sticks. Experimental cryo-EM density for PI3P is shown as blue mesh contoured at 10 σ threshold. (B) Coordination of the PI3P by ggCLC-7. Residues that interact with PI3P head group are shown as sticks. Experimental cryo-EM density for PI3P is shown as blue mesh contoured at 10 σ threshold. (C) Sequence alignment of helices αF and αG in ggCLC-7 with human CLC-1, CLC-2, CLC-Ka, CLC-Kb, CLC-3, CLC-4, CLC-5, CLC-6, CLC-7 and A. thaliana CLC-a. Positions of lipid coordinating Lys266, Arg267, Lys270, Lys281 and Arg282 in ggCLC-7 are highlighted in blue.
Figure 4—figure supplement 1
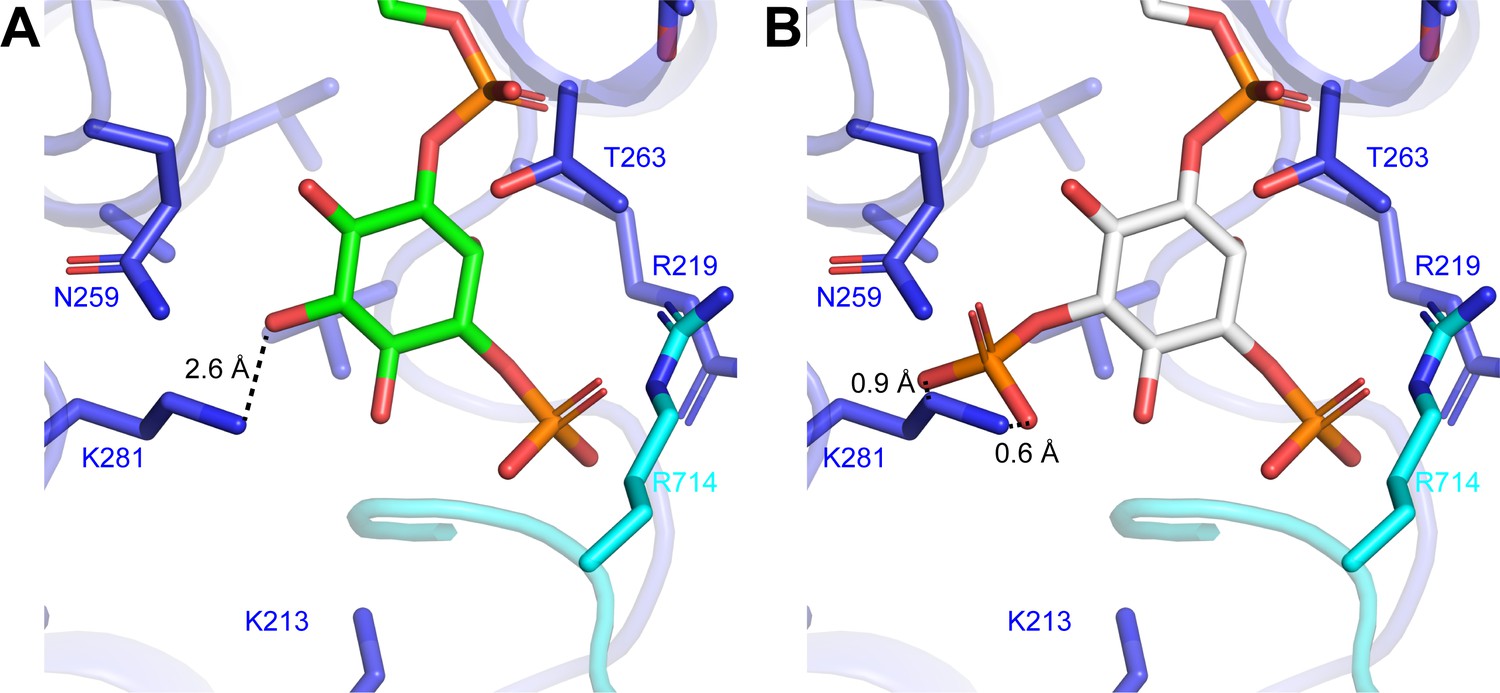
Modeling of phosphatidylinositol phosphate lipids into the PI3P-binding site.
(A) Coordination of the PI3P by ggCLC-7. Distance between Lys281 and the oxygen at the 5-position of the inositol ring is shown. (B) Modeled coordination of PI(3,5)P2 into the PI3P-binding site of ggCLC-7 with close bonds indicated by dashed lines.
Figure 5 with 4 supplements
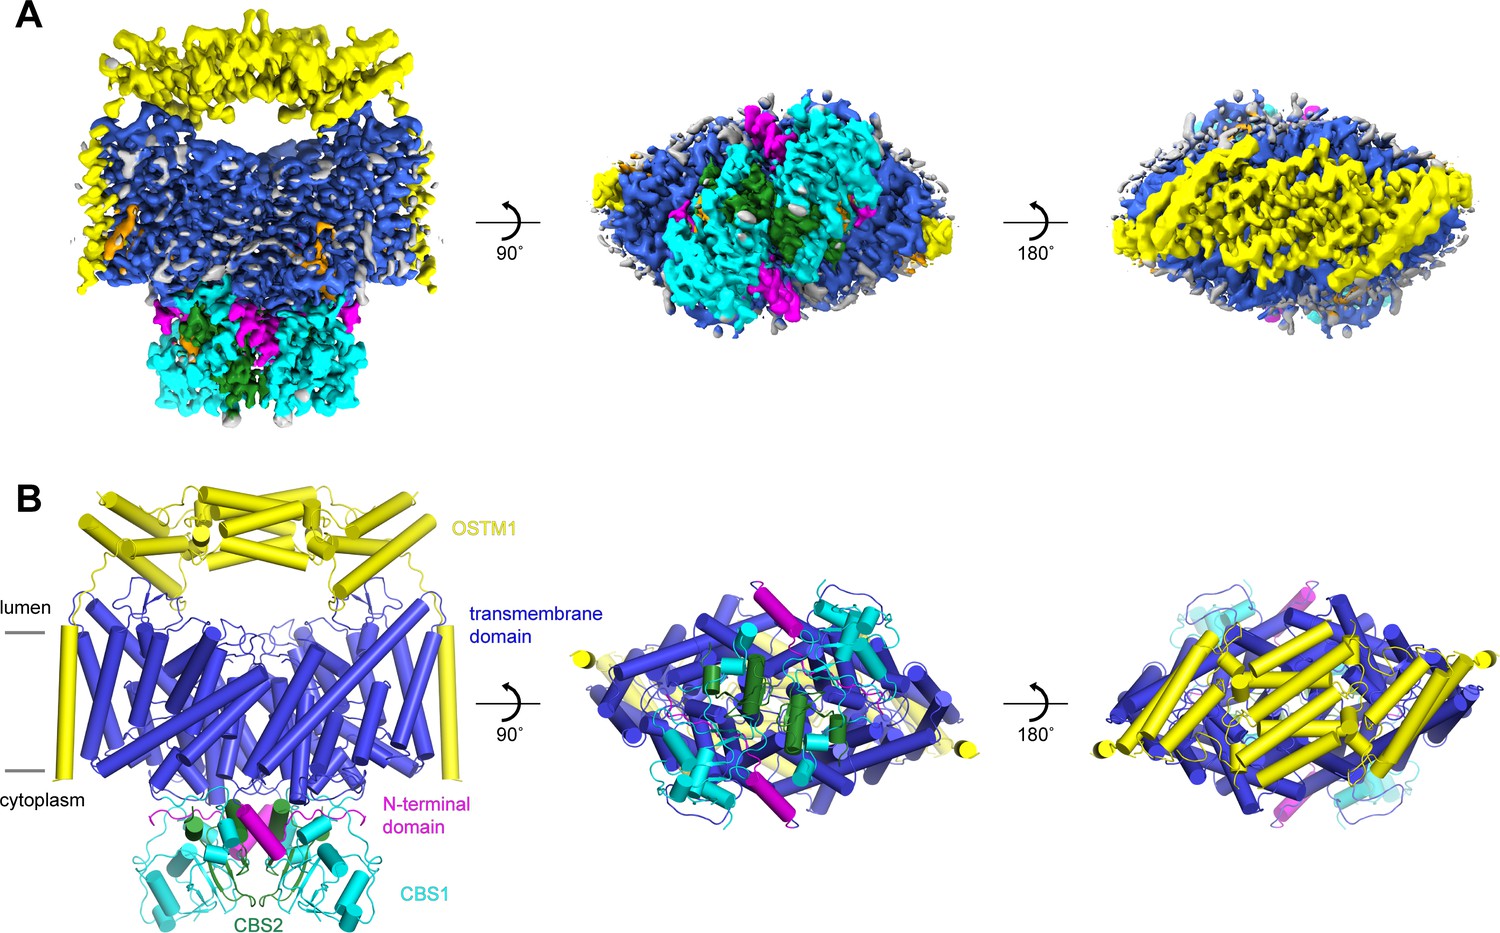
Structure of the human CLC-7/OSTM1 complex.
(A–B) Cryo-EM density map (A) and structure (B) of CLC-7/OSTM1 complex viewed from within the membrane (left), the cytosol (middle) and the lysosomal lumen (right). CLC-7 is colored by domain with N-terminal domain in magenta, transmembrane domain in blue, CBS1 in cyan and CBS2 in green. OSTM1 is colored yellow. Modeled non-protein densities are colored orange and unmodeled non-protein densities are colored grey in A.
Figure 5—figure supplement 1
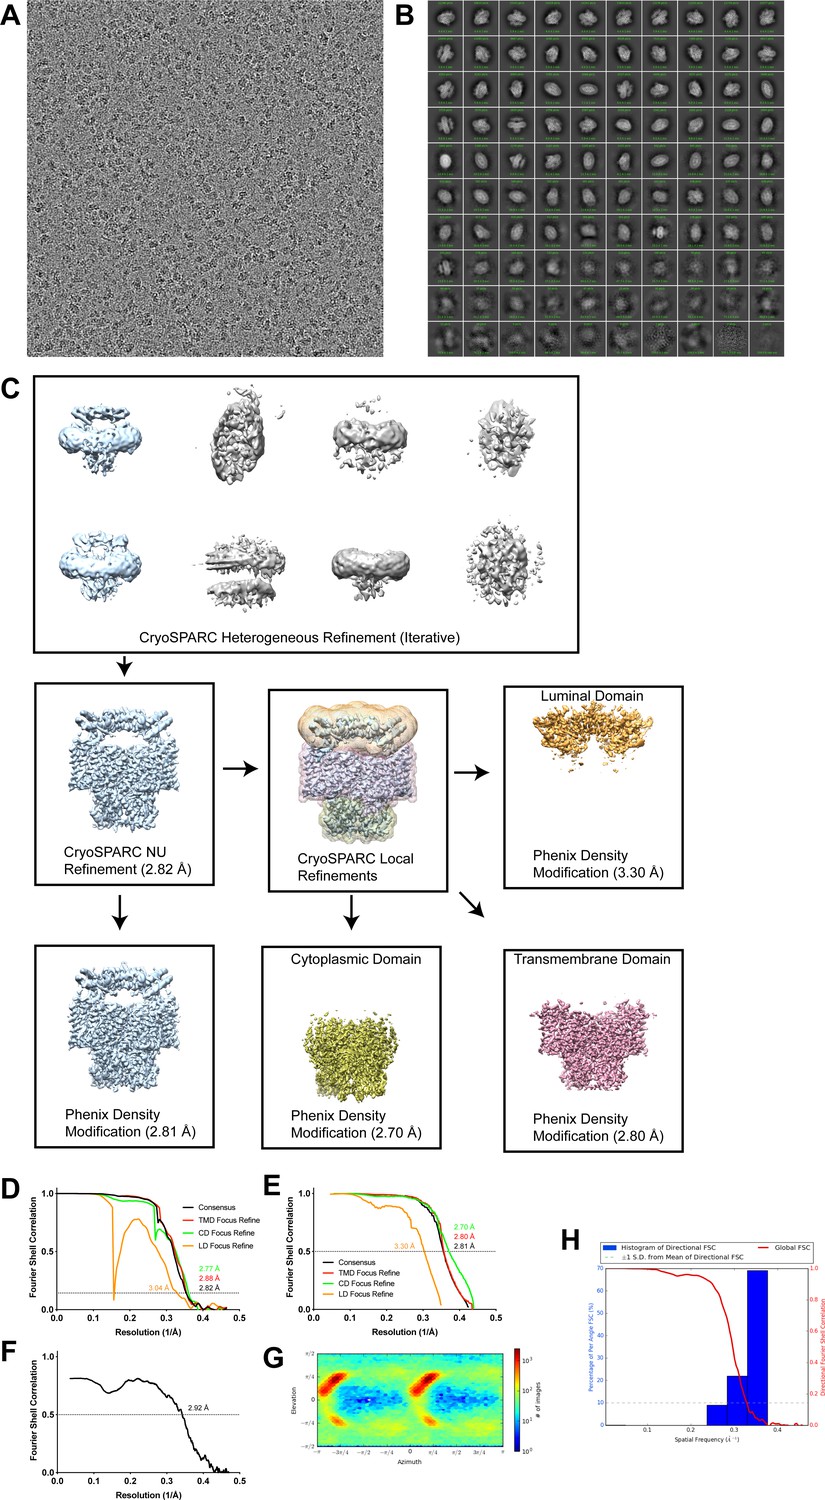
Cryo-EM analysis of human CLC-7/OSTM1.
(A) Representative cryo-EM image of hsCLC-7/OSTM1. (B) Two-dimensional class averages. (C) Simplified image processing workflow. (D) Fourier shell correlation (FSC) of two unfiltered half-maps for consensus (black), TMD focus refine (red), CD focus refine (green) and LD focus refine (orange) reconstructions. (E) Cross-correlation plot of two unfiltered half-maps following density modification for consensus (black), TMD focus refine (red), CD focus refine (green) and LD focus refine (orange) reconstructions. (F) FSC of map-to-model fit of human CLC-7/OSTM1 with composite density modified map. (G) Angular distribution. (H) ThreeDFSC anisotropy plots.
Figure 5—figure supplement 2
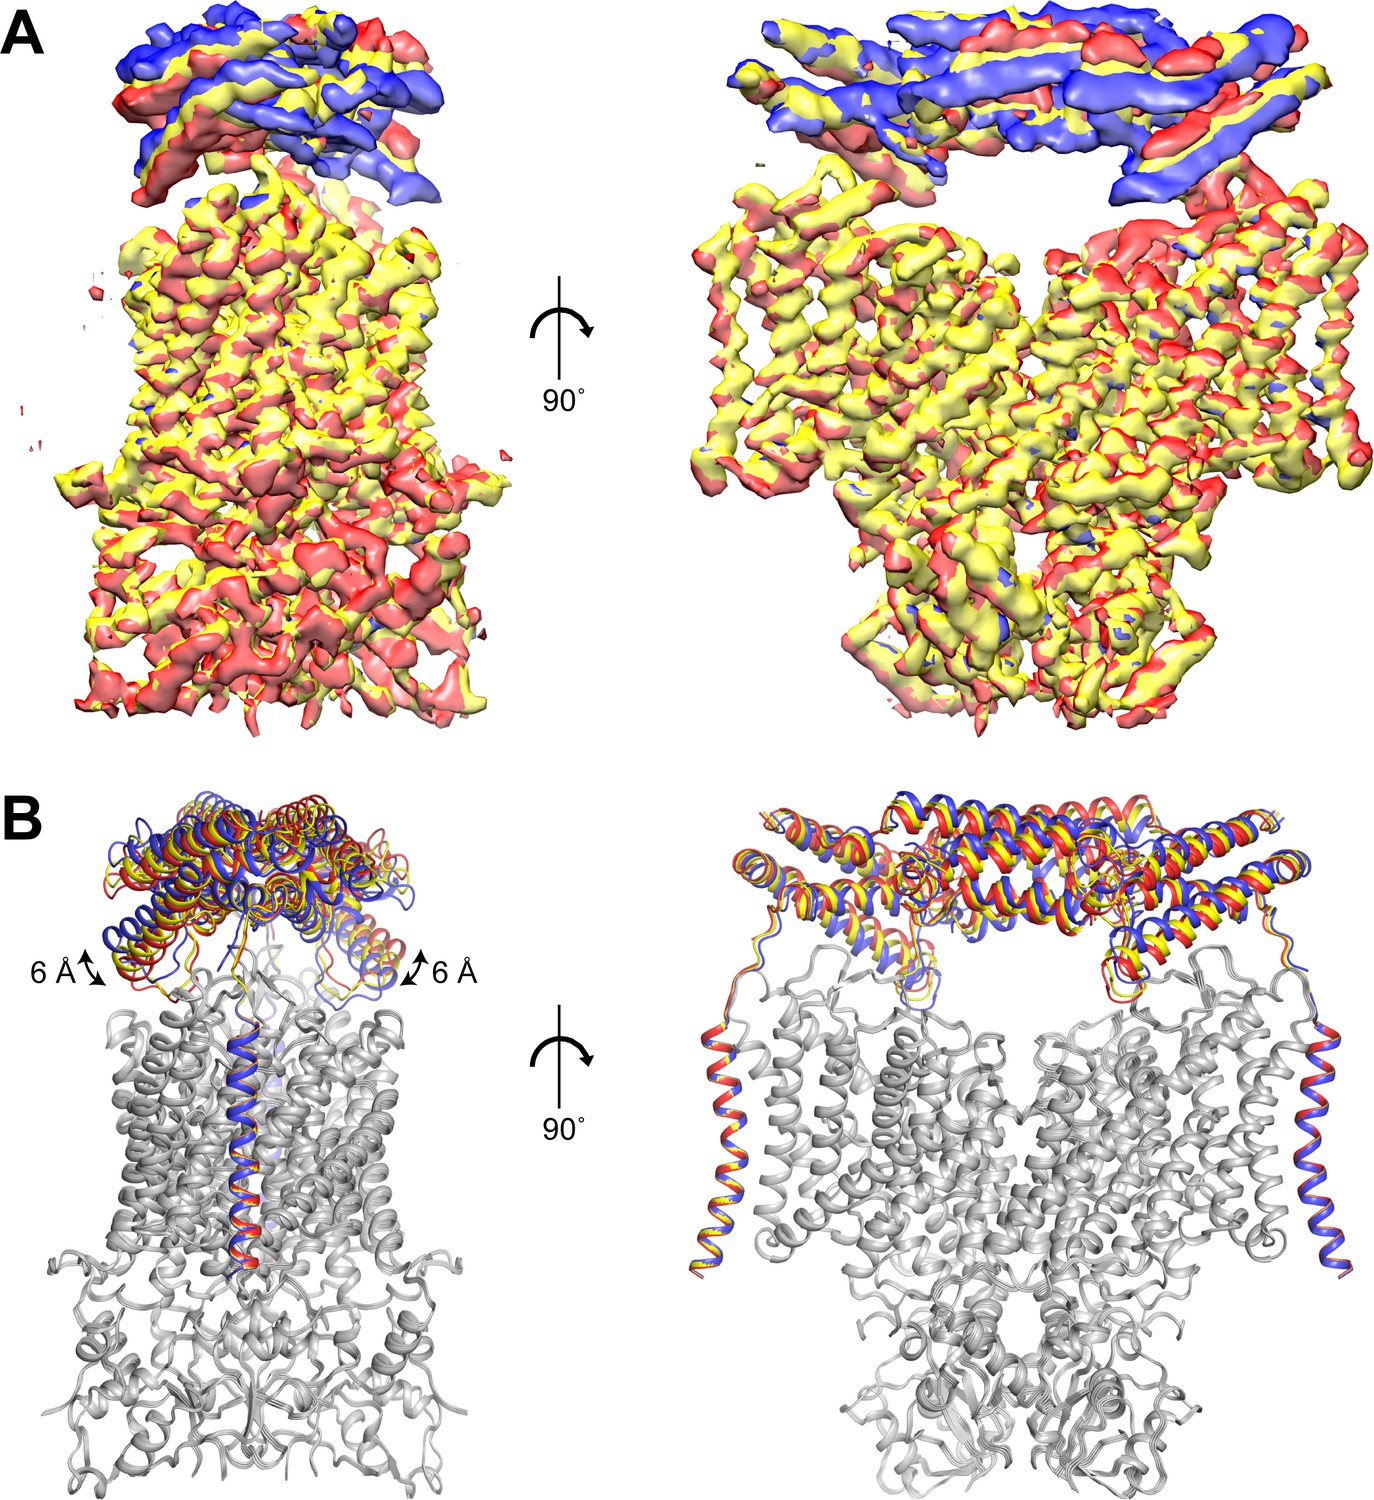
Three-dimensional variability analysis of human CLC-7/OSTM1.
Cryo-EM density maps (A) and models (B) revealing three orientations of the OSTM1 luminal domain. The red map is the origin (frame 000) of the second major component of 3DVA, the yellow map represents the midpoint (frame 010) and the blue map represents the end point (frame 019). The largest displacement occurs in helix h6, which moves by ~6 Å between the two extreme states. CLC-7 is colored grey in B.
Figure 5—figure supplement 3
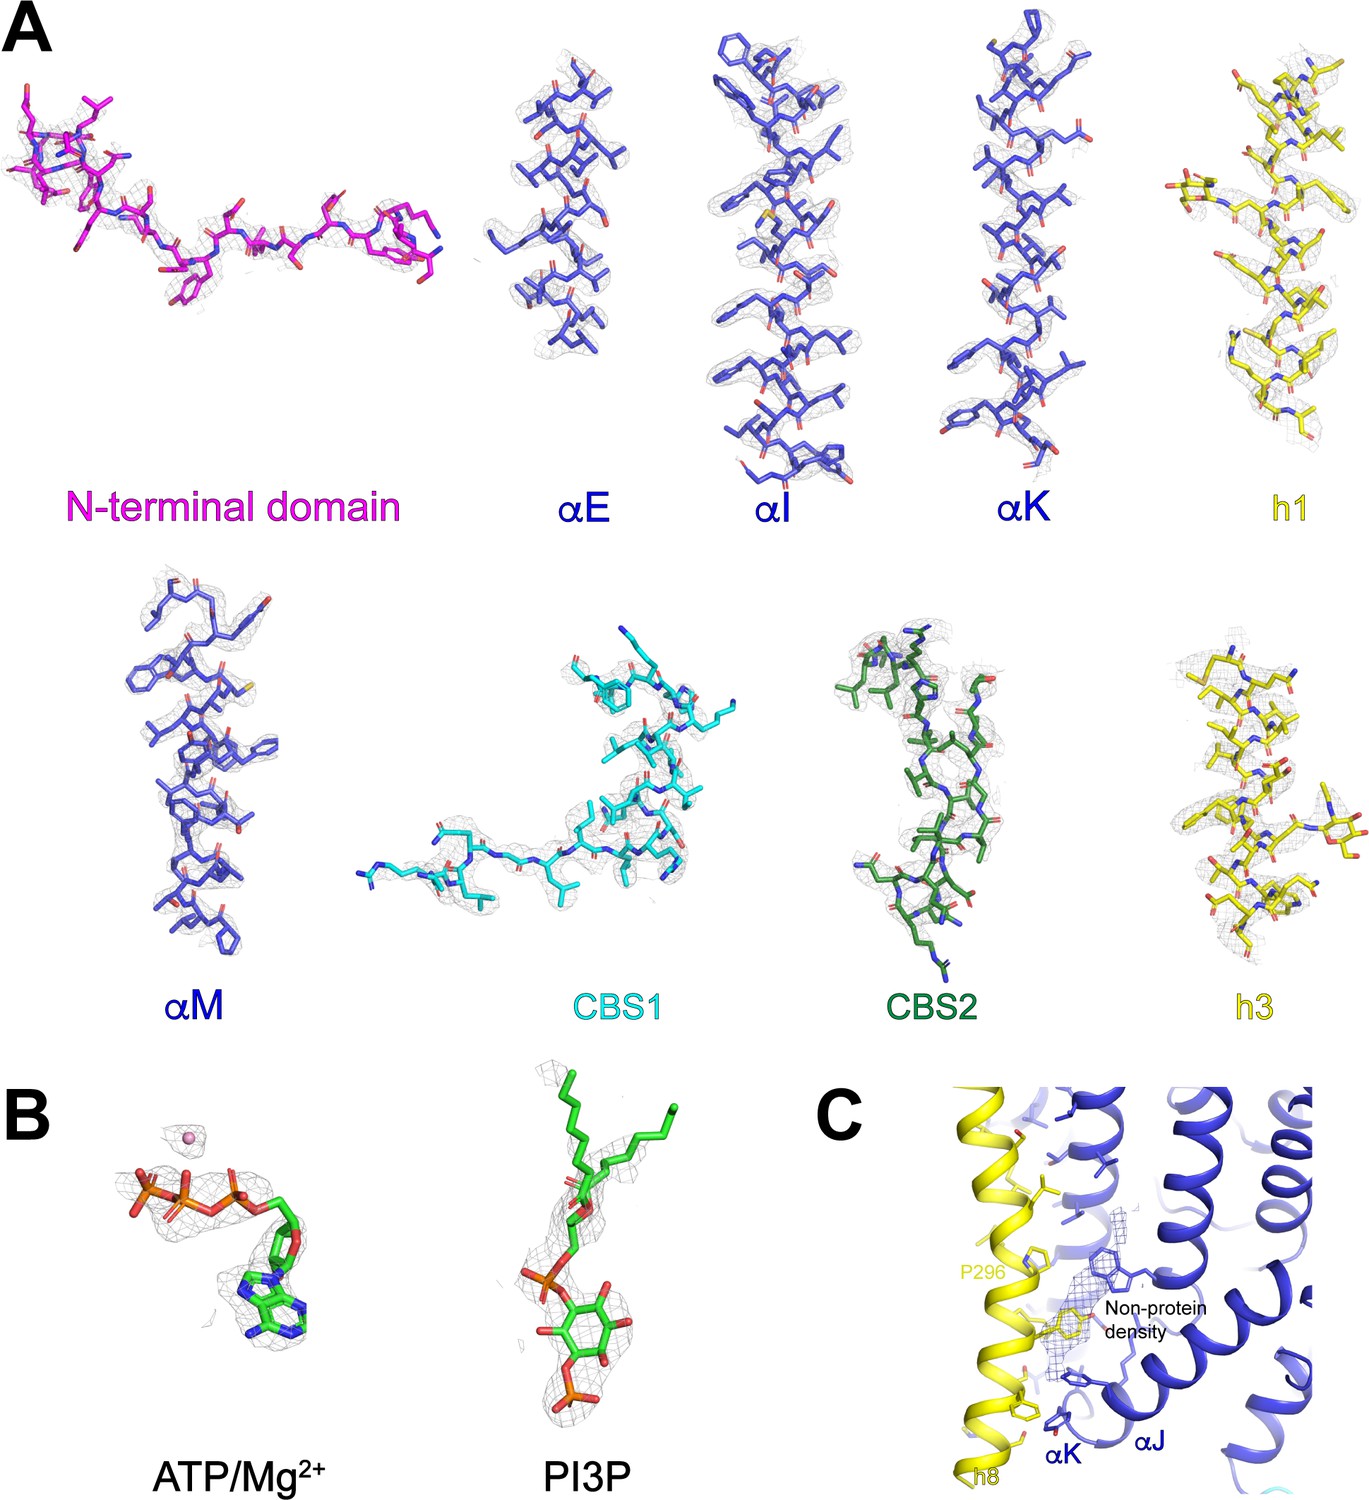
Representative cryo-EM density and model of human CLC-7/OSTM1.
(A) Representative sections of cryo-EM density shown as grey mesh displayed at 8 σ threshold. Refined coordinates are shown as sticks. (B) Density for modeled non-protein ligands. (C) Unmodeled density for potential lipid-binding site at the interface between CLC-7 and OSTM1. CLC-7 is colored by domain with, transmembrane domain in blue. OSTM1 is colored yellow.
Figure 5—figure supplement 4
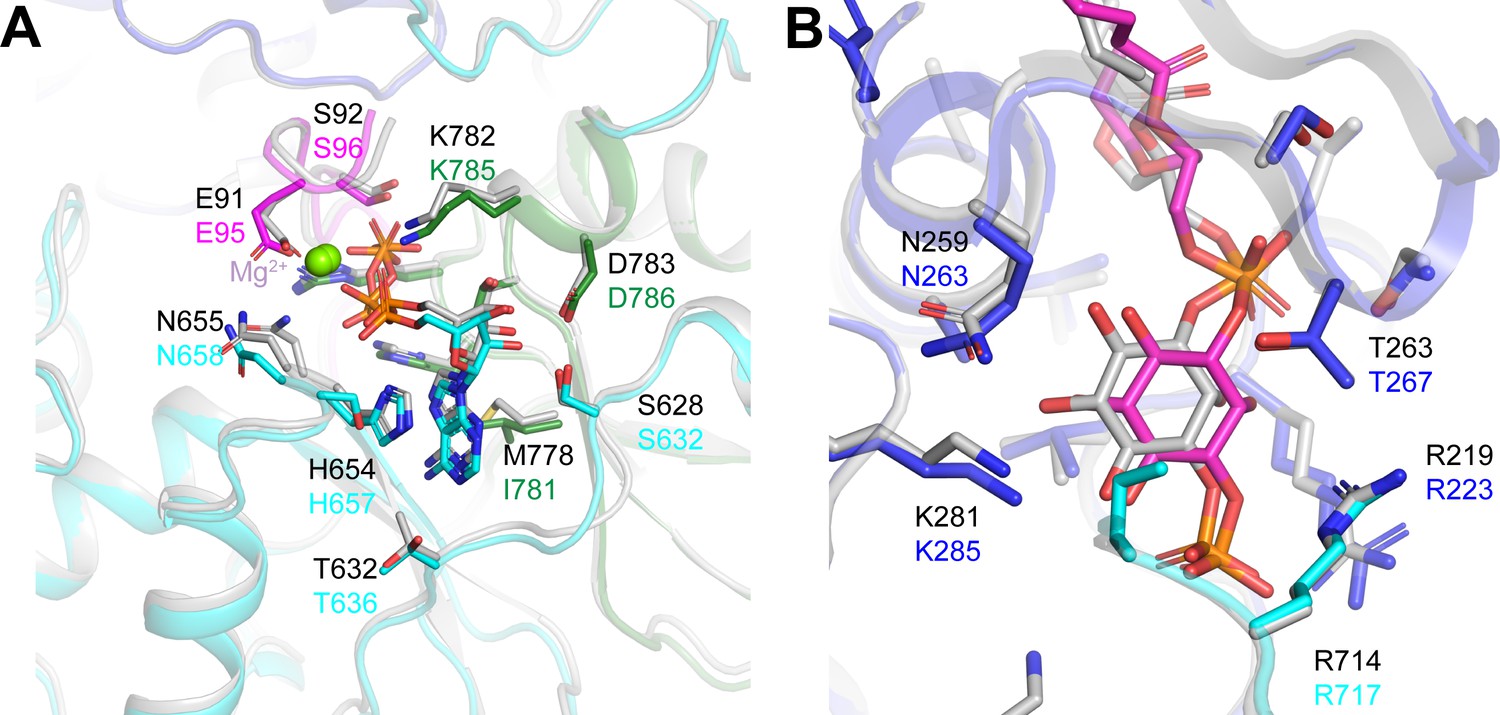
Comparison of ligand-binding sites in ggCLC-7 and human CLC-7/OSTM1.
(A) ATP-binding sites in ggCLC-7 (colored in grey) and hsCLC-7/OSTM1 (colored by domain). Black numbering is ggCLC-7 and colored numbering is hsCLC-7/OSTM1. (B) PI3P binding sites in ggCLC-7 (colored in grey) and hsCLC-7/OSTM1 (colored by domain). Black numbering is ggCLC-7 and colored numbering is hsCLC-7/OSTM1.
Figure 6
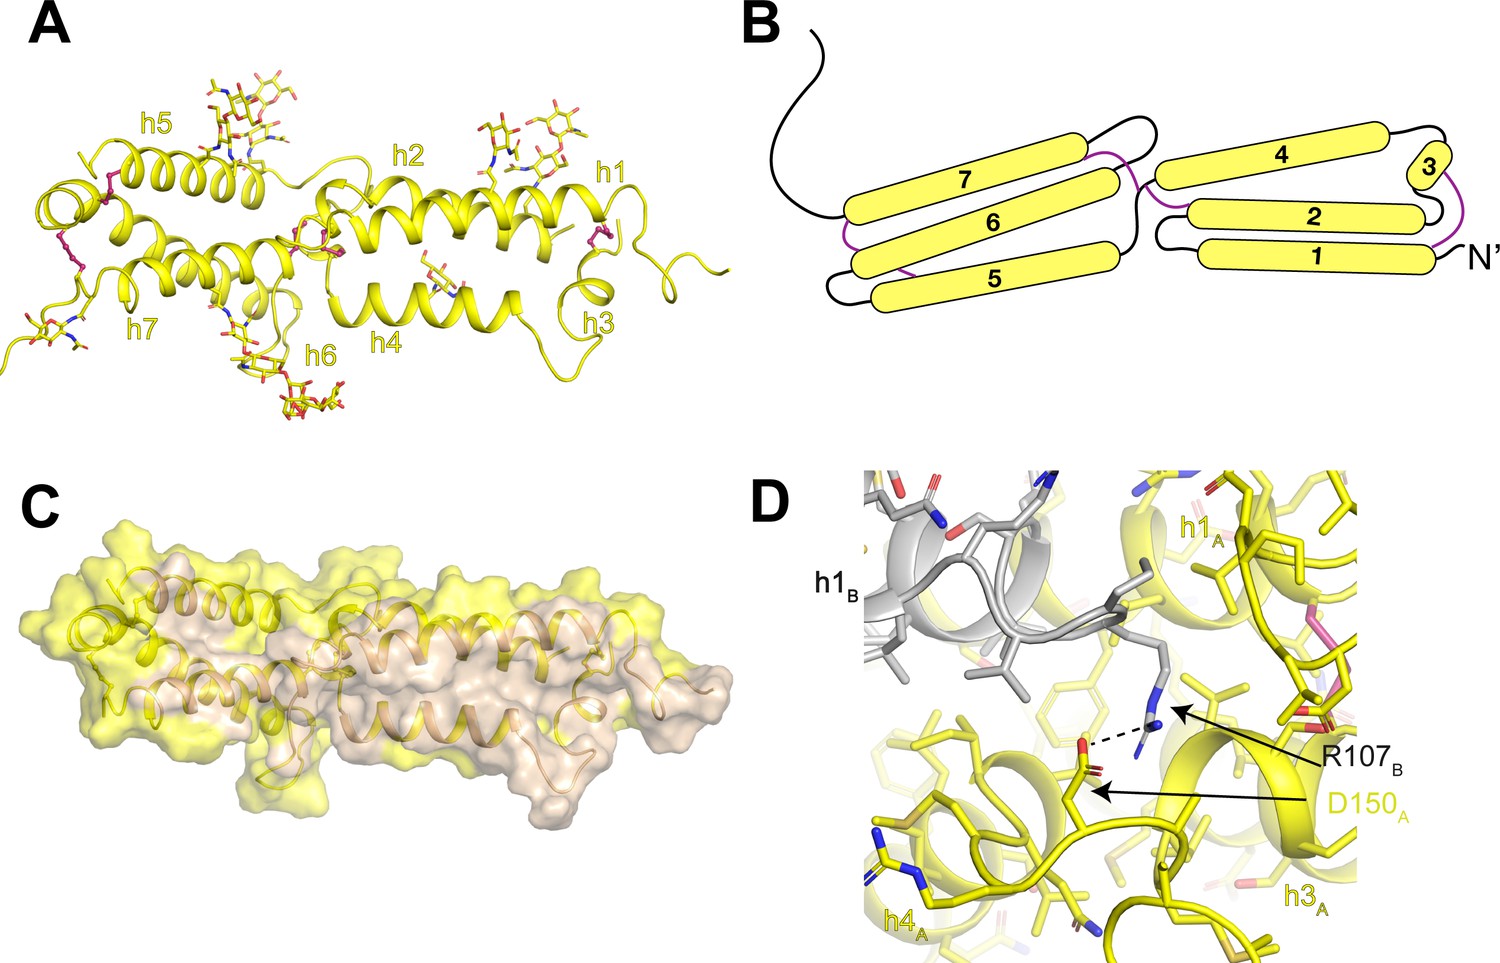
Architecture of the human OSTM1 luminal domain.
(A) Monomeric structure of the hsOSTM1 luminal domain. Disulfide bonds are shown as pink sticks and glycosylated asparagine residues are shown as sticks. (B) Domain topology of hsOSTM1 with disulfides depicted as pink lines. (C) hsOSTM1 dimer interface. Residues that mediate inter-protomer interactions are colored in wheat. (D) Inter-protomer interaction between D150 of protomer A and R107 of protomer B. Protomer A is colored yellow and protomer B is colored grey.
Figure 7 with 4 supplements
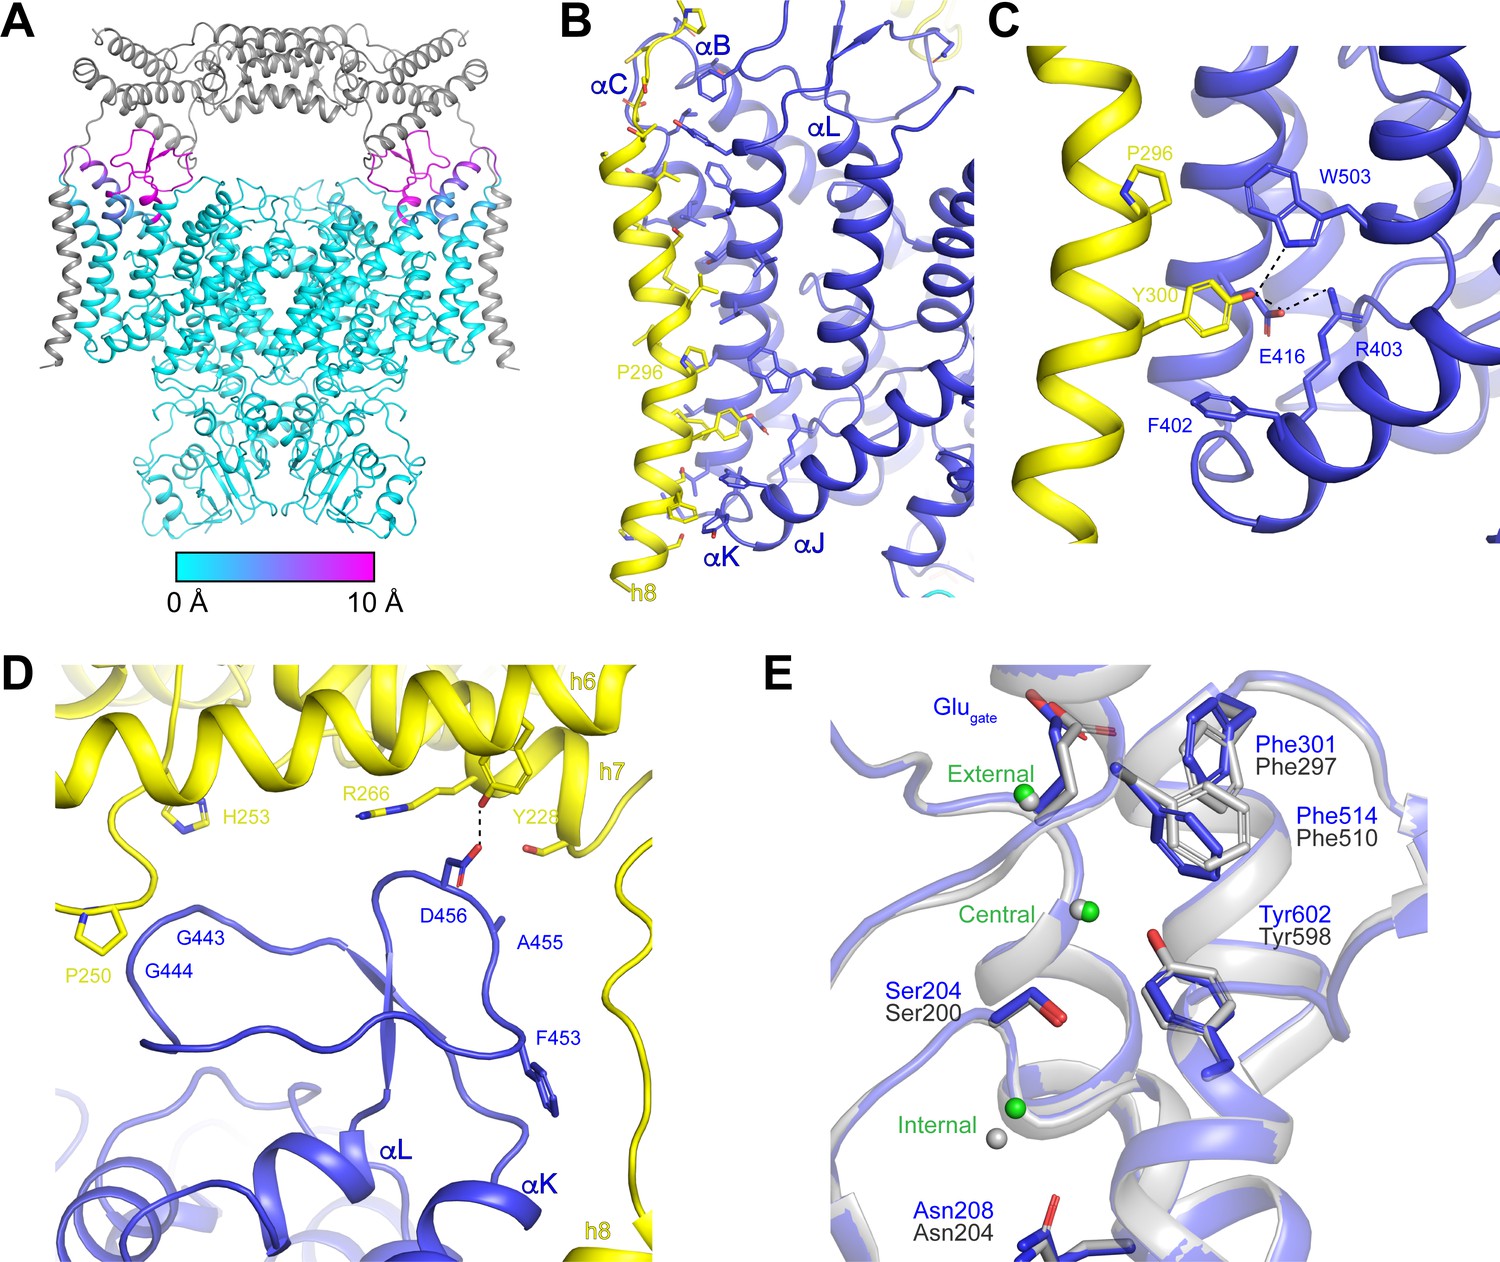
OSTM1-induced conformational changes.
(A) Structure of hsCLC-7/OSTM1 with CLC-7 colored by Cα displacement compared to ggCLC-7 and OSTM1 colored in grey. (B) hsCLC-7/OSTM1 transmembrane domain interface. Residues that participate in the interaction are shown as sticks. CLC-7 is colored in blue and OSTM1 is colored yellow. (C) Polar interaction network in the transmembrane domain interface between CLC-7 and OSTM1. (D) Loop between αK and αL is stabilized by interactions with OSTM1 luminal domain. (E) Cl--conduction pathways of human CLC-7/OSTM1 (colored by domain) and ggCLC-7 (grey). Interacting side chains are shown as sticks and Cl- ions are shown as spheres. Blue residue numbers correspond to human CLC-7 and grey numbers correspond to ggCLC-7.
Figure 7—figure supplement 1
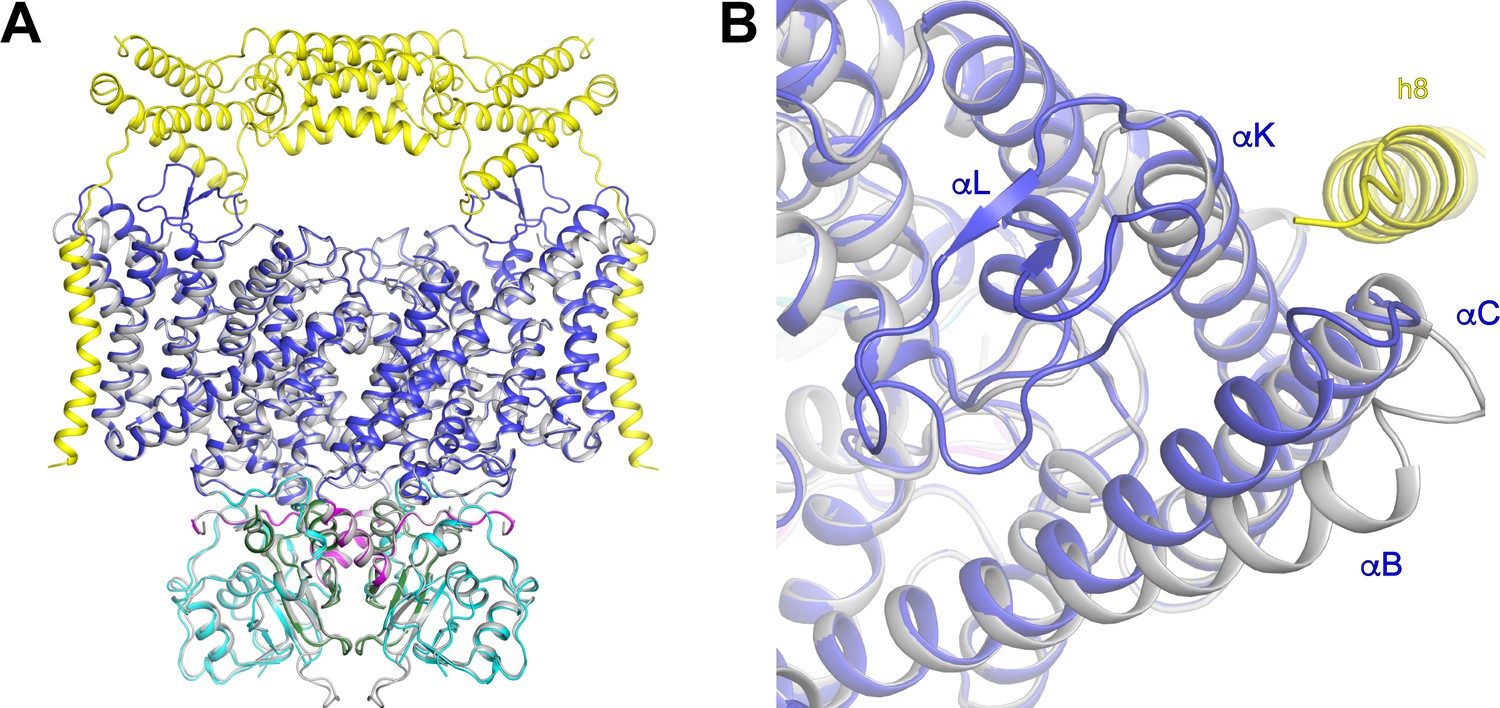
Structures of CLC-7 with and without OSTM1.
(A) Superposition of hsCLC-7/OSTM1 (colored by domain) and ggCLC-7 (colored in grey) viewed from within the membrane. (B) Conformational changes in the CLC-7 transmembrane domain to accommodate OSTM1 binding viewed from the lysosomal lumen. HsCLC-7/OSTM1 is colored by domain and ggCLC-7 colored in grey.
Figure 7—figure supplement 2
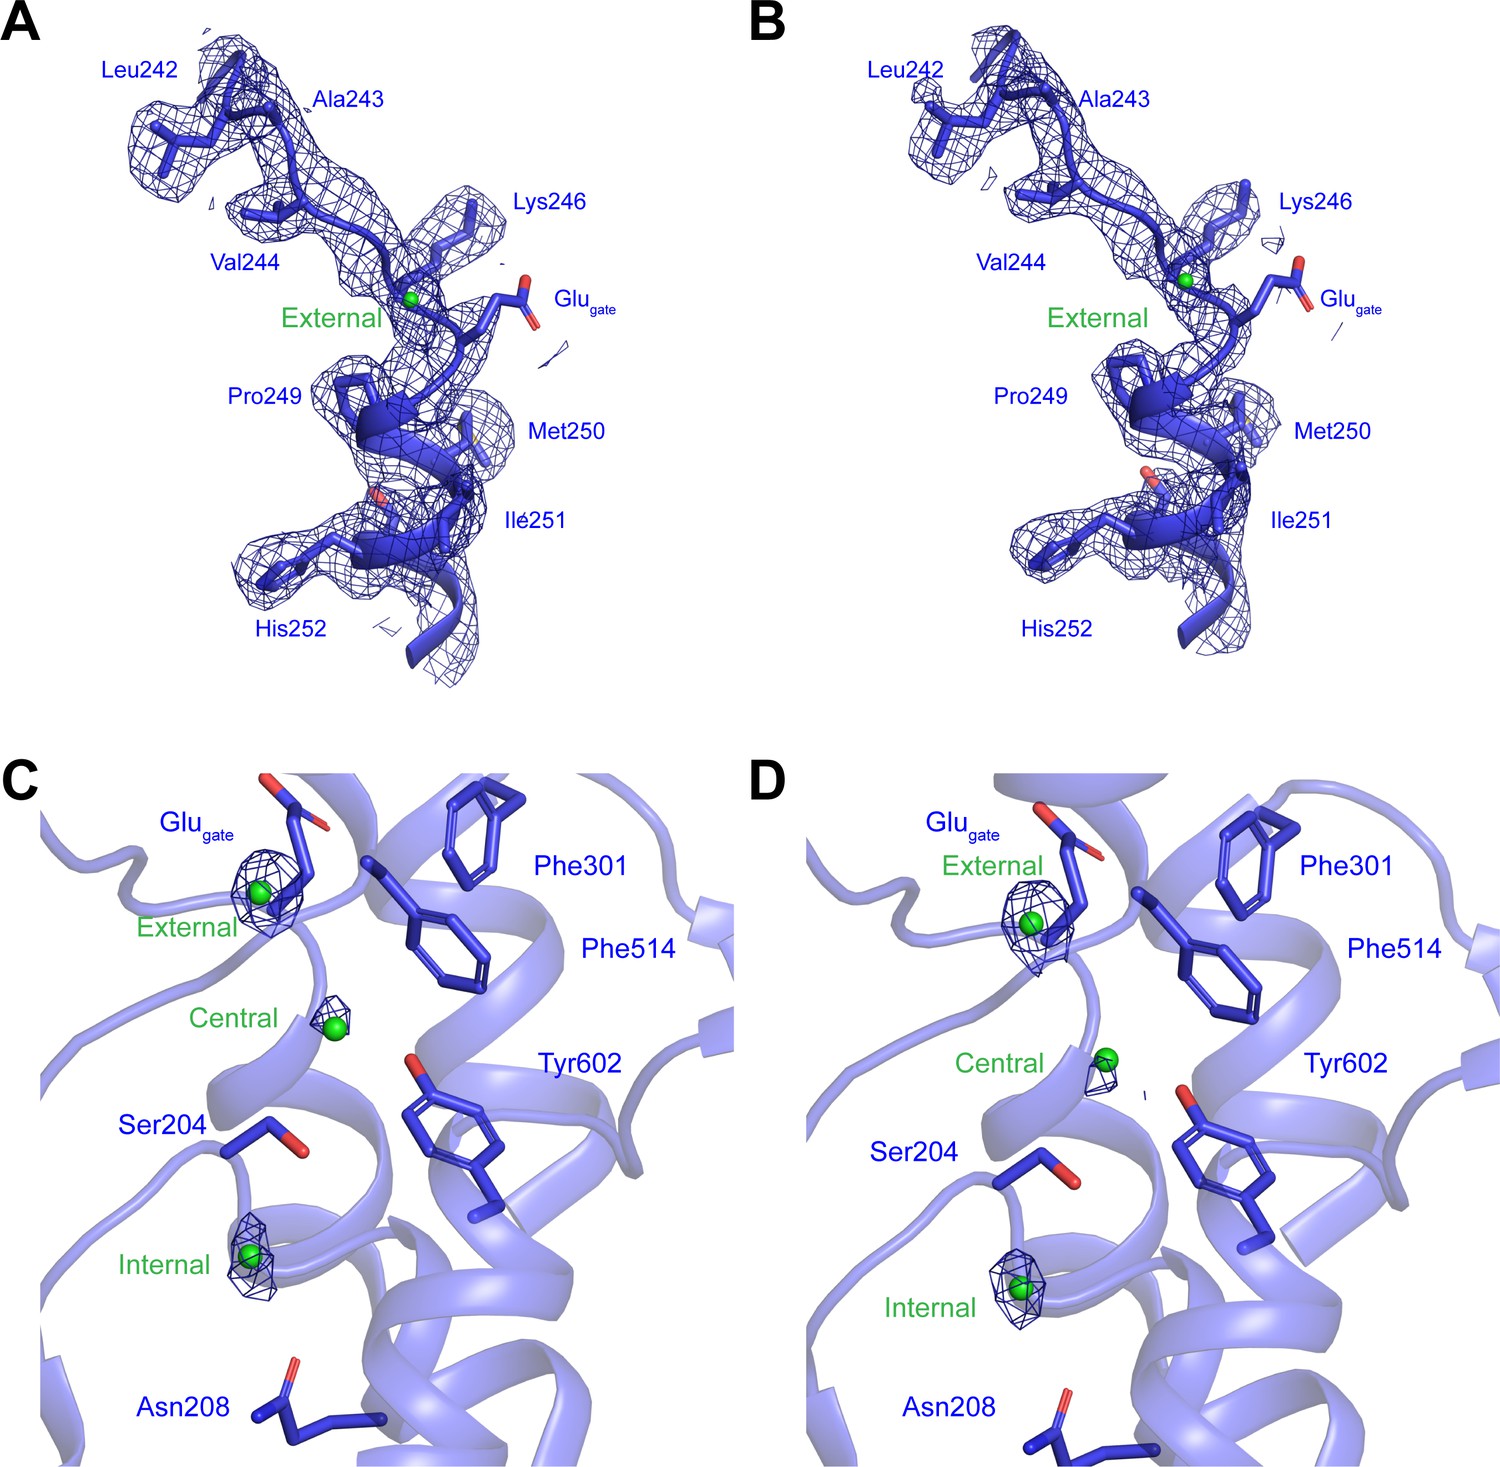
Cl--conduction pathway in human CLC-7/OSTM1.
(A–B) Experimental cryo-EM density for helix αF in hsCLC-7/OSTM1 consensus (A) and transmembrane domain focus refined (B) maps is shown as blue mesh contoured at 7 σ threshold. (C–D) Density for Cl--binding sites in hsCLC-7/OSTM1 consensus (C) and transmembrane domain focus refined (D) maps is shown as blue mesh contoured at 7 σ threshold. Cl- ions are shown as green spheres.
Figure 7—figure supplement 3
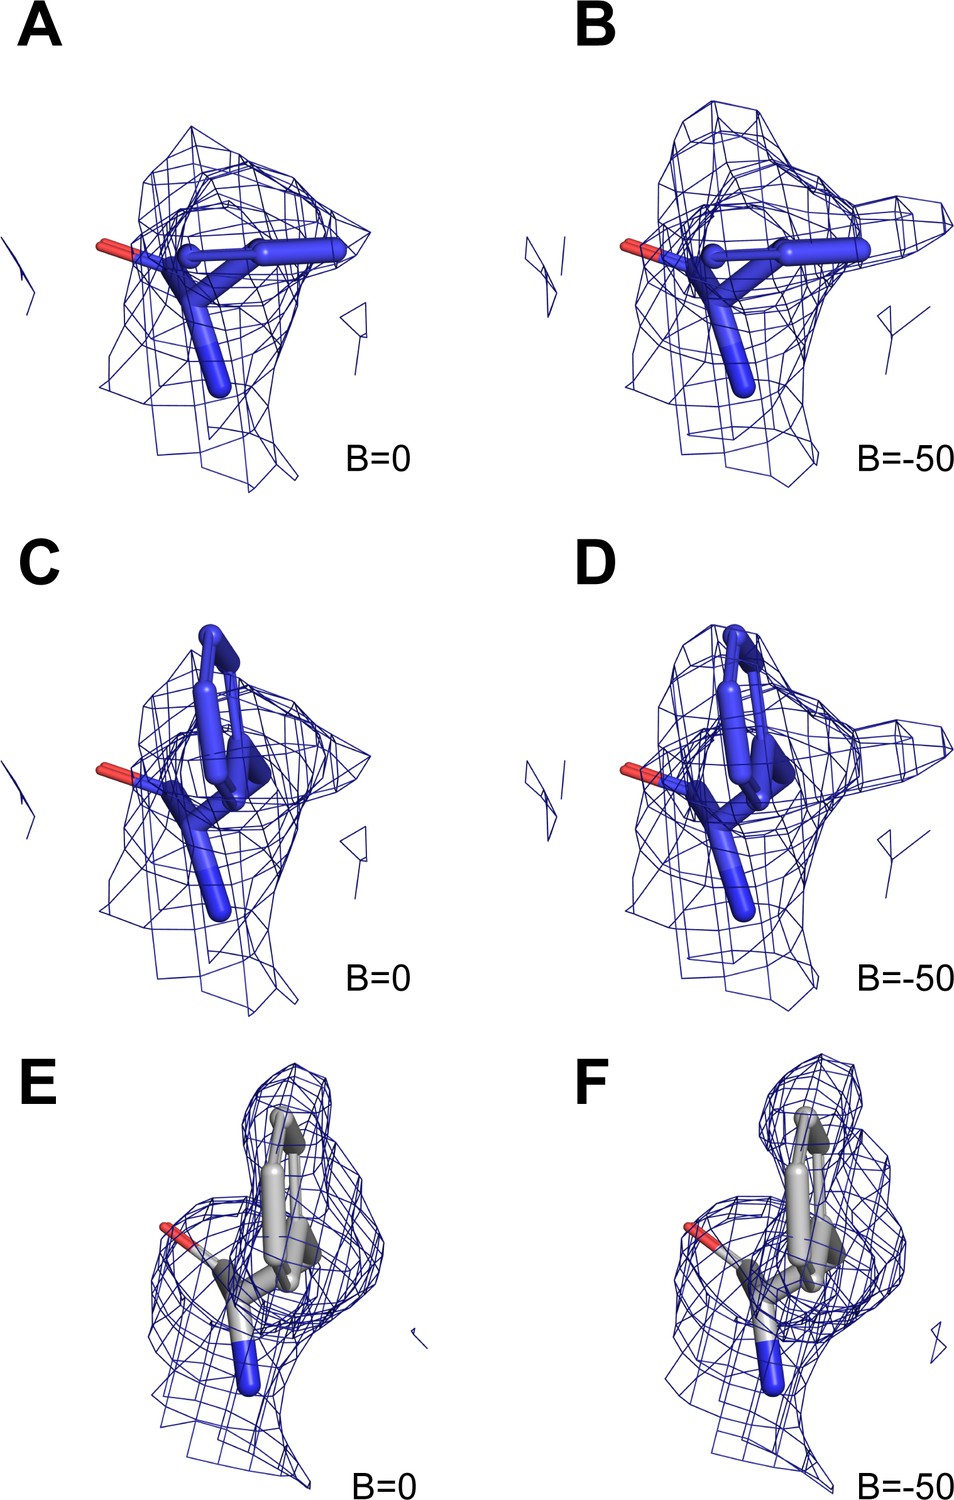
Heterogeneity in the conformation of Phe514/Phe510.
(A–B) Cryo-EM density for Phe514 in conformation one in hsCLC-7/OSTM1 composite map (A) and sharpened (B=-50) composite map (B). (C–D) Cryo-EM density for Phe514 modeled in conformation two in hsCLC-7/OSTM1 composite map (C) and sharpened (B=-50) composite map (D). Density maps are shown as blue mesh contoured at 7 σ threshold. (E–F) Cryo-EM density for Phe510 modeled in conformation two in ggCLC-7 map (E) and sharpened (B=-50) map (F). Density maps are shown as blue mesh contoured at 8 σ threshold.
Figure 7—figure supplement 4
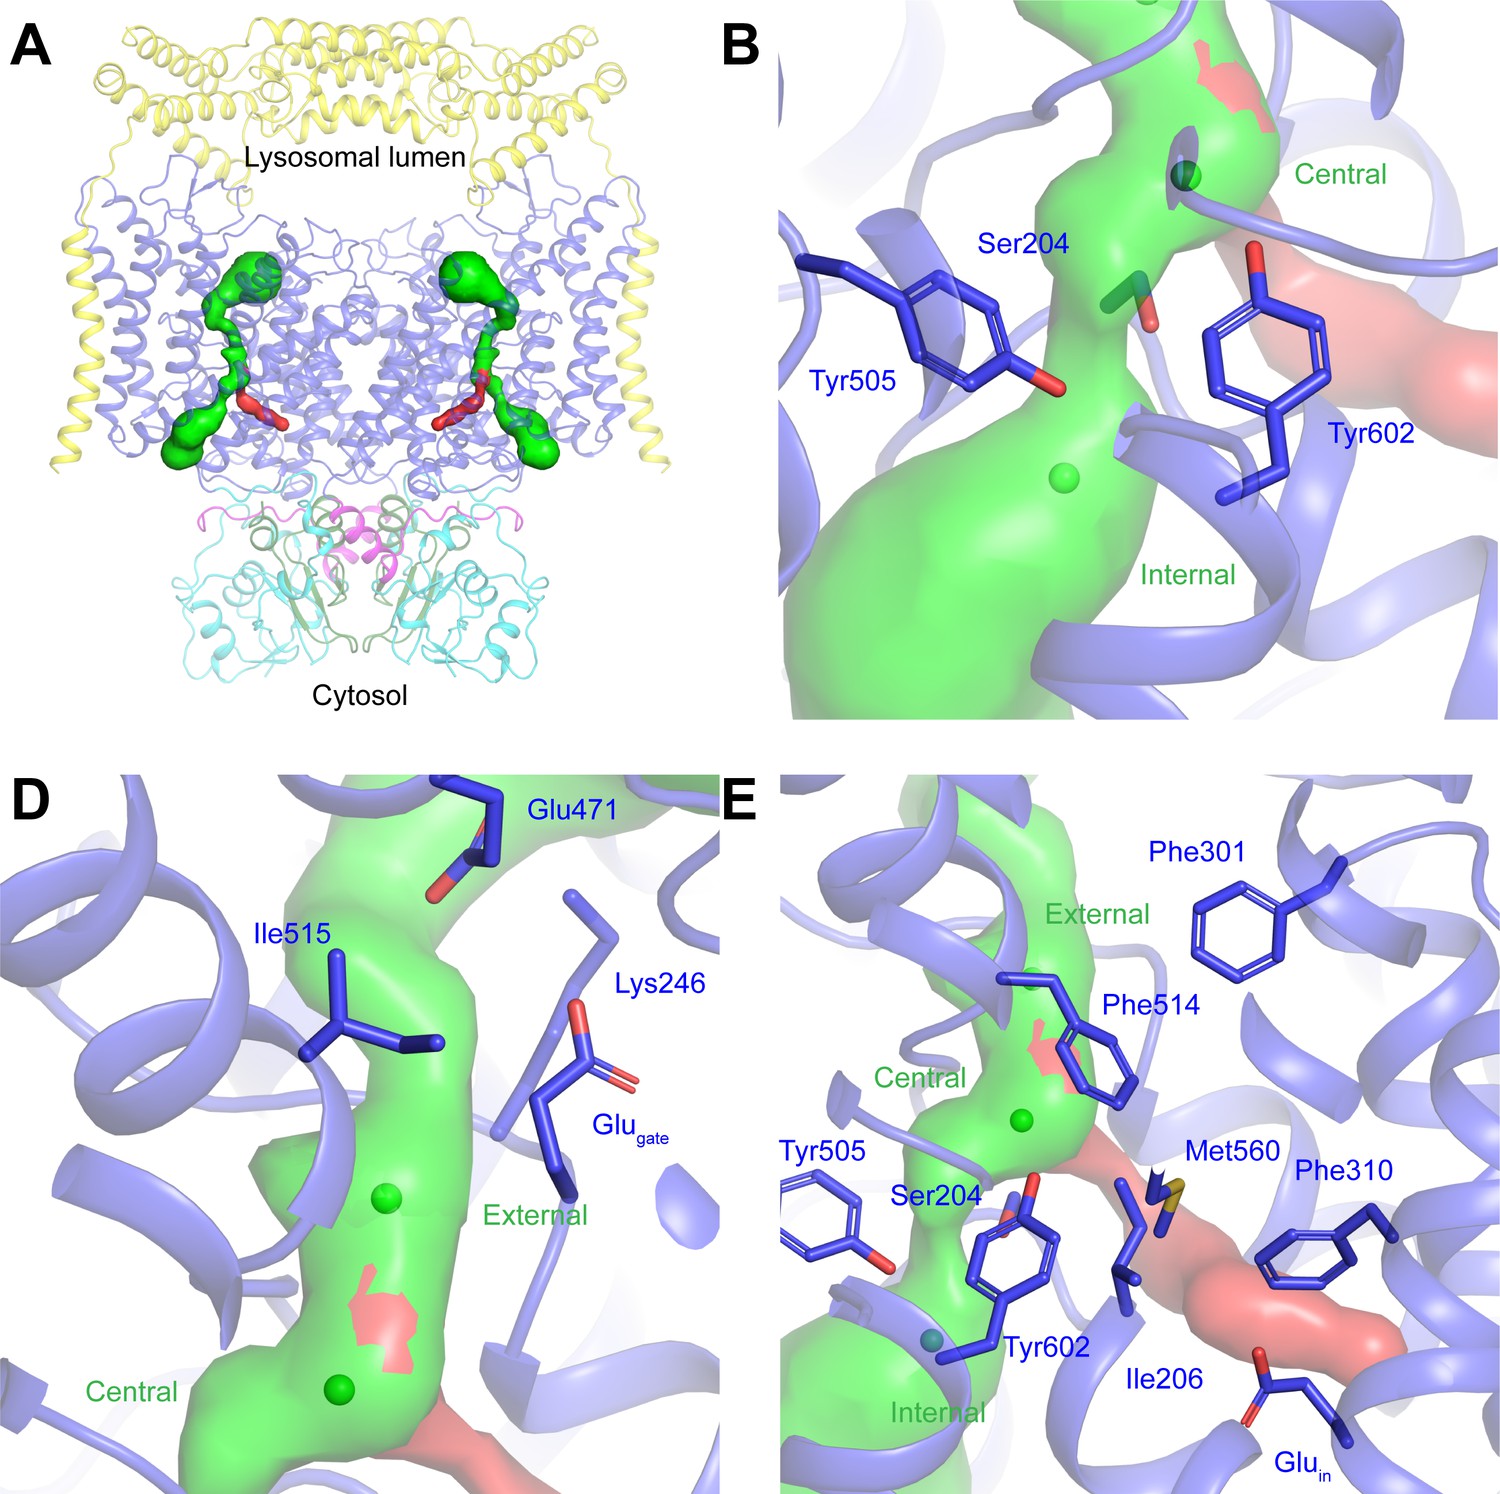
Ion conduction pathways in human CLC-7/OSTM1.
(A) Cl-- and potential H+-conduction pathways through human CLC-7/OSTM1 shown as green and red surfaces, respectively. (B) The cytosolic constriction between the central and internal Cl--binding sites is formed by Ser204, Tyr505 and Tyr602 narrows the pathway to a minimum radius of 0.4 Å. (C) The luminal constrictions are formed by Glugate, Lys246 and Ile515 and by Lys246, Glu471 and Ile515 and narrow the pathway to a minimum radius of 1.0 Å. (D) Potential H+ conduction pathway between the central Cl- site and Gluin. The pathway is sealed from the Cl- pathway by Phe514 and Tyr602 and from the cytosol by Phe310 and Met560.
Figure 8
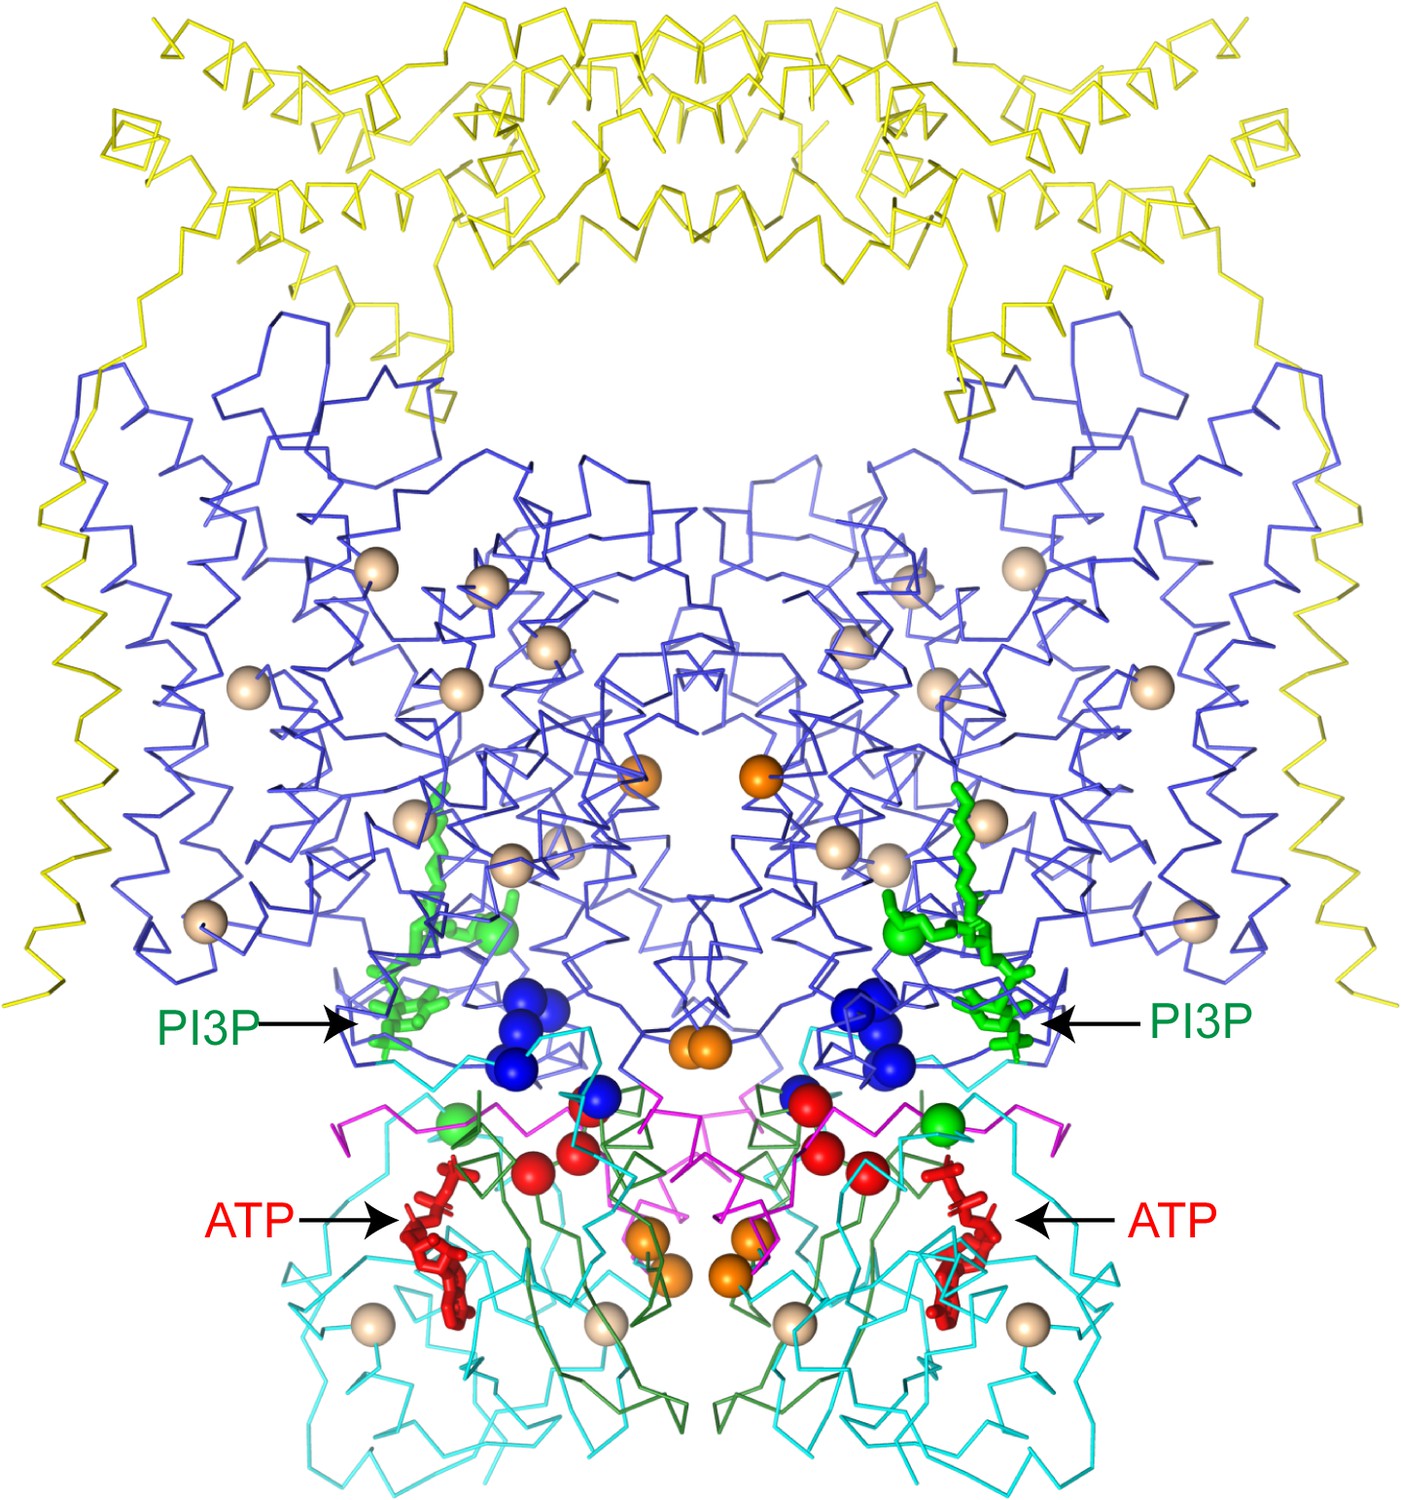
CLC-7 mutations associated with osteopetrosis and lipid storage disease.
Structure of hsCLC-7/OSTM1 colored by domain with PI3P and ATP shown as green and red sticks, respectively. Spheres represent residues with disease-causing mutations. Wheat spheres represent residues with buried side chains, orange spheres represent residues at inter-domain interfaces, green spheres represent residues near the PI3P binding site, blue spheres represent residues at transmembrane-CBS-domain interfaces and red spheres represent residues near the ATP-binding site.
Tables
Table 1
Cryo-EM data acquisition, reconstruction and model refinement statistics.
| ggCLC-7 | hsCLC-7/OSTM1 | ||||
|---|---|---|---|---|---|
| Consensus | Consensus | TMD Focus | LD Focus | CD Focus | |
| Cryo-EM acquisition and processing | |||||
| EMDB accession # | 22386 | 22389 | |||
| Magnification | 22,500x | 22,500x | 22,500x | 22,500x | 22,500x |
| Voltage (kV) | 300 | 300 | 300 | 300 | 300 |
| Total electron | 61 | 44 | 44 | 44 | 44 |
| Exposure (e-/Å2) | |||||
| Exposure time (s) | 8 | 4 | 4 | 4 | 4 |
| Defocus range (µM) | -1.0 to -2.5 | -1.0 to -2.5 | -1.0 to -2.5 | -1.0 to -2.5 | -1.0 to -2.5 |
| Pixel size (Å) | 1.0723 | 1.064 | 1.064 | 1.064 | 1.064 |
| Symmetry imposed | C2 | C2 | C1 | C1 | C1 |
| Initial particles | 4,020,225 | 15,288,379 | 15,288,379 | 15,288,379 | 15,288,379 |
| Final particles | 87,707 | 327,619 | 655,238 | 655,238 | 655,238 |
| Resolution (masked, Å) | 2.93 | 2.82 | 2.85 | 2.79 | 3.04 |
| Density modified CC (0.5, Å) | 2.92 | 2.81 | 2.80 | 2.70 | 3.30 |
| Model refinement | |||||
| PDB ID | 7JM6 | 7JM7 | |||
| Model resolution (Å) | 2.98/2.40 | 2.92/2.56 | |||
| FSC threshold | 0.50/0.143 | 0.50/0.143 | |||
| Model refinement resolution | 300-2.9 | 300-2.8 | |||
| RMS deviations | |||||
| Bond length (Å) | 0.005 | 0.005 | |||
| Bond angle (°) | 0.806 | 0.769 | |||
| Ramachandran plot | |||||
| Favored (%) | 97.73 | 97.87 | |||
| Allowed (%) | 2.27 | 2.13 | |||
| Disallowed (%) | 0 | 0 | |||
| Rotamer Outliers (%) | 0.00 | 1.17 | |||
| Validation | |||||
| MolProbity score | 1.37 | 1.37 | |||
| Clashscore | 5.68 | 5.38 | |||
Key resources table
| Reagent type (species) or resource | Designation | Source or reference | Identifiers | Additional information |
|---|---|---|---|---|
| Gene (Gallus gallus) | ggCLC-7 | Synbio technologies | ||
| Gene (Homo sapiens) | hsCLCN7 | Synbio technologies | ||
| Gene (Homo sapiens) | hsOSTM1 | Synbio technologies | ||
| Cell line (Homo sapiens) | HEK-293T | ATCC | CRL-3216 RRID:CVCL_0063 | |
| Cell line (Homo sapiens) | HEK-293S GnTi- | ATCC | CRL-3022 | |
| Chemical compound, drug | Polyethylenimine, Linear, MW 25000, Transfection Grade (PEI 25K) | Polysciences, Inc | 23966–1 | |
| Chemical compound, drug | Sodium Butyrate | Sigma | 8451440100 | |
| Chemical compound, drug | Valproic acid | Sigma | P4543 | |
| Chemical compound, drug | Lauryl maltose neopentyl glycol | Anatrace | NG310 | |
| Software, algorithm | MotionCor2 | Zheng et al., 2017 | RRID:SCR_016499 | |
| Software, algorithm | CtfFind 4.1.10 | Rohou and Grigorieff, 2015 | RRID:SCR_016731 | |
| Software, algorithm | RELION 3.1 | Scheres, 2016 | http://www2.mrc-lmb.cam.ac.uk/relion RRID:SCR_016274 | |
| Software, algorithm | SerialEM | Mastronarde, 2005 | RRID:SCR_017293 | |
| Software, algorithm | cryoSPARC v2 | Structura Biotechnology | https://cryosparc.com/ RRID:SCR_016501 | |
| Software, algorithm | PHENIX | Liebschner et al., 2019 | https://www.phenix-online.org/ RRID:SCR_014224 | |
| Software, algorithm | COOT | Emsley et al., 2010 | https://www2.mrc-lmb.cam.ac.uk/personal/pemsley/coot/ RRID:SCR_014222 | |
| Software, algorithm | PyMOL | Schrödinger LLC, 2020 | https://pymol.org/2/ RRID:SCR_000305 | |
| Software, algorithm | MOLE | Pravda et al., 2018 | https://mole.upol.cz RRID:SCR_018314 | |
| Software, algorithm | UCSF Chimera | Pettersen et al., 2004 | https://www.cgl.ucsf.edu/chimera RRID:SCR_004097 | |
| Software, algorithm | Blocres/Bsoft | Heymann | ||
| Software algorithm | Jalview | Waterhouse et al., 2009 | https://www.jalview.org RRID:SCR_006459 | |
| Others | QUANTIFOIL R1.2/1.3 holey carbon grids | Quantifoil | ||
| Others | FEI Vitrobot Mark IV | FEI Thermo Fisher |
Additional files
Download links
A two-part list of links to download the article, or parts of the article, in various formats.
Downloads (link to download the article as PDF)
Open citations (links to open the citations from this article in various online reference manager services)
Cite this article (links to download the citations from this article in formats compatible with various reference manager tools)
Cryo-EM structure of the lysosomal chloride-proton exchanger CLC-7 in complex with OSTM1
eLife 9:e59555.
https://doi.org/10.7554/eLife.59555


