Extensive and diverse patterns of cell death sculpt neural networks in insects
- Centre for Developmental Neurobiology, King's College London, United Kingdom
- Neuroengineering Laboratory, Brain Mind Institute and Institute of Bioengineering, École Polytechnique Fédérale de Lausanne, Switzerland
- Genetic Strains Research Center, National Institute of Genetics, Japan
Figures
Figure 1
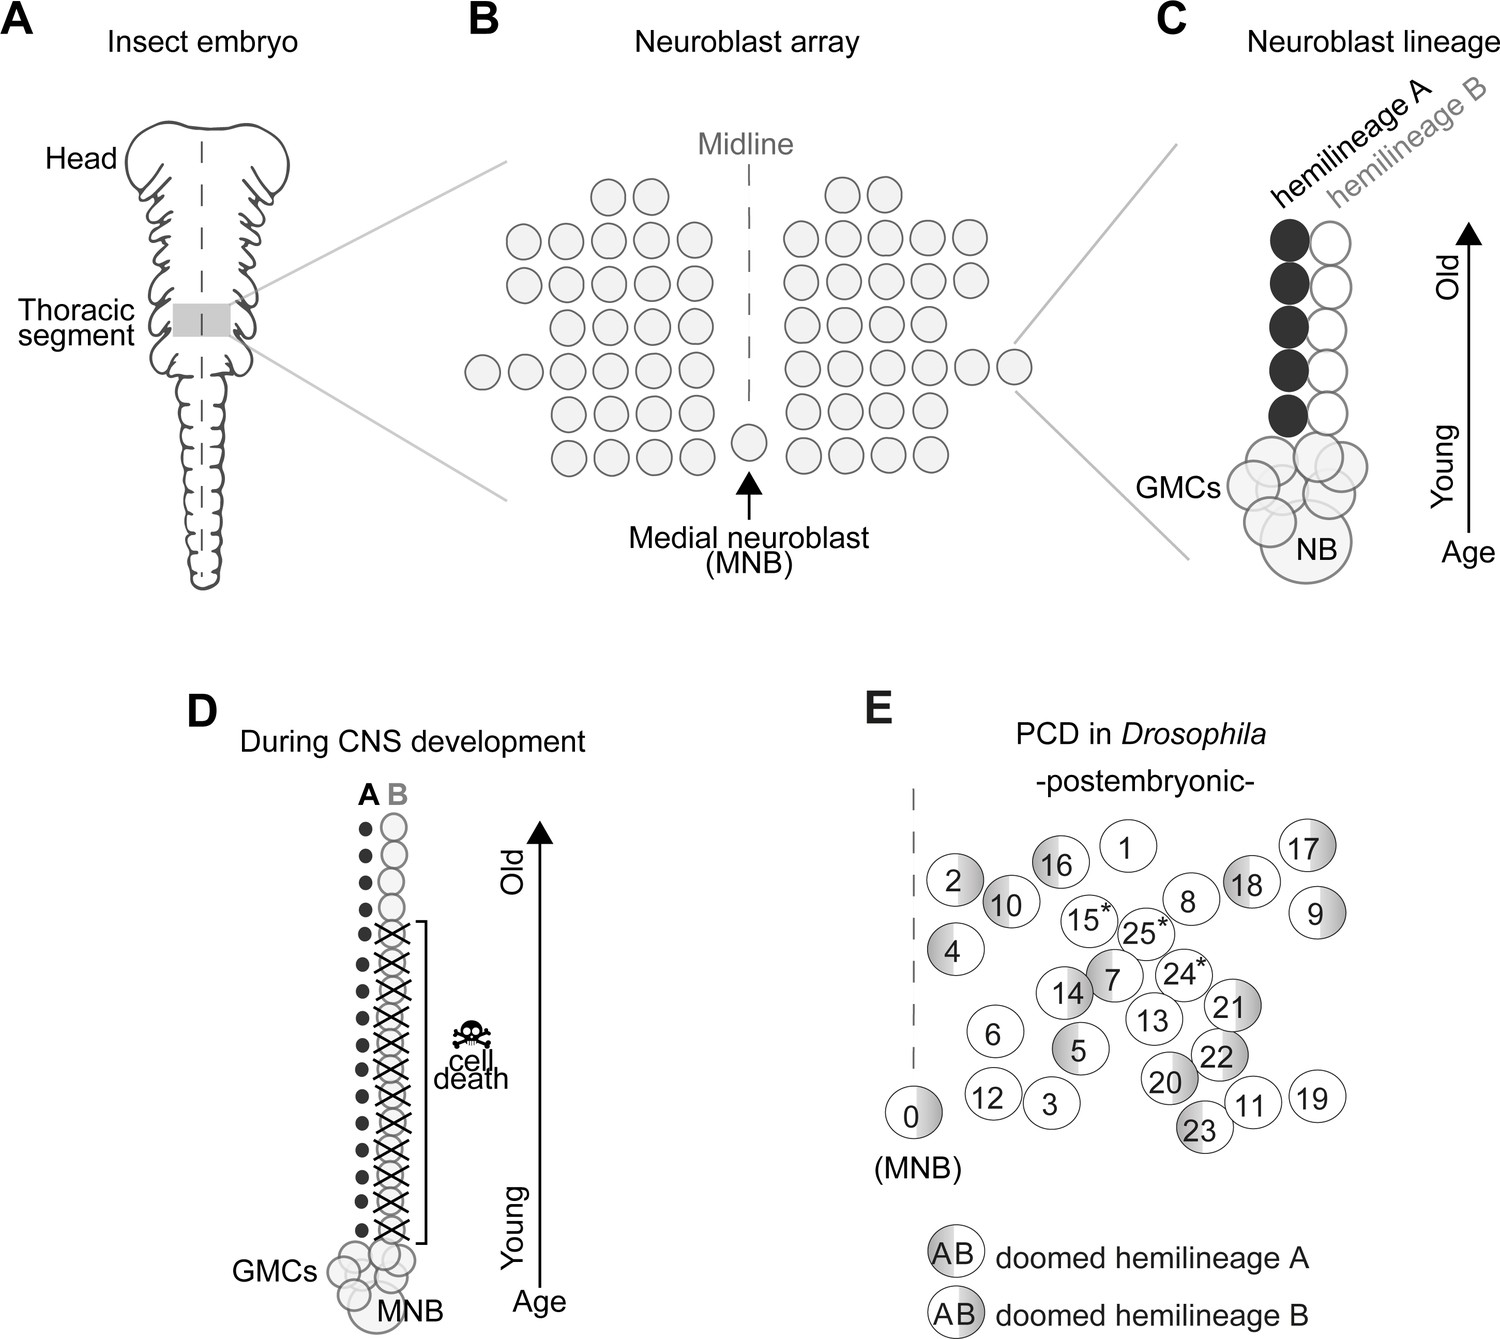
Early neurogenesis in insects.
(A) Cartoon of a young grasshopper embryo, here used as a depiction of a generic insect embryo (modified from Truman, 1996). Thoracic territory where one segment-worth of neuroectoderm generates an array of neuroblasts (NB) (grey box). (B) Schematic of NB array showing bilaterally symmetric NBs organised in seven rows and six columns and a single median neuroblast (MNB) (modified from Truman, 1996). (C) Schematic of a lineage derived from an NB. Every NB buds off a ganglion mother cell (GMC) which undergoes a terminal division to generate two neurons with distinct cell fates, an A cell (black) and a B cell (grey). As the A and B cells result from a single division, one cannot be produced without the other. After several rounds of GMC divisions, a lineage produced by a single NB is composed of two half-lineages: ‘hemilineage A’ made up of all the A cells and ‘hemilineage B’ made up of B cells. Arrow indicates relative age, with newly born cells located close to the NB. (D) Schematic of MNB during development with ‘hemilineage A’ cells (black) and ‘hemilineage B’ (grey). The first neurons in hemilineage B cells survive (they are the oldest). After this point, all hemilineage B cells are removed by PCD whereas ‘hemilineage A’ cells from the same GMC division are left intact. (E) Schematic representation of the pattern of hemilineage-specific cell death in one hemisegment in the mesothorax. Each circle represents one lineage produced by one NB. Numbers represent postembryonic lineage nomenclature established by Truman et al., 2004. Shaded half circle refers to doomed hemilineage. Lineage 0 is the postembryonic name given to the MNB lineage. Asterisks mark lineages in which one hemilineage produces motor neurons and the other hemilineage generates glia (Enriquez et al., 2018; Lacin and Truman, 2016).
Figure 2 with 1 supplement
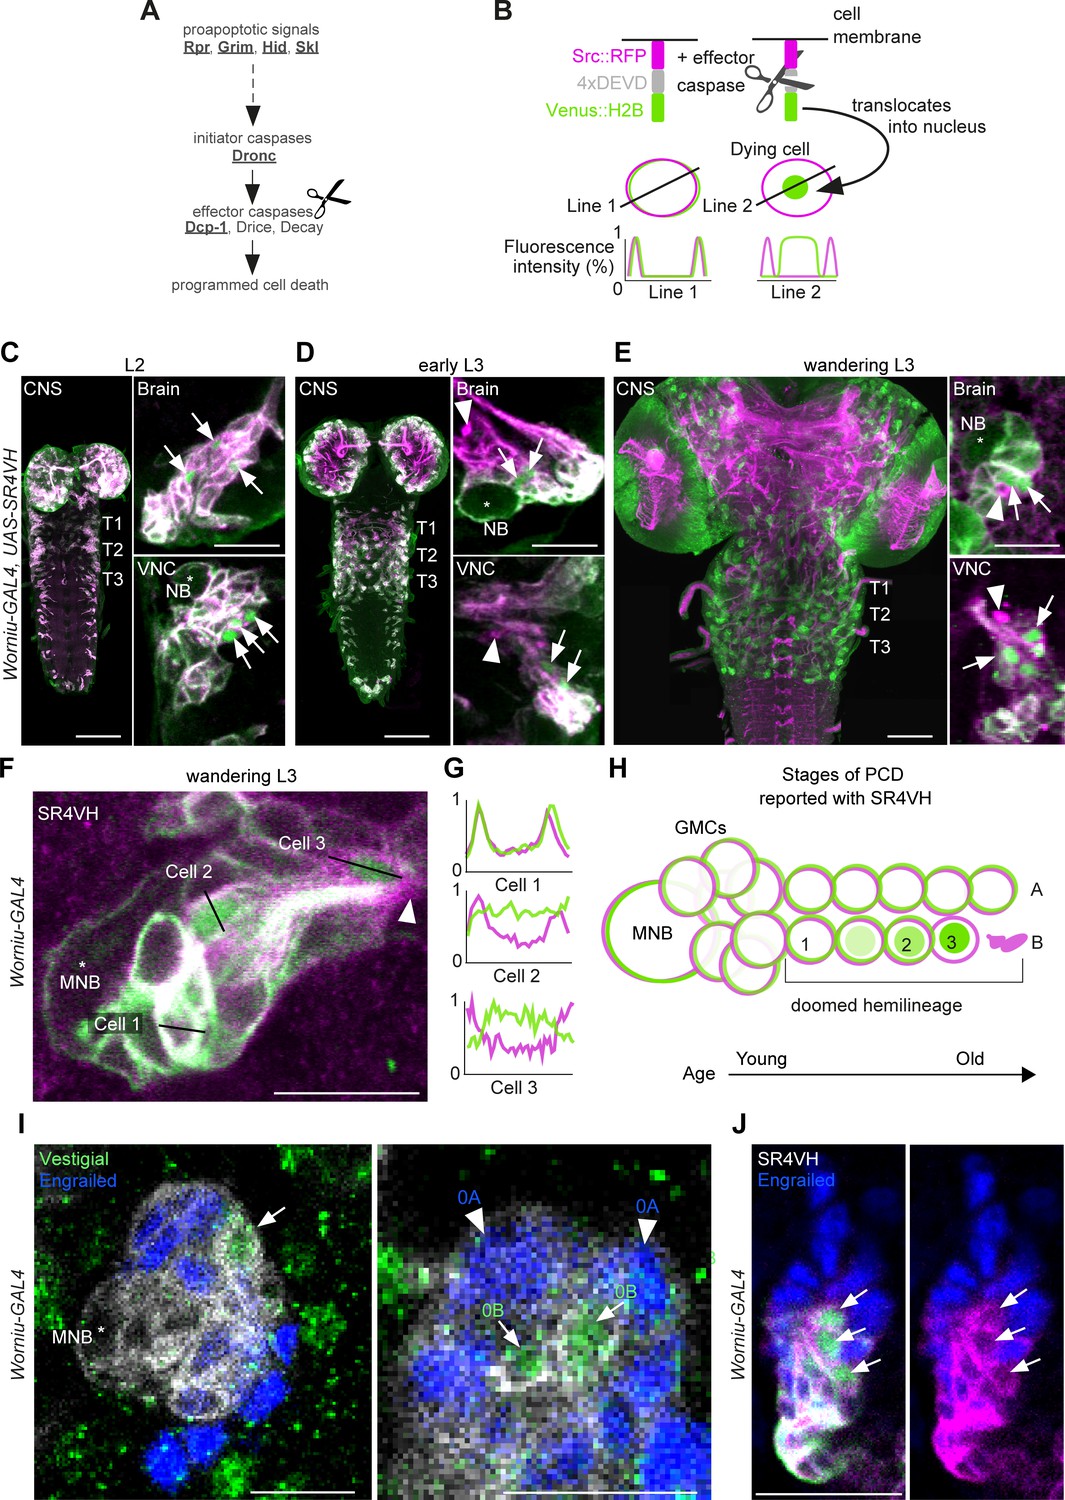
Early neuronal cell death occurs throughout postembryonic development.
(A) Simple schematic of programmed cell death (PCD) in Drosophila. Elements disrupted in this study, or used as a PCD readout are underlined. (B) Schematic of effector caspase reporter SR4VH (top) and idealised fluorescence patterns in two cells with distinct caspase activity (bottom): RFP (magenta) and Venus (green) present in the cell membrane (Line 1) versus RFP at the cell membrane and Venus accumulation in the nucleus of a cell undergoing PCD (Line 2). (C–E) SR4VH driven by Worniu-GAL4 reveals dying cells in the central nervous system (CNS) throughout postembryonic neurogenesis in a 2nd instar (C, n = 9), early 3rd instar (D, n = 8) and wandering 3rd instar (E, n = 18) larva. Right panels show examples of lineages with dying cells located close to the NB (*) in the brain (top) and ventral nerve cord (VNC, bottom). Arrows indicate dying cell, arrowheads indicate RFP-positive dead cell membranes. Scale bars, 50 µm (left panels), 10 µm (right panels). (F) SR4VH driven by Worniu-GAL4 reveals younger cells at earlier stages of cell death (Cell 2) are located closer to the MNB than older cells at later stages of cell death (Cell 3), which are closer to the lineage bundle (arrowhead). Image represents a single optical section. Scale bar, 10 µm. (G) Fluorescence intensity profiles (normalised to the maximum value along the line for each channel) plotted along the lines indicated in (F). (H) Schematic representing successive stages of cell death correlated with distance from NB and cell age in doomed lineages as reported with SR4VH. (I) Revealing markers for lineage 0. Immature hemilineage A progeny revealed with anti-Engrailed (blue – arrowheads) and immature hemilineage B progeny labelled with anti-Vestigial (green – arrows) in a third instar Worniu-GAL4; UAS- CD8::GFP larva (white). Expression of markers is mutually exclusive. Scale bars, 10 µm. (J) SR4VH driven by Worniu-GAL4 together with antibodies for Engrailed (blue) reveal that only Engrailed-negative cells from hemilineage 0B undergo PCD (white arrowheads) during postembryonic development in the thoracic VNC. Scale bar, 10 µm. n = 6.
Figure 2—figure supplement 1
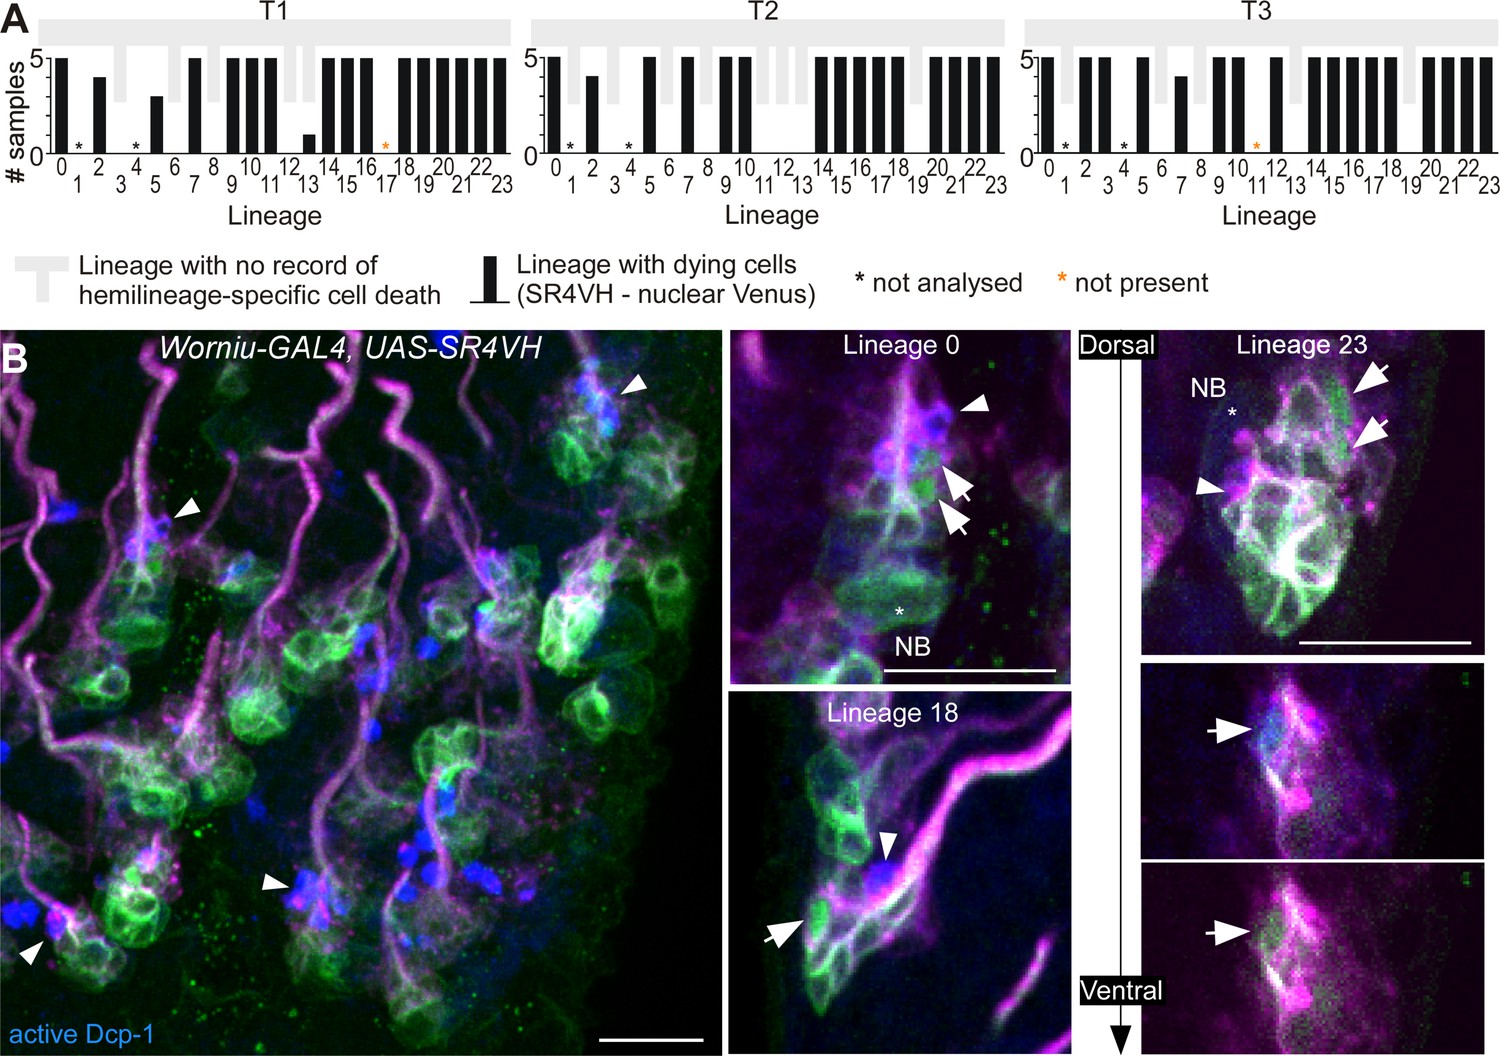
SR4VH reveals successive stages of cell death in lineages with doomed hemilineages.
(A) Quantification of lineages with dying cells as reported with SR4VH in each thoracic segment from 5 wandering 3rd instar larvae. Back bars represent the number of samples in which dying cells were encountered in at least one hemisegment for that lineage. Grey bars represent lineages with no record of hemilineage-specific cell death as reported in Truman et al., 2010. (B) Antibodies for active Dcp-1 label cells located close to the lineage bundle in doomed lineages from larvae expressing SR4VH driven by Worniu-GAL4. Right panels show examples of doomed lineages 0, 18 and 23 containing cells at subsequent stages of cell death. White arrows indicate: nuclear Venus without cleaved Dcp-1 (early stage), Venus and Dcp-1 colocalisation (mid-stage) and pyknotic cells/dead cell membranes with RFP and cleaved Dcp-1 (late-stage). Scale bars, 10 µm. n = 7.
Figure 3 with 3 supplements
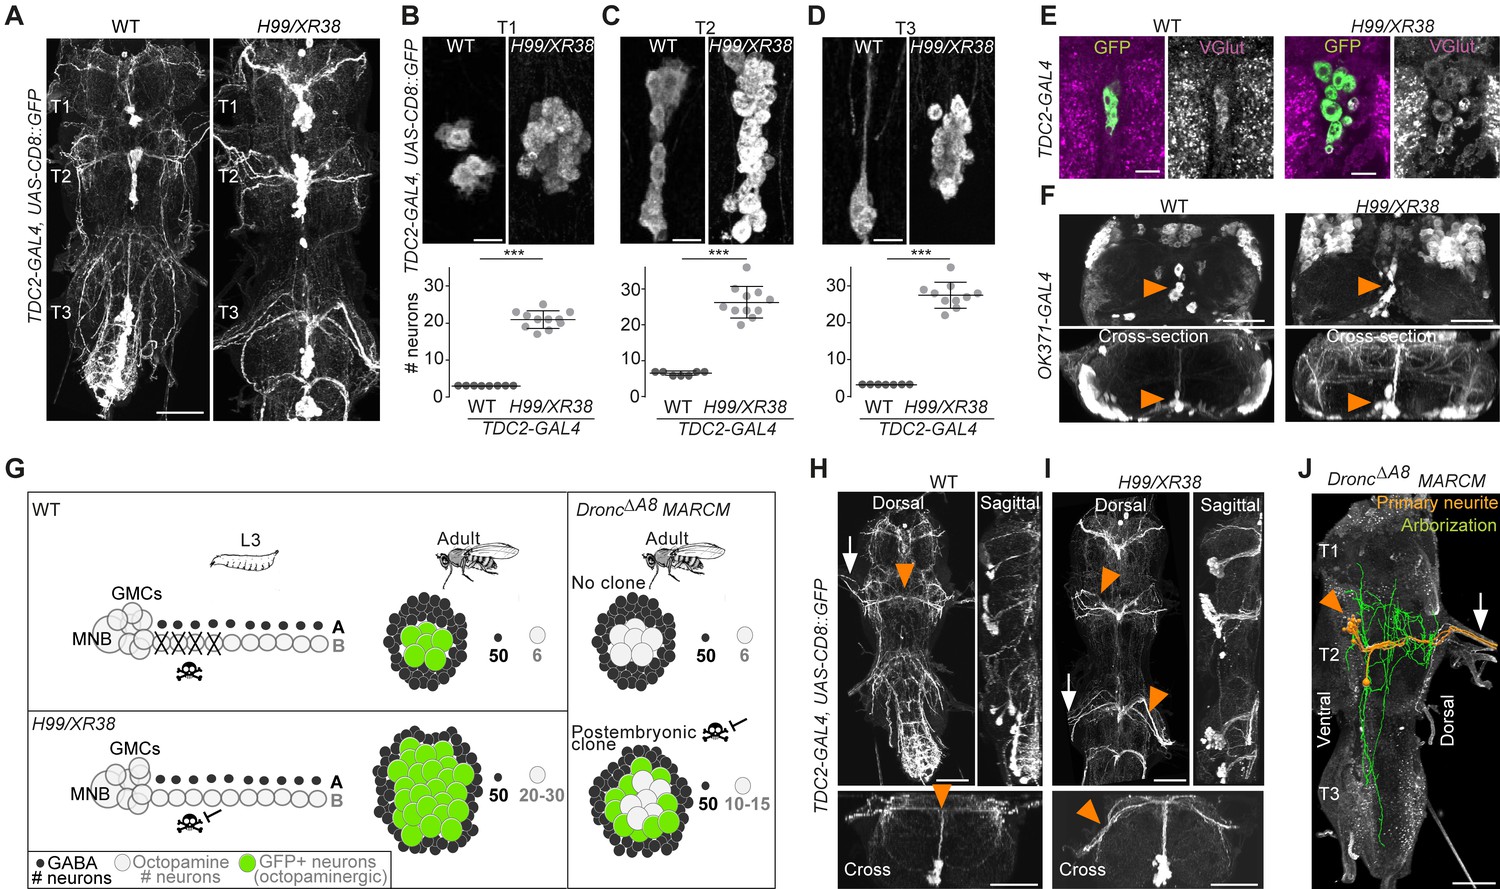
Blocking death results in differentiated undead neurons in the medial neuroblast (NB) lineage.
(A) CD8::GFP expression driven by TDC2-GAL4 in octopaminergic neurons from hemilineage 0B in the VNC of wild-type (WT, left) and PCD-blocked adult flies (H99/XR38 deficient for hid+/-, grim+/-, rpr-/- and skl+/-, right). Scale bar, 50 µm. (B–D) Quantifications of the number of TDC2-GAL4-positive octopaminergic neurons in the VNC of WT and H99/XR38 adult flies. Bars represent mean ± standard deviation. (B) ***p = 0.0002 in T1, (C) ***p = 0.0004 in T2, (D) ***p = 0.0004 in T3, Mann-Whitney. Scale bar, 10 µm. n = 11 each. Mann-Whitney. Scale bar, 10 µm. n = 11 each. (E) Antibodies for the vesicular glutamate transporter VGlut and (F) GFP expression driven by the glutamatergic driver line OK371-GAL4 label both WT and undead (H99/XR38) octopaminergic neurons. Orange arrowheads indicate cell bodies. Scale bars, 10 µm (VGlut), 50 µm (OK371). (G) Schematic of TDC2-GAL4 expression in postembryonic lineage 0 in wild-type and H99/XR38 third instar larvae and adults (left panels). Postembryonic hemilineage B populations only start expressing TDC2-GAL4 in early pupal development and maintain it throughout adult life. MARCM mosaic clones that are homozygous for a null Dronc allele lack GAL80. These show robust expression of GAL4 in small numbers of surviving postembryonic hemilineage B cells (right panel). In adult WT and H99/XR38 flies, GFP is expressed in both embryonically born and postembryonic TDC2-positive neurons, while in MARCM flies GFP is only present in postembryonic cells. (H–I) CD8::GFP expression driven by TDC2-GAL4 in WT (G) and H99/XR38 (H). WT and undead primary neurites project dorsally and branch extensively in the dorsal neuropil. In WT neurons the primary neurite bifurcates at the dorsal midline, while undead neurons are unable to bifurcate and turn to one side (orange arrowheads). In H99/XR38 flies which contain both WT and undead neurons, the primary neurite to one side is thicker (orange arrowhead). Both WT and undead neurons join thoracic nerves (white arrows). Scale bars, 50 µm. (J) Reconstructed arborisations of undead neurons expressing CD8::GFP driven by TDC2-GAL4 in flies bearing MARCM clones homozygous for the loss-of-function allele dronc∆A8 (in which PCD is blocked). The 3D-rendered image is tilted at a 45° angle. Undead neurons have somata that are located at the ventral midline (orange arrowhead), branch extensively in the neuropil (green), have a turning primary neurite (orange) and project to the periphery through a thoracic nerve (arrow). Scale bar, 50 µm.
Figure 3—figure supplement 1
Postembryonic development of lineage 0B in wild-type and H99/XR38 flies.
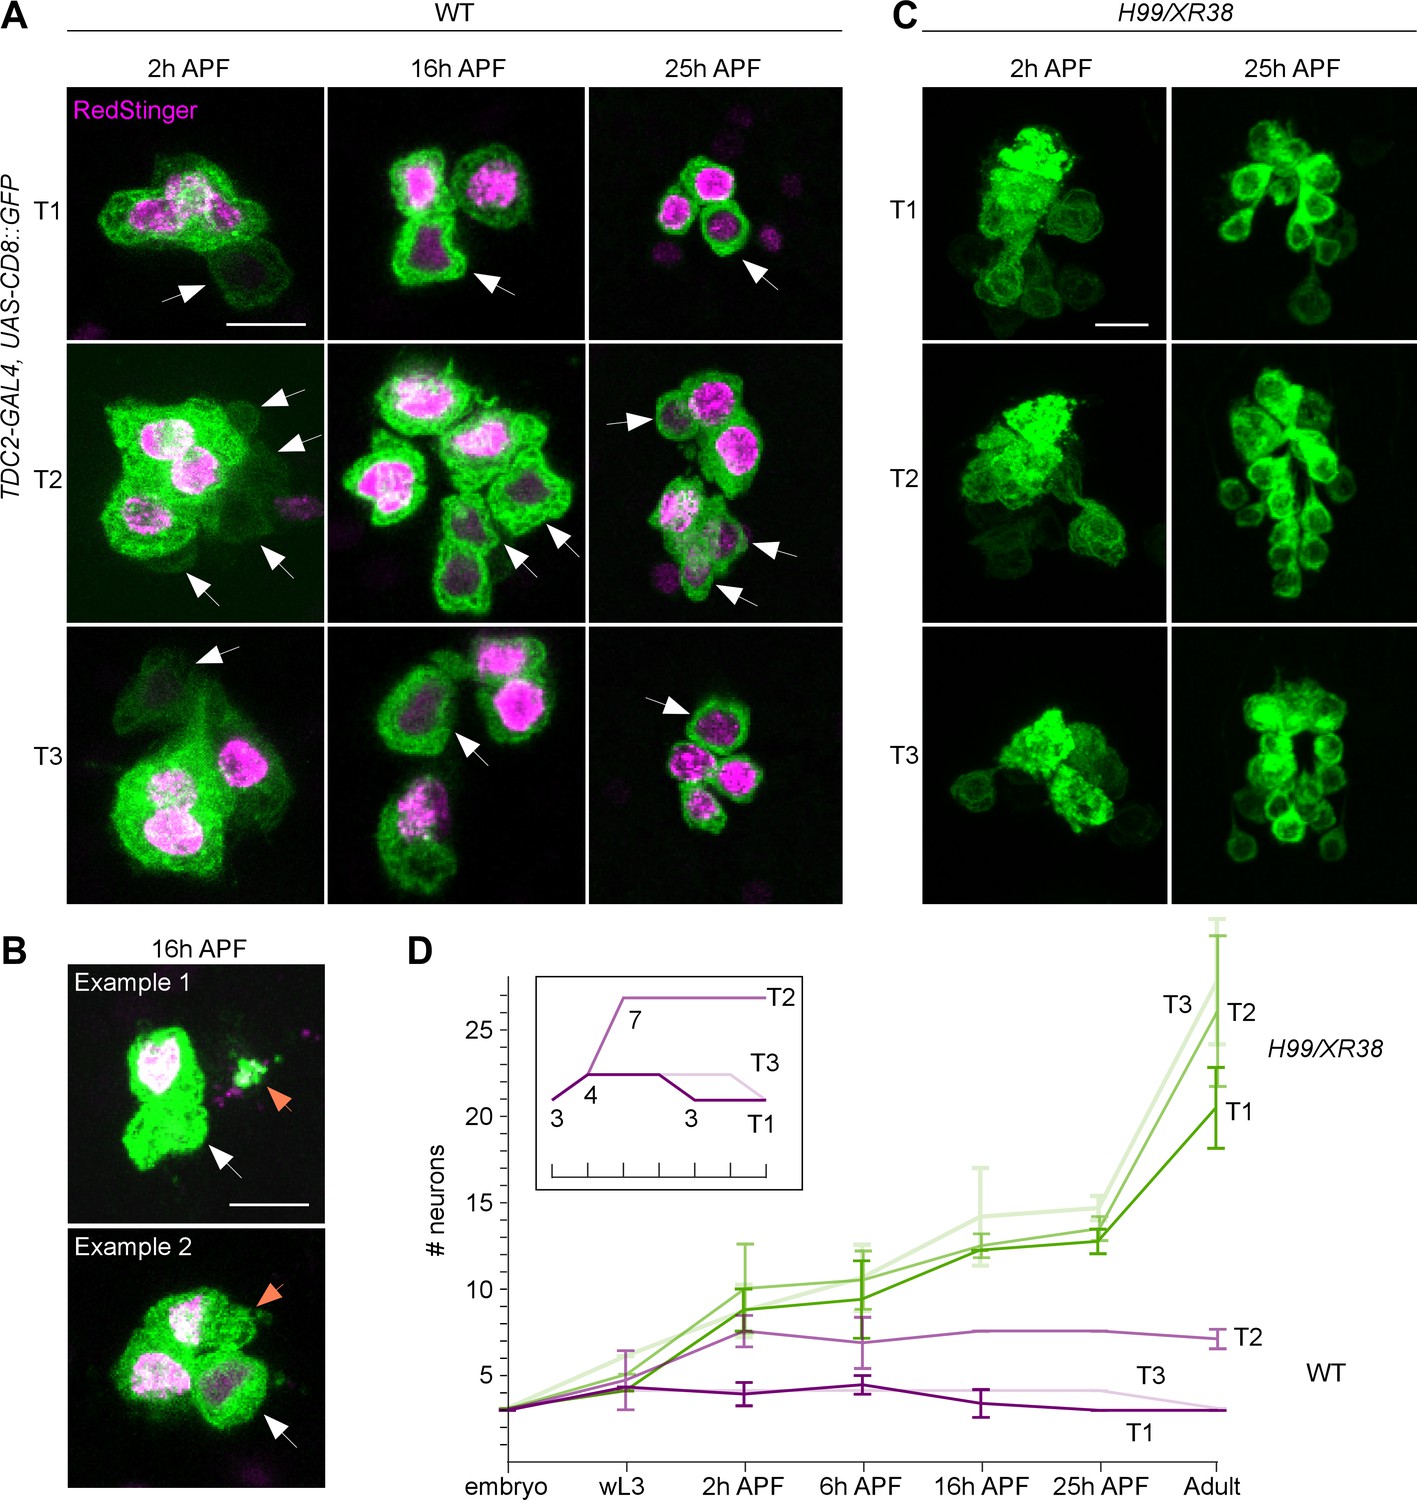
(A) CD8::GFP expression driven by TDC2-GAL4 in octopaminergic neurons from hemilineage 0B in the VNC of wild-type flies in T1 (1st row), T2 (2nd row) and T3 (3rd row) during pupal development at 2 hr after puparium formation (2 hr APF, 1st column), 16 hr APF (2nd column) and 25 hAPF (3rd column). One embryonically born cell is replaced during postembryonic neurogenesis in T1 and T2, while roughly four postembryonic octopaminergic neurons are added in T2. White arrows indicate newly born neurons with faint GFP and no RedStinger visible at 2hAPF (arrows). RedStinger fluorescence becomes visible at 16-25hAPF, as the protein matures (arrows). Scale bar, 10 µm. (B) Accumulations of GFP and RedStinger (orange arrow) in the proximity of the prothoracic cell cluster, alongside the presence of one cell with dim RedStinger fluorescence (white arrow) suggest one embryonic cell has died at 16hAPF. Scale bar, 10 µm. (C) CD8::GFP expression driven by TDC2-GAL4 in octopaminergic neurons from hemilineage 0B in the VNC of H99/XR38 flies in T1 (1st row), T2 (2nd row) and T3 (3rd row) during pupal development at 2 hr APF (1st column) and 25 hr APF (2nd column). Not all undead neurons present in the adult have matured by 25 hr APF. Scale bar, 10 µm. (D) Graphical representation of the number of TDC2-GAL4-expressing neurons throughout development in wild-type (magenta) and H99/XR38 mutant flies (green), where X represents time and Y represents the number of cells. Individual lines in the graph depict cell numbers in different thoracic segments. Error bars represent standard deviation. The inset represents a compressed idealised graphical representation for wild-type flies; marks on the X axis are the same; numbers at branch points represent cell numbers. In wild-type flies both T1 and T3 acquire an additional cell at 2 hr APF and lose one by the end of metamorphosis (magenta). Roughly half of undead neurons are present at 25 hAPF, with the other half maturing by the end of metamorphosis (green). Comment on Figure 3—figure supplement 1: The implication of additional postembryonic octopaminergic neurons born in the in the wild-type larva. It is well known that there are 3–4 extra octopaminergic neurons generated postembryonically in the wing bearing second (T2) thoracic neuromere in adult flies compared to the 3 cells found in each thoracic segment in larvae (Monastirioti et al., 1995). Until our inquiry into the timeline of postembryonic neurogenesis, it was thought that all octopaminergic neurons born in the embryo persist into adulthood, but to our surprise, that is not the case. We noticed that one postembryonic octopaminergic cell is born in wild-type flies in both the first (T1) and third (T3) thoracic segments, bringing the total number of cells to 4 (Figure 3—figure supplement 1A,D). Instead, the total number of 3 cells per cluster in T1 and T3 in adult flies is achieved via hormonally gated metamorphic cell death of an embryonically born mature neuron at larval-pupal stages (Figure 3—figure supplement 1A,B,D). We have shown here for the first time that wild-type octopaminergic neurons are produced in lineage 0 in all three thoracic neuromeres during postembryonic neurogenesis. This fits well with our observations that some Dronc-null singleton clones generated using MARCM showed bilateral symmetry. As the majority of these were in the mesothorax (see also Figure 3—figure supplement 3A,D), where it is more likely to label wild-type neurons purely by chance (with up to four postembryonic neurons produced here and only one each in T1 and T3), we think these may be indeed wild-type. Furthermore, we only ever encountered mixed MARCM clones containing one bilaterally symmetric and several turning neurites in the mesothorax (see also Figure 3—figure supplement 3A,D). For behavioural experiments we excluded all MARCM Dronc clones with bifurcating neurons to ensure that we only interpreted the activity of undead neurons.
Figure 3—figure supplement 2
Examples of postembryonic MARCM clones in which cell death is blocked.
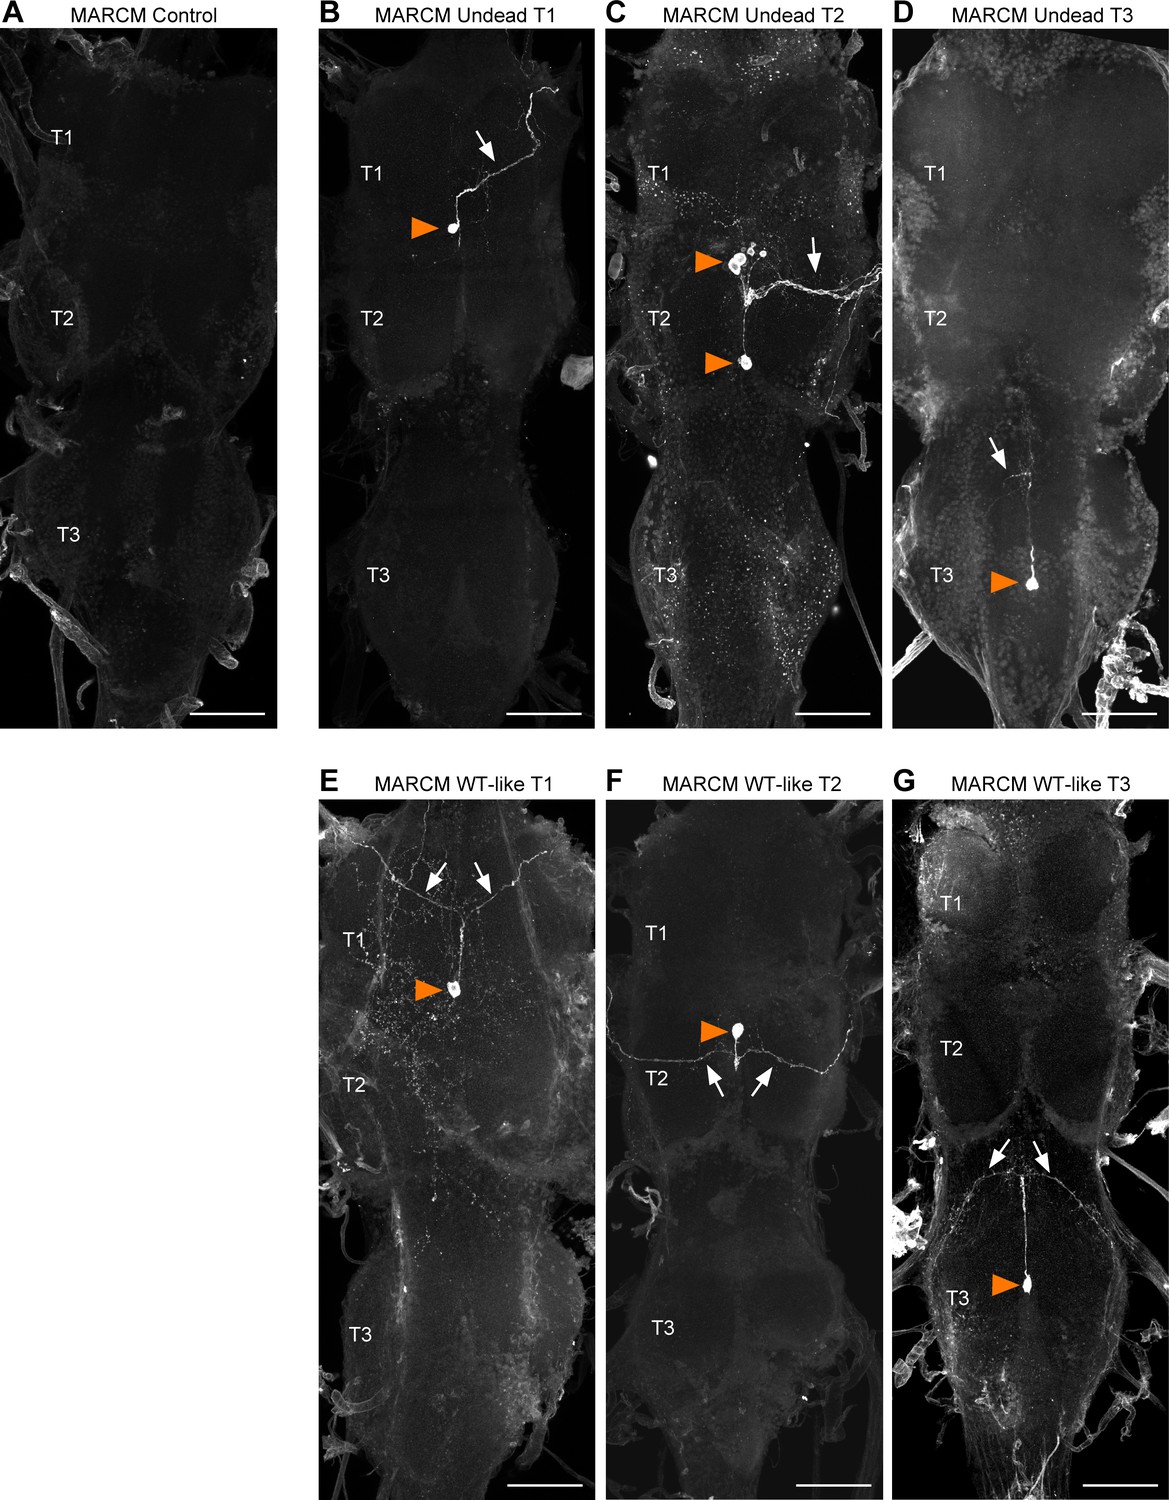
(A–G) Ventral nerve cords from flies bearing MARCM clones homozygous for the loss-of- function allele dronc∆A8 (in which PCD is blocked); full genotype: +/+; TDC2-GAL4, UAS-TrpA1, UAS-CD8::GFP / +; dronc∆A8/dronc∆A8. (A) MARCM control fly lacking postembryonic clones. (B–D) Undead MARCM clones in the prothorax (B), mesothorax (C) and metathorax (D) with somas located ventrally at the midline (orange arrowhead) and a turning primary neurite (arrow). (E–G) MARCM clones with a wild-type morphology in the prothorax (E), mesothorax (F) and metathorax (G) with somas located ventrally at the midline (orange arrowhead) and a bifurcating primary neurite (arrows). Flies containing undead MARCM clones with a wild-type morphology were excluded from behavioural analysis. Scale bars, 50 µm.
Figure 3—figure supplement 3
Quantification of undead neuron morphology.
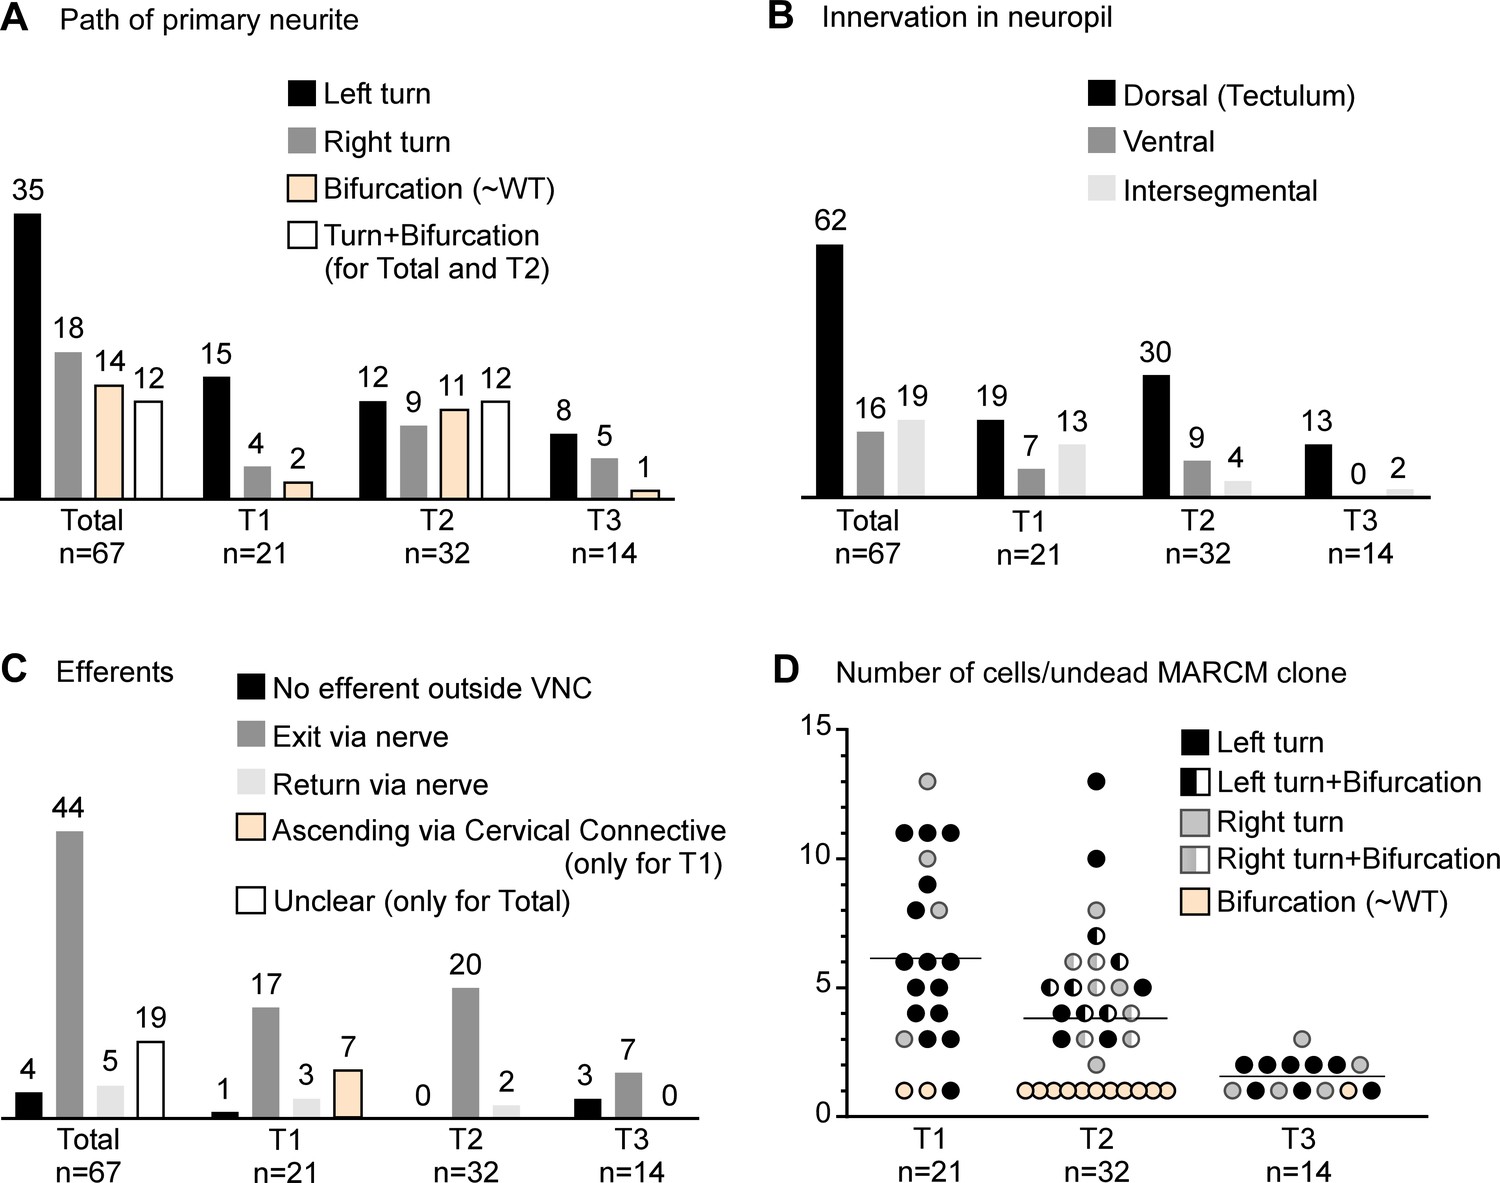
(A) Quantification of the primary neurite path. Most undead neurons arborise to the left. (B) Quantification of neuropil innervation. Most undead neurons branched extensively in the dorsal neuropil. Undead neurons in T3 never innervated the ventral neuropil. Few undead neurons from each thoracic segment projected neurites into adjacent segments. (C) Quantification of efferent neurites. Most undead neurons joined a thoracic nerve heading towards the periphery. Some undead neurons in T1 sent branches through the cervical connective. (D) Quantification of the number of undead neurons in MARCM clones for each thoracic segment colour-coded by primary neurite path. The number of undead neurons varied across MARCM clones, with up to 13 in T1 and T2 and up to three in T3. Most single-celled MARCM clones contained undead neurons with a wild-type morphology (beige circles) and most undead neurons with a wild-type morphology were encountered in T2. Mixed clones (half-filled circles) made up of one bifurcating neuron and several neurons turning either left or right were encountered only in T2.
Figure 4
Undead neurons are functional: thermogenetic activation of undead neurons induces walking in decapitated Drosophila.
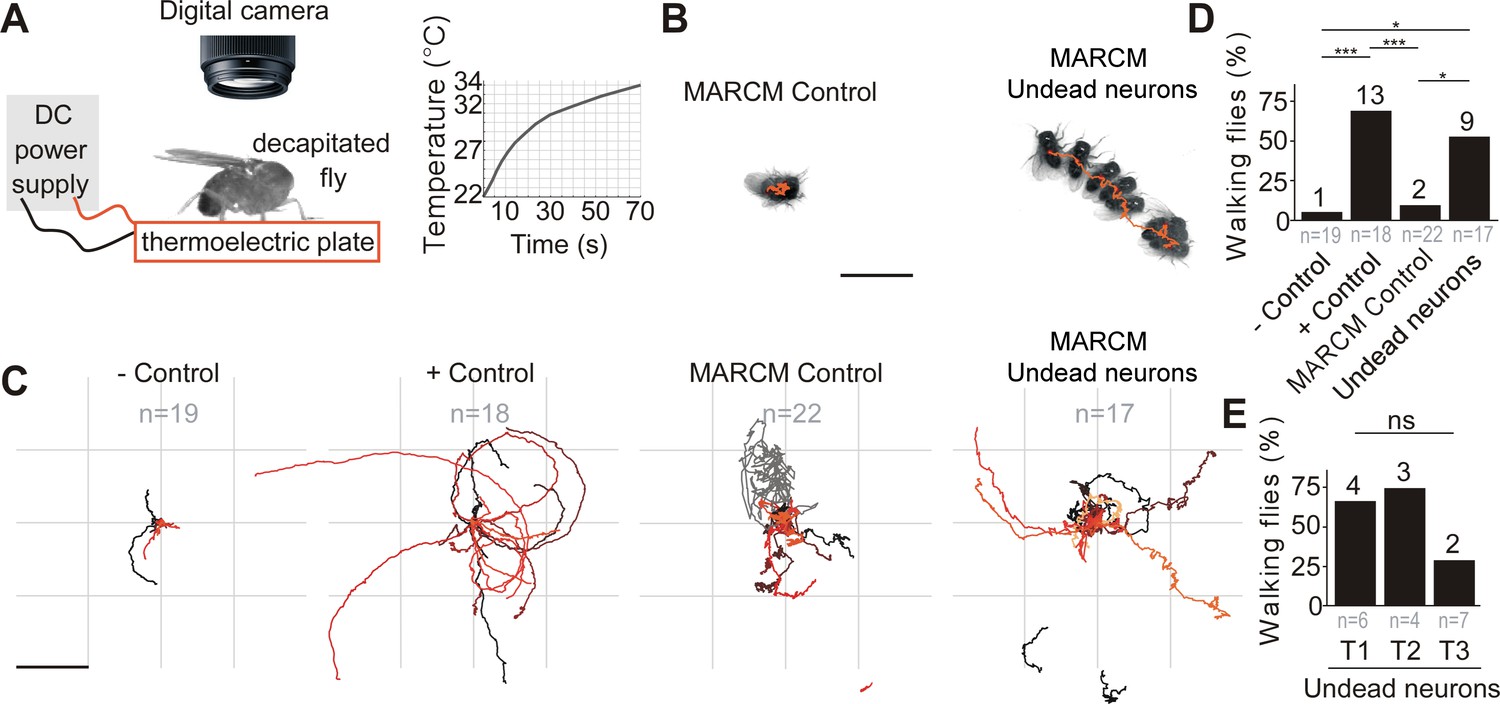
. (A) Schematic of behavioural assay with TrpA1 activation. Decapitated flies are placed on a thermoelectric plate connected to a DC power supply, exposed to a temperature ramp (right panel) and filmed from above using a digital camera. (B) Examples of a stationary MARCM Control fly and a walking fly with undead neurons. Images represent maximum intensity projections of 13 frames at 0.3 fps tracing the centroid over time (orange line). Scale bar, 5 mm. (C) Fly body tracks generated by identifying the geometric centre of the fly body in each frame and storing the centre coordinates, plotted as a continuous line, one for each fly (walking or stationary) for negative controls (UAS-TrpA1), positive controls (TDC2 >TrpA1), MARCM control flies and flies with MARCM clones of undead neurons. Each trace represents one individual fly. Scale bar, 5 mm. (D) Quantification of the percentage of flies that walked per experimental group. ***p = 0.0002 for negative versus positive control, ***p = 0.0002 for positive controls versus MARCM Control, *p = 0.0242 for MARCM control versus undead neurons, *p = 0.0135 for negative control versus undead neurons, Pearson’s chi-squared corrected for multiple comparisons using a Bonferroni correction. n = 19 for negative controls, n = 18 for positive controls, n = 22 for MARCM control, n = 17 for undead neurons. n numbers for each group are given below and the number of flies which walked is shown above each bar. (E) Quantification of the number of walking undead neuron flies split into three anatomical subgroups according to the location of MARCM clones in T1, T2, or T3. Pns = 0.2628, Pearson’s chi-squared. n = 6 for T1, n = 4 for T2, n = 7 for T3. Numbers at the base are the number of walking flies. The percentage is shown above each bar.
Figure 5 with 2 supplements
Undead neurons integrate into VNC networks: undead neurons are active during naturalistic behaviours in intact adult Drosophila.
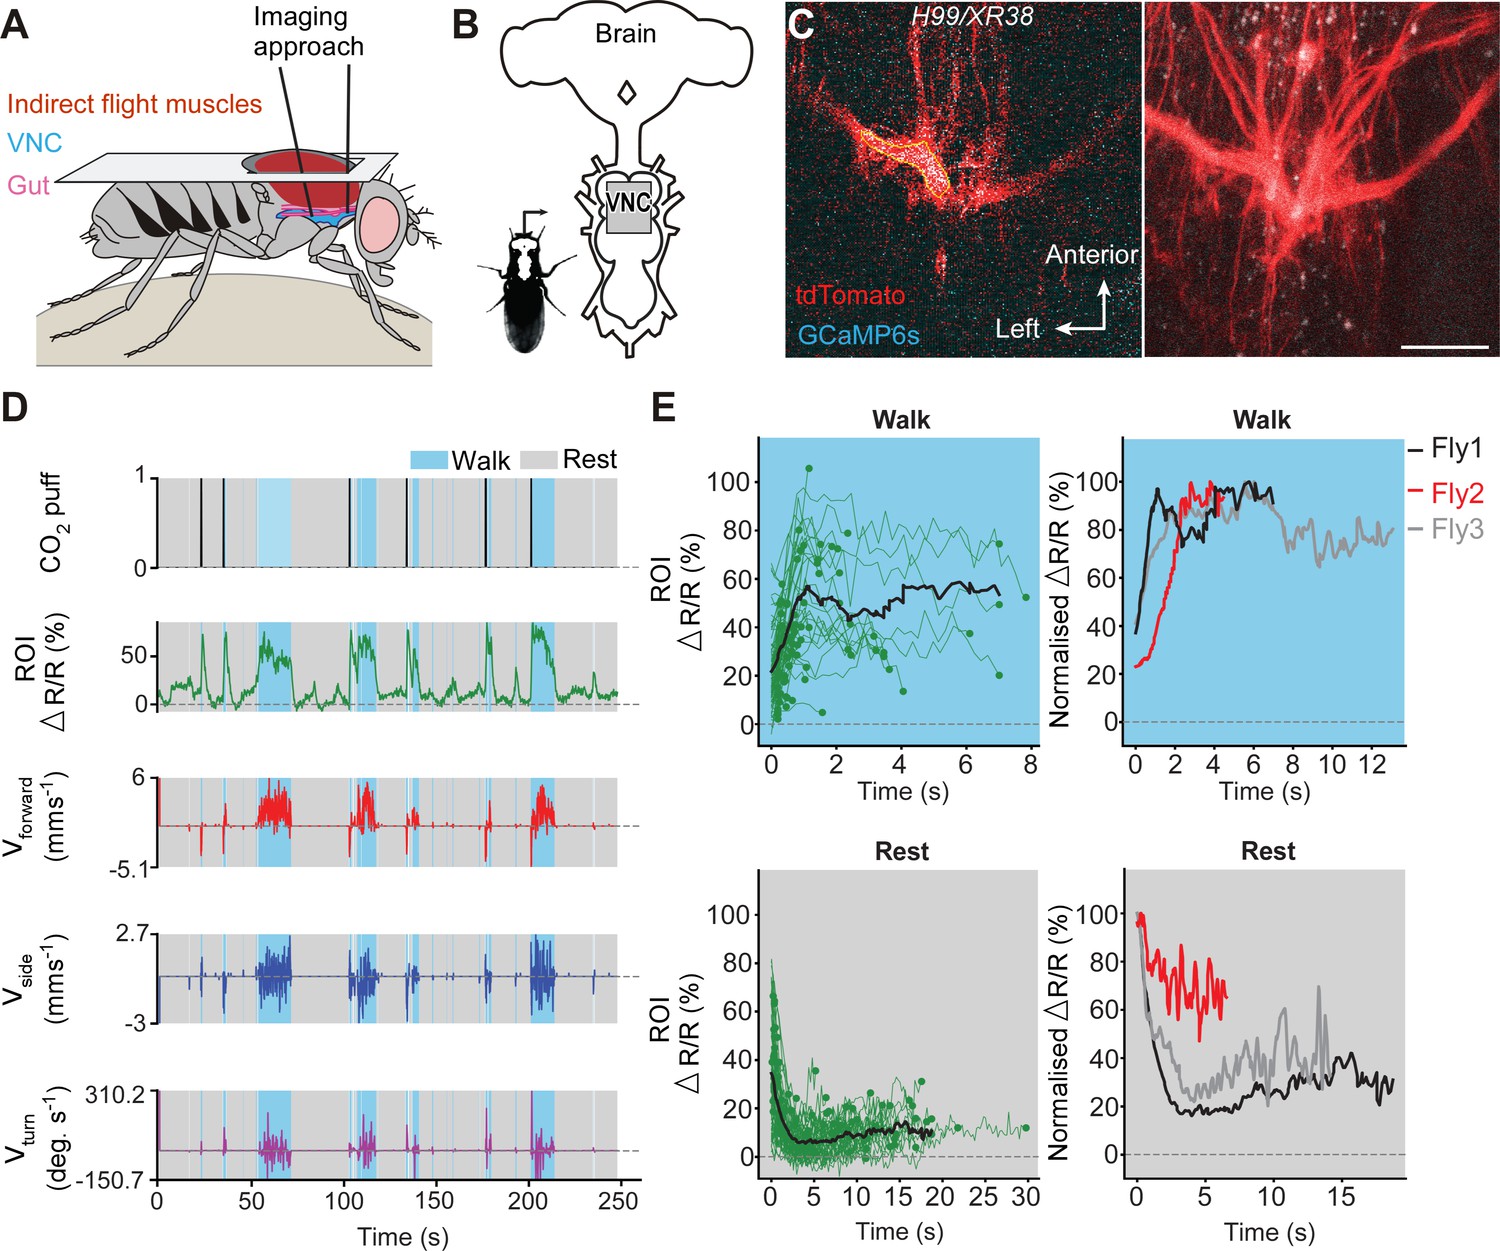
(A) Schematic of the dorsal thoracic dissection and approach for ventral nerve cord functional imaging in tethered, adult flies. (B) Location of the imaging region-of-interest (grey box) with respect to a schematic of the adult CNS. (C) Raw 2-photon image of TDC2-GAL4-positive neurons co-expressing tdTomato (red) and GCaMP6s (cyan) in H99/XR38 flies (left). Region-of-interest used to calculate %∆R/R is outlined (yellow). Standard deviation z-projection of a dorsal-ventral image stack of the functional imaging region-of-interest in (b) (right). Scale bar, 50 µm. (D) Representative behavioural and functional imaging data in H99/XR38 flies. Shown are: CO2 stimulation (black), %∆R/R (ratio of GCaMP6s/tdTomato) signal (green) and ball rotations indicating forward walking (red), sideways walking (blue), and turning (purple). The behaviour of the fly was classified as either walking (light blue), or resting (grey) by applying a threshold on ball rotation speed. (E) (left) Individual (green) and average (black) %∆R/R traces within each behavioural epoch for walking (n = 82) and resting (n = 86) events processed from 750 s of imaging data. Solid green circles indicate the end of a behavioural epoch. The average trace (black line) was calculated for only periods with four or more traces. (right) Normalised average %∆R/R traces for three different flies during walking and resting. The average (black) trace is the same as in the left panel.
Figure 5—figure supplement 1
Wild-type octopaminergic neurons are active during walking in intact adult Drosophila.
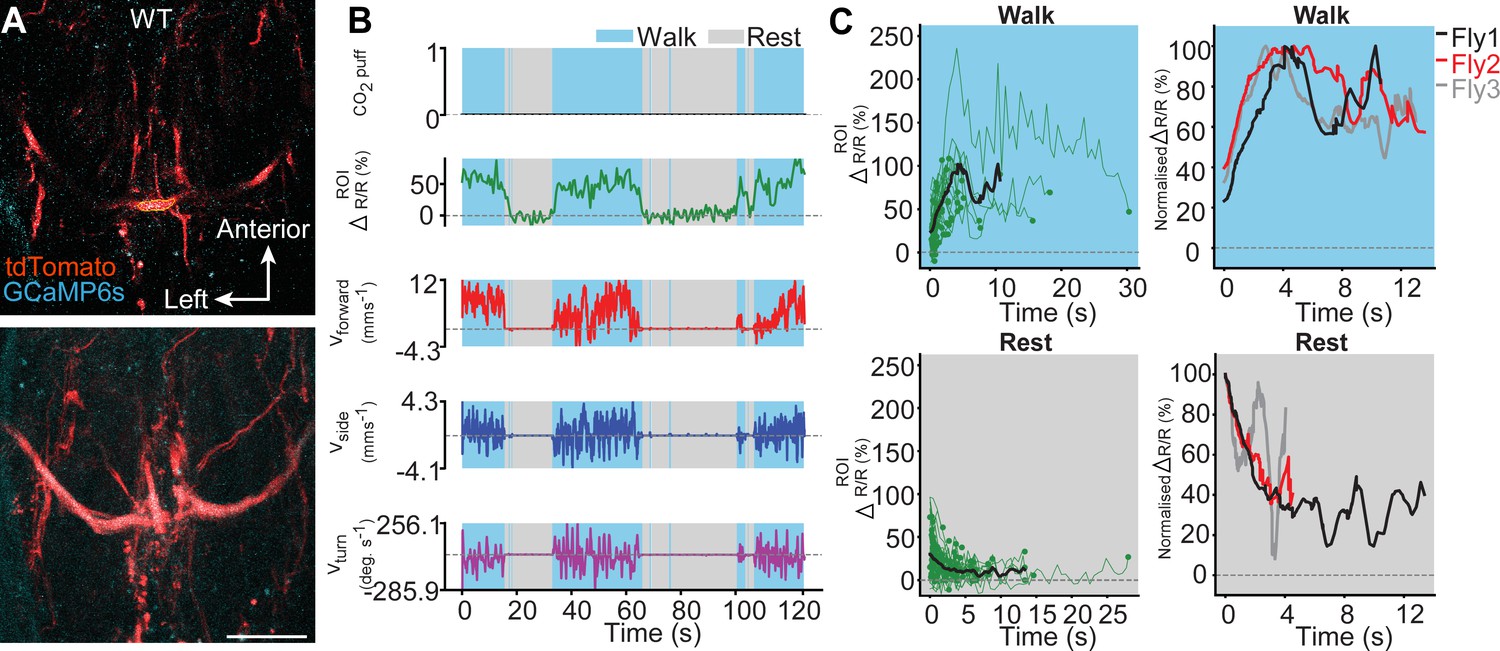
(A) Raw 2-photon image of TDC2-GAL4-positive neurons co-expressing tdTomato (red) and GCaMP6s (cyan) in wild-type flies (top). Region-of-interest used to calculate %∆R/R is outlined (yellow). Standard deviation z-projection of a dorsal-ventral image stack of the functional imaging region-of-interest in (b) (bottom). Scale bar, 50 µm. (B) Representative behavioural and functional imaging data in wild-type flies. Shown are: CO2 stimulation (black, no stimulation), %∆R/R (ratio of GCaMP6s/tdTomato) signal (green), and ball rotations indicating forward walking (red), sideways walking (blue) and turning (purple). The behaviour of the fly was classified as either walking (light blue), or resting (grey) by applying a threshold on ball rotation speed. (C) (left) Individual (green) and average (black) %∆R/R traces within each behavioural epoch for walking (n = 77) and resting (n = 80) events processed from 720 s of imaging data. Solid green circles indicate the end of a behavioural epoch. The average trace (black line) was calculated for only periods with four or more traces. (right) Normalised average %∆R/R traces for three different flies during walking and resting. The average (black) trace is the same as in the left panel.
Figure 5—figure supplement 2
Subregion analysis of calcium signals along the width of a primary neurite in a H99/XR38 animal.
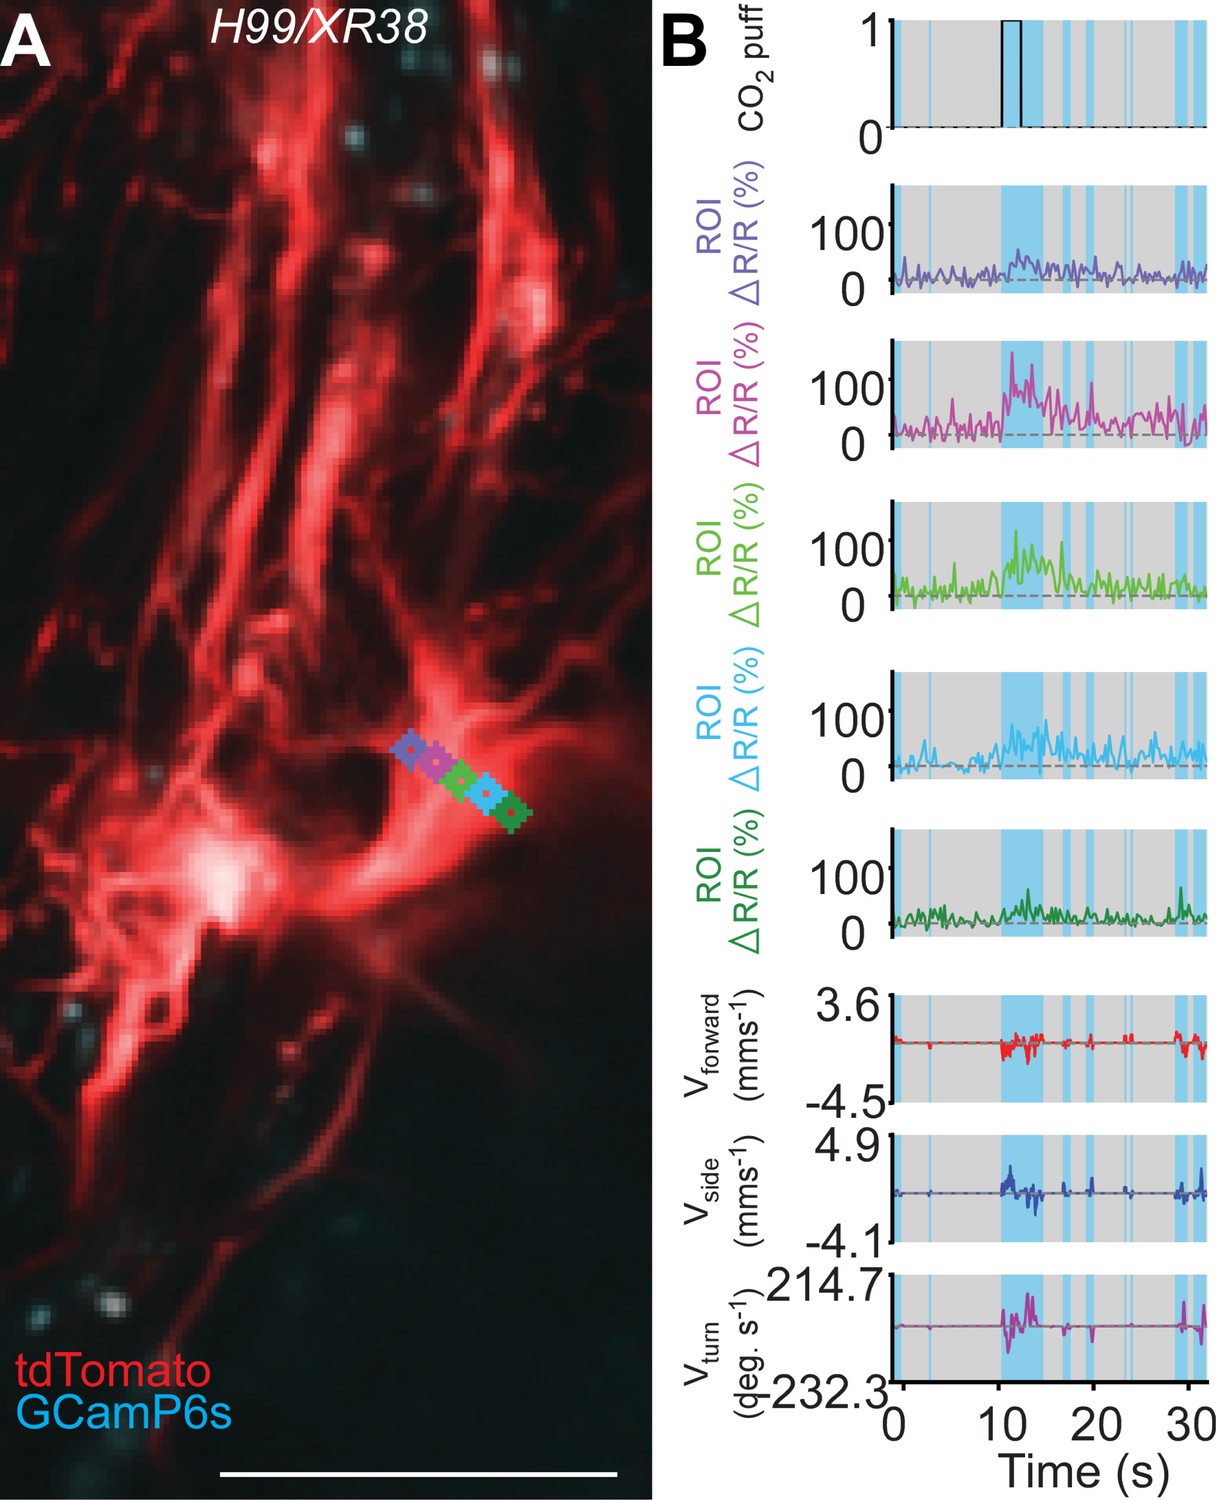
(A) Time-averaged projection of the imaging plane for TDC2-GAL4-positive neurons co-expressing tdTomato (red) and GCaMP6s (cyan) in a H99/XR38 animal. Regions-of-interest used to calculate %∆R/R (colour-coded) are overlaid on top of time-projected and optic flow registered 2-photon images. Scale bar, 50 µm. (B) Representative behavioural and functional imaging data for this animal. Shown are: CO2 stimulation (black), %∆R/R (ratio of GCaMP6s/tdTomato) signal (colour-coded for each ROI as in panel a) and ball rotations indicating forward walking (red), sideways walking (blue) and turning (purple). The behaviour of the fly was classified as either walking (light blue), or resting (grey) by applying a threshold on ball rotation speed.
Figure 6
Median neuron numbers vary between insect species.
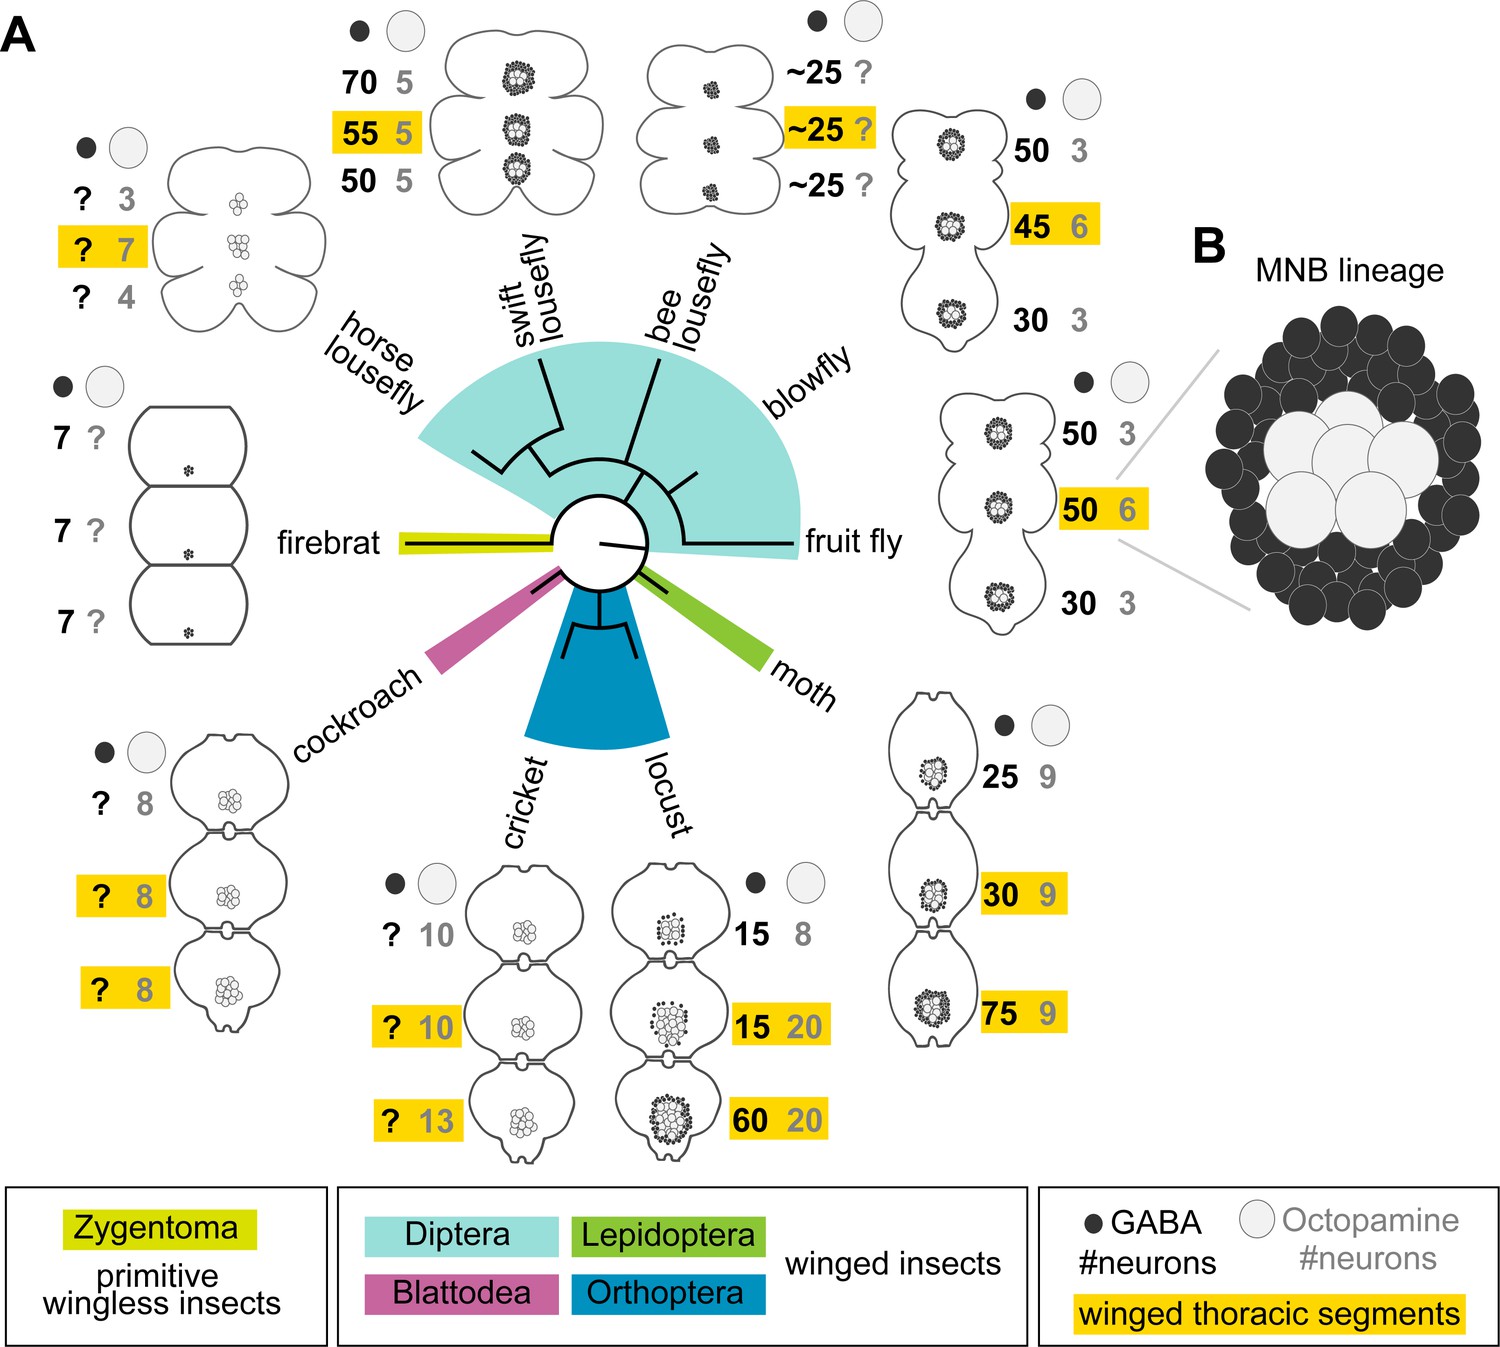
(A) Schematic showing summary of thoracic midline neuron population data from 5 orders of insects (colour-coded in the phylogenetic tree and in the figure key bellow) including the primitive wingless firebrat Thermobia domestica, the cockroach Periplaneta americana, the cricket Gryllus bimaculatus, the locust Schistocerca gregaria, the moth Manduca sexta, the fruit fly Drosophila melanogaster, the blowfly Calliphora vicina, the horse lousefly Hippobosca equina and the flightless bee lousefly Braula coeca and swift lousefly Crataerina pallida. The numbers of GABAergic neurons (black cells) and octopaminergic neurons (grey cells) produced by the MNB is given for each thoracic segment. Except for the moth, a higher number of octopaminergic neurons can be found in winged segments in flying insects (yellow boxes). Cell numbers in this homologous lineage vary both between segments and species. Data on firebrats, cockroaches, crickets, locusts, moths, fruit flies and blowflies are compiled from Monastirioti et al., 1995; Stevenson and Spörhase-Eichmann, 1995; Witten and Truman, 1998; Schlurmann and Hausen, 2003; Lacin et al., 2019; and unpublished data from Dacks, Pflüger and Hildebrand (AM Dacks, personal communication, May 2020), while data on horse, swift and bee louseflies are from our own work. (B) Cartoon of Drosophila mesothoracic midline lineage populations with ‘hemilineage A’ cells revealed by GABA immunoreactivity (black) and ‘hemilineage B’ revealed by octopamine immunoreactivity (grey).
Figure 7
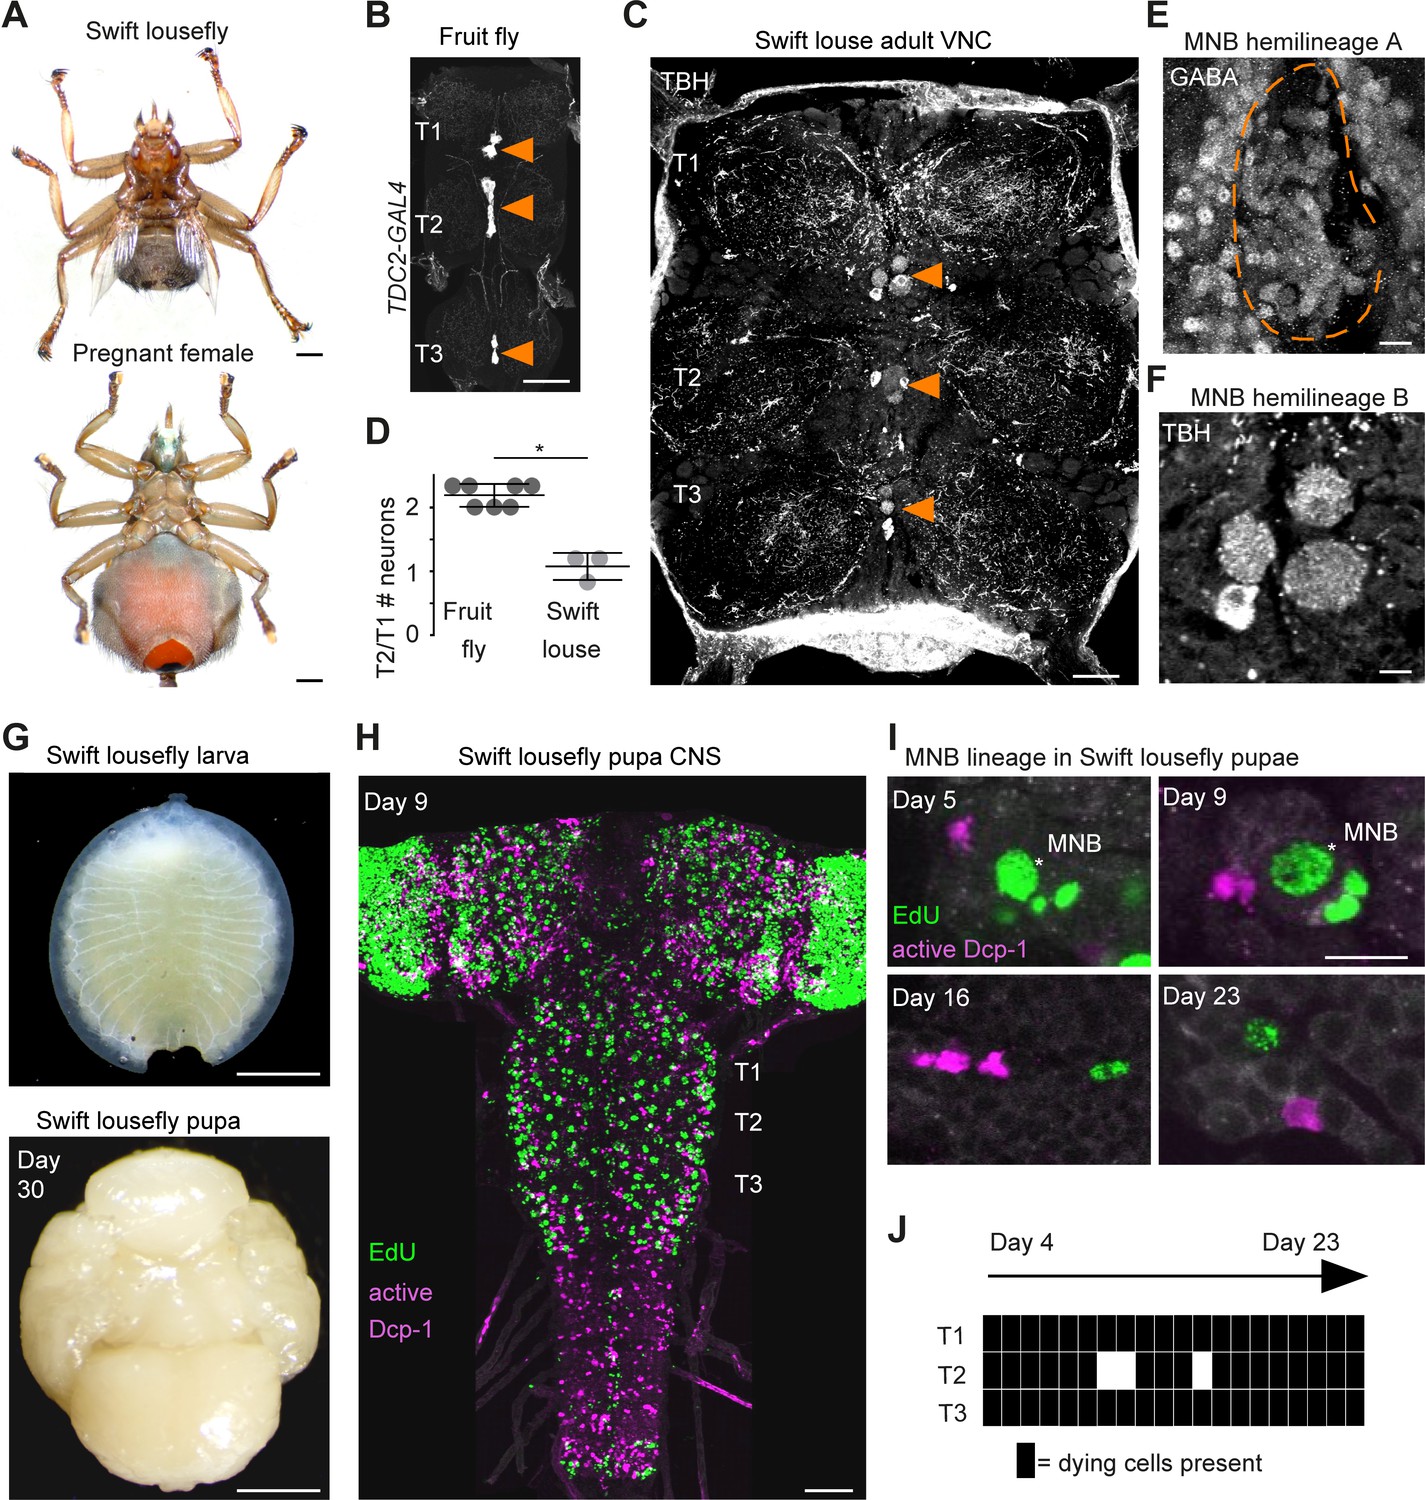
Hemilineage-specific cell death may be responsible for reduced octopaminergic neurons in the swift lousefly.
(A) Dorsal view of an adult swift lousefly with vestigial wings (top). Ventral view of a female pregnant with a prepupa (bottom). Scale bars, 1 mm. (B) Wild-type octopaminergic neurons in hemilineage 0B in a Drosophila melanogaster VNC labelled with CD8::GFP driven by TDC2-GAL4 (orange arrowheads). Scale bar, 50 µm. (C) Octopaminergic neurons in hemilineage 0B in a swift lousefly VNC labelled with antibodies for tyramine β-hydroxylase (TBH, orange arrowheads). Fluorescence in the neuropil is derived from secondary antibodies trapped in the tracheal system and does not mark the true presence of TBH protein. Scale bar, 50 µm. (D) Quantification of T2/T1 number of octopaminergic neurons in fruit flies and swift louseflies shows that swift louseflies have lost the T2-specific higher numbers typical of flying dipterans (*p = 0.012, Mann-Whitney. n = 7 fruit flies, n = 3 swift louseflies). Bars represent mean ± standard deviation. (E) Cluster of cell bodies belonging to hemilineage 0A (dashed outline) labelled with antibodies for GABA and (F) cell bodies belonging to hemilineage 0B labelled with TBH antibodies in the prothorax (T1) of a swift lousefly. (G) Swift lousefly larva (top) and Day 30 swift lousefly pupa removed from its puparial case (bottom). Scale bars, 1 mm (H) EdU labels proliferating cells and antibody-labelling for active Dcp-1 reveals dying cells in the CNS of a swift lousefly pupa 9 days after pupariation. Scale bar, 50 µm. (I) Dying cells in lineage 0 labelled with antibodies for active Dcp-1 are located close to proliferating cells (e.g., NB*) throughout neurogenesis at Day 5 (top left), Day 9 (top right), Day 16 (bottom left) and Day 23 (bottom right) after pupariation. Scale bar, 10 µm. n = 1 each. (J) The occurrence of active Dcp-1-positive cells in lineage 0 in T1, T2 and T3 from Day 4 to Day 23 after pupariation in swift lousefly pupae (n = 1 each). Each black box indicates one occurrence.
-
Figure 7—source data 1
Quantification of T2/T1 number of octopaminergic neurons in fruit flies and swift louseflies.
- https://cdn.elifesciences.org/articles/59566/elife-59566-fig7-data1-v3.xlsx
Figure 8
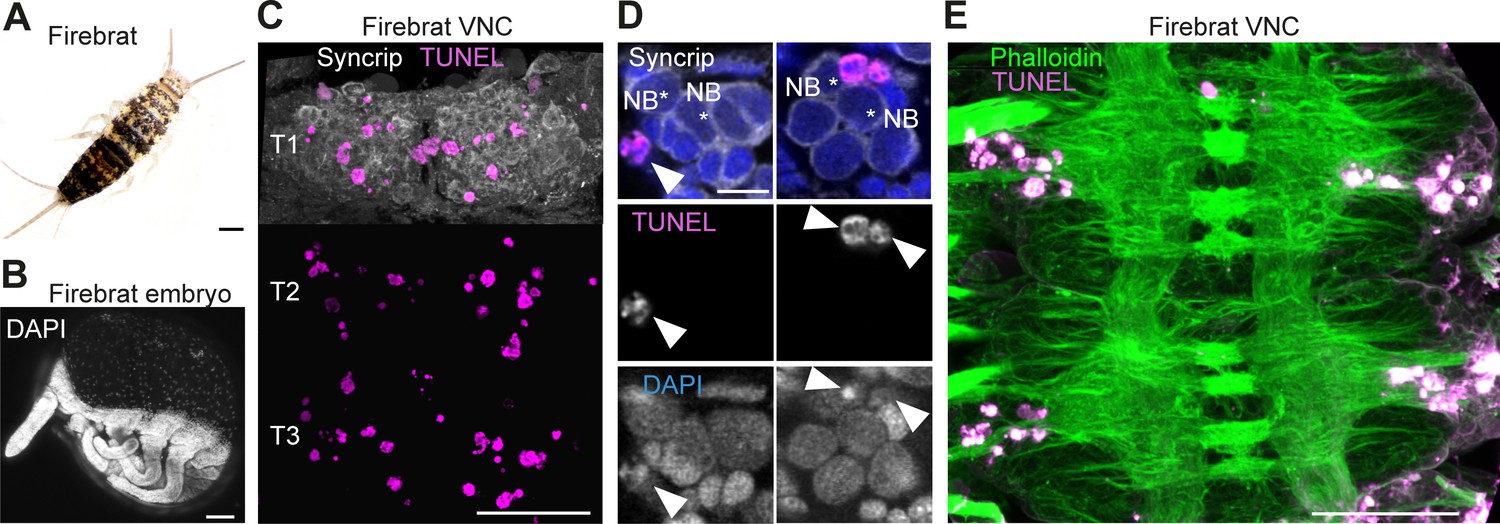
Cell death during neurogenesis in the ‘primitive’ wingless firebrat.
(A) Adult firebrat. Scale bar, 1 mm. (B) Maximum intensity projection of DAPI staining in a wholemount firebrat embryo (Thermobia domestica) at 50–55% of embryonic development. Scale bar, 100 µm. (C) Dying cells in the thoracic VNC of a firebrat embryo labelled using TUNEL (magenta) and Syncrip (white) antibodies. Syncrip was used here as a proxy for Neuroglian staining to reveal lineages. Scale bar, 50 µm. (D) Dying cells (arrowheads) are located close to NBs (*). Scale bar, 10 µm. (E) Dying cells (magenta, TUNEL) are located in the cortex of the VNC, where neurogenesis takes place, and not in the neuropil (green, Phalloidin) in a firebrat embryo. Scale bar, 50 µm.
Figure 9

Neuronal cell death sculpts the wing circuitry of wingless dipterans.
(A) Dorsal (top) and side view (bottom) of an adult bee lousefly with a reduced thorax lacking wings and halteres. Scale bar, 1 mm. (B–D) Hemilineage VNC fibre tracts labelled with Neuroglian in a fruit fly (B), a swift lousefly (C) and a bee lousefly (D). Shown are hemilineages 6A and 7B which are reduced in the bee lousefly in all three thoracic segments (T1, T2, T3). Scale bars, 50 µm. (E–G) 3A and 3B hemilineage fibre tracts labelled with Neuroglian in a fruit fly (top left) and a bee lousefly (top right). Shown are maximum intensity projections, chosen to best display hemilineages, from cross-section T1 (E), T2 (F) and frontal perspectives T3 (G). Quantifications of 3A/3B hemilineage bundle diameter ratios in fruit flies and bee louseflies are given below (****p < 0.0001 in T1, independent samples t-test, ***p = 0.0001 for T2, Welch’s t-test, *p = 0.0044, Welch’s t-test. n = 7 fruit flies each, n = 8 bee louseflies each). Bars represent mean ± standard deviation.
-
Figure 9—source data 1
Quantifications of 3A/3B hemilineage bundle diameter ratios in fruit flies and bee louseflies.
- https://cdn.elifesciences.org/articles/59566/elife-59566-fig9-data1-v3.xlsx
Videos
Video 1
Video recordings of control and ‘undead’ decapitated flies during thermogenetic activation.
Examples from each behavioural category showing responses to heat-activation in negative control (top left), positive control (top right), MARCM control (bottom left) and undead neurons (bottom right). MARCM control and undead neuron animals were used for extracting the centroid trace provided in Figure 4B,C. The increase in temperature is displayed in the bottom right corner. Frames represent recordings from 30 to 70 s.
Video 2
Recording of 2-photon calcium imaging in undead neurons.
Synchronised front and side camera behaviour videography (bottom right), and 2-photon imaging data (top right) used for the data analysis provided in Figure 5C,D,E.
Video 3
Z-stack of the imaging area for GCaMP6s activity in undead neurons.
A videography showing the imaging plane at different depths of the prothoracic segment corresponding to Figure 5C. The thicker left branch likely includes mostly undead neurons.
Video 4
Subregion neuronal activity patterns during walking.
Imaging data used for analysis in Figure 5—figure supplement 2. Shown are %∆R/R traces for R.
Tables
Key resources table
| Reagent type (species) or resource | Designation | Source or reference | Identifiers | Additional information |
|---|---|---|---|---|
| Gene (Drosophila melanogaster) | worniu | FlyBase | FLYB:FBgn0001983 | |
| Gene (Drosophila melanogaster) | TDC2 | FlyBase | FLYB:FBgn0050446 | |
| Gene (Drosophila melanogaster) | VGlut | FlyBase | FLYB:FBgn0031424 | |
| Gene (Drosophila melanogaster) | hid | FlyBase | FLYB:FBgn0003997 | |
| Gene (Drosophila melanogaster) | grim | FlyBase | FLYB:FBgn0015946 | |
| Gene (Drosophila melanogaster) | rpr | FlyBase | FLYB:FBgn0011706 | |
| Gene (Drosophila melanogaster) | skl | FlyBase | FLYB:FBgn0036786 | |
| Gene (Drosophila melanogaster) | Dronc | FlyBase | FLYB:FBgn0026404 | |
| Genetic reagent (Drosophila melanogaster) | Worniu-GAL4 | Bloomington Drosophila Stock Center | BDSC:56553; FLYB:FBtp0021524; RRID:BDSC_56553 | FlyBase symbol: P{wor.GAL4.A} |
| Genetic reagent (Drosophila melanogaster) | Tdc2-GAL4 | Bloomington Drosophila Stock Center | BDSC:9313; FLYB:FBtp0127561; RRID:BDSC_9313 | FlyBase symbol: P{Tdc2-GAL4.C} |
| Genetic reagent (Drosophila melanogaster) | OK371-GAL4 | Bloomington Drosophila Stock Center | BDSC: 26160; FLYB:FBti0076967; RRID:BDSC_26160 | FlyBase symbol: Dmel\P{GawB}VGlutOK371 |
| Genetic reagent (Drosophila melanogaster) | UAS-SR4VH | This paper | Fly line maintained in DW Williams lab; See Materials and methods, section ‘Contstruction of UAS-SR4VH’ | |
| Genetic reagent (Drosophila melanogaster) | UAS-CD8::GFP | Bloomington Drosophila Stock Center | BDSC:5137; FLYB:FBtp0002652 ; RRID:BDSC_5137 | FlyBase symbol: P{UAS-mCD8::GFP.L} |
| Genetic reagent (Drosophila melanogaster) | UAS-tdTomato-p2A-GCaMP6s | Chen et al., 2018 | Gift from MH Dickinson | |
| Genetic reagent (Drosophila melanogaster) | H99 | Bloomington Drosophila Stock Center | BDSC:1576; FLYB:FBab0022359; RRID:BDSC_1576 | FlyBase symbol: Df(3L)H99 |
| Genetic reagent (Drosophila melanogaster) | XR38 | Peterson et al., 2002 | FLYB:FBab0027961 | FlyBase symbol: Df(3L)XR38 |
| Genetic reagent (Drosophila melanogaster) | dronc∆A8 | Kondo et al., 2006 | FLYB:FBal0244156 | FlyBase symbol: DroncΔA8 |
| Biological sample (Crataerina pallida) | Swift lousefly | Collected from Cambridgeshire and Suffolk, UK | Whole CNS or just VNC freshly dissected from Crataerina pallida | |
| Biological sample (Braula coeca) | Bee lousefly | A. Abrahams, Isle of Colonsay, UK | VNC freshly dissected from Braula coeca | |
| Biological sample (Thermobia domestica) | Firebrat | Buzzard Reptile and Aquatics (buzzardreptile.co.uk) | VNC freshly dissected from Thermobia domestica | |
| Antibody | anti-GFP (Chicken polyclonal) | Abcam | Cat# ab13970, RRID:AB_300798 | IF(1:500) |
| Antibody | anti-Neuroglian (Mouse monoclonal) | DSHB | Cat# BP 104, RRID:AB_528402 | IF(1:50) |
| Antibody | anti-Cleaved Drosophila Dcp-1 (Rabbit polyclonal) | Cell Signaling Technology | Cat# 9578, RRID:AB_2721060 | IF(1:100) |
| Antibody | anti-Syncrip (Guinea pig polyclonal) | Gift from I. Davis | IF(1:100) | |
| Antibody | anti-Engrailed/Invected (Mouse monoclonal) | DSHB | Cat# 4D9, RRID:AB_528224 | IF(1:2) |
| Antibody | anti-DVGLUT C-terminus (Rabbit polyclonal) | Gift from H. Aberle | Cat# AB-DVGLUT-C, RRID:AB_2490071 | IF(1:5000) |
| Antibody | anti-tyramine β-hydroxylase (Rat monoclonal) | Gift from M. Monastirioti | Cat# Tyramine beta-hydroxylase (TBH), RRID:AB_2315520 | IF(1:50) |
| Antibody | anti-vestigial (Rabbit polyclonal) | Gift from S. Carroll and K. Gruss | IF(1:400) | |
| Antibody | anti-GABA (Rabbit polyclonal) | ImmunoStar | Cat# 20094, RRID:AB_572234 | IF(1:100) |
| Recombinant DNA reagent | pUAST (plasmid) | Brand and Perrimon, 1993 | Insect expression, Drosophila; See Materials and methods, section ‘Contstruction of UAS-SR4VH’ | |
| Commercial assay or kit | Click-iT EdU Cell Proliferation Kit for Imaging | life technologies | Cat# C10337 | |
| Commercial assay or kit | Click-iT Plus TUNEL Assay for In Situ Apoptosis Detection | life technologies | Cat# C10618 | |
| Software, algorithm | Python Programming Language | Python Programming Language | RRID:SCR_008394 | |
| Software, algorithm | MATLAB | MathWorks | RRID:SCR_001622 | |
| Software, algorithm | SPSS | IBM | RRID:SCR_002865 | |
| Software, algorithm | Fiji | Fiji | RRID:SCR_002285 | |
| Other | DAPI | Sigma-Aldrich | Cat# D9542 | (1 µg/mL) |
| Other | Phalloidin-488 | life technologies | Cat# A12379 | (1:100) |
Additional files
Download links
A two-part list of links to download the article, or parts of the article, in various formats.
Downloads (link to download the article as PDF)
Open citations (links to open the citations from this article in various online reference manager services)
Cite this article (links to download the citations from this article in formats compatible with various reference manager tools)
Extensive and diverse patterns of cell death sculpt neural networks in insects
eLife 9:e59566.
https://doi.org/10.7554/eLife.59566


