Health benefits attributed to 17α-estradiol, a lifespan-extending compound, are mediated through estrogen receptor α
- Department of Nutritional Sciences, University of Oklahoma Health Sciences Center, United States
- Oklahoma Center for Geroscience, University of Oklahoma Health Sciences Center, United States
- Harold Hamm Diabetes Center, University of Oklahoma Health Sciences Center, United States
- The Jackson Laboratory, United States
- Department of Biochemistry and Molecular Biology, Mayo Clinic, United States
- Department of Cell Biology, University of Oklahoma Health Sciences Center, United States
- Dean McGee Eye Institute, University of Oklahoma Health Sciences Center, United States
- Department of Biochemistry and Molecular Biology, University of Oklahoma Health Sciences Center, United States
- Department of Molecular Pharmacology, Albert Einstein College of Medicine, United States
- Genes & Human Disease Research Program, Oklahoma Medical Research Foundation, United States
- Oklahoma City Veterans Affairs Medical Center, United States
Figures
Figure 1 with 1 supplement
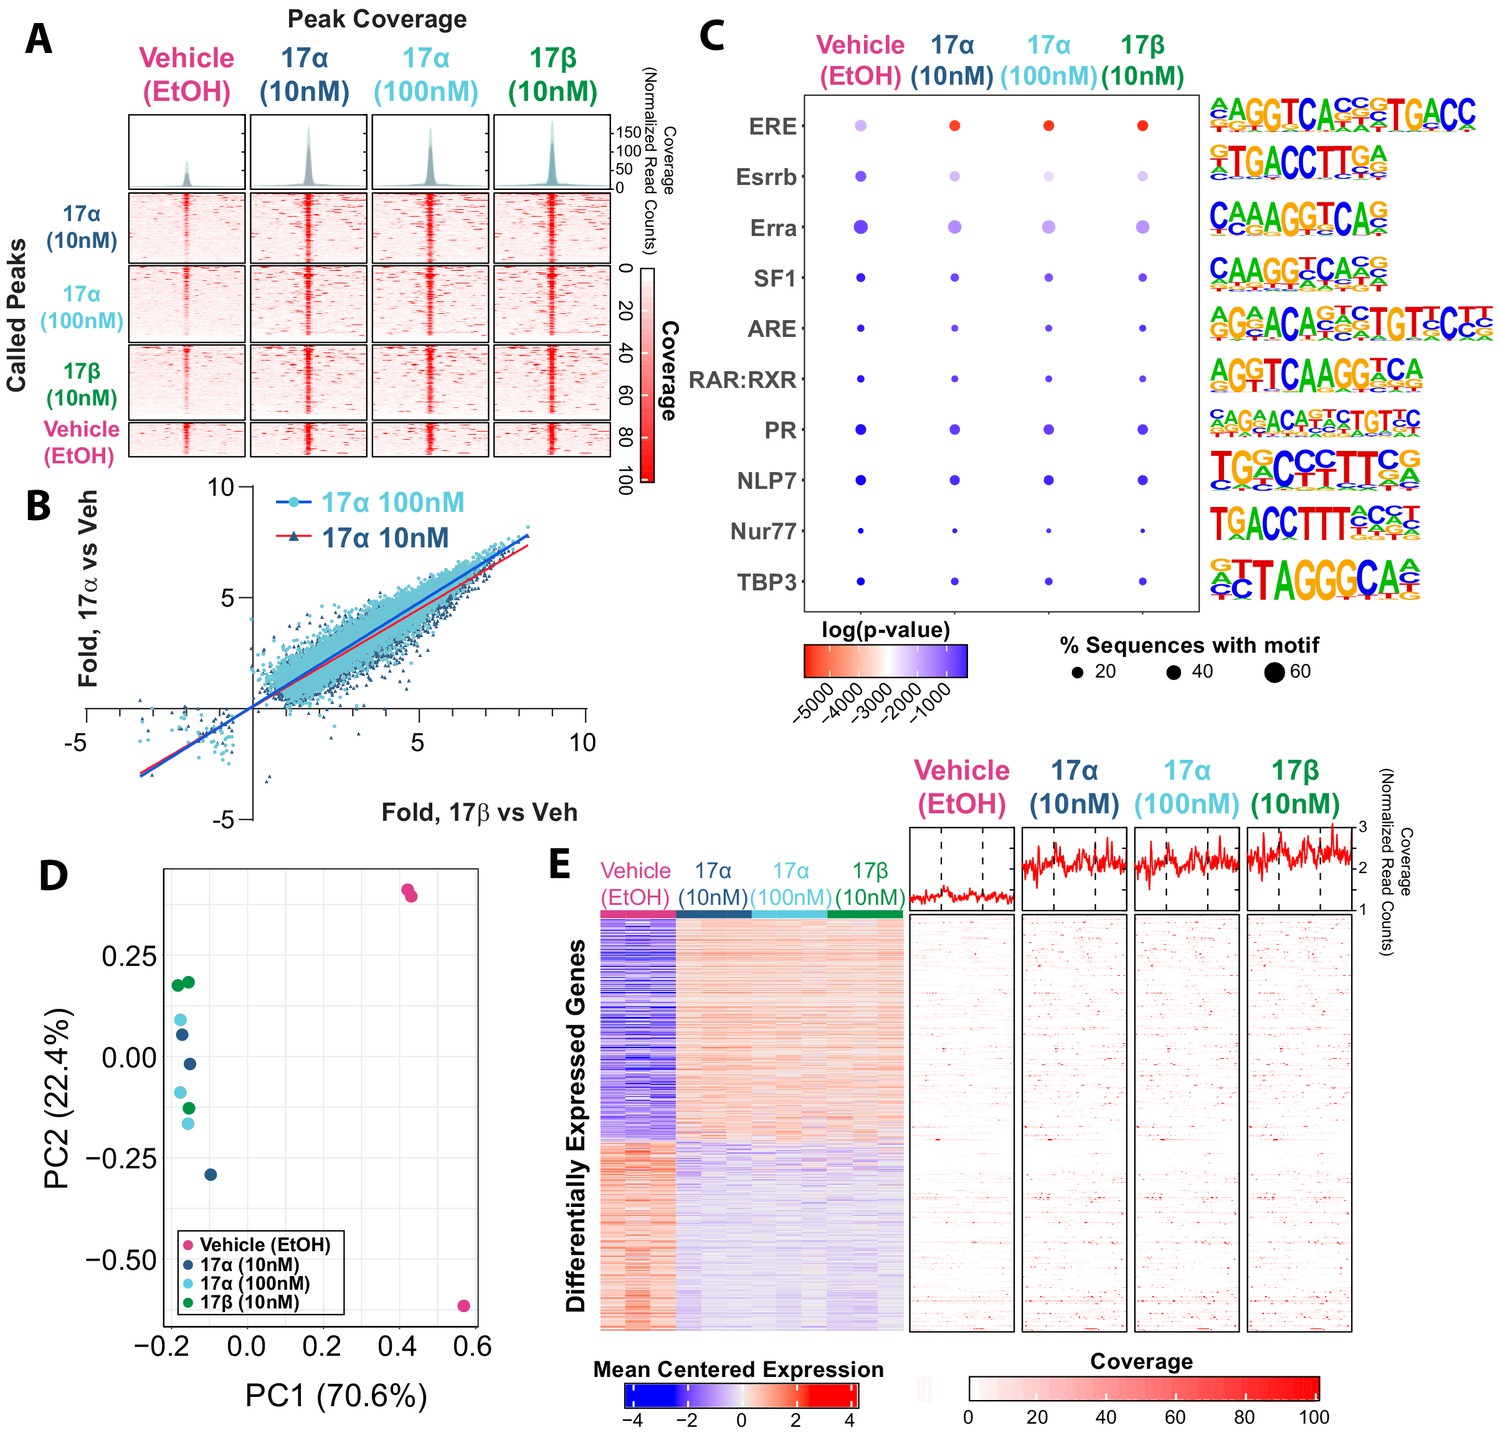
17α-E2 and 17β-E2 elicit similar genomic binding and transcriptional profiles through ERα.
(A) Heatmap representing normalized genome-wide DNA binding by ERα via ChIP sequencing analyses centered according to peak summits for each treatment group and compared to each other group. (B) Differential binding was identified between vehicle and 17α-E2 or 17β-E2 treatment groups, but no differences were identified between 17α-E2 and 17β-E2-treated groups (negative binomial regression, followed by Wald test for pairwise comparisons, FDR < 0.05). Fold change in binding relative to vehicle control was compared between 17α-E2 treatments and 17β-E2. (C) Motif enrichment analysis, filtered for mammalian and non-overlapping motif groups, showing the top 10 non-redundant enriched sequence motifs across treatment groups (hypergeometric test, FDR < 0.05), (D) PCA plot of transcriptional profiles by RNA sequencing analyses demonstrating clustering of 17α-E2 and 17β-E2 treatment groups together, opposite from Vehicle-treated group along the first principle component, and (E) Heatmap representing differentially expressed genes (negative binomial regression, followed by Wald test for pairwise comparisons, FDR < 0.05) by RNA sequencing analyses (left) and ERα binding patterns within the gene body ±5 kb flanking regions of these genes via ChIP sequencing (right). Significant differential pairwise expression was observed only between 17α-E2 and 17β-E2 treatment groups and vehicle-treated control. These studies utilized U2OS-ERα cells treated with low dose (10 nM) 17α-E2, high dose (100 nM) 17α-E2, 17β-E2 (10 nM), or vehicle (EtOH). n = 3/group.
Figure 1—figure supplement 1
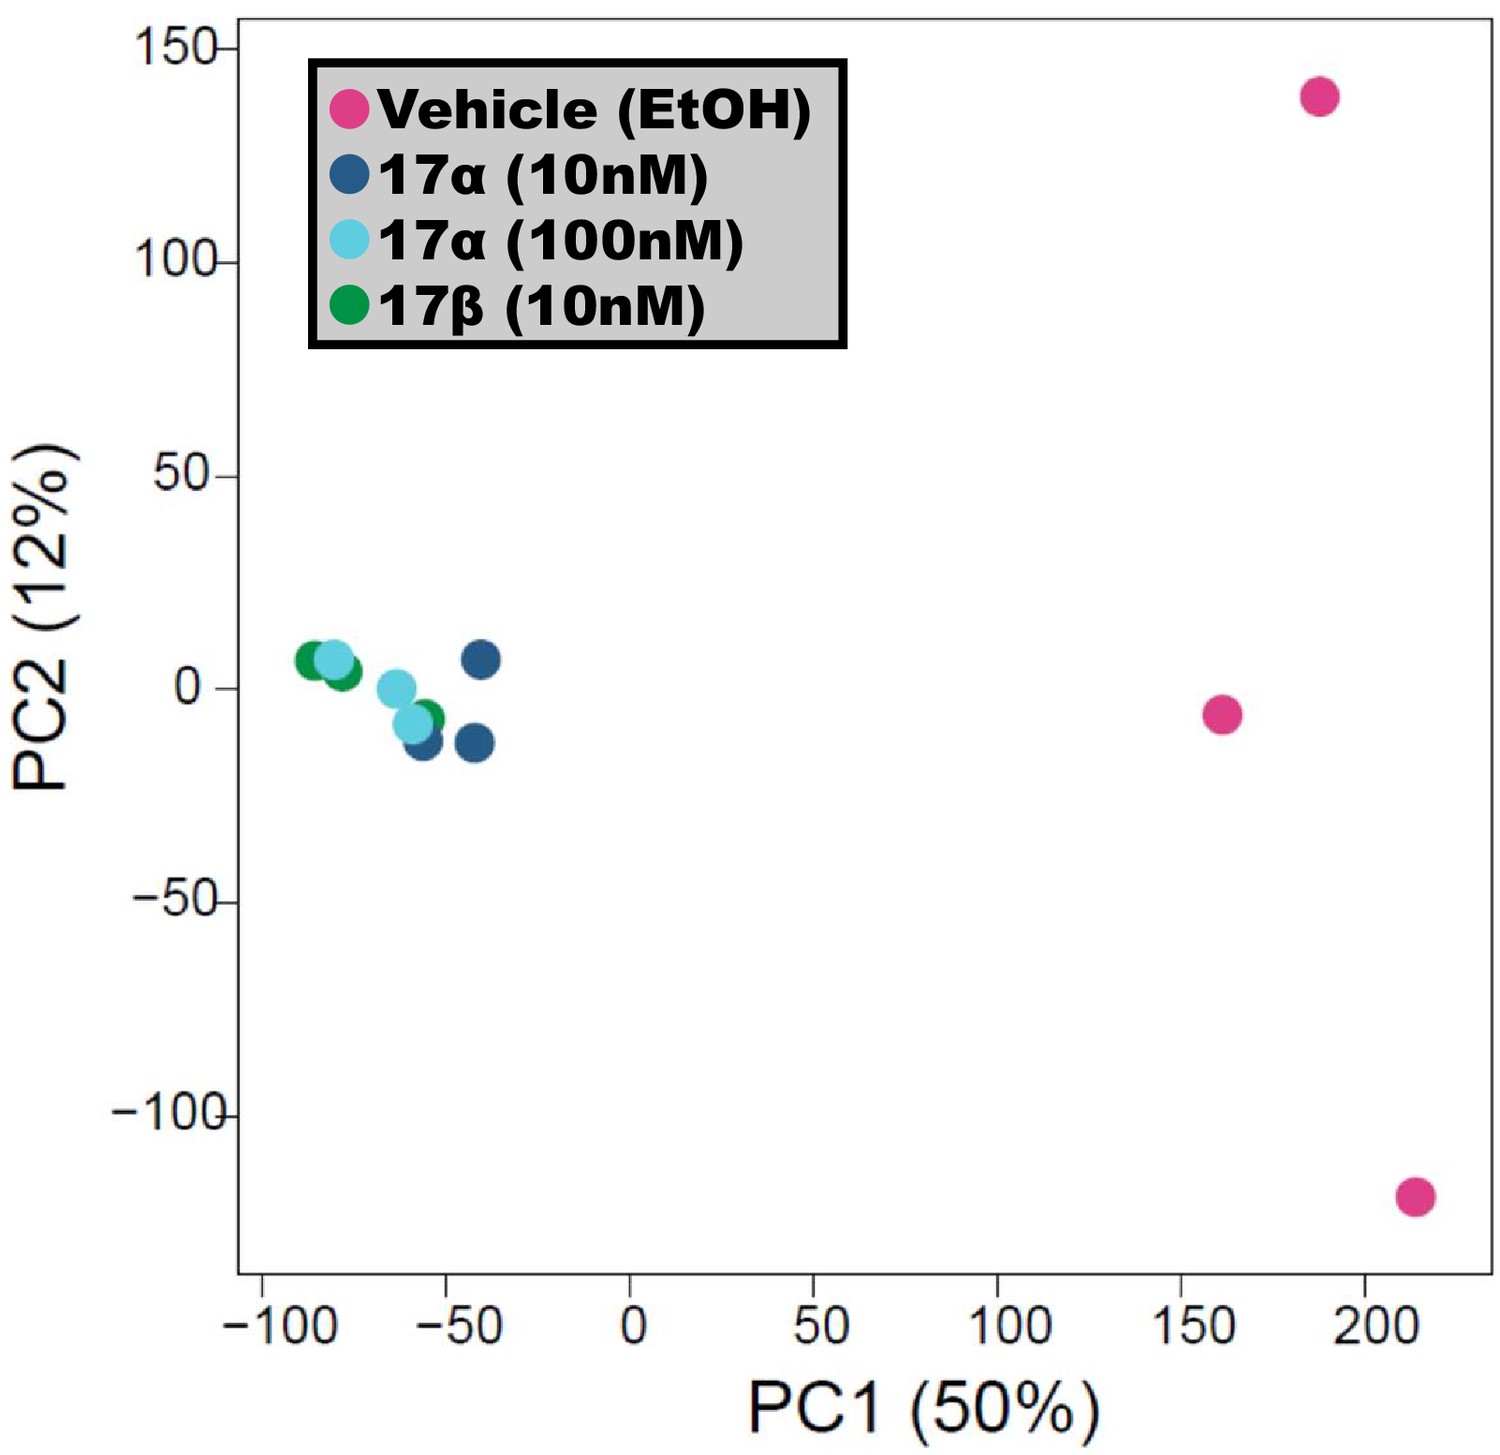
17α-E2 and 17β-E2 elicit similar ERα binding profile.
PCA plot of genome-wide ERα binding profiles by ChIP sequencing analyses. U2OS-ERα cells treated with low dose (10 nM) 17α-E2, high dose (100 nM) 17α-E2, or 17β-E2 (10 nM) induced binding in common genomic locations and differed from vehicle (EtOH) treated cells. n = 3/group.
Figure 2

ERα is required for 17α-E2 to reduce mass, adiposity, and calorie intake in male mice.
(A) Percent change in mass (mean ± SEM, two-way repeated measures ANOVA with Holm-Sidak post-hoc; *p<0.05, **p<0.005 between WT HFD and WT HFD+17α), (B) Mass at baseline (week 0; solid) and week 14 (striped) (mean ± SEM, two-way repeated measures ANOVA with Holm-Sidak post-hoc; *p<0.05, **p<0.005), (C) Percent change in fat mass (mean ± SEM, two-way repeated measures ANOVA with Holm-Sidak post-hoc; *p<0.05, **p<0.005), (D) Fat mass at baseline (week 0; solid) and week 14 (striped) (mean ± SEM, two-way repeated measures ANOVA with Holm-Sidak post-hoc; *p<0.05, **p<0.005), and (E) Average daily calorie intake per week in WT and ERα KO mice provided 45% HFD (TestDiet 58V8)±17α-E2 (14.4ppm) (mean ± SEM, two-way repeated measures ANOVA with Holm-Sidak post-hoc; *p<0.05, **p<0.005). Age-matched, male WT, chow-fed (TestDiet 58YP) mice were also evaluated as a normal-weight reference group and the corresponding means are depicted as dashed gray lines. n = 10 (WT HFD), 10 (WT HFD+17α), 9 (KO HFD), 10 (KO HFD+17α), 12–15 (WT Chow).
Figure 3 with 2 supplements
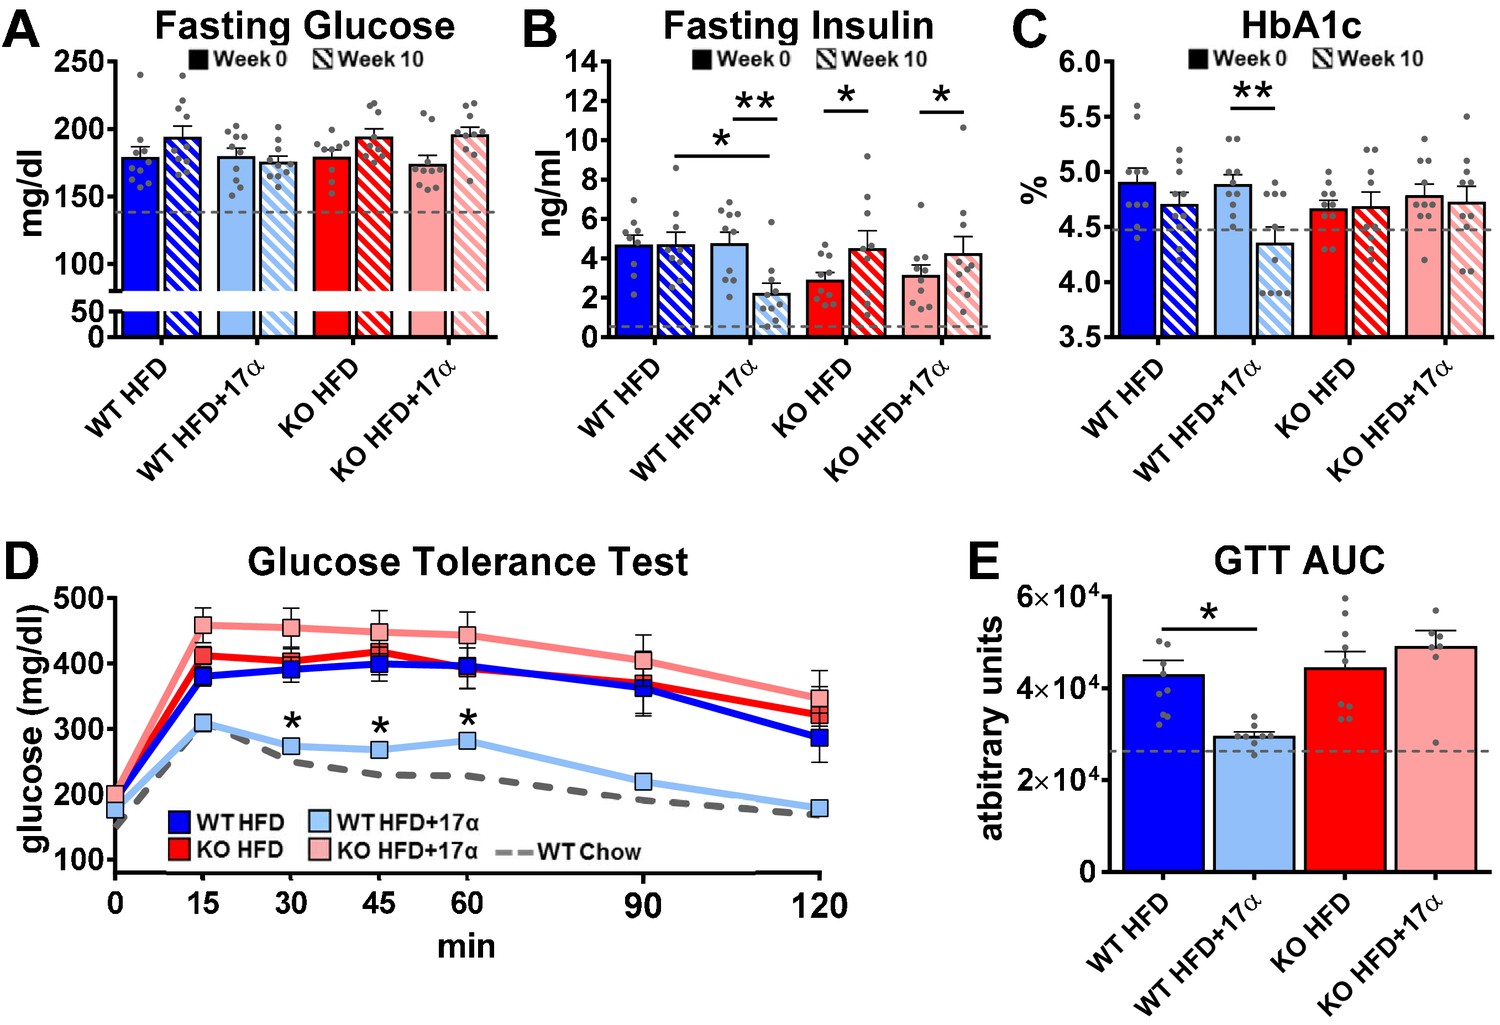
17α-E2 reverses obesity-related metabolic dysfunction in male WT, but not ERα KO, mice.
(A) Fasting glucose (mean ± SEM, two-way repeated measures ANOVA), (B) Fasting insulin (mean ± SEM, two-way repeated measures ANOVA with Holm-Sidak post-hoc; *p<0.05, **p<0.005), and (C) glycosylated hemoglobin (HbA1c) at baseline (week 0; solid) and week 14 (striped) in WT and ERα KO mice provided 45% HFD (TestDiet 58V8)±17α-E2 (14.4 ppm) (mean ± SEM, two-way repeated measures ANOVA with Holm-Sidak post-hoc; **p<0.005). (D) Glucose tolerance testing (GTT; 1 mg/kg) (mean ± SEM, two-way repeated measures ANOVA with Holm-Sidak post-hoc; *p<0.05 between WT HFD and WT HFD+17α), and (E) GTT AUC during week 10 of the study (mean ± SEM, two-way ANOVA with Holm-Sidak post-hoc; *p<0.05). Age-matched, male WT, chow-fed (TestDiet 58YP) mice were also evaluated as a normal-weight reference group and the corresponding means are depicted as dashed gray lines. n = 9–10 (WT HFD), 8–10 (WT HFD+17α), 9–10 (KO HFD), 8–10 (KO HFD+17α), 12–15 (WT Chow).
Figure 3—figure supplement 1
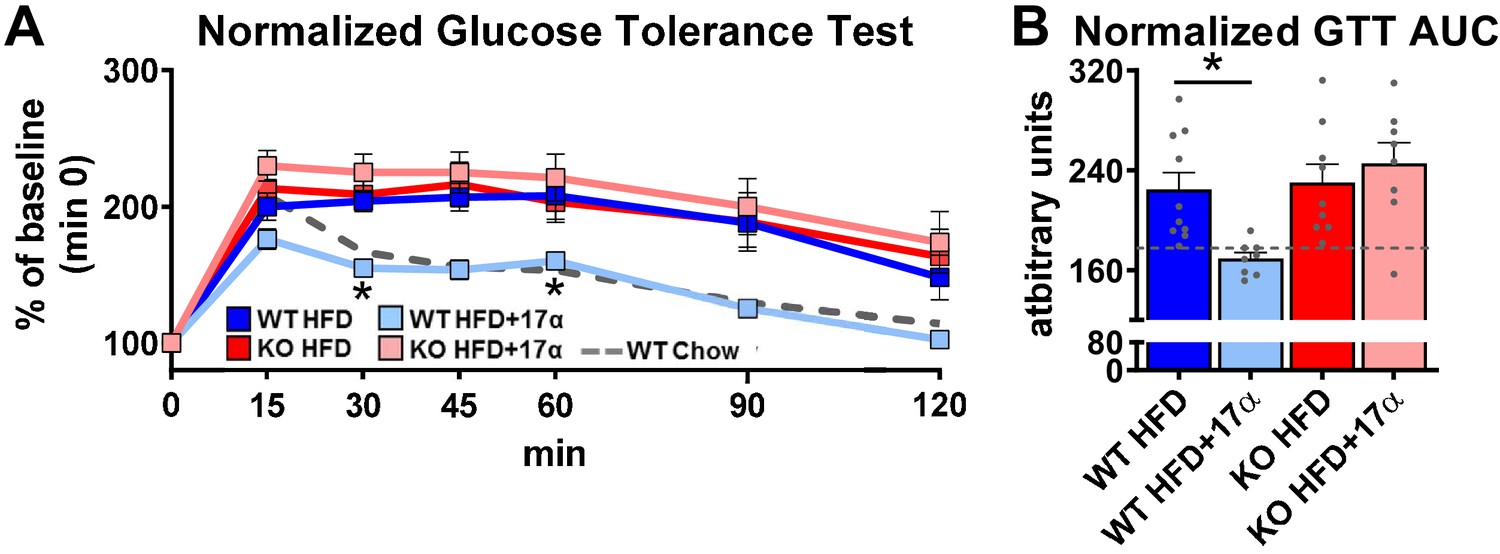
17α-E2 reverses obesity-related metabolic dysfunction in male WT, but not ERα KO, mice.
(A) Glucose tolerance testing (GTT; 1 mg/kg), normalized to baseline (min 0) (mean ± SEM, two-way repeated measures ANOVA with Holm-Sidak post-hoc; *p<0.05 between WT HFD and WT HFD+17α), and (B) Normalized GTT AUC in WT and ERα KO mice provided 45% HFD (TestDiet 58V8)±17α-E2 (14.4ppm) for 10 weeks (mean ± SEM, two-way ANOVA with Holm-Sidak post-hoc; *p<0.05). Age-matched, male WT, chow-fed (TestDiet 58YP) mice were also evaluated as a normal-weight reference group and the corresponding means are depicted as dashed gray lines. n = 10 (WT HFD), 8 (WT HFD+17α), 9 (KO HFD), 8 (KO HFD+17α), 12 (WT Chow).
Figure 3—figure supplement 2
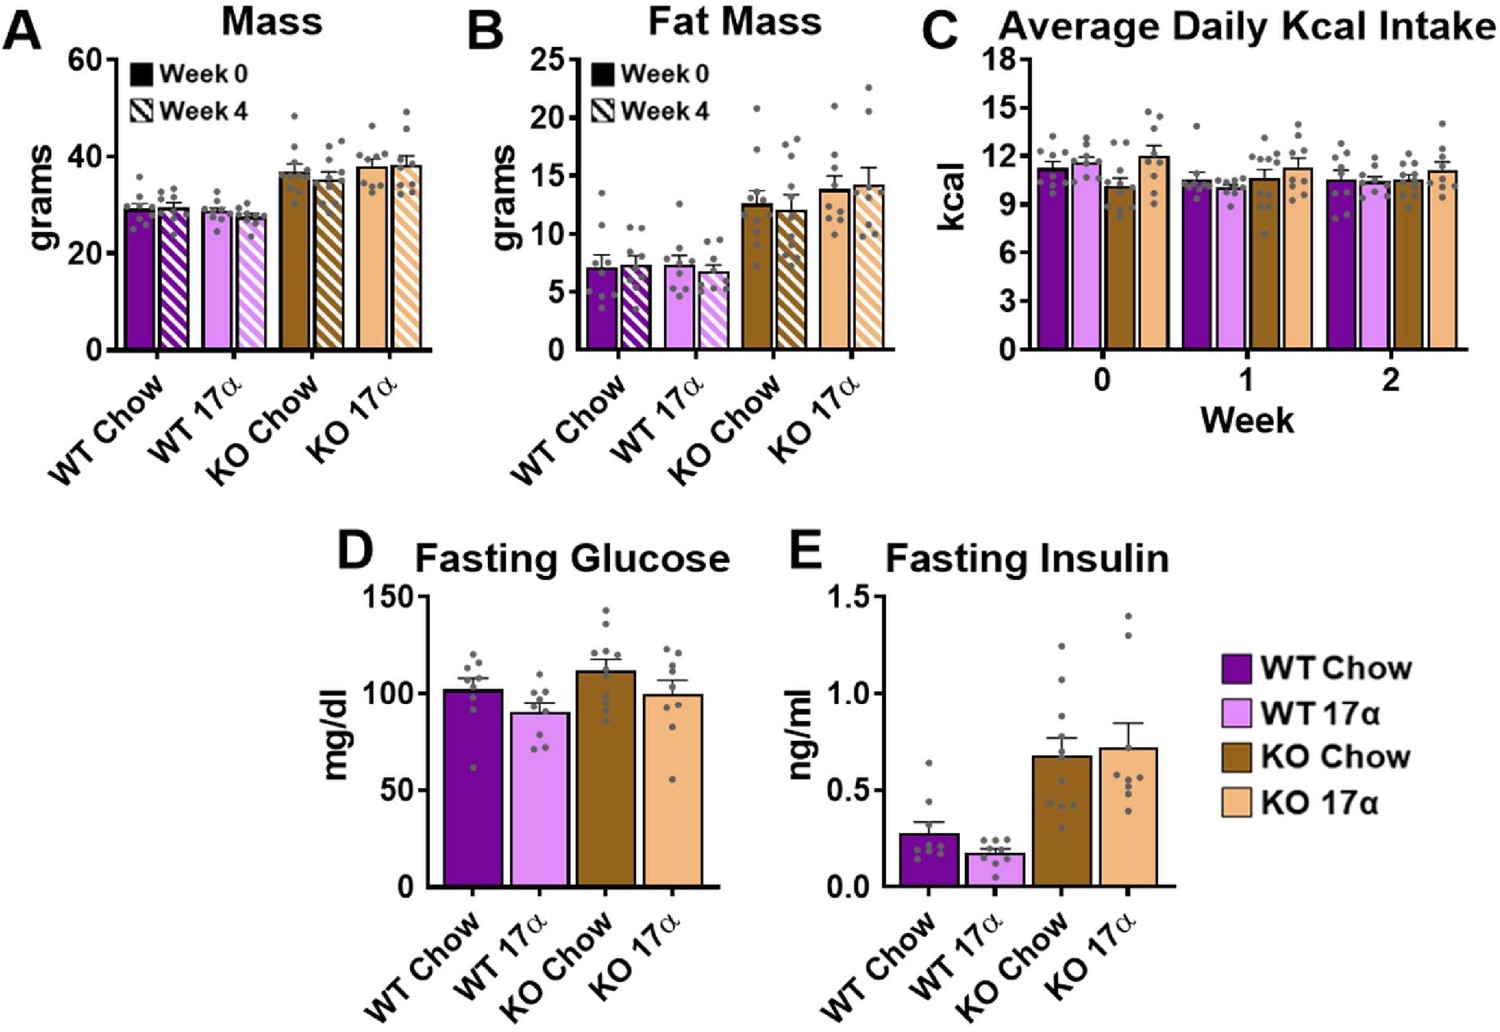
17α-E2 fails to alter metabolic parameters in WT or ERα KO female mice.
(A) Mass at baseline (week 0; solid) and week 4 (striped) (mean ± SEM, two-way repeated measures ANOVA), (B) Fat mass at baseline (week 0; solid) and week 4 (striped) (mean ± SEM, two-way repeated measures ANOVA), (C) Average daily calorie intake per week (mean ± SEM, two-way repeated measures ANOVA), (D) Fasting glucose during week 4 (mean ± SEM, two-way repeated measures ANOVA), and (E) Fasting insulin during week 4 in WT and ERα KO female mice provided chow (TestDiet 58YP)±17α-E2 (14.4ppm) (mean ± SEM, two-way repeated measures ANOVA). n = 9 (WT Chow), 9 (WT 17α), 11 (KO Chow), 9 (KO 17α).
Figure 4 with 2 supplements
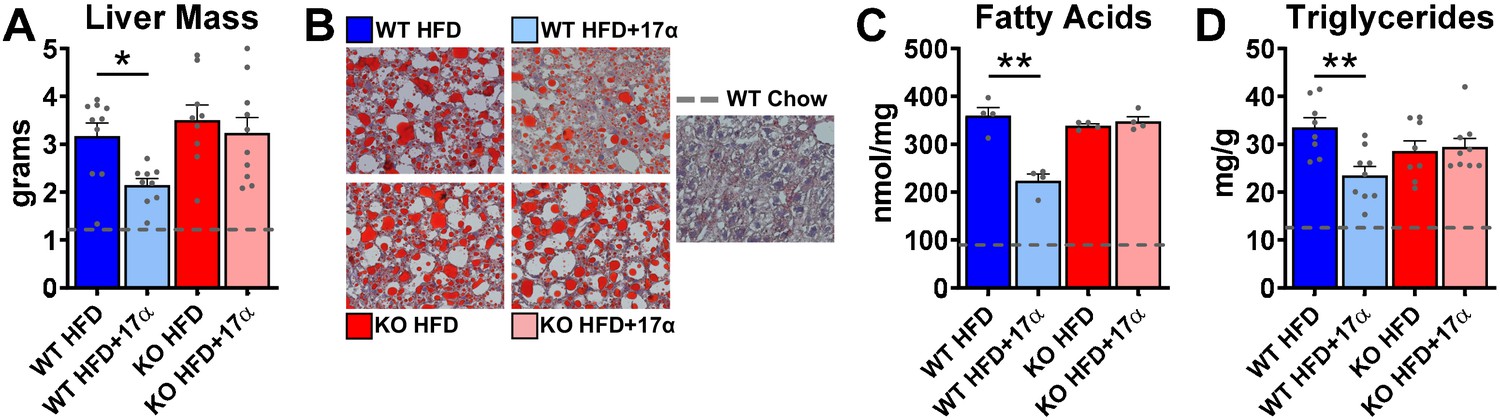
17α-E2 reverses obesity-related hepatic steatosis in an ERα-dependent manner in male mice.
(A) Liver mass (mean ± SEM, two-way ANOVA with Holm-Sidak post-hoc; *p<0.05), (B) Representative liver oil-red-O staining, (C) Liver fatty acids (mean ± SEM, two-way ANOVA with Holm-Sidak post-hoc; **p<0.005), and (D) Liver triglycerides in WT and ERα KO mice provided 45% HFD (TestDiet 58V8)±17α-E2 (14.4ppm) for 14 weeks (mean ± SEM, two-way ANOVA with Holm-Sidak post-hoc; **p<0.005). Age-matched, male WT, chow-fed (TestDiet 58YP) mice were also evaluated as a normal-weight reference group and the corresponding means are depicted as dashed gray lines. n = 4–10 (WT HFD), 4–9 (WT HFD+17α), 4–9 (KO HFD), 4–10 (KO HFD+17α), 4–15 (WT Chow).
Figure 4—figure supplement 1
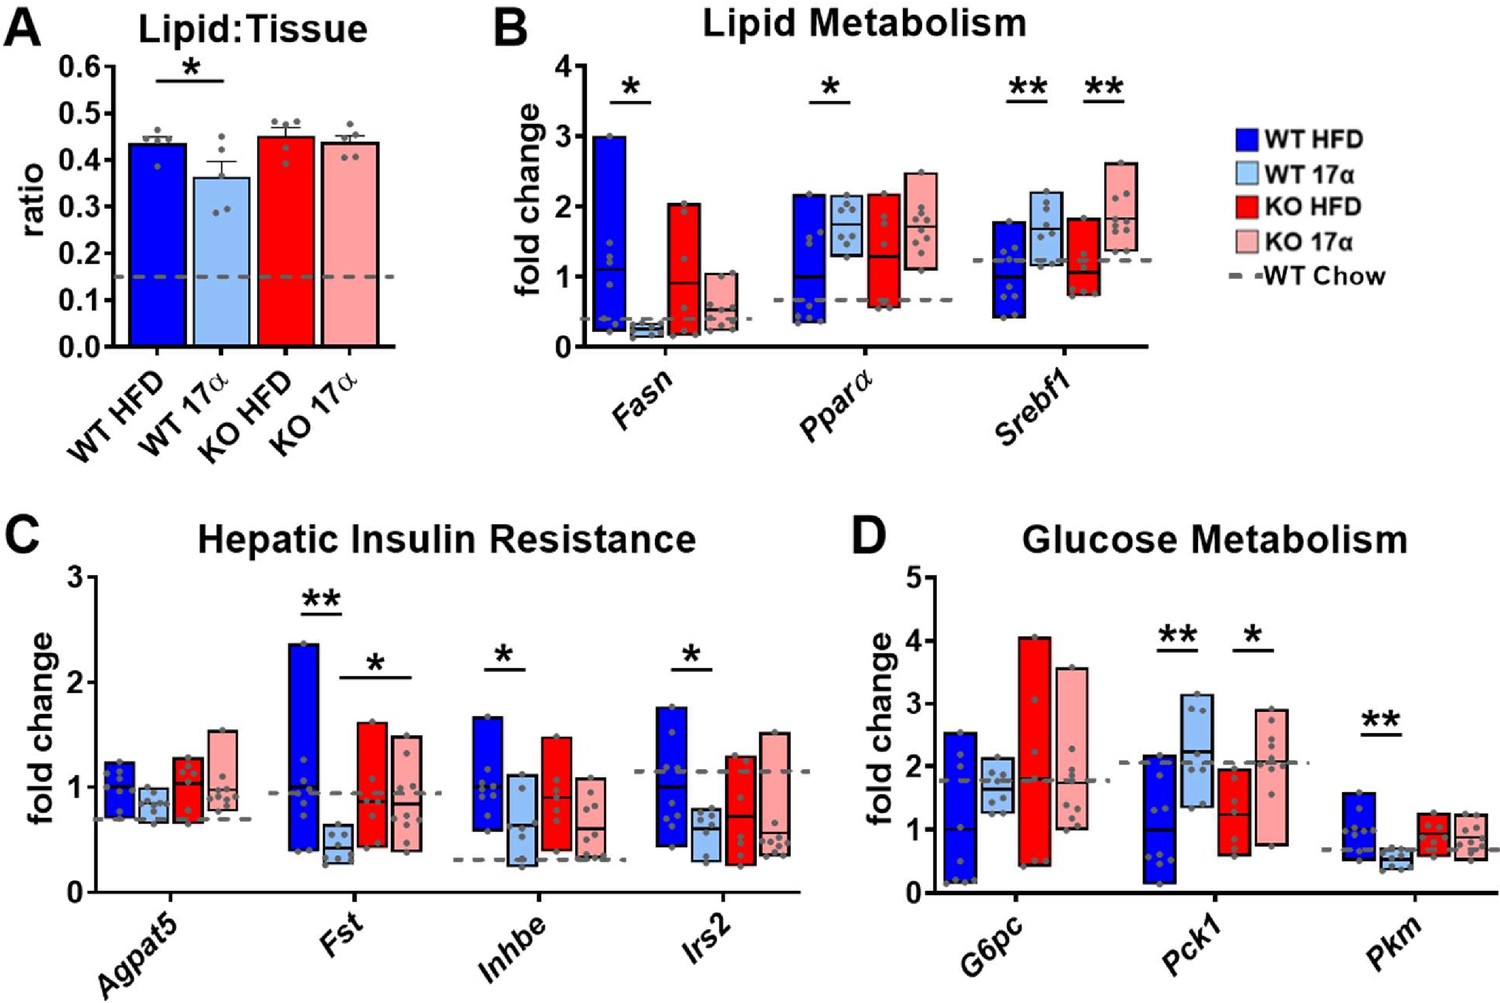
17α-E2 alters markers of lipid and glucose homeostasis predominantly through ERα in male mice.
(A) Quantification of oil-red-O lipid staining in liver sections from WT and ERα KO mice provided 45% HFD (TestDiet 58V8)±17α-E2 (14.4ppm) for 14 weeks (mean ± SEM, two-way ANOVA with Holm-Sidak post-hoc; *p<0.05). Hepatic gene expression related to (B) Lipid metabolism (box plots depict total range of fold changes in gene expression with mean shown as a horizontal black line, Benjamini–Hochberg multiple testing correction, two-way ANOVA with Holm-Sidak post-hoc; *p<0.05, **p<0.005), (C) Hepatic insulin resistance (box plots depict total range of fold changes in gene expression with mean shown as a horizontal black line, Benjamini–Hochberg multiple testing correction, two-way ANOVA with Holm-Sidak post-hoc; *p<0.05, **p<0.005), and (D) Glucose homeostasis from WT and ERα KO mice provided 45% HFD (TestDiet 58V8)±17α-E2 (14.4ppm) for 14 weeks (box plots depict total range of fold changes in gene expression with mean shown as a horizontal black line, Benjamini–Hochberg multiple testing correction, two-way ANOVA with Holm-Sidak post-hoc; *p<0.05, **p<0.005). Age-matched, male WT, chow-fed (TestDiet 58YP) mice were also evaluated as a normal-weight reference group and the corresponding means are depicted as dashed gray lines. n = 5–10 (WT HFD), 5–9 (WT HFD+17α), 5–7 (KO HFD), 5–10 (KO HFD+17α), 8–11 (WT Chow).
Figure 4—figure supplement 2
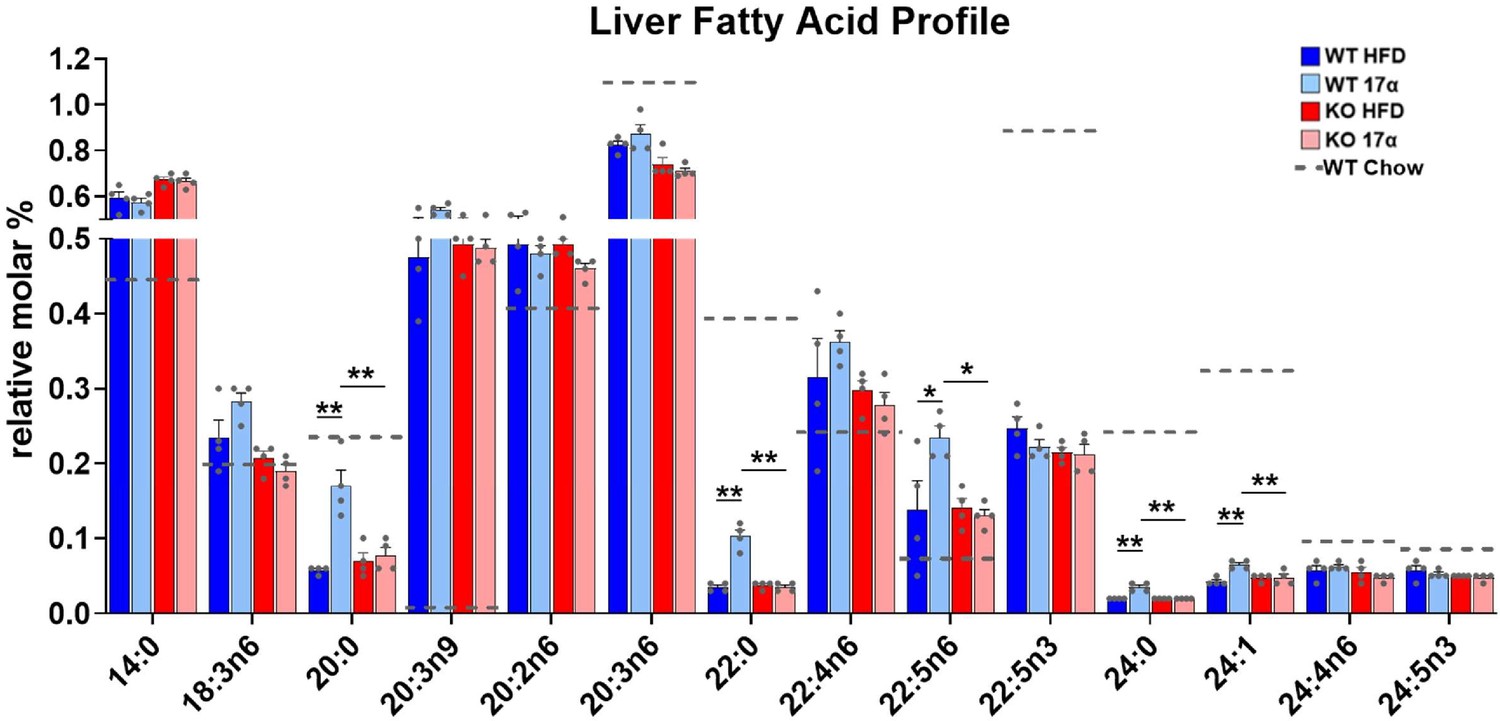
17α-E2 alters the hepatic fatty acid profile in male WT, but not ERα KO, mice.
Relative molar % of fatty acids in the liver from WT and ERα KO mice provided 45% HFD (TestDiet 58V8)±17α-E2 (14.4ppm) for 14 weeks (mean ± SEM, Benjamini–Hochberg multiple testing correction, two-way ANOVA with Holm-Sidak post-hoc; *p<0.05, **p<0.005). Age-matched, male WT, chow-fed (TestDiet 58YP) mice were also evaluated as a normal-weight reference group and the corresponding means are depicted as dashed gray lines. n = 4.
Figure 5

17α-E2 reverses obesity-related liver fibrosis and insulin resistance in an ERα-dependent manner in male mice.
(A) Representative liver Masson’s trichrome staining for collagen and (B) Liver transcriptional markers of fibrosis in WT and ERα KO mice provided 45% HFD (TestDiet 58V8)±17α-E2 (14.4ppm) for 14 weeks (box plots depict total range of fold changes in gene expression with mean shown as a horizontal black line, Benjamini–Hochberg multiple testing correction, two-way ANOVA with Holm-Sidak post-hoc; *p<0.05, **p<0.005). (C) Schematic of in vivo insulin stimulation (2mU/g) in fasting mice, (D) Representative liver immunoblots, and (E) Quantification of phospho/total (p/t) AKT (pS473) and FOXO1 (pS256) in WT and ERα KO mice provided 60% HFD (TestDiet 58Y1)±17α-E2 (14.4ppm) for 12 weeks (mean ± SEM, Benjamini–Hochberg multiple testing correction, two-way ANOVA with Holm-Sidak post-hoc; **p<0.005). Age-matched, male WT, chow-fed (TestDiet 58YP) mice were also evaluated as a normal-weight reference group and the corresponding means are depicted as dashed gray lines. n = 7–10 (WT HFD), 8–9 (WT HFD+17α), 7–10 (KO HFD), 10 (KO HFD+17α), 7–11 (WT Chow).
Figure 6
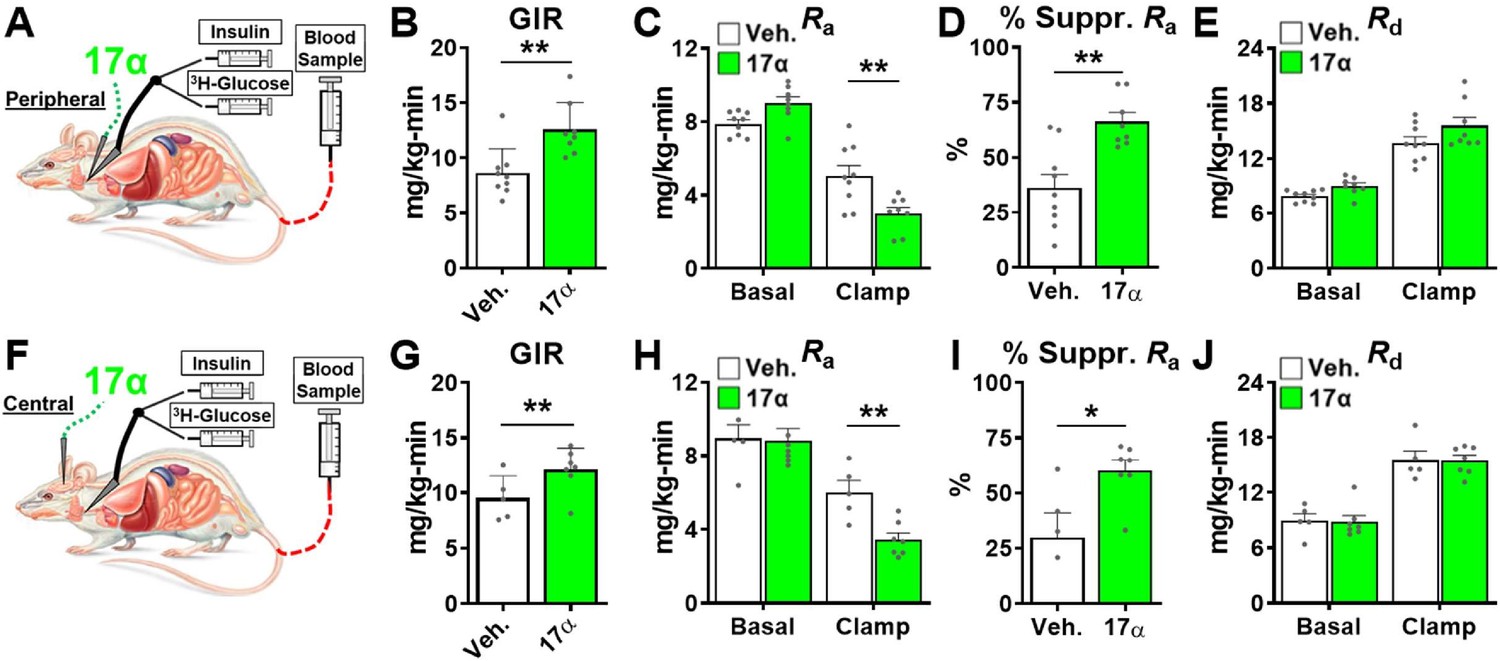
Acute delivery of 17α-E2 improves hepatic insulin sensitivity.
(A) Schematic of peripheral 17α-E2 infusions (or vehicle) during hyperinsulinemic-euglycemic clamps, (B) glucose infusion rates (GIR) (mean ± SEM, unpaired Student’s t-test; **p<0.005), (C) rate of glucose appearance (Ra; hepatic glucose production) (mean ± SEM, unpaired Student’s t-test on Clamp; **p<0.005), (D) % suppression of hepatic glucose production (mean ± SEM, unpaired Student’s t-test; **p<0.005), and (E) rate of glucose disappearance (Rd; peripheral glucose disposal) in 6 month old, male, FBN-F1 hybrid rats (mean ± SEM, unpaired Student’s t-test on Clamp). (F) Schematic of ICV (central) 17α-E2 infusions (or vehicle) during hyperinsulinemic-euglycemic clamps, (G) GIR (mean ± SEM, unpaired Student’s t-test; *p<0.05), (H) Ra (mean ± SEM, unpaired Student’s t-test on Clamp; **p<0.005), (I) % suppression glucose production (mean ± SEM, unpaired Student’s t-test; *p<0.05), and (J) Rd in 6-month-old, male, FBN-F1 hybrid rats (mean ± SEM, unpaired Student’s t-test on Clamp). n = 5–9 (Veh.), 7–8 (17α).
Tables
Key resources table
| Reagent type (species) or resource | Designation | Source or reference | Identifiers | Additional information |
|---|---|---|---|---|
| Genetic reagent (M. musculus) | B6N(Cg)-Esr1tm4.2Ksk/J | The Jackson Laboratory | Stock No:026176; RRID:IMSR_JAX:026176 | ERα (Esr1) KO mice |
| Cell line (Homo sapien) | U2OS Cells | ATCC | HTB-96; RRID:CVCL_0042 | PMID:15802376 PMID:14505348 |
| Antibody | anti-FLAG M2 (Mouse monoclonal) | Sigma-Aldrich | F1804 | IP: 1 uL per pull-down (1 mg/mL) |
| Commercial assay or kit | Protein G Dynabeads | Applied Biosystems/Thermofisher Scientific | 10003D | IP: 30 uL per IP |
| Chemical compound, drug | 17α-E2 | Steraloids, Inc | E0870-000 | |
| Chemical compound, drug | Novolin R 100 U/ml | Novolin | 2mU/g | |
| Other (diet) | Chow; TestDiet 58YP | TestDiet | TestDiet 58YP | |
| Other (diet) | HFD; TestDiet 58V8 | TestDiet | TestDiet 58V8 | HFD 45% by kcal |
| Other (diet) | HFD; TestDiet 58Y1 | TestDiet | TestDiet 58Y1 | HFD 60% by kcal |
| Commercial assay or kit | Mouse Ultrasensitive Insulin ELISA | ALPCO | Cat# 80-INSMSU-E01; RRID:AB_2792981 | |
| Commercial assay or kit | Free Glycerol Agent | Sigma-Aldrich | Sigma F6428 | |
| Commercial assay or kit | Triglyceride Reagent | Sigma-Aldrich | Sigma F6428 | |
| Commercial assay or kit | Glycerol Standard | Sigma-Aldrich | Sigma G1394 | |
| Antibody | anti-pS473 AKT (Rabbit polyclonal) | Abcam | Cat# ab81283; RRID:AB_2224551 | WB: (1:3000) |
| Antibody | Anti-pan-AKT (Rabbit polyclonal) | Abcam | Cat# ab179463; RRID:AB_2810977 | WB (1:10000) |
| Antibody | Anti-pS256 FOX01 (Rabbit polyclonal) | Abcam | Cat# ab131339; RRID:AB_11159015 | WB (1:1000) |
| Antibody | Anti-FOX01a (Rabbit polyclonal) | Abcam | Cat# ab52857; RRID:AB_869817 | WB (1:1000) |
| Antibody | Anti-GAPDH (Rabbit polyclonal) | Abcam | Cat# ab9485; RRID:AB_307275 | WB (1:2500) |
| Antibody | Anti-Rabbit IgG, IRDye 800 CW | LI-COR | Cat# 926–32211; RRID:AB_621843 | WB (1:15000) |
| Commercial assay or kit | TaqMan Gene Expression Master Mix | Applied Biosystems/Thermofisher Scientific | 4369542 | |
| Sequenced-based reagent | qPCR primer Mmp1 | Integrated DNA Technologies | Mm.PT.58.42286812 Ref Seq: NM_008607(1) | Exon 5–6 |
| Sequenced-based reagent | qPCR primer Mmp12 | Integrated DNA Technologies | Mm.PT.58.31615472 Ref Seq: NM_008605(1) | Exon 8–9 |
| Sequenced-based reagent | qPCR primer Ccl2 | Integrated DNA Technologies | Mm.PT.58.42151692 Ref Seq: NM_011333(1) | Exon 1–3 |
| Sequenced-based reagent | qPCR primer Srebf1 | Integrated DNA Technologies | Mm.PT.58.8508227 Ref Seq: NM_011480(1) | Exon 1–2 |
| Sequenced-based reagent | qPCR primer Pck1 | Integrated DNA Technologies | Mm.PT.58.11992693 Ref Seq: NM_011044(1) | Exon 3–4 |
| Sequenced-based reagent | qPCR primer Cdkn1a | Integrated DNA Technologies | Mm.PT.58.17125846 Ref Seq: NM_007669(1) | Exon 2–3 |
| Sequenced-based reagent | qPCR primer Pparα | Integrated DNA Technologies | Mm.PT.58.9374886 Ref Seq: NM_001113418(2) | Exon 8–9 |
| Sequenced-based reagent | qPCR primer Cxcl1 | Integrated DNA Technologies | Mm.PT.58.42076891 Ref Seq: NM_008176(1) | Exon 2–4 |
| Sequenced-based reagent | qPCR primer Col1a1 | Integrated DNA Technologies | Mm.PT.58.7562513 Ref Seq: M_007742(1) | Exon 1–2 |
| Sequenced-based reagent | qPCR primer Tnfrsf1a | Integrated DNA Technologies | Mm.PT.58.28810479 Ref Seq: NM_011609(1) | Exon 5–7 |
| Software, algorithm | SigmaPlot 12.5 | Systat Software | RRID:SCR_003210 | statistical analyses |
| Software, algorithm | ImageJ | ImageJ | RRID:SCR_003070 | histological quantification |
| Software, algorithm | Image Studio | LI-COR | RRID:SCR_015795 | western blot quantification |
| Software, algorithm | RStudio | GenomicAlignments DiffBind DESeq2 GenomicRanges | RRID:SCR_000432 | Peak Calling Differential expression Differential binding |
| Software, algorithm | Bowtie2 MACS2 Bedtools Samtools Picard-tools Trimmomatic | Bowtie2 MACS2 Bedtools Samtools Picard-tools Trimmomatic | Alignment, Peak Calling, trimming, duplicate identification |
Additional files
-
Supplementary file 1
Pairwise statistical comparisons of ERα binding.
Negative binomial regression Wald post-hoc comparison test, FDR < 0.05. n = 3/group.
- https://cdn.elifesciences.org/articles/59616/elife-59616-supp1-v2.xlsx
-
Supplementary file 2
ERα binding motif analysis.
Motif analysis was performed using HOMER with standard settings with the significance threshold set to FDR corrected p<0.05. Peak regions called for each treatment group were analyzed to identify enriched motifs relative to the entire genome. Hypergeometric test was used to test enrichment. Only motifs with FDR corrected p<0.05 were reported as significant. For pairwise differential motif enrichment or depletion across experimental groups, we utilized the hypergeometric test by using the number of sequences with motif from each group and total number of peaks as total sample size. Motifs that appear in less than five sequences between both test groups were removed. Benjamini-Hochberg multiple testing correction was utilized to control for false discovery rate (FDR < 0.05).
- https://cdn.elifesciences.org/articles/59616/elife-59616-supp2-v2.xlsx
-
Supplementary file 3
Circulating eicosanoid levels (pmol/ml).
17α-E2 mildly alters the circulating eicosanoid profile in obese middle-aged male mice. WT mice were provided 45% HFD (TestDiet 58V8)±17α-E2 (14.4ppm) for 14 weeks. Age-matched, male WT, chow-fed (TestDiet 58YP) mice were also evaluated as a normal-weight reference group. All data are presented as mean ± SEM and were analyzed by Student’s t-test with the WT Chow group being excluded from statistical comparisons. n = 5–7.
- https://cdn.elifesciences.org/articles/59616/elife-59616-supp3-v2.xlsx
-
Transparent reporting form
- https://cdn.elifesciences.org/articles/59616/elife-59616-transrepform-v2.docx
Download links
A two-part list of links to download the article, or parts of the article, in various formats.
Downloads (link to download the article as PDF)
Open citations (links to open the citations from this article in various online reference manager services)
Cite this article (links to download the citations from this article in formats compatible with various reference manager tools)
Health benefits attributed to 17α-estradiol, a lifespan-extending compound, are mediated through estrogen receptor α
eLife 9:e59616.
https://doi.org/10.7554/eLife.59616


