Dendritic coincidence detection in Purkinje neurons of awake mice
- Optical Neuroimaging Unit, Okinawa Institute of Science and Technology Graduate University (OIST), Japan
Figures
Figure 1 with 1 supplement
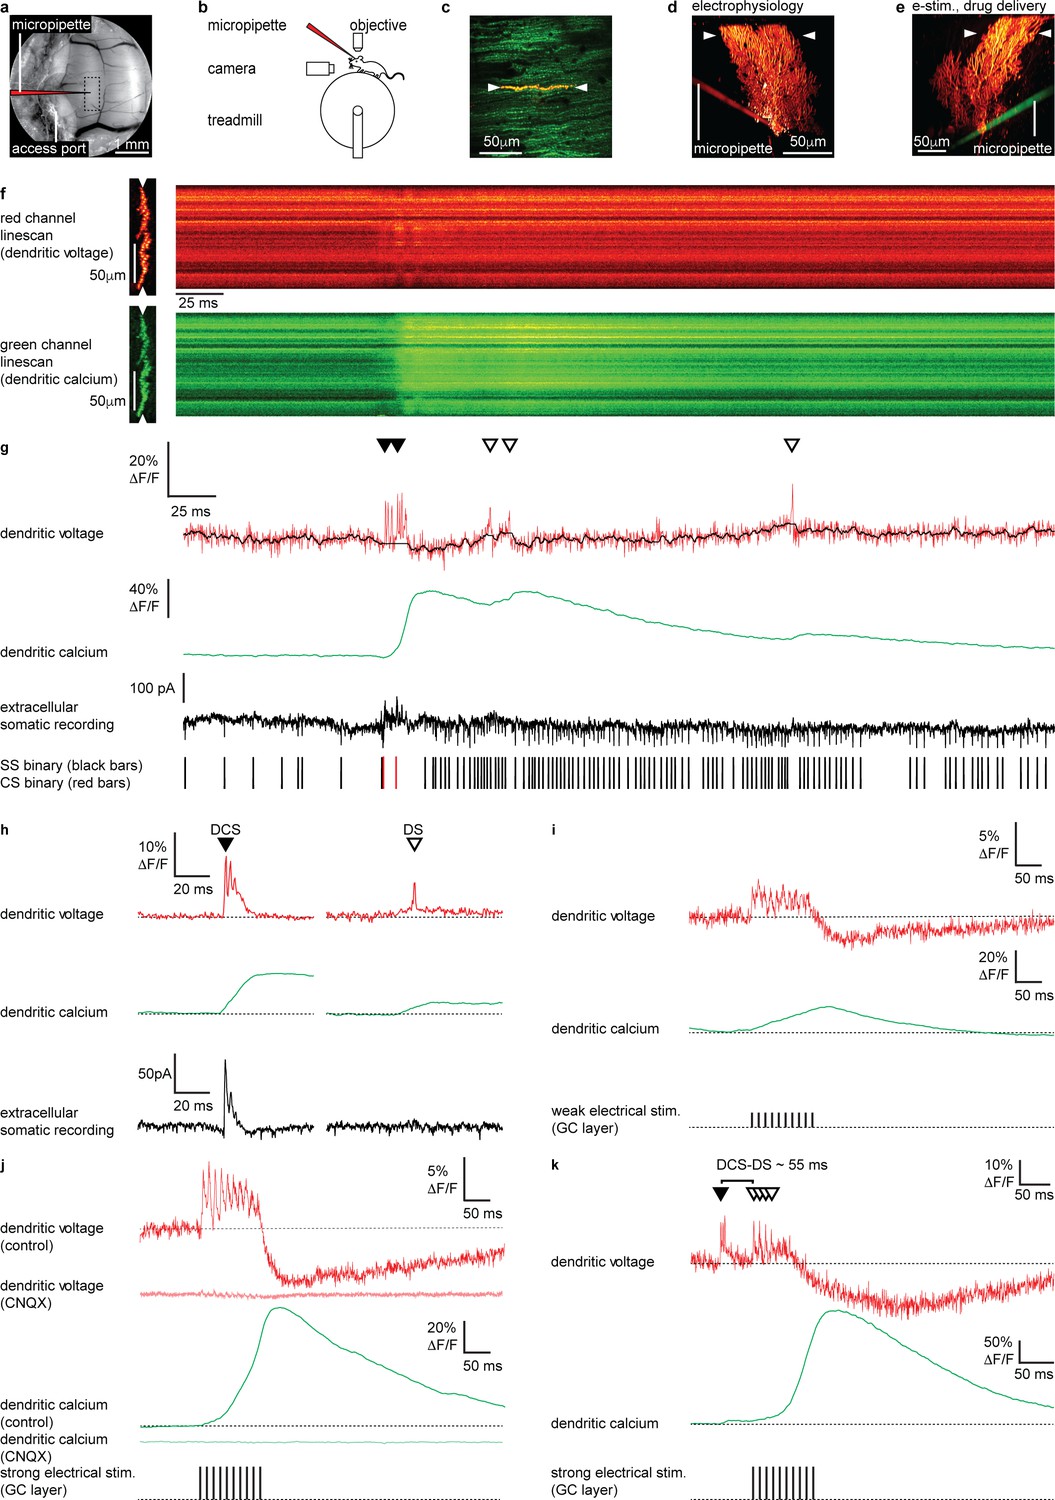
Electrical stimulation of parallel fiber (PF) input evokes graded dendritic voltage and calcium signals and dendritic spikes (DSs) in Purkinje neuron (PN) dendrites.
(a) A chronic cranial window with access port on the cerebellar vermis lobule V was used for imaging from the dendrites of single PNs and allowed access to the brain via micropipette. The dashed box indicates the typical region used for PN labeling and recording (schematically indicated). (b) Sketch of the setup with a mouse mounted on a treadmill under a 2P microscope for imaging in the cerebellar vermis. (c) 2P image of the spiny dendrites of a single PN labeled with voltage sensitive dye ANNINE-6plus (red) and genetically encoded calcium indicator GCaMP6f (green), resulting in double labeling (yellow), showing position of 2P linescan (white arrows). (d) Reconstruction of a single labeled PN showing position of 2P linescan (white arrows) and the micropipette (red) positioned on the PN soma used for electrophysiology. (e) Reconstruction of a different PN showing position of 2P linescan (white arrows) and the micropipette (green) positioned in the granular layer (approx. 50 μm below and lateral to the PN soma) used for electrical stimulation and pharmacological manipulation. (f) Single linescan recordings of simultaneous dendritic voltage (red channel) and calcium (green channel) from the PN shown in (d). (g) Spatial average of linescan recordings in (f) showing dendritic voltage (red trace) and calcium (green trace); black overlay shows voltage trace, with spikelets removed and 10 ms boxcar filtering. Simultaneous extracellular somatic recording (black trace) and corresponding binary sequence below show somatic simple spikes (SS; black bars) and complex spikes (CS; red bars). Dendritic calcium spikes are clearly visible in both voltage and calcium traces. Dendritic complex spikes (DCSs) are indicated by filled black triangles and dendritic spikes (DSs) are indicated by open triangles. (h) Averages of 32 DCS signals (left) and 25 DS signals (right), from 7 PNs, showing dendritic voltage (red), dendritic calcium (green), and extracellular somatic recording (black). (i) Average PN dendritic voltage (red) and calcium (green) in response to weak electrical stimulation (10 negative current pulses, 30 mA, 1 ms duration, at 100 Hz, schematically indicated) in the granule cell (GC) layer (26 averages, 7 PNs). (j) Average PN dendritic voltage (red) and calcium (green) in response to strong electrical stimulation (10 negative current pulses, 300 mA, 1 ms duration, at 100 Hz, schematically indicated) in the GC layer (26 averages, 7 PNs). Faint red and green traces show voltage (red) and calcium (green) in response to strong electrical stimulation, after CNQX (100 μM) application (15 averages, 1 PN). (k) An example of how PF input (here evoked by strong electrical stimulation in the GC layer) following a spontaneous climbing fiber (CF) event (DCS) can generate additional DS events and result in a supralinear dendritic calcium signal. The time interval between the spontaneous DCS and first evoked DS (DCS–DS) is indicated. Note the different scale bars compared to (i and j).
Figure 1—figure supplement 1
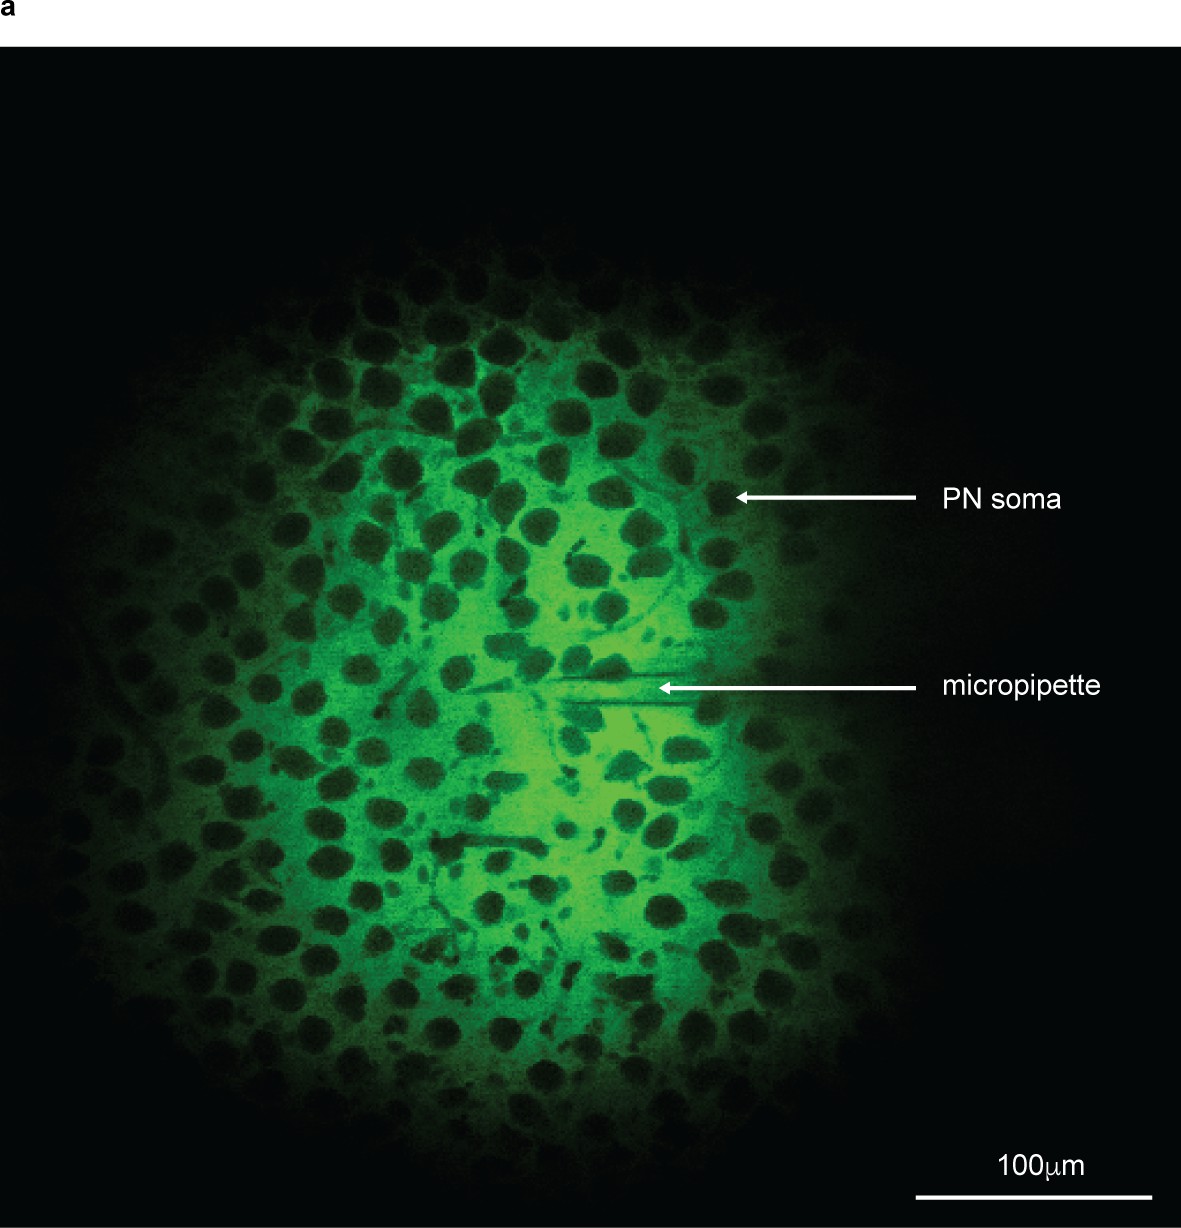
Micropipette injection into cerebellar granule cell (GC) layer guided by two-photon microscopy.
(a) For an estimate of the spatial extent of drug delivery into the cerebellar vermis, 50 μM Fluorescein–5–isothiocyanate (FITC) dissolved in saline was delivered using the same injection parameters used for drug injection into the GC layer, and the injection was monitored using two-photon microscopy, showing a relatively localized (250–500 µm3) injection region. Purkinje neuron (PN) soma (seen as shadows) and the position of the micropipette are indicated.
Figure 2 with 8 supplements
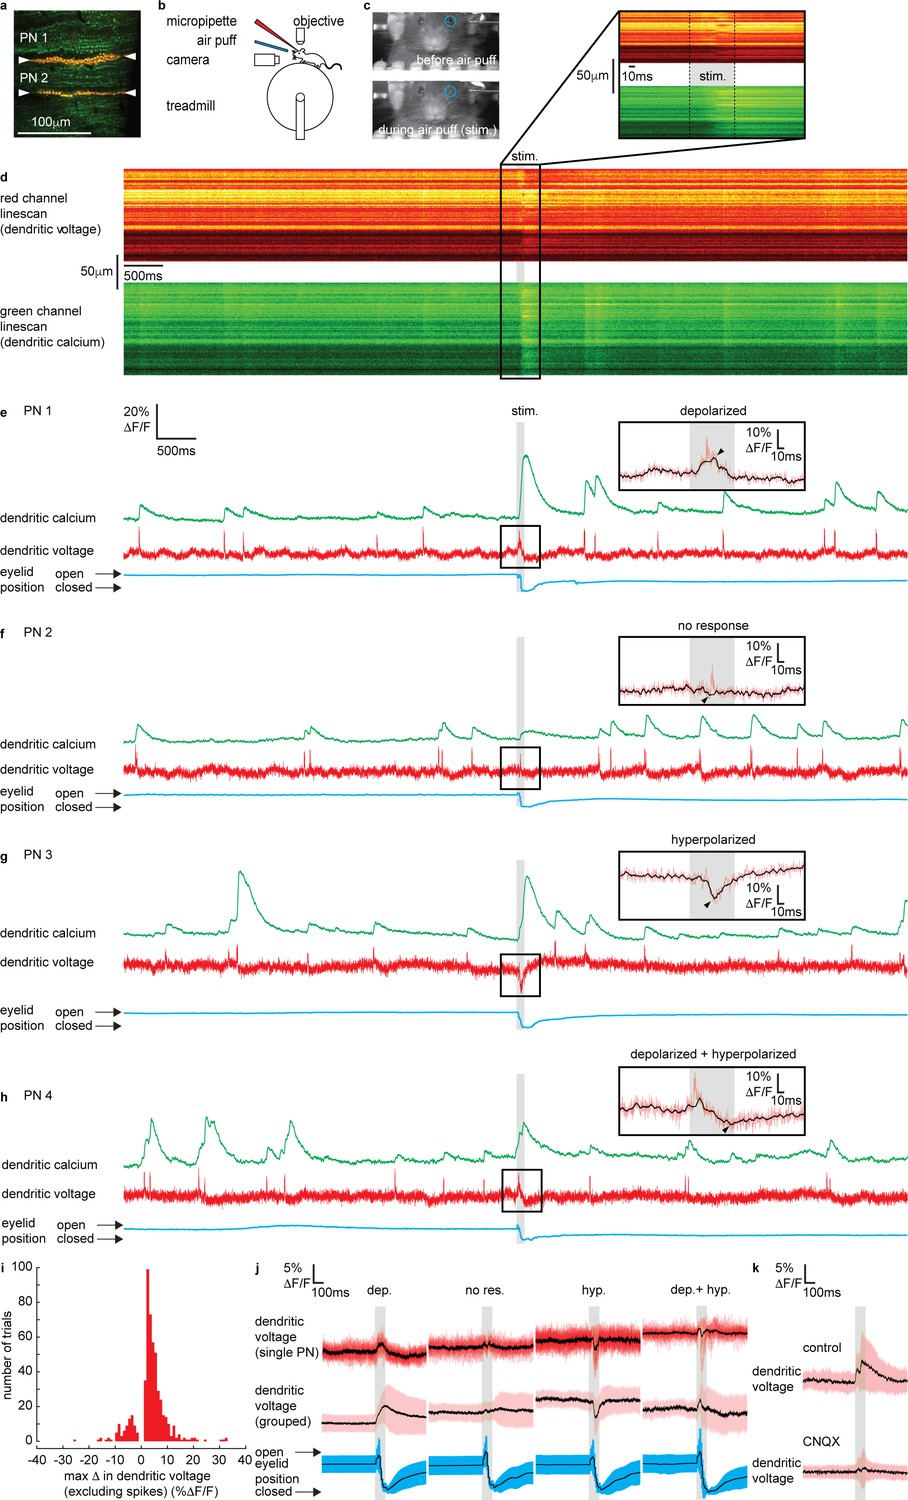
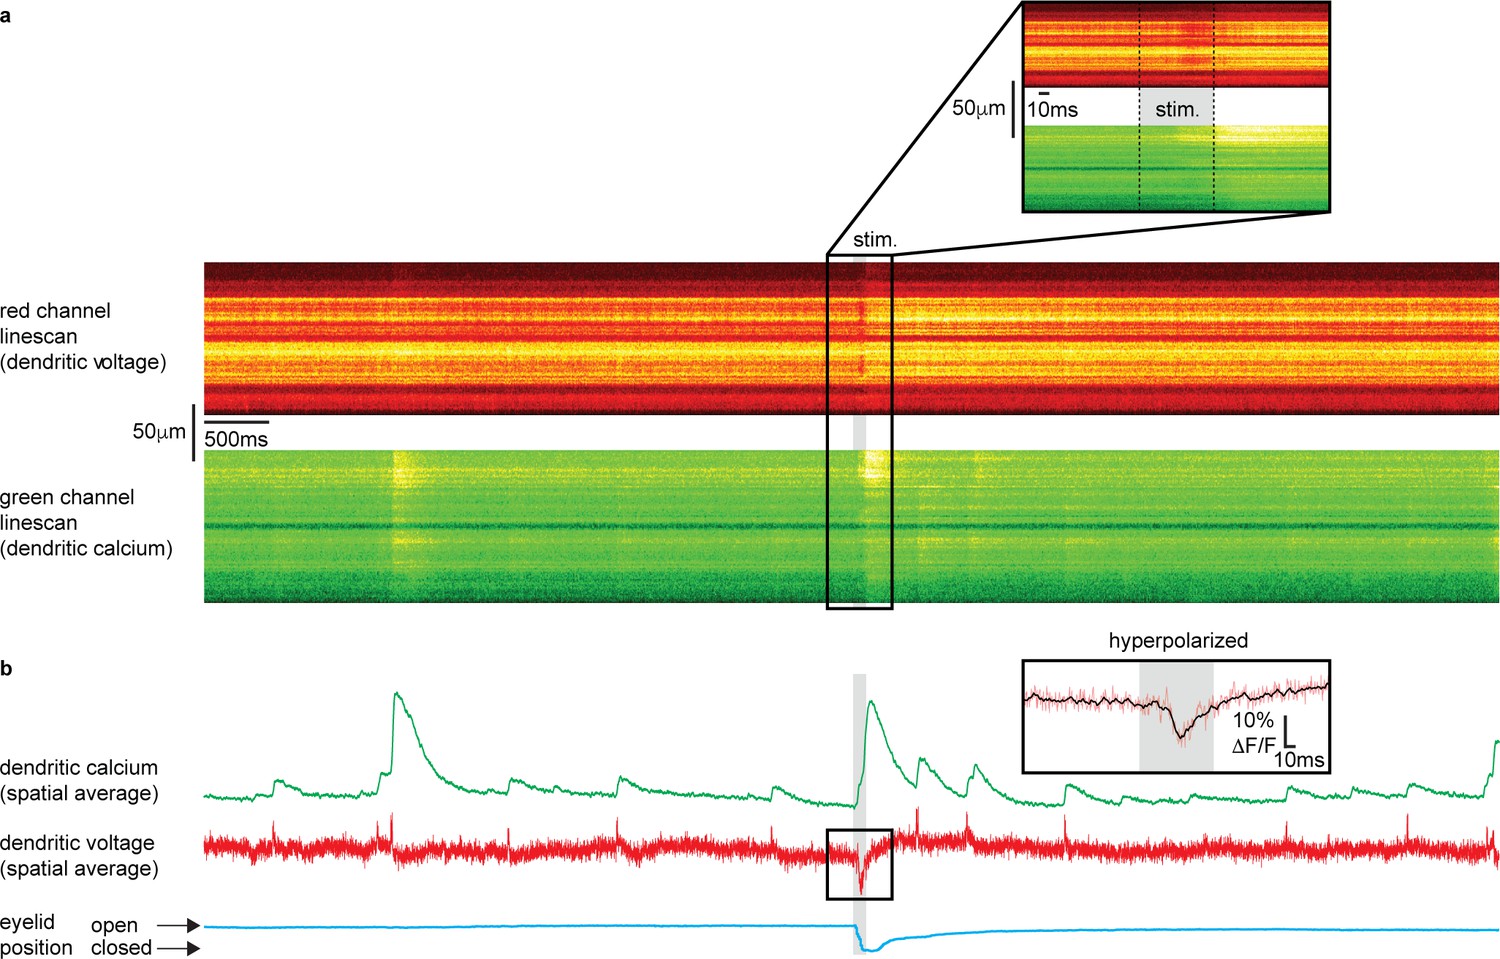
Sensory stimulation evokes graded depolarizing and hyperpolarizing signals and calcium signals in Purkinje neuron (PN) dendrites.
(a) 2P image of the spiny dendrites of two PNs (PN1 and PN2) labeled with voltage sensitive dye ANNINE-6plus (red) and genetically encoded calcium indicator GCaMP6f (green), resulting in double labeling (yellow). (b) Sketch of the setup with a mouse mounted on a treadmill under a 2P microscope for imaging in the cerebellar vermis. A micropipette was used for drug delivery. A glass capillary was used to deliver a 100 ms air puff directed toward the ipsilateral eye. (c) A camera was used to monitor mouse movements and record eye responses during the air puff. Blue circles show regions of interest (ROIs) used to record eyelid movement. (d) Single linescan recordings of simultaneous dendritic voltage (red channel) and calcium (green channel) from the PN1 shown in (a). (e–h) Single trial recordings of simultaneous dendritic voltage (red traces) and calcium (green traces). DCS and DS events are visible in both voltage and calcium traces. Blue traces show average intensity of ROI used to record eye responses. Gray bars show full duration of air puff stimulus. Note that PN1 (e) and PN2 (f) recordings are from two PNs in the same mouse, shown in (a). The calcium recording from PN1 (e) shows a dramatically enhanced evoked calcium signal during the air puff while the calcium recording from PN2 (f) does not. Insets show zoomed voltage traces during the sensory stimulus. The voltage recording in PN1 inset shows depolarizing voltage signal, during the air puff (small black arrows indicate max Δ in dendritic voltage, and black trace; 10 ms boxcar filtered voltage recording), while the voltage recording from PN2 shows no underlying depolarizing signal. (i) Histogram for max Δ in dendritic voltage during the sensory stimulus using 1% ΔF/F bins for all recording trials, n = 696, 54 PNs. (j) Dendritic voltage signals during the sensory stimulus sorted into response groups, showing single trial recordings from a single PN (top traces; black trace shows mean, colored traces show single trials) and averages from all recordings in each group (middle traces; black trace shows mean, colored trace shows SD) and corresponding eyelid responses (bottom traces; black trace shows mean, colored trace shows SD). (k) Dendritic voltage signals during the sensory stimulus under control conditions (top; black trace shows mean, colored trace shows SD, n = 46 trials, 5 PNs) and after CNQX application (bottom; black trace shows mean, colored trace shows SD, n = 37 trials, 5 PNs).
Figure 2—figure supplement 1

No difference in dendritic voltage signaling or time to eyelid closure between first and last recordings.
(a) Single trial recordings of simultaneous dendritic voltage (red traces) and calcium (green traces) during sensory stimulation (stim.). DCSs, DSs and corresponding calcium signals are visible in both voltage and calcium traces. Blue traces show average intensity of region of interest (ROI) used to record eyelid position (eyeblink responses). Insets show zoomed voltage traces during air puff stimulus. Gray bars show full duration of air puff stimulus. Top example shows voltage and calcium during first recording (rec.) and bottom example shows last (10th) recording from the same Purkinje neuron (PN). (b) Mean eye responses from first (top; n = 49) and last (bottom; n = 49) recordings (black trace shows mean; blue trace shows SD). (c) Time for eyelid to close after stimulus onset for first (red) and last (gray) recording groups. There was no significant difference in eyelid closure time between first (136 ± 47 ms, mean ± SD) and last (138 ± 50 ms, mean ± SD) groups, p=0.97, Wilcoxon signed rank test, 49 pairs from 49 PNs. (d) Maximum change in dendritic voltage measured during the stimulus from first and last recordings. Stimulus-evoked dendritic voltage signals from first (6.8 ± 4.3% ΔF/F, mean ± SD) and last (6.6 ± 5.3 mean± SD) recording groups were not significantly different, p=0.886, unpaired t-test, 49 pairs from 49 PNs. Probability distributions for DCS and DS events during pre-stimulus (e) and stimulus (f) time windows, sorted into first and last recording groups (as in [c] and [d]). There were no significant differences in probability distributions between first and last recording groups, during both pre-stimulus and stimulus time windows, Kolmogorov–Smirnov, p>0.95, 49 pairs from 49 PNs. Vertical bars in probability distributions show bootstrapped SD.
Figure 2—figure supplement 2
Dendritic voltage signals are time locked to sensory stimuli and not voluntary eye blinks.
(a) Single trial recordings of simultaneous dendritic voltage (red trace) and calcium (green trace) during sensory stimulation (stim.). DCSs, DSs and corresponding calcium signals are visible in both voltage and calcium traces. Blue traces show average intensity of region of interest (ROI) used to record eyelid position (eyeblink responses). Inset shows zoomed voltage trace during air puff stimulus. Gray bar shows full duration of air puff stimulus. Small black arrows indicate ‘voluntary’ eye blinks occurring >1 s after stimulus ends. For comparison only the recordings containing both evoked and voluntary eye blinks were selected (n = 75, 24 Purkinje neuron [PNs]). (b) Mean eye responses from evoked (top) and voluntary (bottom) eye blinks aligned to full eyelid closure (dashed black line) (black trace shows mean; blue trace shows SD). (c) Maximum change in dendritic voltage in a 200 ms window preceding full eyelid closure during evoked and voluntary eye blinks. Stimulus-evoked dendritic voltage signals were significantly larger during evoked eyeblinks; control (6.7 ± 5.0% ΔF/F, mean ± SD, n = 75), compared to voluntary eyeblinks (3.7 ± 2.4% ΔF/F, mean ± SD, n = 109), unpaired t-test, p=1.1 × 10⁻⁷, n = 75, 24 PNs. Probability distributions for DCS and DS events during a pre-stimulus (d) and stimulus (e) time window, for evoked and voluntary eyeblinks. Pre-stimulus time windows are defined here as a 200 ms window, beginning 500 ms before eye closure. Stimulus time windows are defined here as a 200 ms window immediately preceding eyelid closure. There was no difference between evoked and voluntary eyeblink probability distributions during pre-stimulus time windows (pre-stimulus, p=0.98). During stimulus time windows the evoked eyeblink probability distribution was shifted toward a higher probability of DCS and DS events compared to voluntary eyeblinks (stimulus, p=2.17 × 10⁻⁹). Kolmogorov–Smirnov, n = 75, 24 PNs. Vertical bars in probability distributions show bootstrapped SD. *** indicate p<0.001.
Figure 2—figure supplement 3
Example linescan showing evoked hyperpolarizing voltage signal during a sensory stimulus.
(a) Single linescan recordings of simultaneous dendritic voltage (red channel) and calcium (green channel). (b) Corresponding spatially averaged recordings of simultaneous dendritic voltage (red traces) and calcium (green traces). Note that the average voltage and calcium signals are deflected in opposite directions in this example. Dendritic spikes and corresponding calcium signals are visible in voltage and calcium traces. Blue traces show average intensity of region of interest (ROI) used to record eye responses. Inset shows zoomed voltage trace during air puff stimulus. Black overlay in inset shows voltage trace, with spikelets removed and 10 ms boxcar smoothing. Gray bars show full duration of air puff stimulus.
Figure 2—figure supplement 4
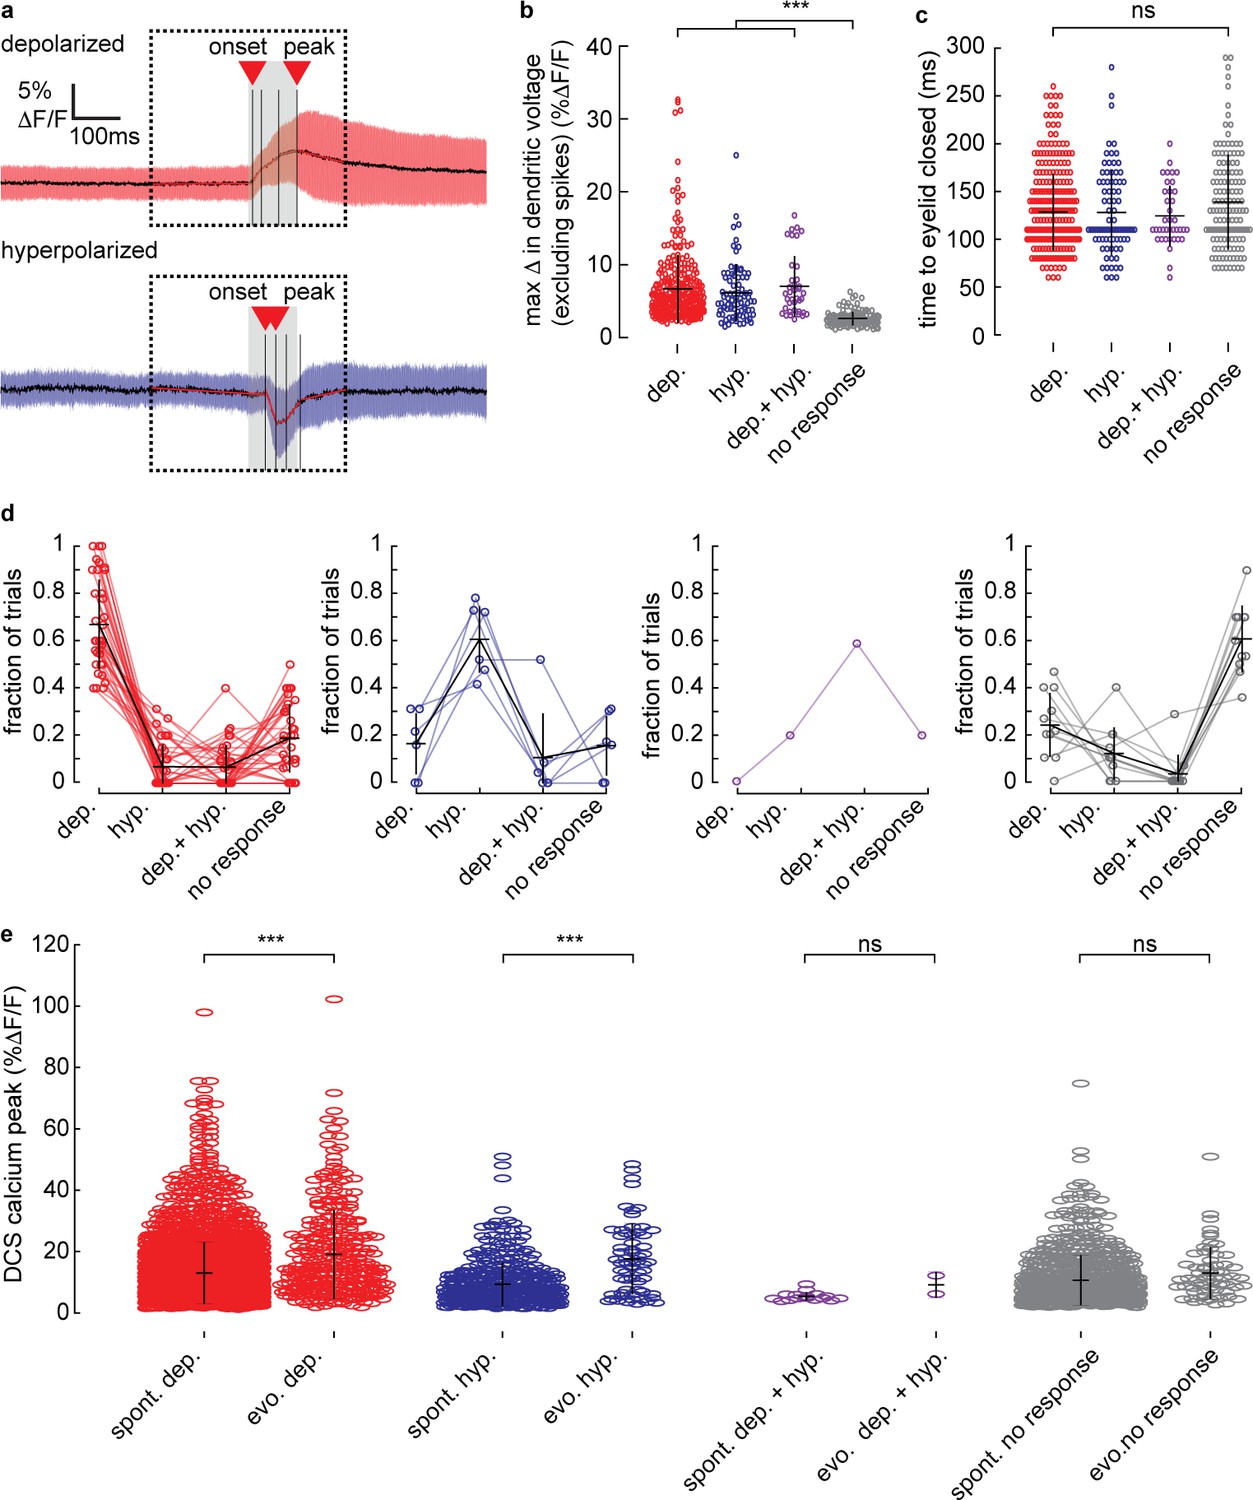
Sensory stimulus-evoked dendritic voltage signals and their relationship with eyelid closure time and climbing fiber (CF)-evoked dendritic calcium signals.
Single trial dendritic voltage recordings were sorted based on the dendritic voltage response during the stimulus into the following groups: depolarized (‘dep.’), hyperpolarized (‘hyp.’), depolarized + hyperpolarized (‘dep. + hyp.’), and ‘no response’, by removing spikelets from the voltage recording, binning in 10 ms epochs, and thresholding at ±2 times standard deviations. (a) Estimates for onset time and peak (shown by red triangles) in depolarizing (top) and hyperpolarizing (bottom) signals were calculated by minimizing the sum of residual (squared) error within four regions of the signal (shown by black bars) and fitting a linear regression within each region (red lines). (b) Maximum change in dendritic voltage (excluding spikes) measured during the stimulus for all recordings in each response group. (c) Time for eyelid to close after stimulus onset for each response group. (d) Fraction of recordings resulting in each response type; depolarized (‘dep.’), hyperpolarized (‘hyp.’), depolarized + hyperpolarized (‘dep. + hyp.’) and ‘no response’ for individual Purkinje neurons (PNs). PNs are grouped here based on their most frequent response type; depolarized (red, 36/54 PNs); hyperpolarized (blue, 6/54 PNs); depolarized + hyperpolarized (purple, 1/54 PN); no response (gray, 11/54 PNs), bars show mean ± SD for all PNs in each group. (e) Peak in dendritic calcium for all CF-evoked (DCS) calcium signals from PNs in each voltage response group. Calcium signals were classed as ‘spontaneous’ (spont.) if they occur before the stimulus or ‘evoked’ (evo.) if they occur during the stimulus. Horizontal and vertical bars show mean ± SD respectively. ANOVA, *** indicate p<0.001.
Figure 2—figure supplement 5
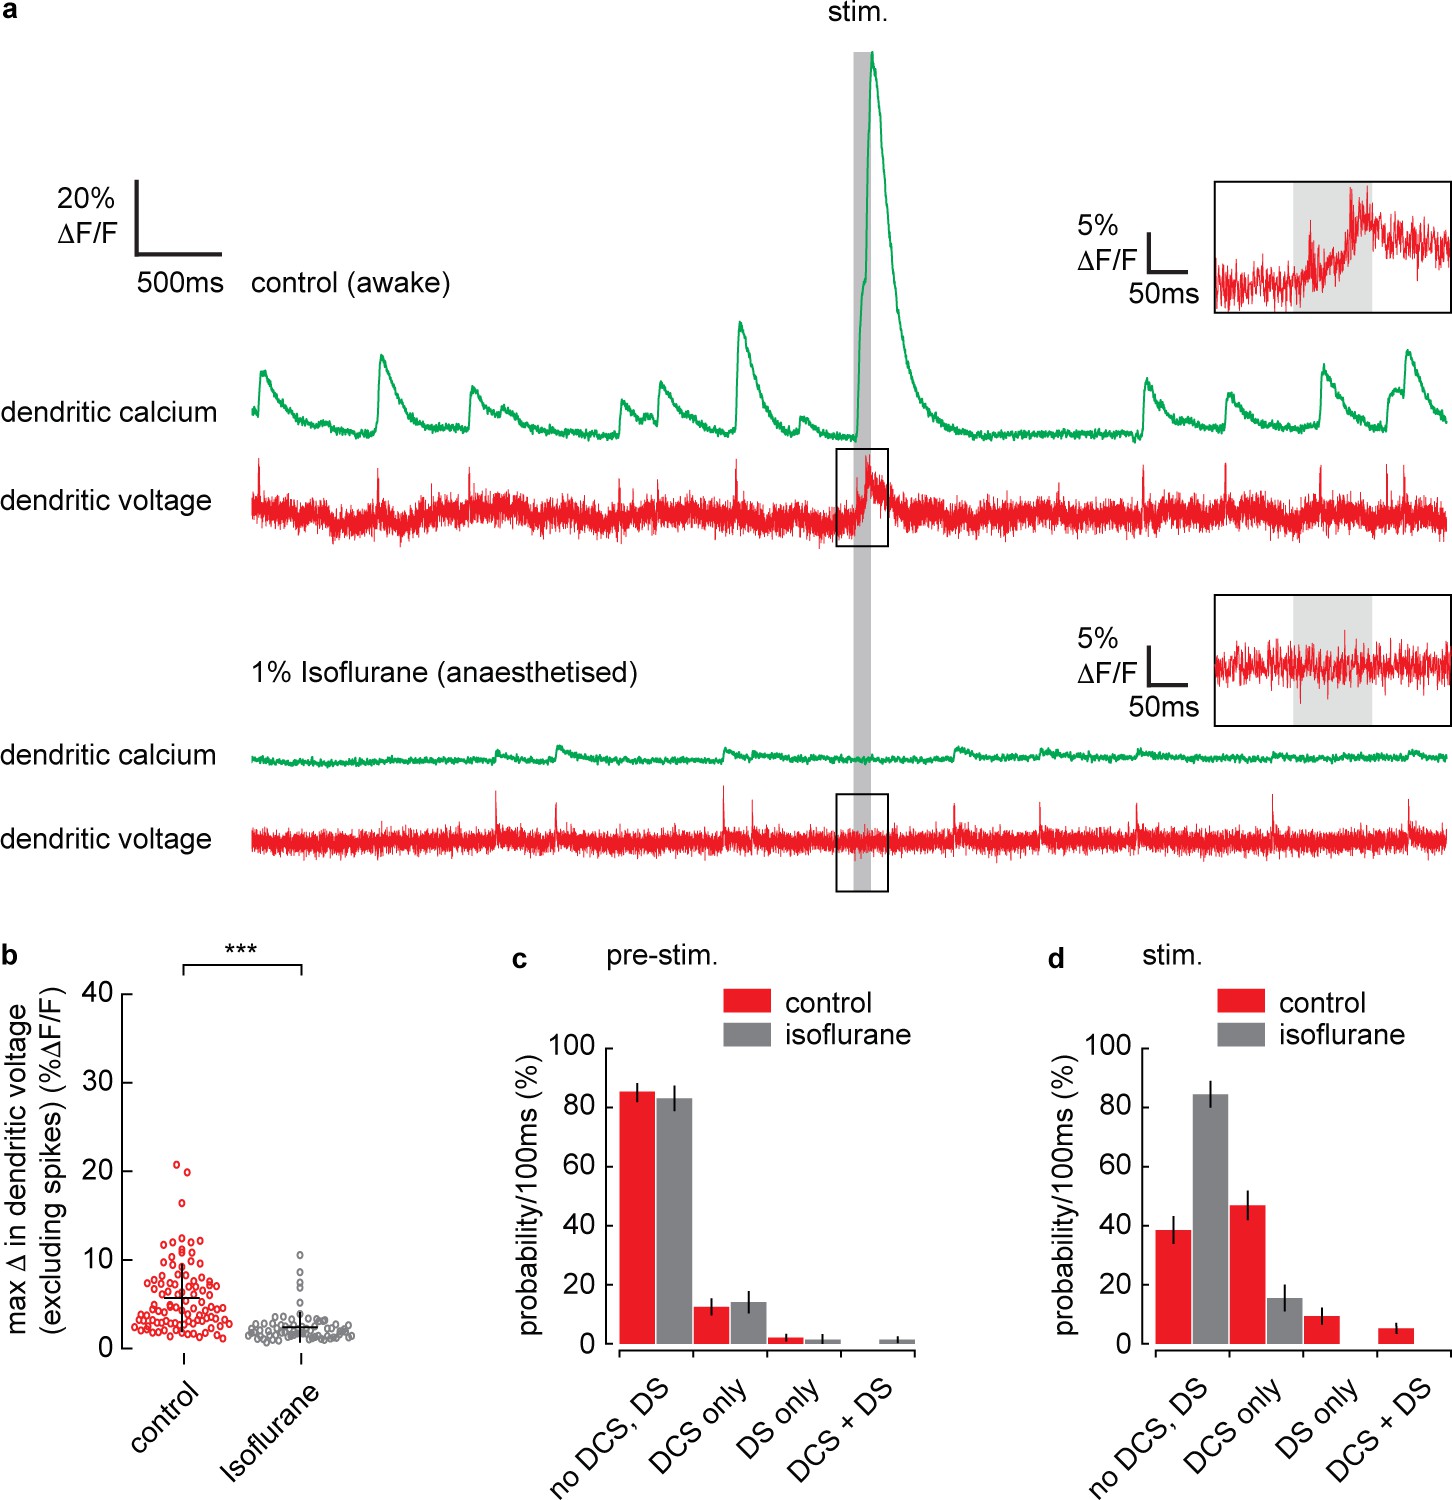
Isoflurane induced anesthesia blocks stimulus-evoked dendritic voltage and calcium signaling.
(a) Single trial recordings of simultaneous dendritic voltage (red traces) and calcium (green traces) during sensory stimulation (stim.). DCSs, DSs and corresponding calcium signals are visible in both voltage and calcium traces. Insets show zoomed voltage traces during air puff stimulus. Gray bars show full duration of air puff stimulus. Top example shows voltage and calcium recordings during control (awake) conditions and bottom example shows recordings during anesthesia (1% isoflurane) from the same Purkinje neuron (PN). (b) Maximum change in dendritic voltage (excluding spikes) measured within a 200 ms window after stimulus onset under control (red) and Isoflurane (gray) conditions. Stimulus-evoked voltage signals were significantly reduced during anesthesia; control (5.7 ± 3.9% ΔF/F, mean ± SD, n = 96) and isoflurane (2.4 ± 1.7% ΔF/F, mean ± SD, n = 71), unpaired t-test, p=2.4 × 10⁻¹⁰, n = 167, 6 PNs. Probability distributions for DCS and DS events during (c) pre-stimulus and (d) stimulus time windows, under control and Isoflurane conditions. Probability distributions during pre-stimulus time windows were unaltered by isoflurane; (pre-stimulus, p=1.0). Probability distributions during stimulus time windows were shifted toward a higher probability of ‘no DCS, DS’ signals during Isoflurane anesthesia (stimulus; p=3.1 × 10⁻⁸). Unlike in awake conditions, during anesthesia there was no difference between pre-stimulus and stimulus probability distributions (p=1.0). Kolmogorov–Smirnov, n = 167, 6 PNs. Vertical bars in probability distributions show bootstrapped SD. *** indicate p<0.001.
Figure 2—figure supplement 6
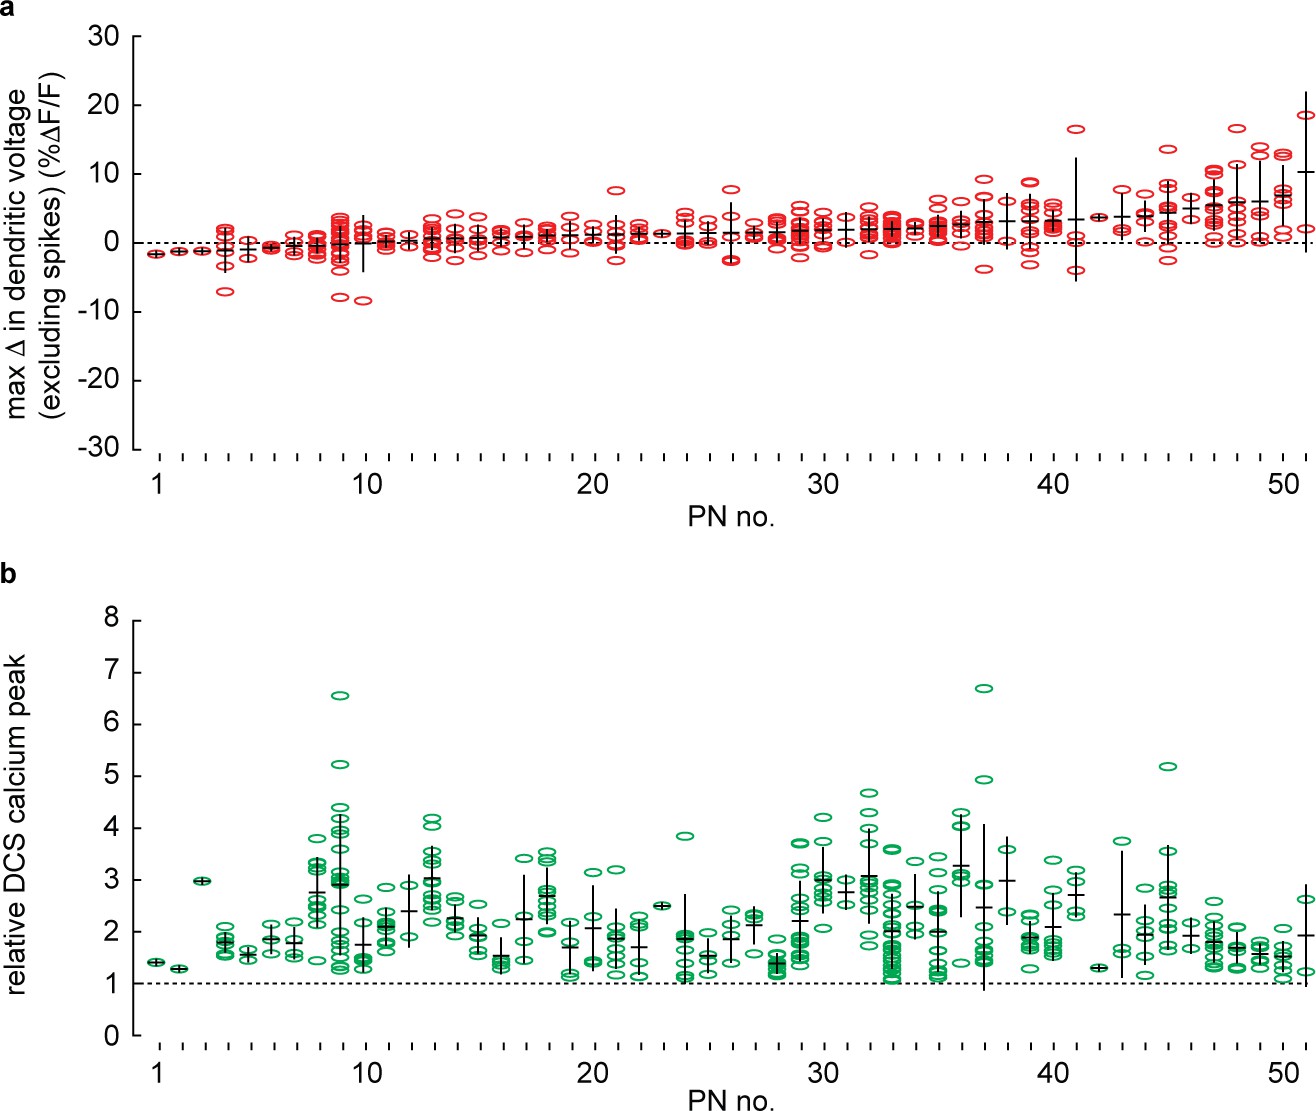
During sensory stimulation the average maximum change in dendritic voltage in our sampling of lateral lobule V is positive and dendritic calcium signals are enhanced.
(a) Maximum change in dendritic voltage (excluding spikes) during sensory stimulation measured from all recordings in which evoked dendritic complex spike (DCS) signals occur, n = 365, 51 Purkinje neurons (PNs; sorted in ascending order based on average for each PN); group average; 2.0 ± 2.3% ΔF/F, is significantly above baseline (dashed line), p=2.0 × 10⁻⁷, t-test. (b) Stimulus-evoked DCS associated calcium signals, relative to the average non-evoked DCS calcium signal for each PN, n = 365, 51 PNs, using the same sorting as in (a), group average (1.4 ± 0.6) is significantly above baseline (dashed line), p=1.5 × 10⁻⁵, t-test. Horizontal and vertical bars show mean ± SD respectively.
Figure 2—figure supplement 7
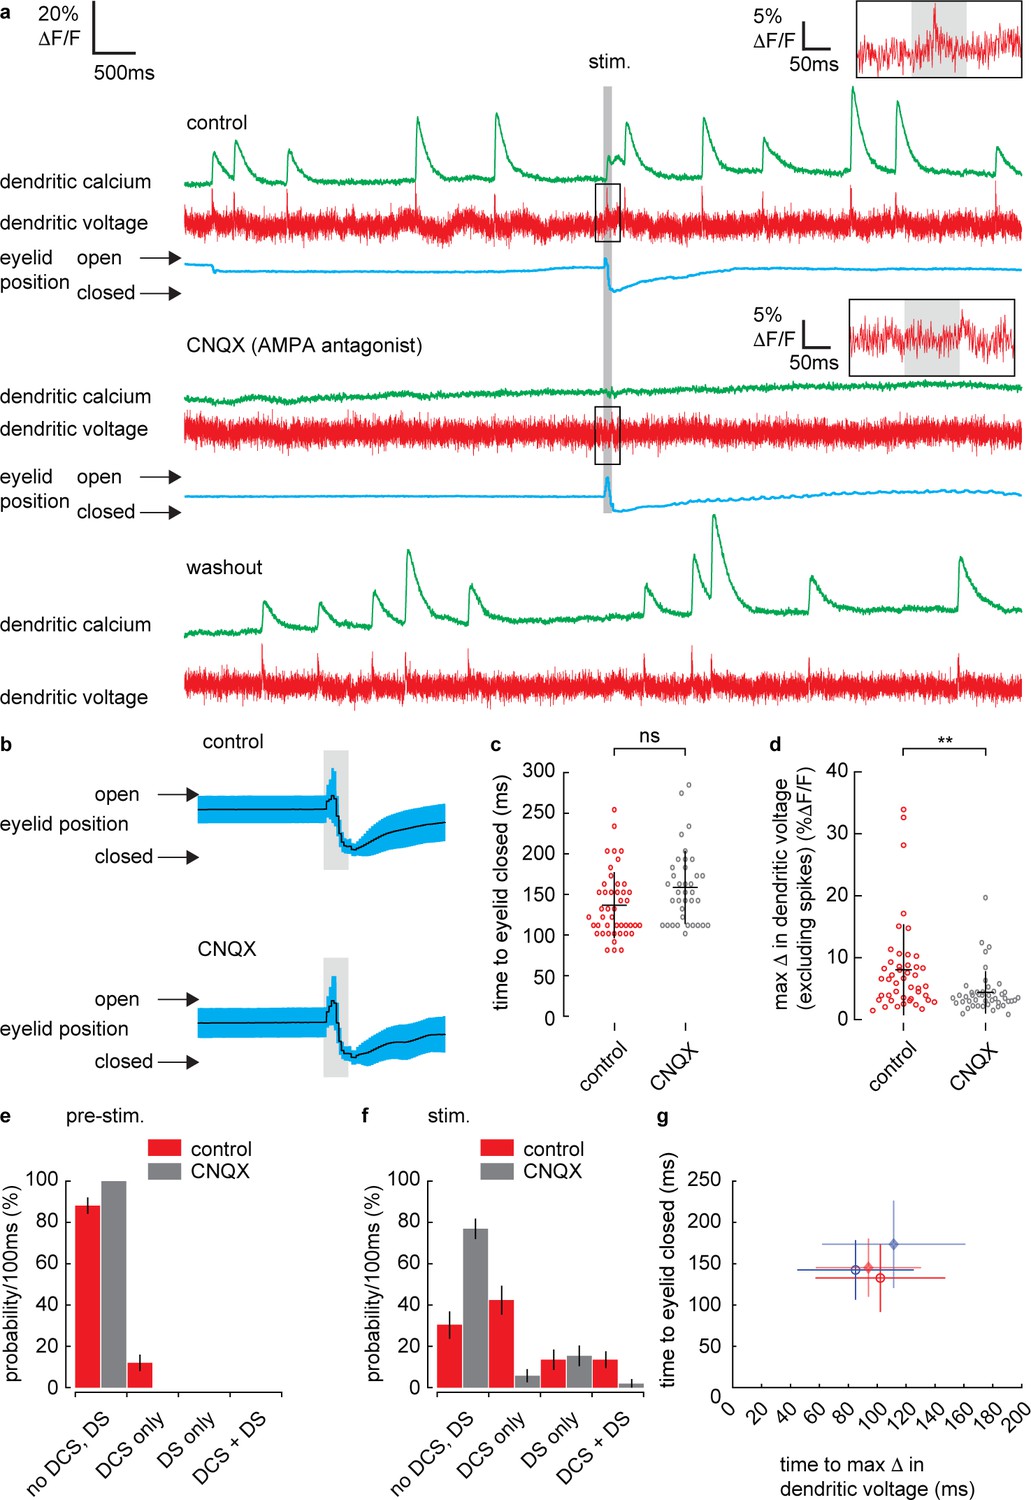
AMPA receptor antagonist, CNQX, blocks stimulus-evoked dendritic voltage and calcium signaling.
(a) Single trial recordings of simultaneous dendritic voltage (red traces) and calcium (green traces) during sensory stimulation (stim.). Blue traces show average intensity of region of interest (ROI) used to record eyelid position (eyeblink responses). Insets show zoomed voltage traces during air puff stimulus. Gray bars show full duration of air puff stimulus. Top example shows voltage and calcium recordings during control conditions. Middle example shows recordings following CNQX application from the same Purkinje neuron (PN). Bottom example shows recordings from the same PN on the day following drug application, confirming washout of CNQX, in this case no sensory stimulation was given. (b) Mean eye responses from control (top; n = 45, 5 PNs) and CNQX (bottom; n = 37, 5 PNs) recordings (black trace shows mean; blue trace shows SD). (c) Time for eyelid to close after stimulus onset under control (red) and CNQX (gray) conditions. (d) Maximum change in dendritic voltage (excluding spikes) measured within a 200 ms window after stimulus onset under control and CNQX conditions. CNQX blocked voltage signals and dendritic spikes (DCS and DS). Probability distributions for DCS and DS events during pre-stimulus (e) and stimulus (f) time windows, under control and CNQX conditions. There were no DCSs or DSs detected during the pre-stimulus time window following CNQX application, and probability distributions were shifted toward a higher probability of ‘no-signal’ following CNQX application during the stimulus time window, Kolmogorov–Smirnov, p=1.6 × 10⁻⁵, n = 91, 5 PNs. Vertical bars in probability distributions show bootstrapped SD. ** indicates p<0.01. (g) Relationship between the time of maximum change in dendritic voltage (depolarizing; red, or hyperpolarizing; blue) after stimulus onset and the time for eyelid closure, under control (open circles, n = 45, 5 PNs) and CNQX conditions (diamonds, n = 37, 5 PNs). Symbols show mean and bars show SD.
Figure 2—figure supplement 8
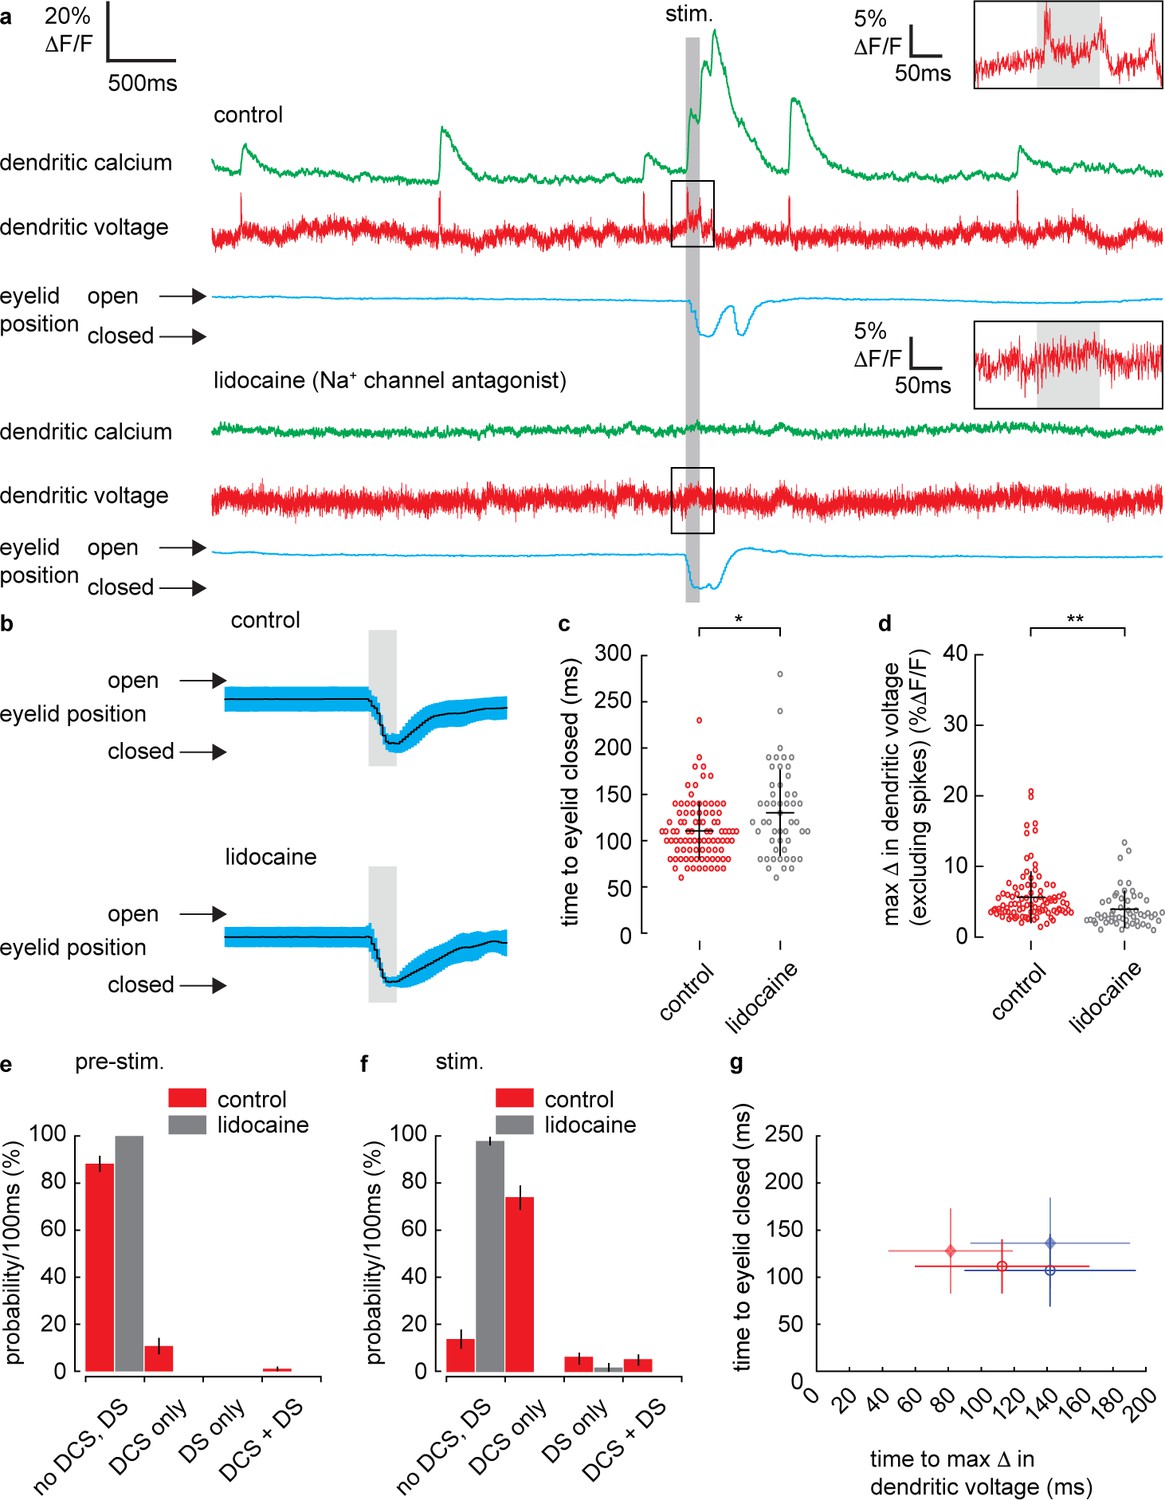
Na+ channel antagonist, Lidocaine, blocks stimulus-evoked dendritic voltage and calcium signaling and slows eyelid closure time.
(a) Single trial recordings of simultaneous dendritic voltage (red traces) and calcium (green traces) during sensory stimulation (stim.). DCSs, DSs and corresponding calcium signals are visible in both voltage and calcium traces. Blue traces show average intensity of region of interest (ROI) used to record eyelid position (eyeblink responses). Insets show zoomed voltage traces during air puff stimulus. Gray bars show full duration of air puff stimulus. Top example shows voltage and calcium during control conditions and bottom example shows recordings following Lidocaine application from the same Purkinje neuron (PN). (b) Mean eye responses from control (top, n = 93) and Lidocaine (bottom, n = 54) recordings (black trace shows mean; blue trace shows SD). (c) Time for eyelid to close after stimulus onset under control (red) and Lidocaine (gray) conditions. There was a small but significant increase in eyelid closure time following Lidocaine application; control (111 ± 31 ms, mean ± SD, n = 90); Lidocaine (131 ± 46 ms, mean ± SD, n = 50), Kolmogorov–Smirnov, p=0.02, n = 140, 6 PNs. (d) Maximum change in dendritic voltage (excluding spikes) measured within a 200 ms window after stimulus onset under control and Lidocaine conditions. Stimulus-evoked dendritic voltage signals were significantly reduced following Lidocaine application; control (5.7 ± 3.7% ΔF/F, mean ± SD, n = 93, 6 PNs) and Lidocaine (3.9 ± 2.7% ΔF/F, mean ± SD, n = 54, 6 PNs), unpaired t-test, p=0.003, n = 147, 6 PNs. Probability distributions for DCS and DS events during pre-stimulus (e) and stimulus (f) time windows, under control and Lidocaine conditions (as in [c] and [d]). There were no DCSs or DSs detected during the pre-stimulus time window following lidocaine application and probability distributions were shifted toward a higher probability of no-signal following Lidocaine application during the stimulus time window, Kolmogorov–Smirnov, p=1.8 × 10⁻²², n = 147, 6 PNs. Vertical bars in probability distributions show bootstrapped SD. * and ** indicate p<0.05 and p<0.01 respectively. (g) Relationship between the time of maximum change in dendritic voltage (depolarizing; red, or hyperpolarizing; blue) after stimulus onset and the time for eyelid closure, under control (open circles, n = 93, 6 PNs) and Lidocaine conditions (diamonds, n = 54, 6 PNs). Symbols show mean and bars show SD.
Figure 3
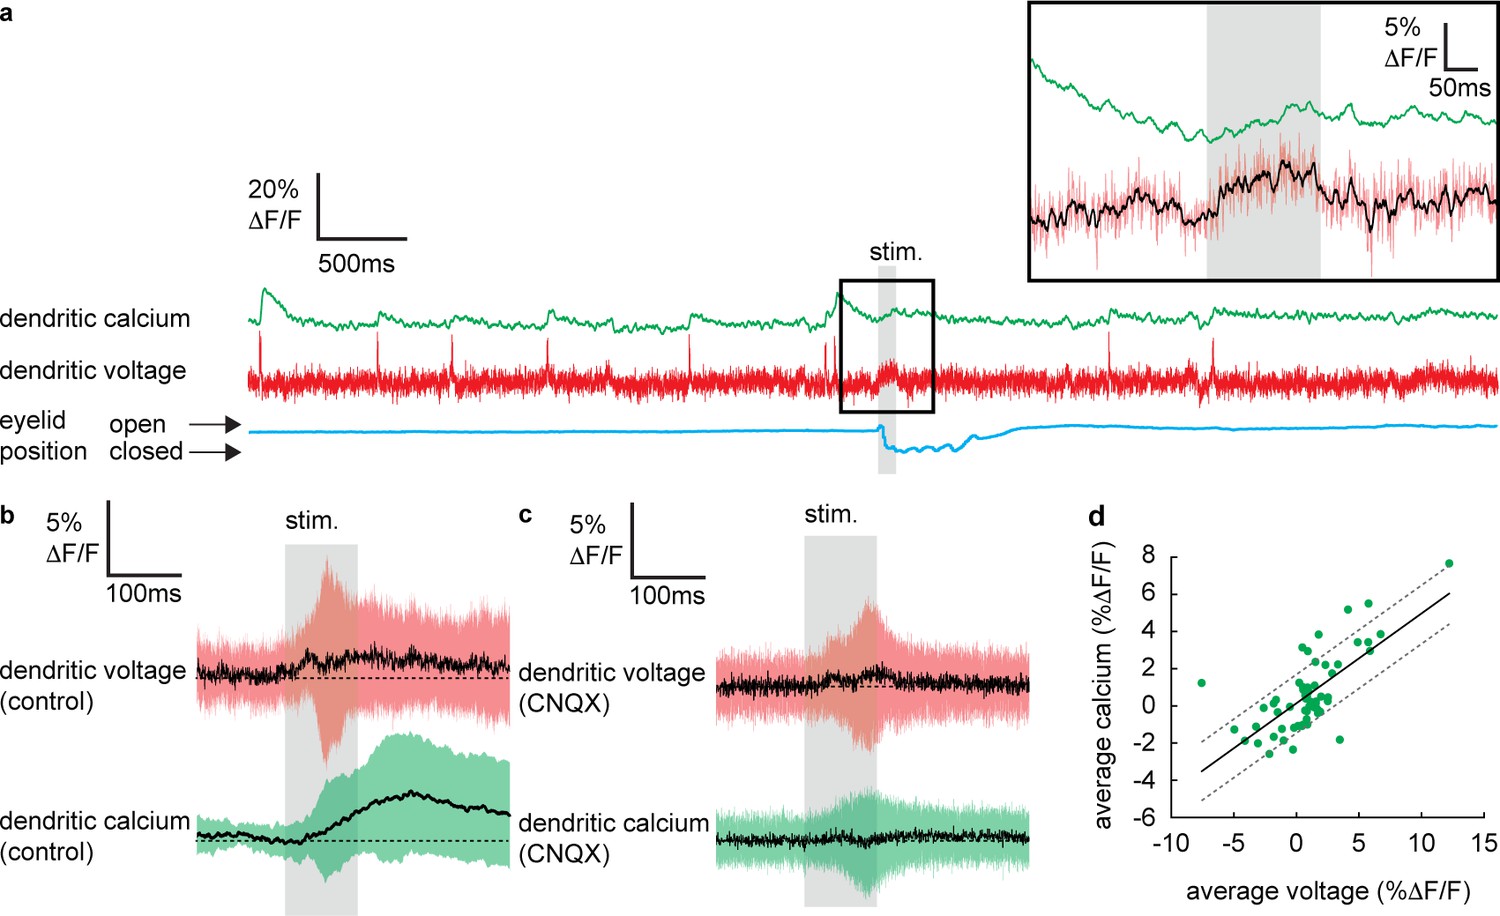
Sensory stimulation evokes graded voltage-dependent dendritic calcium signals in the absence of dendritic complex spikes (DCSs) and dendritic spikes (DS).
(a) Single trial recordings of simultaneous dendritic voltage (red traces) and calcium (green traces). DCS and DS events are visible in both voltage and calcium traces. Blue traces show average intensity of region of interest (ROI) used to record eye responses. Gray bars show full duration of air puff stimulus. Inset shows zoomed voltage traces during the sensory stimulus. The voltage recording in inset shows a depolarizing voltage signal but no DCSs or DSs during the air puff (black trace shows 10 ms boxcar filtered voltage recording). (b and c) Averages of dendritic voltage (red) and calcium (green) during sensory stimulation (only recordings with no dendritic spikelets and both depolarizing and hyperpolarizing signals are included), under control (b) and CNQX (c) conditions; black lines show mean, colored traces show SD. (d) Relationship between average dendritic voltage and calcium during the stimulus, solid line is linear regression (Pearson’s r = 0.71, p=4.51 × 10⁻¹⁰) and dashed lines show 95% confidence intervals.
Figure 4 with 1 supplement
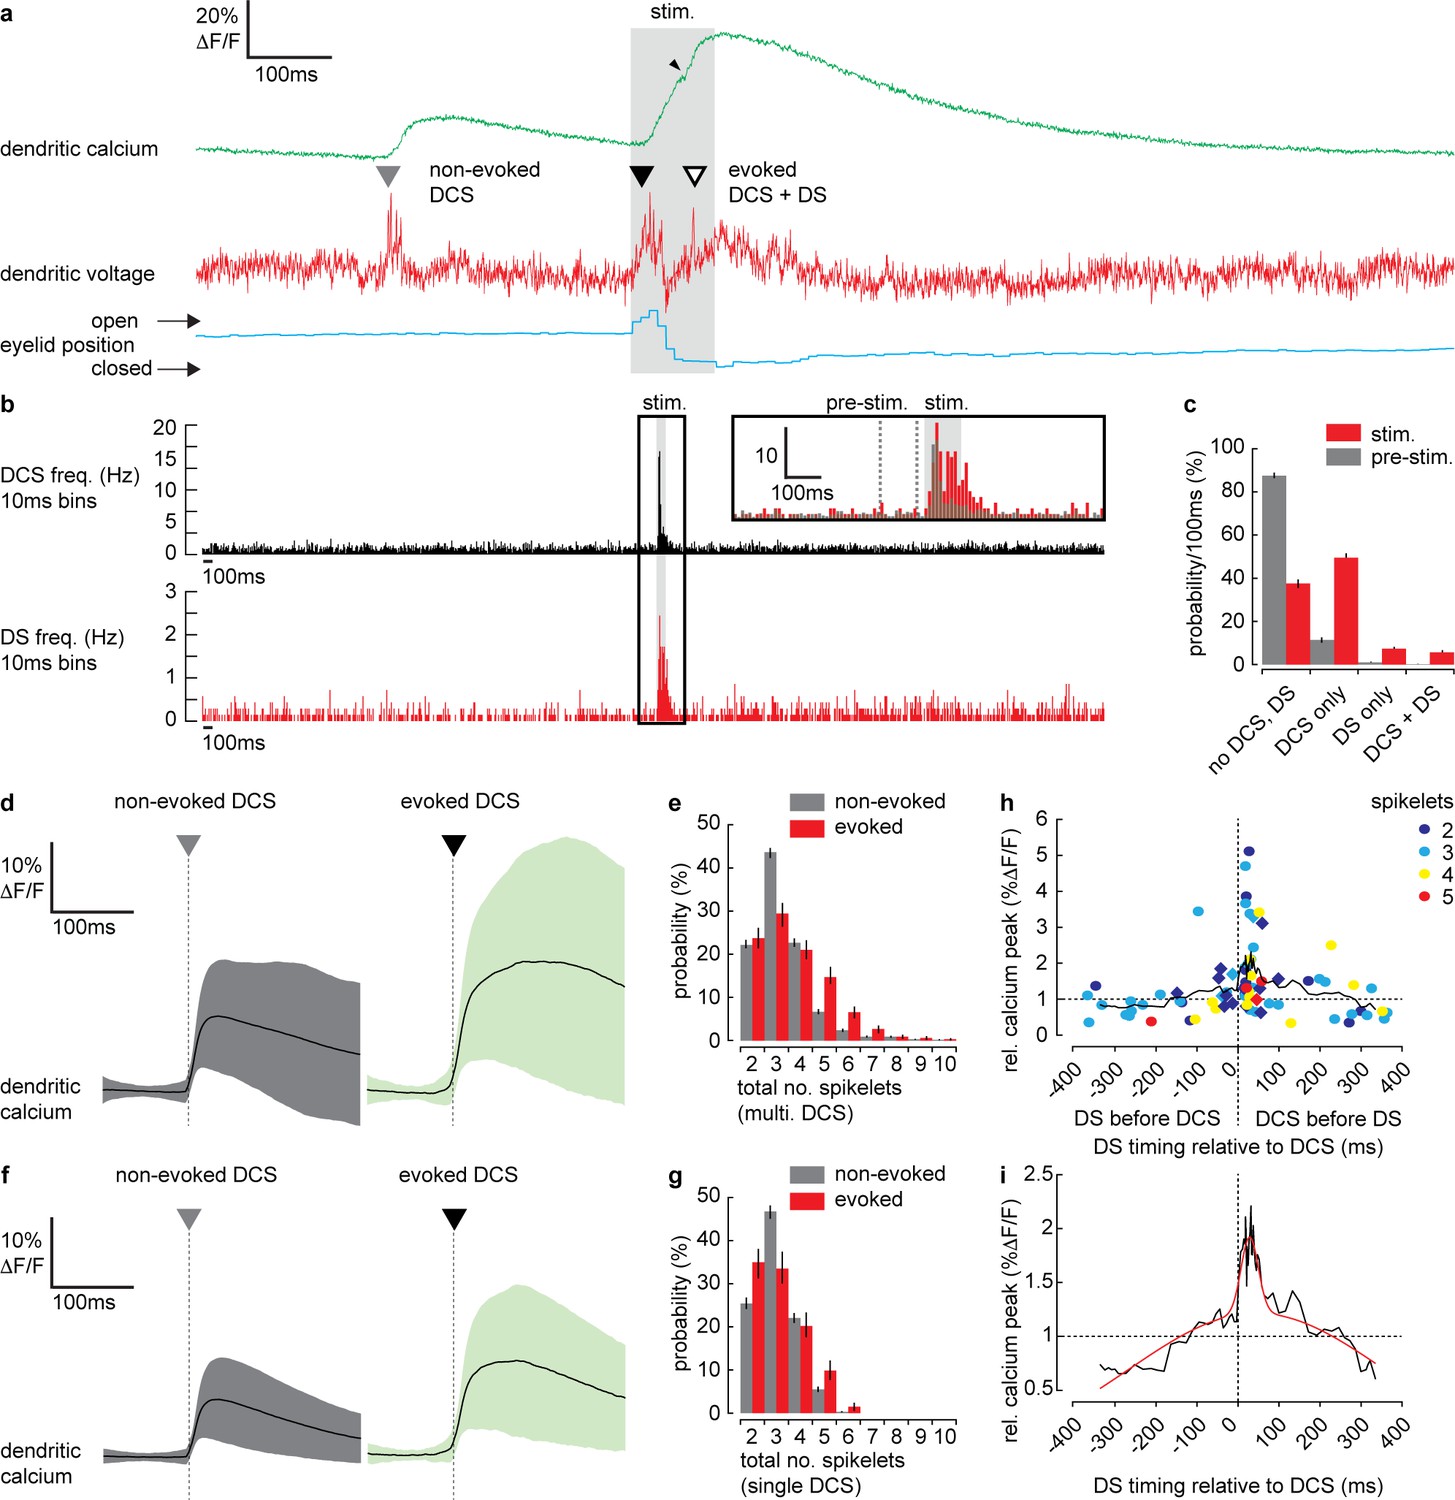
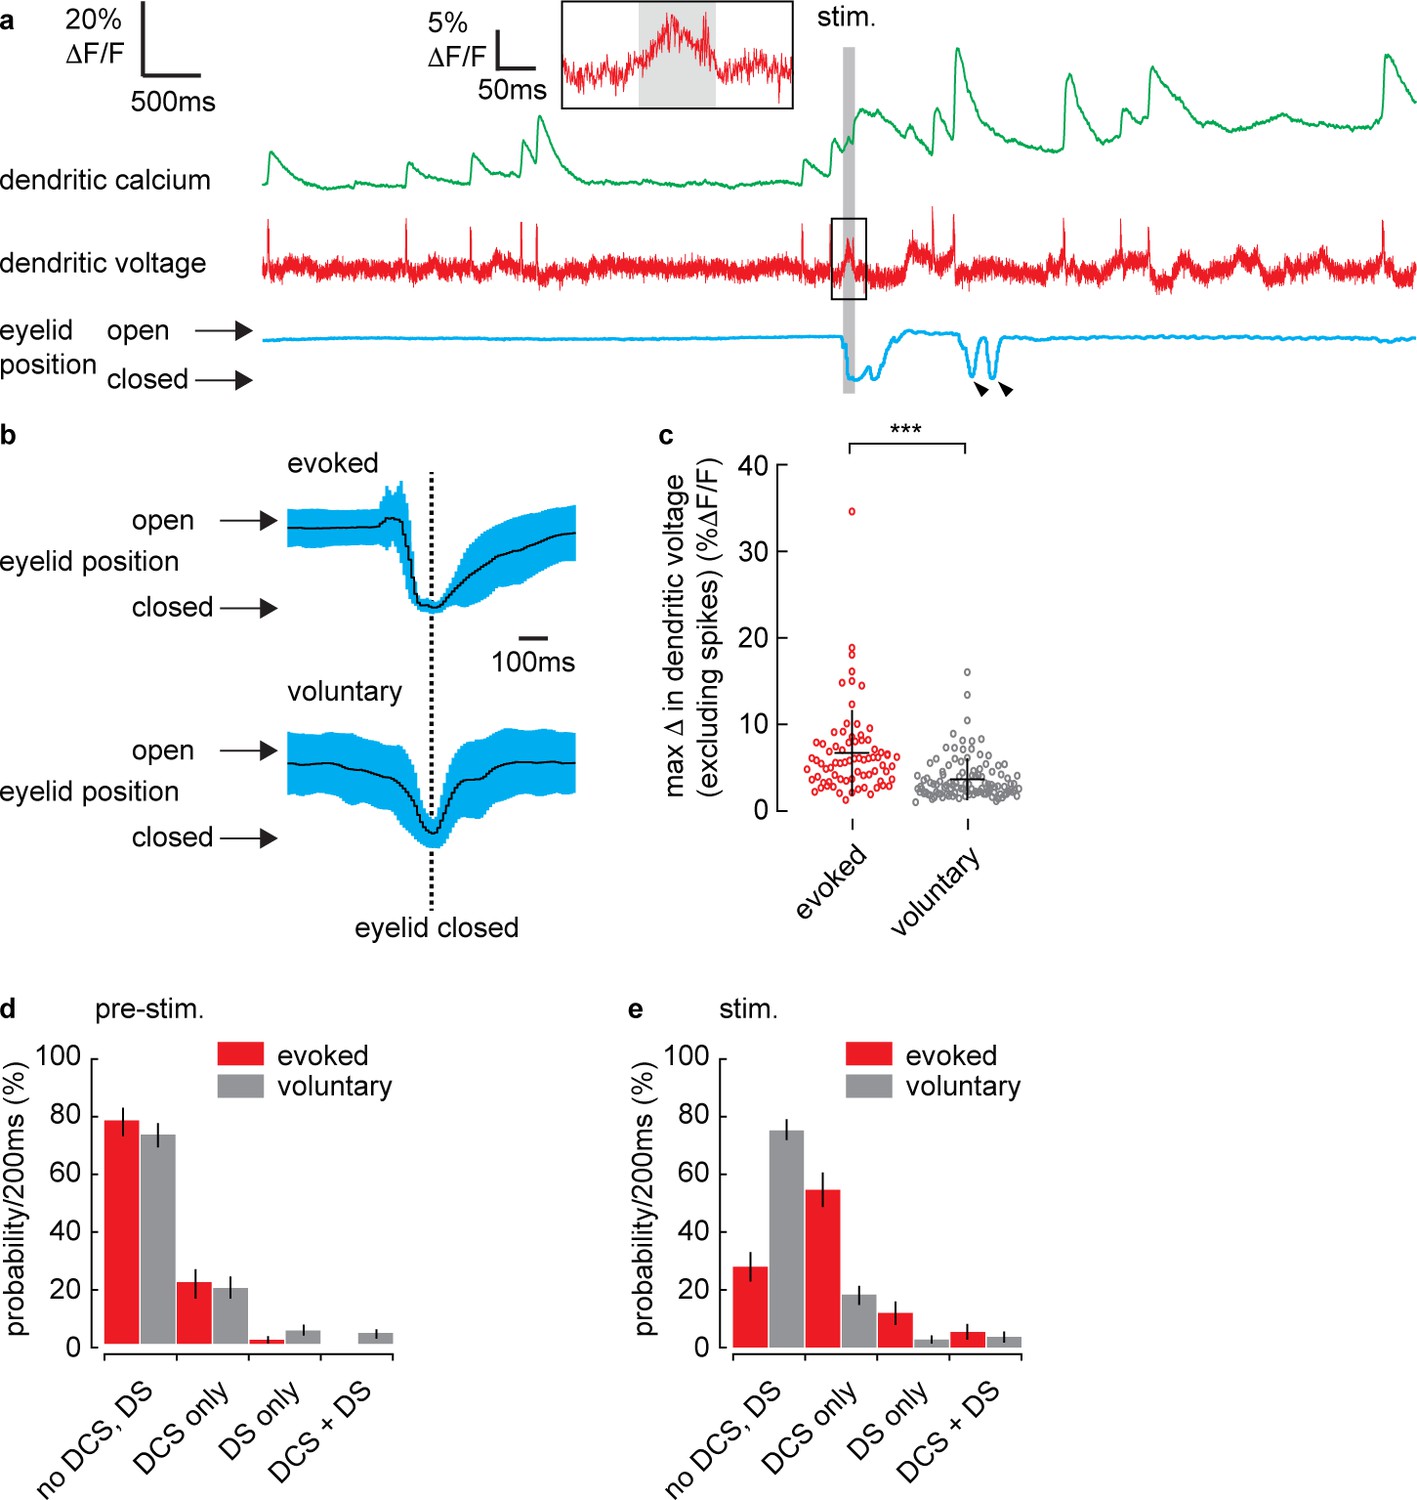
Dendritic complex spikes (DCSs) and dendritic spikes (DSs) triggered by coincident climbing fiber (CF) and parallel fiber (PF) synaptic input evoke supralinear calcium signals during sensory stimulation.
(a) A simultaneous recording of dendritic calcium (green trace) and voltage (red trace) during air puff sensory stimulation, showing dendritic complex spike (DCS; filled triangle) and dendritic spike (DS; open triangle) signals. Signals that occur during the air puff stimulus (stim.) are termed ‘evoked’ (black triangle), otherwise ‘non-evoked’ (gray triangle). Small black arrowhead indicates increase in calcium signal following the DS. Corresponding eyelid response (blue trace) and timing of air puff stimulus (gray bar). (b) PSTH for DCS frequency (top black) and DS frequency (bottom red) using 10 ms bins. Inset shows zoomed overlay of DCS (black) and DS (red) frequencies, relative to their average frequencies. Dashed gray lines indicate the pre-stimulus period (100 ms window prior to air puff onset). (c) Probability distributions for all possible outcomes; ‘no DCS, DS’, ‘DCS only’, ‘DS only’, and paired ‘DCS + DS’, during pre-stimulus and stimulus time windows. (d) Averages of all calcium signals following non-evoked (gray, left) and evoked (green, right) DCS signals. Black trace is mean and colored trace is SD. (e) Probability distributions for the total number of dendritic spikelets detected in a 100 ms window following onset of each non-evoked and evoked DCS signal, including multiple DCS signals. (f) Averages of all calcium signals following non-evoked (gray, left) and evoked (green, right) DCS signals, excluding multiple DCS signals. Black trace is mean and colored trace is SD. (g) Probability distributions for the total number of dendritic spikelets detected in a 100 ms window following onset of each non-evoked and evoked DCS signal, excluding multiple DCS signals. (h) Relationship between DCS + DS pair timing and the corresponding relative calcium peak. Relative calcium peaks were calculated with respect to the average calcium signal of DCS with the same number of spikelets (but with no paired DS signal). Colors represent the number of DCS spikelets for each DCS + DS pair. Data points for evoked DCS + DS pairs are diamonds and non-evoked DCS + DS pairs are circles. Black line shows boxcar average of 10 consecutive data points and (i) two-term Gaussian fit (red line) applied to boxcar average (adjusted r-square = 0.9117). Vertical bars in probability distributions show bootstrapped SD.
Figure 4—figure supplement 1

Types of dendritic voltage and calcium signals in Purkinje neurons (PNs) of awake mice, resolved with fast (2 kHz) simultaneous voltage and calcium imaging.
(a) Single trial recording examples of non-evoked (left) and evoked (right) dendritic voltage spike signals (red) and corresponding dendritic calcium signals (green) during high frequency dendritic complex spike (DCS) and dendritic spike (DS) activity. DCS are indicated by filled black triangles and DS are indicated by open triangles. Black and dashed bars show detected spikelets during DCS and DS respectively. Note that DCS are characterized by a burst of dendritic spikelets, a large calcium transient, while DS are characterized by a gradual membrane depolarization, a single spikelet, and small calcium transient in the dendrites. (b) Averaged dendritic calcium (green) and voltage (red) responses to ‘weak’ (n = 26, 7 PNs) and ‘strong’ (n = 26, 7 PNs) electrical stimulation of parallel fibers (PFs; 10 negative current pulses, 30 or 300 mA, 1 ms duration, at 100 Hz), and responses to sensory stimulation that did not evoked DCSs or DSs (n = 59) (100 ms air puff directed toward eye, pressure: 30 psi) and for comparison (c) averaged dendritic calcium (green) and voltage (red) aligned to DCS events evoked by sensory stimulation (n = 203, 54 PNs), and non-evoked DCS (n = 1292, 54 PNs). The decay phase of averaged calcium signals was fit with single exponential functions in Matlab to estimate a decay time constant (t1/2) using the ‘fit(X_data, Y_data,'exp1')’ function. The t1/2 was estimated by fitting to data beginning 10 ms after the calcium peak (shown by overlay black lines on calcium traces). The t1/2 of the calcium signal evoked by strong electrical stimulation was estimated to be 231 ms ± 1 ms (95% confidence intervals). The t1/2 of the calcium signal evoked by weak electrical stimulation was estimated to be 94 ms ± 0.5 ms (95% confidence intervals). The t1/2 of the calcium signal evoked by sensory stimulation (no DCSs or DSs) was estimated to be 217 ms ± 3 ms (95% confidence intervals). The t1/2 of the evoked DCS calcium signal was estimated to be 231ms ± 1 ms (95% confidence intervals). The t1/2 of the non-evoked DCS calcium signal was estimated to be 141ms ± 0.5 ms (95% confidence intervals). Gray bars show full duration of electrical stimulation or air puff stimulus.
Figure 5 with 1 supplement
Supralinear dendritic signaling in Purkinje neuron (PN) dendrites during sensory-evoked stimulation is voltage and mGluR1 dependent.
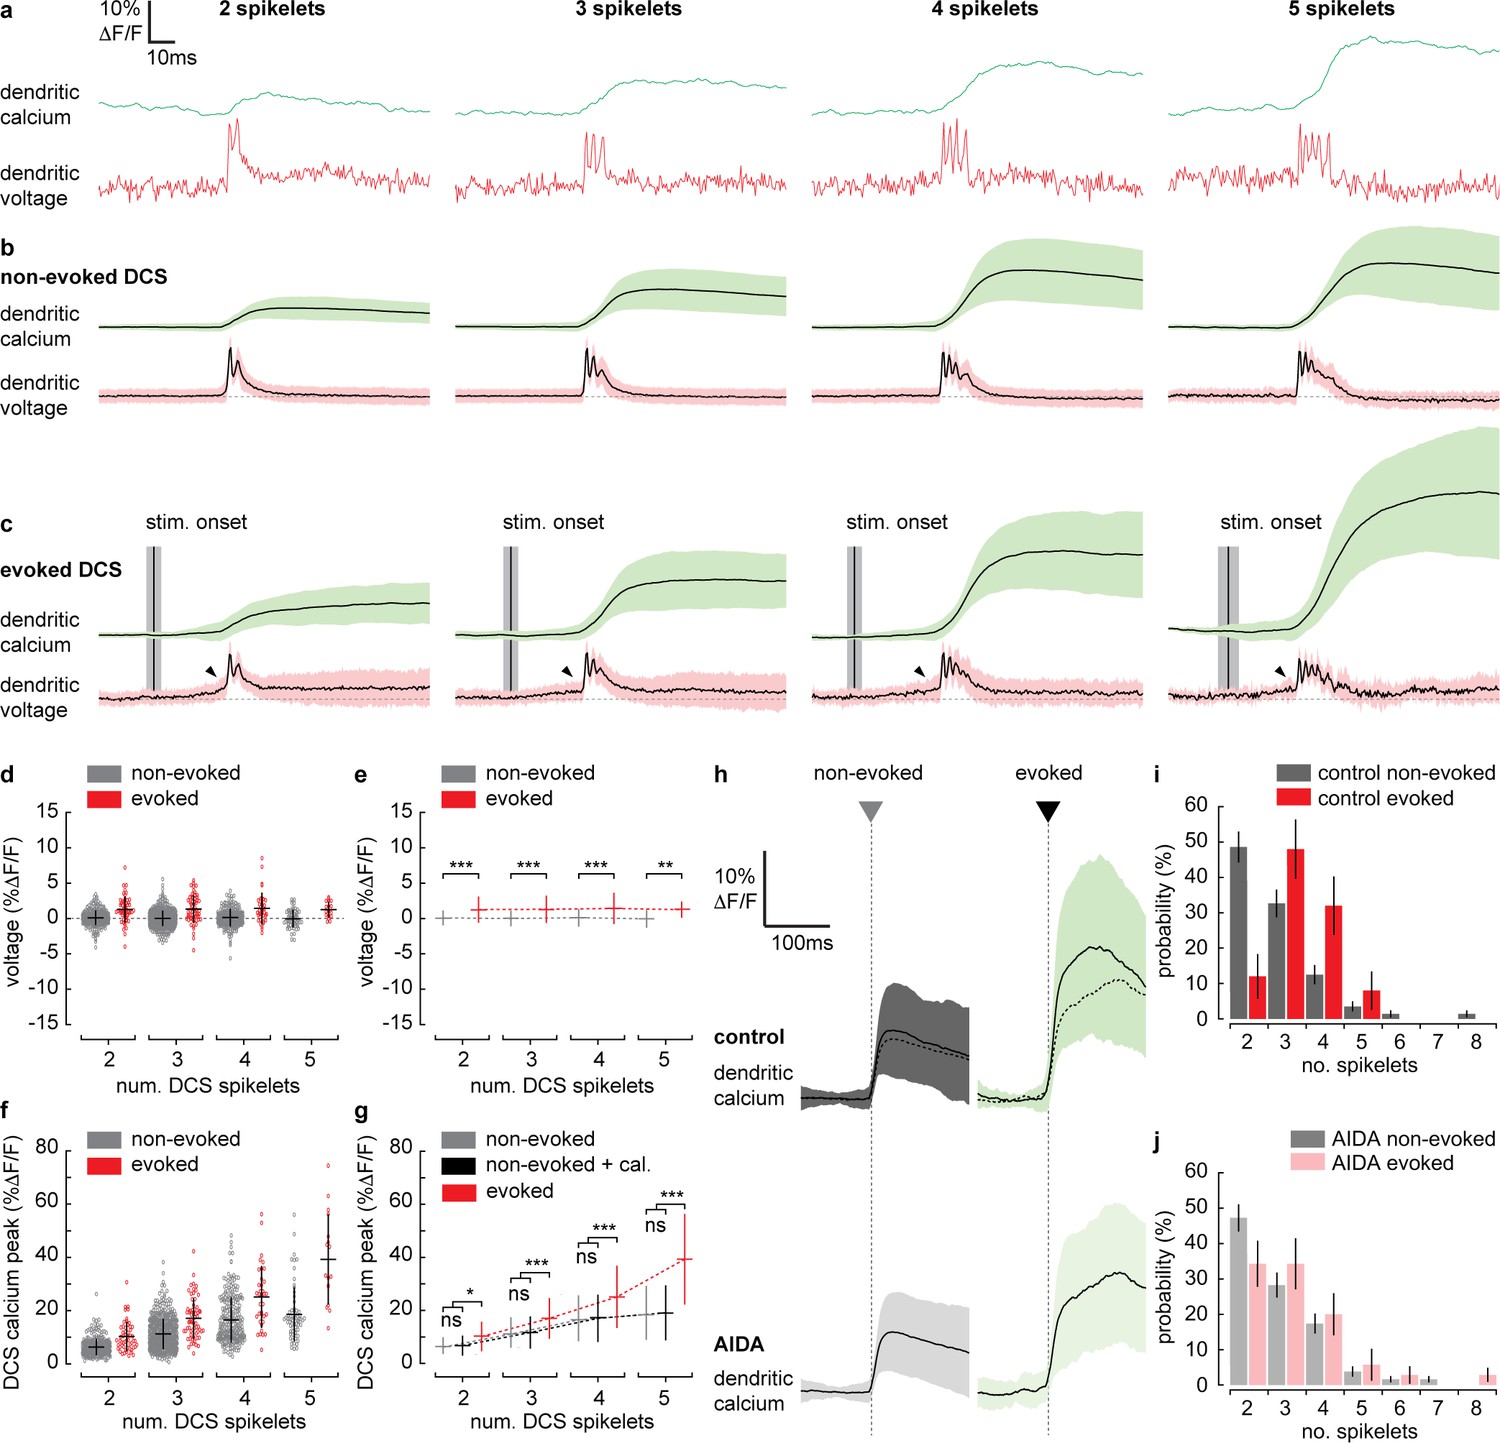
(a) Single trial examples of non-evoked dendritic complex spike (DCS) signals sorted based on the number of spikelets showing dendritic voltage (red traces) and calcium (green traces). (b) Averages of all non-evoked DCS signals. (c) Averages of all evoked DCS signals. Arrowheads indicate depolarization preceding evoked DCS signals. Mean time of sensory stimulation onset (stim. onset) is shown by vertical black line and vertical gray bar shows SEM. Full stimulus duration is 100 ms. (d) Average pre-DCS voltage for evoked (red) and non-evoked (gray) signals, grouped based on the number of DCS spikelets. Horizontal bars show mean, vertical bars show SD. (e) Mean from all groups in (d). (f) Average calcium peak for evoked (red) and non-evoked (gray) signals, grouped based on the number of DCS spikelets. (g) Mean from all groups in (f) and sum of non-evoked and + cal. groups (black). (h) Averages of all calcium signals following non-evoked (gray, left) and evoked (green, right) DCS signals, under control (top dark traces) and mGluR1 antagonist (AIDA) conditions (bottom light traces and top overlaid dashed traces). Black trace is mean and colored trace is SD. Probability distributions for the total number of dendritic spikelets detected in a 100 ms window following onset of each non-evoked and evoked DCS signal, excluding multiple DCS signals, under (i) control and (j) AIDA conditions (Kolmogorov–Smirnov, vertical bars in probability distributions show bootstrapped SD). *p<0.05, **p<0.01, and ***p<0.001.
Figure 5—figure supplement 1
mGluR1 antagonist, AIDA, has no effect on evoked eye blink closure time, stimulus-evoked dendritic voltage signaling, or the probability of dendritic complex spike (DCS) and dendritic spike (DS) events.
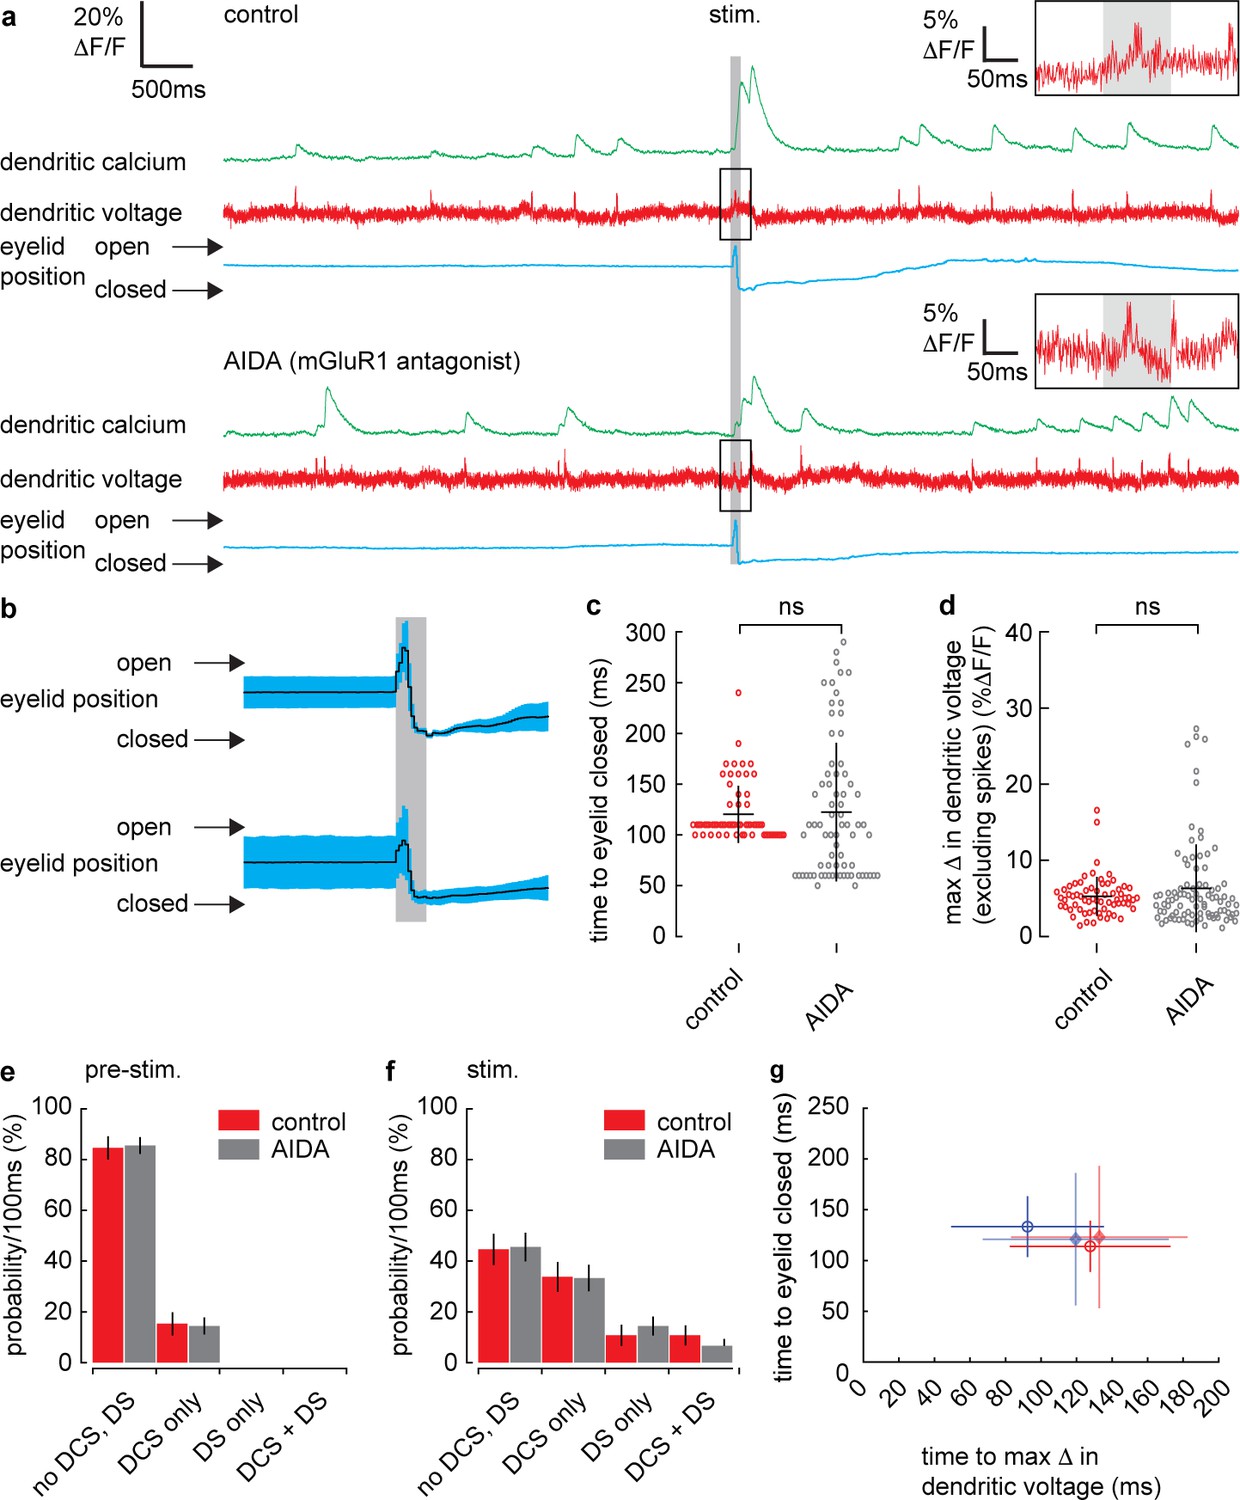
(a) Single trial recordings of simultaneous dendritic voltage (red traces) and calcium (green traces) during sensory stimulation (stim.). DCSs, DSs and corresponding calcium signals are visible in both voltage and calcium traces. Blue traces show average intensity of region of interest (ROI) used to record eyelid position (eyeblink responses). Insets show zoomed voltage traces during air puff stimulus. Gray bars show full duration of air puff stimulus. Top example shows voltage and calcium during control conditions and bottom example shows recordings following AIDA application from the same Purkinje neuron (PN). (b) Mean eye responses from control (top) and AIDA (bottom) recordings (black trace shows mean; blue trace shows SD). (c) Time for eyelid to close after stimulus onset under control (red) and AIDA (gray) conditions. There was no significant difference in eyelid closure time following AIDA application; control (120 ± 28 ms, mean ± SD, n = 64, 6 PNs); AIDA (122 ± 68 ms, mean ± SD, n = 74, 6 PNs), Kolmogorov–Smirnov, p=0.29, n = 138, 6 PNs. (d) Maximum change in dendritic voltage (excluding spikes) measured within a 200 ms window after stimulus onset under control and AIDA conditions. Stimulus-evoked voltage signals did not change following AIDA application; control (5.3 ± 2.6% ΔF/F, mean ± SD, n = 65, 6 PNs) and AIDA (6.3 ± 5.8% ΔF/F, mean ± SD, n = 90, 6 PNs), unpaired t-test, p=0.17, n = 155, 6 PNs. Probability distributions for DCS and DS events during pre-stimulus (e) and stimulus (f) time windows, under control and AIDA conditions (as in [c] and [d]). AIDA did not alter the probability of DCS and DS events during either pre-stimulus or stimulus time windows (pre-stimulus, p=1.0); (stimulus, p=1.0), Kolmogorov–Smirnov, n = 155, 6 PNs. Vertical bars in probability distributions show bootstrapped SD. (g) Relationship between the time of maximum change in dendritic voltage (depolarizing, red; or hyperpolarizing, blue) after stimulus onset and the time for eyelid closure, under control (open circles, n = 64, 6 PNs) and AIDA conditions (diamonds, n = 74, 6 PNs). Symbols show mean and bars show SD.
Additional files
Download links
A two-part list of links to download the article, or parts of the article, in various formats.
Downloads (link to download the article as PDF)
Open citations (links to open the citations from this article in various online reference manager services)
Cite this article (links to download the citations from this article in formats compatible with various reference manager tools)
Dendritic coincidence detection in Purkinje neurons of awake mice
eLife 9:e59619.
https://doi.org/10.7554/eLife.59619


