Def6 regulates endogenous type-I interferon responses in osteoblasts and suppresses osteogenesis
- Arthritis and Tissue Degeneration Program and David Z. Rosensweig Genomics Research Center, Hospital for Special Surgery, United States
- Department of Medicine, Weill Cornell Medical College, United States
- Institute for Immunology and School of Medicine, Tsinghua University, China
- Pathology and Laboratory Medicine, Weill Cornell Medical College, United States
- Research Division, Hospital for Special Surgery, United States
- Autoimmunity and Inflammation Program, Hospital for Special Surgery, United States
- Graduate Program in Immunology and Microbial Pathogenesis, Weill Cornell Graduate School of Medical Sciences, United States
- Graduate Program in Cell and Development Biology, Weill Cornell Graduate School of Medical Sciences, United States
Figures
Figure 1 with 5 supplements
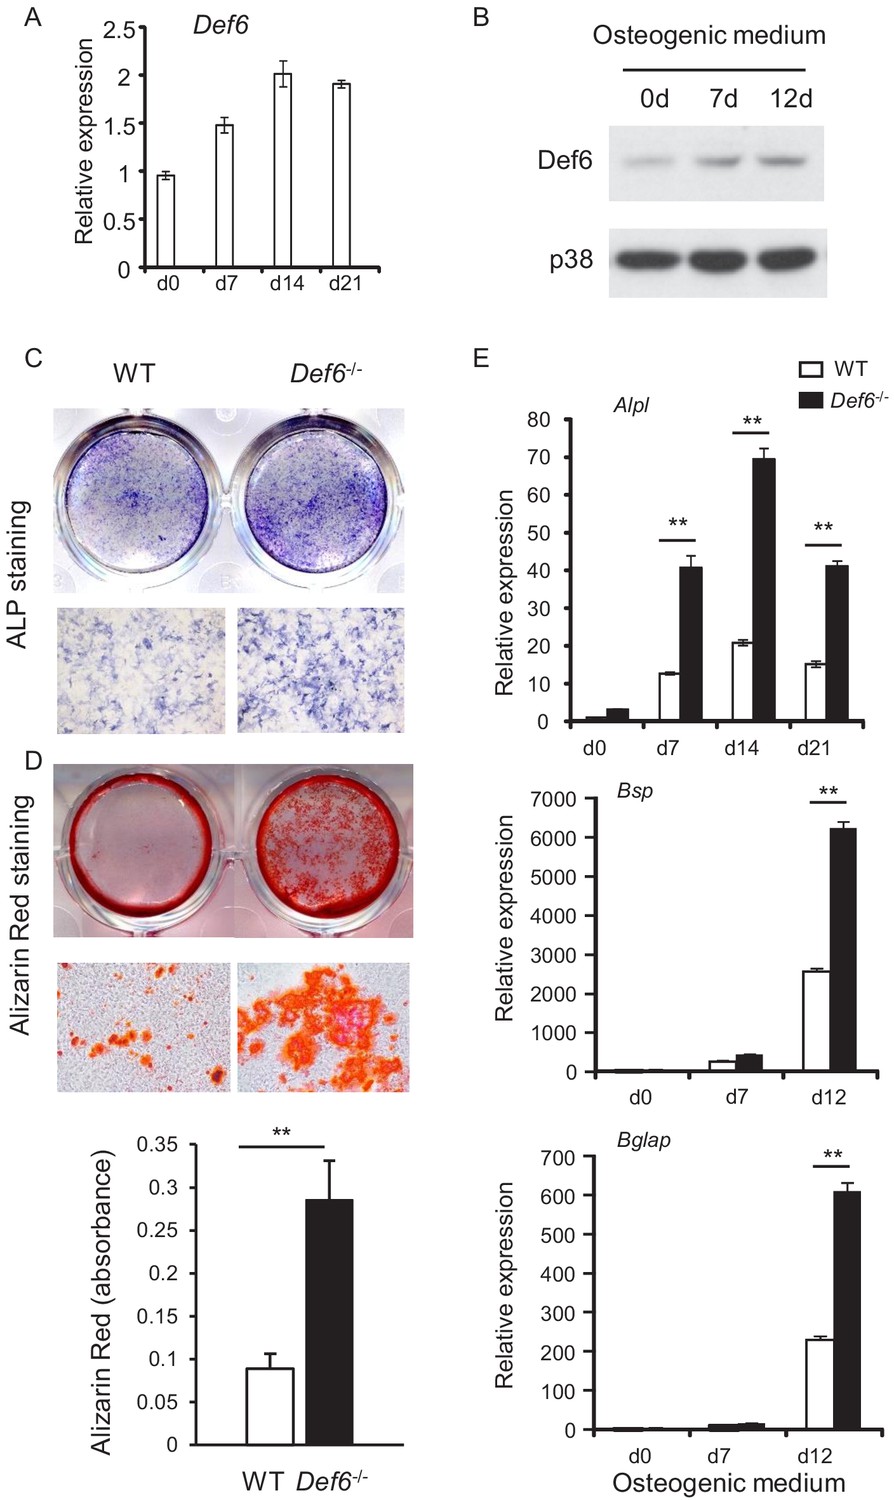
Def6 absence accelerates osteoblast differentiation.
(A, B) Expression of Def6 during osteoblast differentiation using WT and Def6-/- calvarial osteoblast cells at the indicated time points by quantitative real-time PCR (qPCR) analysis of mRNA expression (A) or immunoblot analysis of protein levels (B). (C) ALP staining and (D) Alizarin red staining (upper panel) and its quantification (lower panel) of WT and Def6-/- calvarial osteoblast differentiation at day 15 in osteogenic medium. (E) qPCR analysis of mRNA expression of Alpl, Bsp and Bglap during WT and Def6-/- calvarial osteoblast differentiation process. Data are mean ± SEM. **p<0.01. n.s., not statistically significant.
-
Figure 1—source data 1
Source data for Figure 1.
- https://cdn.elifesciences.org/articles/59659/elife-59659-fig1-data1-v1.xlsx
Figure 1—figure supplement 1
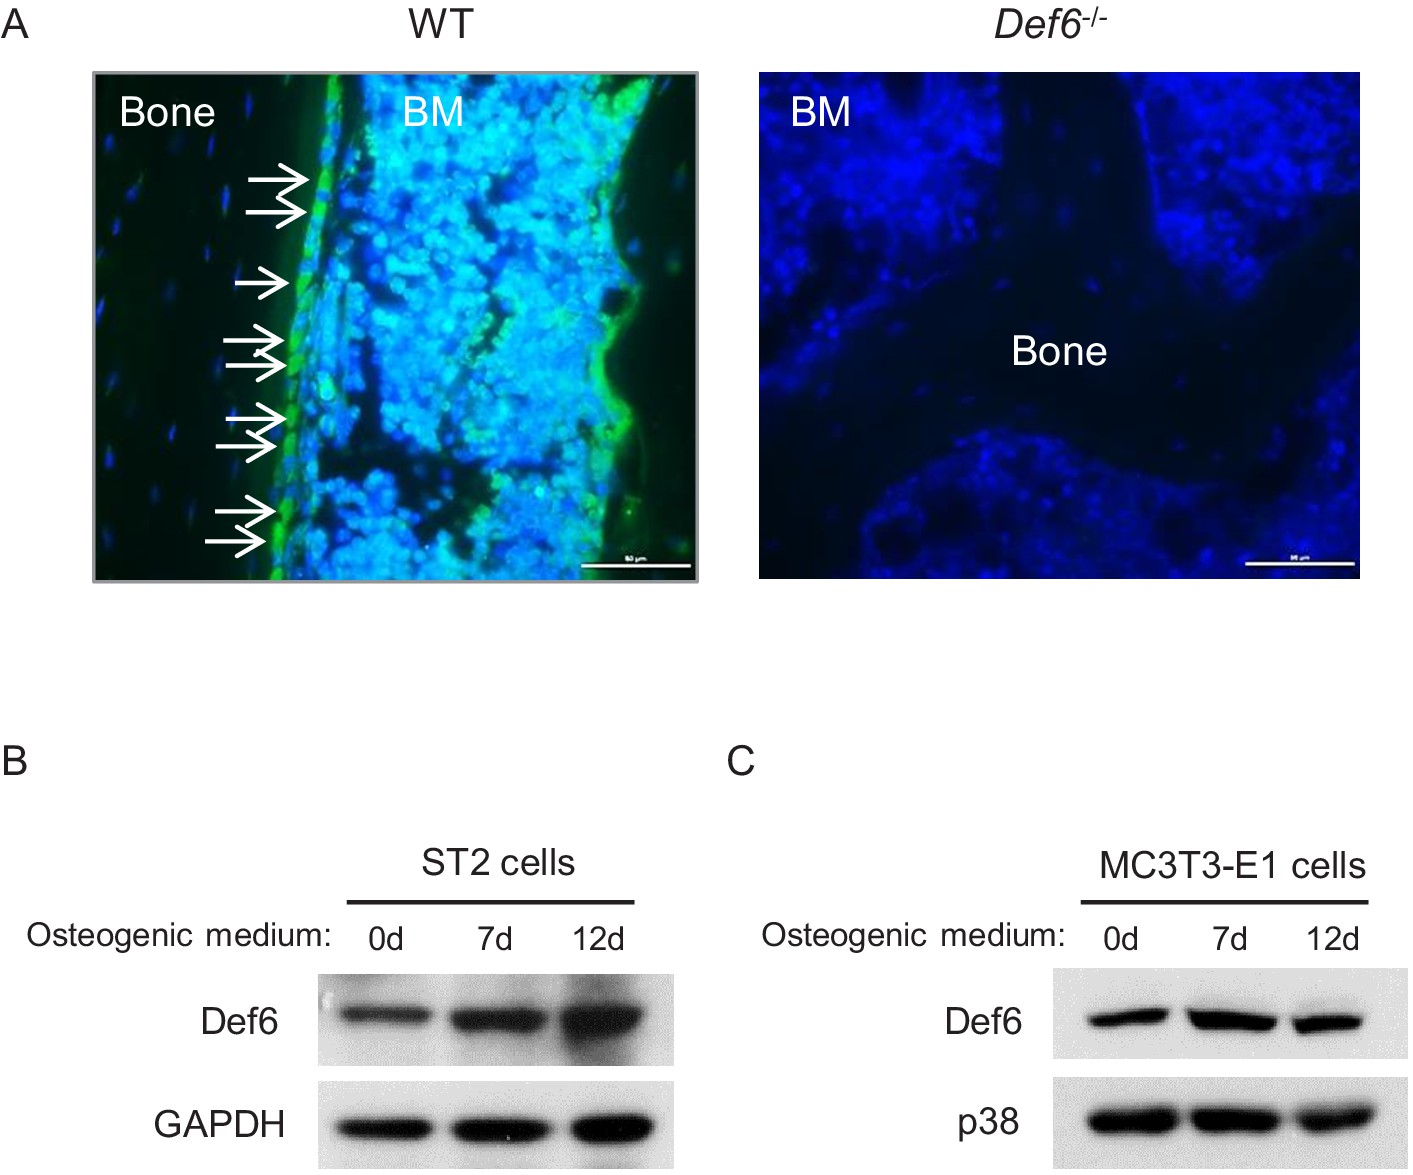
Def6 expression in osteoblasts in vivo and in osteoblast cell lines.
(A) Immunofluorescence staining of Def6 (green) on the slices of femurs from 8-week-old WT and Def6-/- mice. Def6-/- mice were used as a negative control for Def6 staining. The slices were counterstained with DAPI (blue). White arrows point to osteoblasts on the bone surface. BM, bone marrow. Scale bar: 50 µm. (B–C) Immunoblot analysis of Def6 expression in ST2 cells (B) and MC3T3-E1 cells (C) during osteoblast differentiation. p38 or GAPDH were used as a loading control.
Figure 1—figure supplement 2

RNAseq–based expression heatmap of the marker genes of osteoclasts and macrophages (left panel) and volcano plot (right panel) of RNA-seq analysis of differentially expressed genes in WT and Def6-/- calvarial osteoblasts.
Figure 1—figure supplement 3
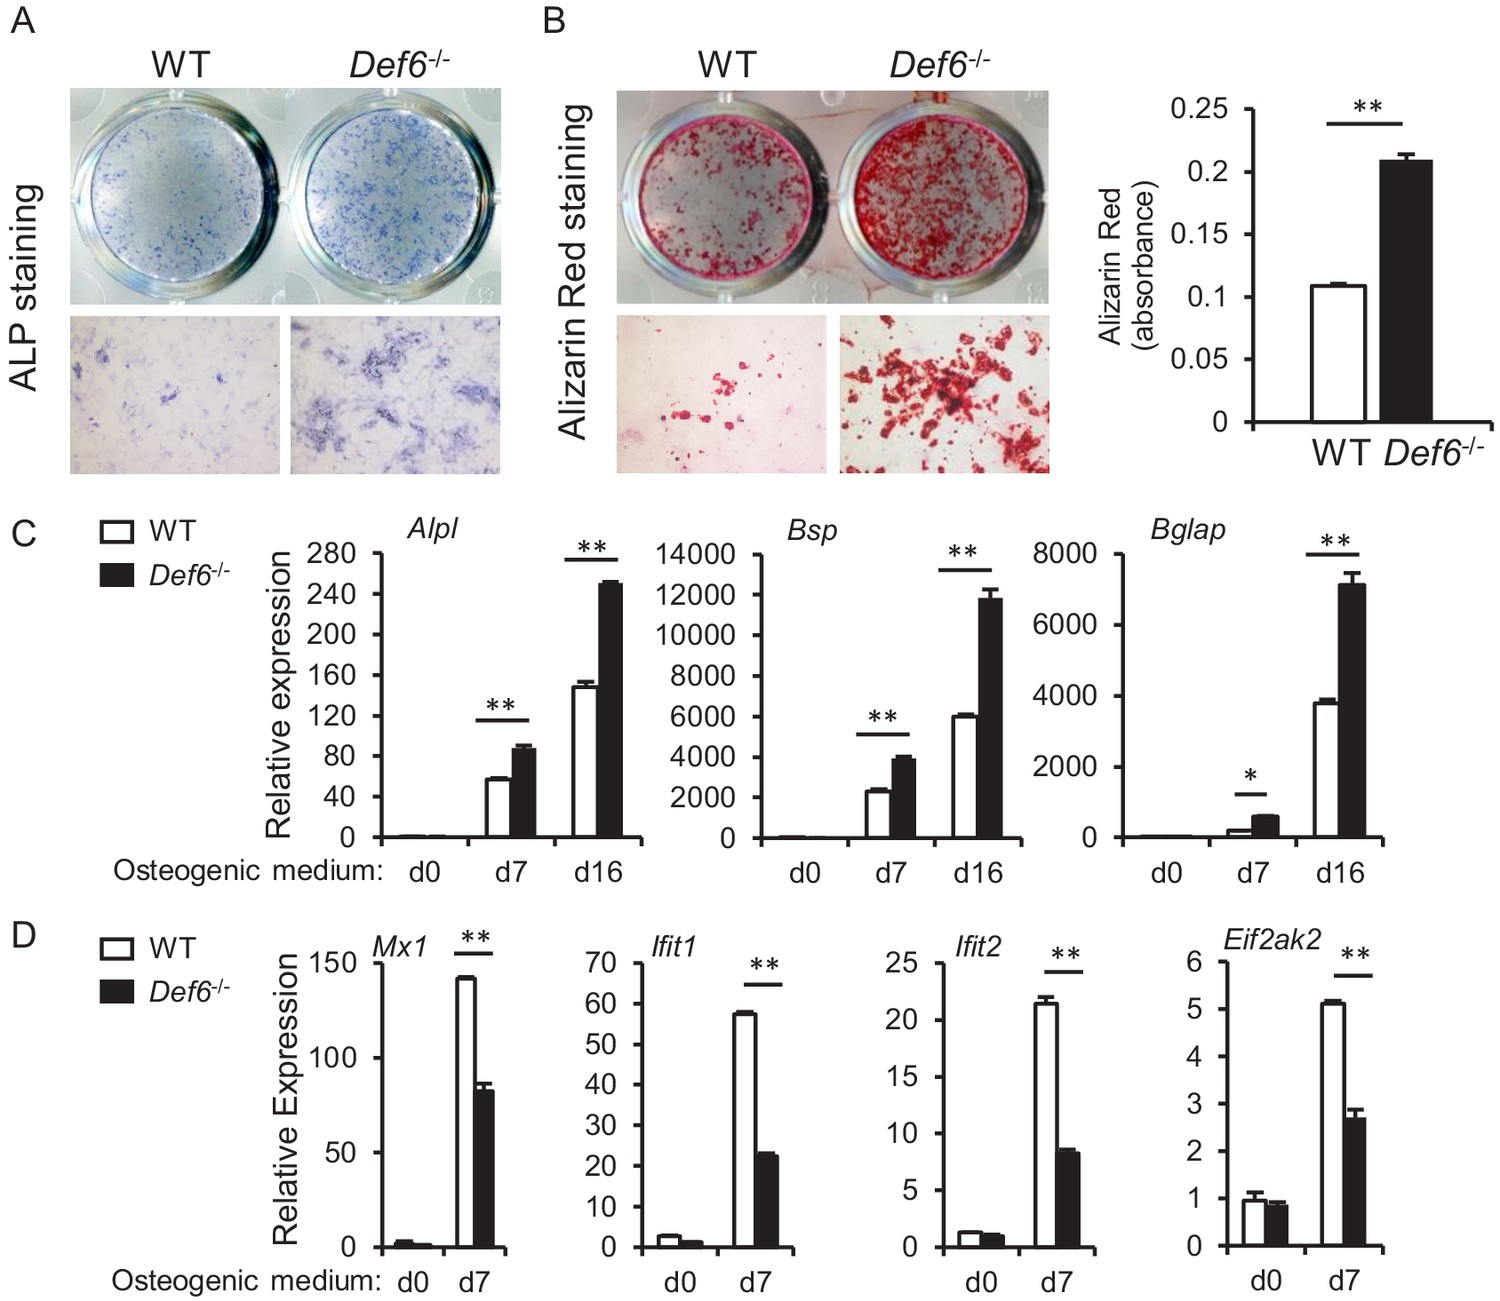
CD45 selection does not affect Def6 role in osteoblast differentiation.
CD45 negative calvarial osteoblasts were selected using CD45 magnetic beads according to the manufacturer's instruction, and used to test osteoblast differentiation and gene expression. (A) ALP staining at day 9 and (B) Alizarin red staining at day 21 (left panel) and its quantification (right panel) of CD45 negative WT and Def6-/- calvarial osteoblast differentiation in osteogenic medium. (C, D) qPCR analysis of mRNA expression of osteoblast marker genes Alpl, Bsp and Bglap (C) and ISGs Mx1, Ifit1, Ifit2 and Eif2ak2 (D) during CD45 negative WT and Def6-/- calvarial osteoblast differentiation process. Data are mean ± SD. *p<0.05. **p<0.01.
-
Figure 1—figure supplement 3—source data 1
Source data for Figure 1—figure supplement 3.
- https://cdn.elifesciences.org/articles/59659/elife-59659-fig1-figsupp3-data1-v1.xlsx
Figure 1—figure supplement 4
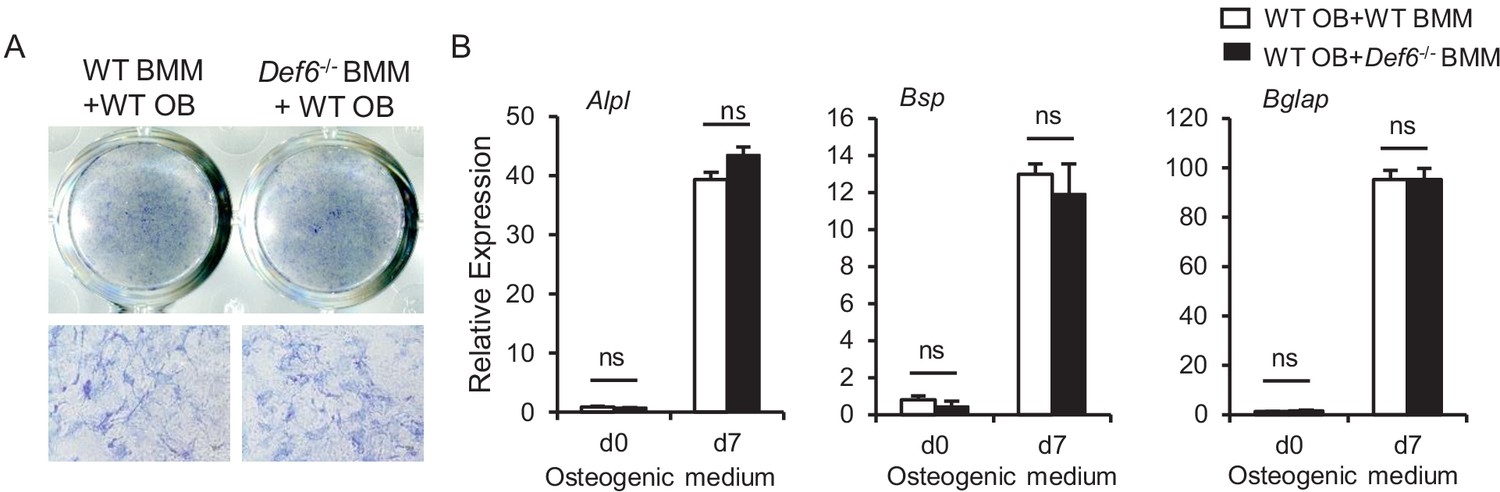
Bone marrow derived macrophages (BMMs) from WT and Def6-/- mice were co-cultured with CD45 negative WT calvarial osteoblasts using transwell inserts, in which BMMs were cultured in the upper compartment of the well and osteoblasts were on the bottom compartment of the well.
(A) ALP staining at day 7 and (B) qPCR analysis of osteoblast marker gene expression at the indicated times. n.s., not statistically significant.
-
Figure 1—figure supplement 4—source data 1
Source data for Figure 1—figure supplement 4.
- https://cdn.elifesciences.org/articles/59659/elife-59659-fig1-figsupp4-data1-v1.xlsx
Figure 1—figure supplement 5
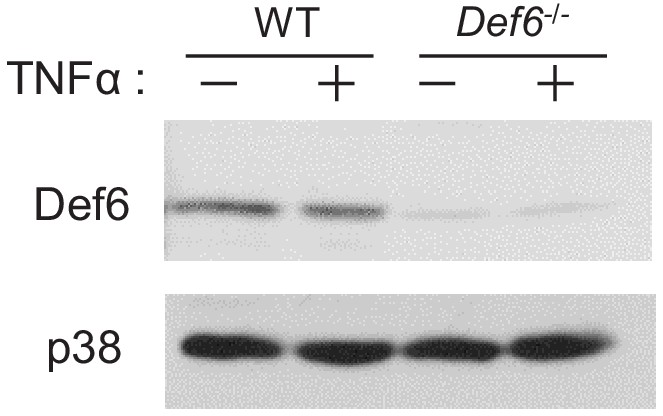
Immunoblot analysis of Def6 expression after TNFα (40 ng/ml) treatment for 24 hr on the WT and Def6-/- calvarial osteoblasts.
p38 was used as a loading control.
Figure 2 with 1 supplement
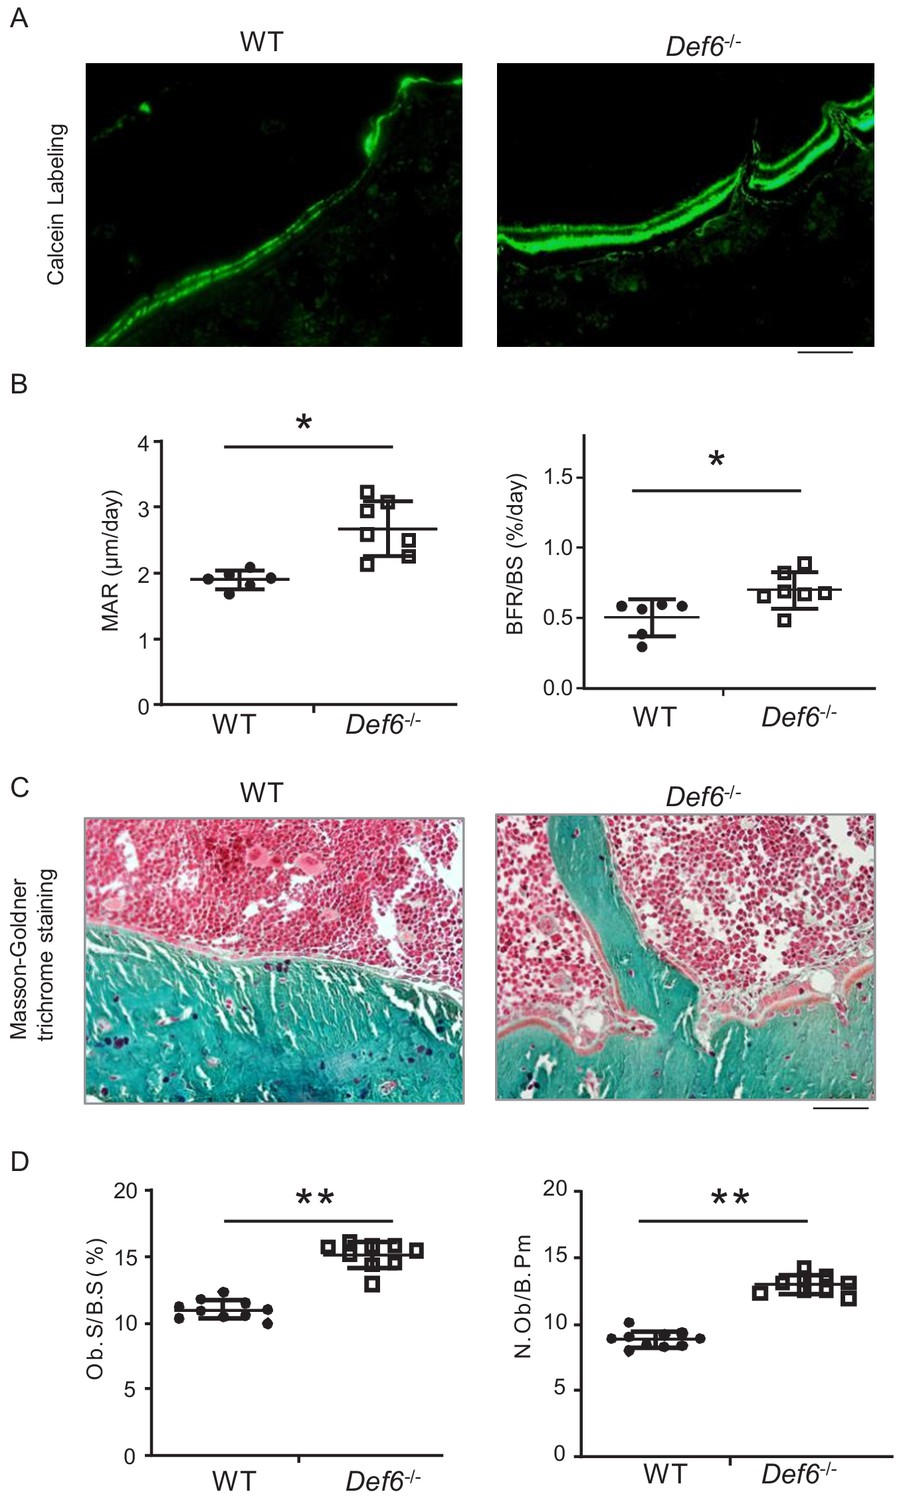
Def6 deficiency enhances osteogenesis in vivo.
(A) Images of calcein double labeling of the tibiae of WT and Def6-/- littermate mice. (B) Bone morphometric analysis of mineral apposition rate (MAR) and bone formation rate per bone surface (BFR/BS) after calcein double labeling of the tibiae of WT and Def6-/- littermate male mice. n = 6. (C) Images of Masson-Goldner staining of tibiae of WT and Def6-/- littermate mice. The bones show green, osteoid matrix appears dark orange on the surface of the bone beneath the osteoblasts, osteoblasts (Ob) are stained orange lining on the bone surface, and bone marrow cells appear red in the photograph. (D) Bone morphometric analysis of osteoblast surface per bone surface (Ob.S/BS) and osteoblast number per bone perimeter (N.Ob/B.Pm) of the tibiae of WT and Def6-/- littermate male mice. n = 8. Scale bars = 50 µm. Data are mean ± SEM. *p<0.05, **p<0.01. n.s., not statistically significant.
-
Figure 2—source data 1
Source data for Figure 2.
- https://cdn.elifesciences.org/articles/59659/elife-59659-fig2-data1-v1.xlsx
Figure 2—figure supplement 1
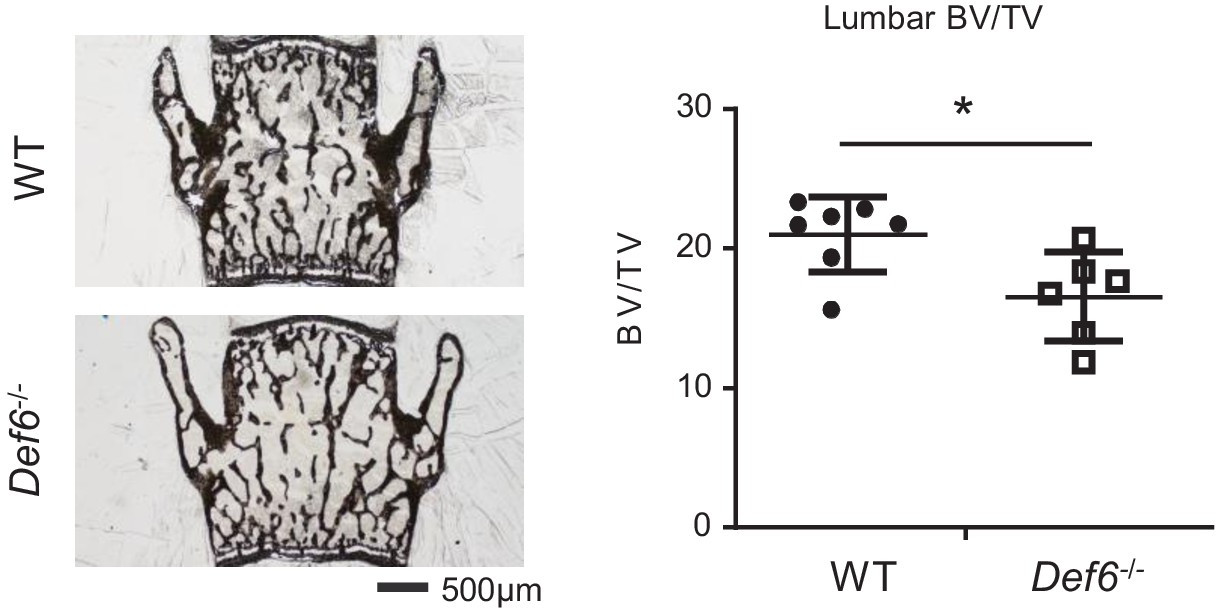
Def6 exhibits osteoporosis in lumbar bones.
(A) Images of Von Kossa staining of lumbar from WT and Def6-/- mice. (B) Bone morphometric analysis of bone volume/tissue vol (BV/TV) of lumbar from WT and Def6-/- male mice. n = 6. Data are mean ± SEM. **p<0.01.
-
Figure 2—figure supplement 1—source data 1
Source data for Figure 2—figure supplement 1.
- https://cdn.elifesciences.org/articles/59659/elife-59659-fig2-figsupp1-data1-v1.xlsx
Figure 3

Def6 deficiency decreases the expression of interferon stimulated genes (ISGs), which are induced during osteoblast differentiation.
(A) Volcano plot of RNA-seq analysis of differentially expressed genes using the mRNAs isolated from the WT and Def6-/- calvarial osteoblast cells stimulated with osteogenic medium for 12 days. Blue dots show genes more highly expressed in Def6-/- osteoblasts than WT osteoblasts with significant (p<0.05) and greater than 1.2-fold changes. Red dots show genes more highly expressed in WT osteoblasts than Def6-/- osteoblasts with significant (p<0.05) and greater than 1.2-fold changes. (B) Pathway analysis of significantly differentially expressed genes. Upper panel shows enriched pathways in WT and lower panel shows enriched pathways in Def6-/- osteoblasts. (C) RNAseq–based expression heatmaps of the interferon stimulated genes (left panel) and osteoblast genes (right panel) regulated by Def6 deficiency based on the differentially expressed genes from (A). Row z-scores of CPMs of genes were shown in the heatmap. #1, replicate 1. #2, replicate 2. (D) Gene set enrichment analysis (GSEA) of differentially expressed genes from WT and Def6-/- calvarial osteoblast cells stimulated with osteogenic medium for 12 days ranked by NES scores. Type-I IFN response genes and osteoblast genes are mostly enriched in WT and Def6-/- osteoblast cells, respectively (p<0.0001 and FDR < 0.0001). The enrichment plots are shown. NES, normalized enrichment score. (E) qPCR analysis of type-I IFN response gene expression during osteoblast cell differentiation. Data are mean ± SEM. **p<0.01. n.s., not statistically significant.
-
Figure 3—source data 1
Source data for Figure 3.
- https://cdn.elifesciences.org/articles/59659/elife-59659-fig3-data1-v1.xlsx
Figure 4

Def6 suppresses osteogenesis via endogenous IFNβ-mediated autocrine feedback inhibition.
qPCR analysis of type-I IFN response gene expression (A) and osteoblast marker gene expression (B) during osteoblast cell differentiation in the absence or presence of IFNβ blocking antibody (10 U/ml). Control IgG, 10 U/ml. (C) Alizarin red staining (left panel) and its quantification (right panel) of WT and Def6-/- calvarial osteoblast differentiation at day 16 in the osteogenic medium in the absence or presence of IFNβ blocking antibody (10 U/ml). Control IgG, 10 U/ml. Data are mean ± SEM. *p<0.05. n.s., not statistically significant.
-
Figure 4—source data 1
Source data for Figure 4.
- https://cdn.elifesciences.org/articles/59659/elife-59659-fig4-data1-v1.xlsx
Figure 5 with 1 supplement
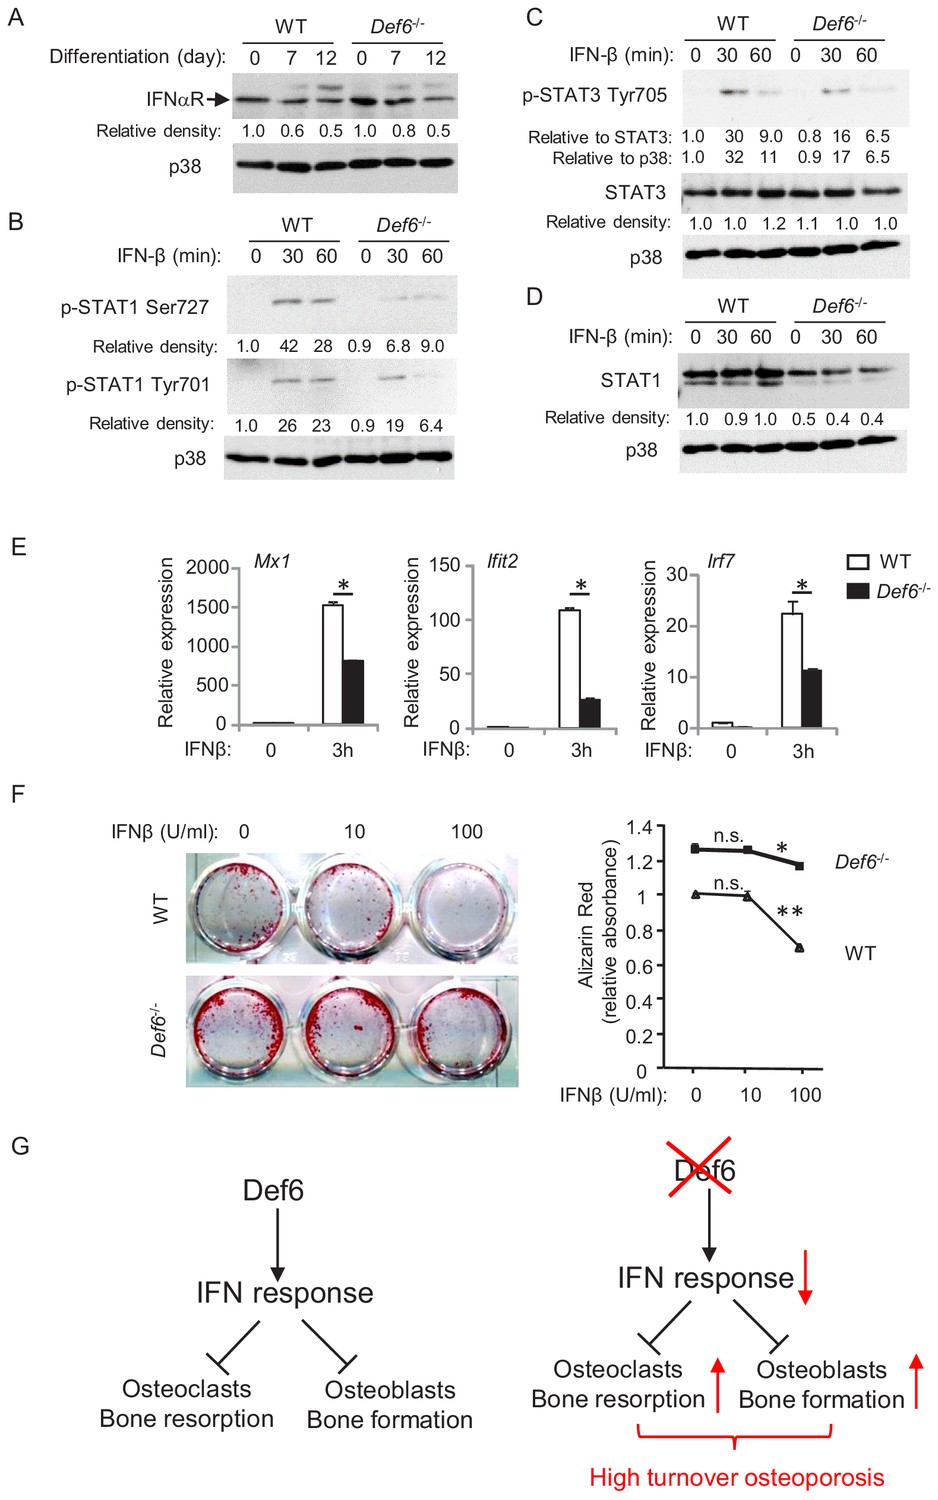
Def6 regulates cellular response of osteoblast cells to IFNβ.
(A–D) Immunoblot analysis of type-I IFN receptor expression during osteoblast differentiation (A), the induction of p-STAT1 and 3 (B, C) and expression of STAT1 (D) in WT and Def6-/- osteoblast cells stimulated with mouse recombinant IFN-β (10 U/ml) at the indicated time points. p38 was used as a loading control. The relative density of each band to its corresponding loading control p38 band was calculated by Image J software, and then was normalized to the WT controls at time 0 (the 1st lanes). The relative density for p-STAT3 to total STAT3 was also calculated. (E) qPCR analysis of type-I IFN response gene expression after indicated time points of treatment with IFN-β (10 U/ml) in WT and Def6-/- osteoblast cells. (F) Osteoblast differentiation is induced by the osteogenic medium in the absence or presence of mouse recombinant IFN-β in the WT and Def6-/- osteoblast cells. Alizarin red staining at day 16 (left panel) and its quantification (right panel) were performed. Data are mean ± SEM. *p<0.05, **p<0.01. n.s., not statistically significant. (G) A model showing that the Def6-IFN axis regulates both osteoclast-mediated bone resorption (Binder et al., 2017) and osteoblast-mediated bone formation (current study) in bone homeostasis. Def6 deletion enhances both bone resorption (Binder et al., 2017) and formation (current study) via attenuated type-I IFN-mediated feedback inhibition of the differentiation of both cell types, leading to a high turn-over osteoporotic phenotype in Def6-/- mice.
-
Figure 5—source data 1
Source data for Figure 5.
- https://cdn.elifesciences.org/articles/59659/elife-59659-fig5-data1-v1.xlsx
Figure 5—figure supplement 1
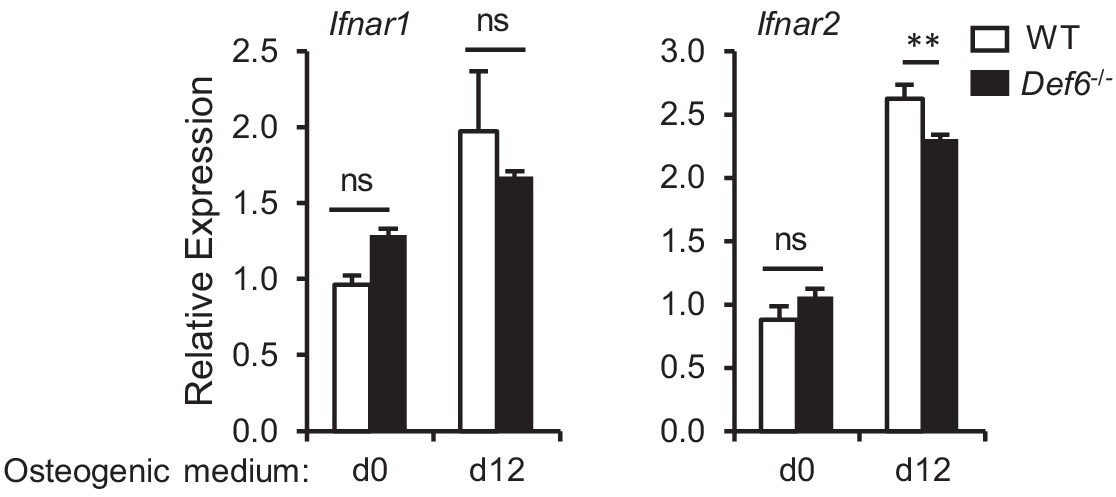
qPCR analysis of mRNA expression of Ifnar1 and Ifnar2 during osteoblast differentiation.
-
Figure 5—figure supplement 1—source data 1
Source data for Figure 5—figure supplement 1.
- https://cdn.elifesciences.org/articles/59659/elife-59659-fig5-figsupp1-data1-v1.xlsx
Figure 6 with 2 supplements

Def6 deficiency inhibits endogenous expression of IFN-β and ISG genes via downregulation of PKR in osteoblasts.
(A–B) ELISA analysis of IFN-β level in mouse serum (A) and in CD45 negative calvarial osteoblast cell cultures (B) from WT and Def6-/- mice (n = 5). (C) ALP staining at day 7 and (D) Alizarin red staining at day 21 (left panel) and its quantification (right panel) of WT and Ifnar1-/- (IFNαβR KO) calvarial osteoblast differentiation in osteogenic medium. (E) qPCR analysis of mRNA relative expression of osteoblast marker genes and ISGs during WT and Ifnar1-/- (IFNαβR KO) calvarial osteoblast differentiation process. (F) Immunoblot analysis of PKR expression in WT and Def6-/- calvarial osteoblasts. p38 was used as a loading control. (G) Immunoblot analysis of PKR expression after knockdown of PKR by PKR-LNA induced gene silencing in ST2 cells. p38 was used as a loading control. (H–J) qPCR analysis of mRNA expression of Ifnb and ISGs (H), ALP staining, scale bar: 500 µm (I) and qPCR analysis of mRNA expression of osteoblastic genes (J) in ST2 cells with or without PKR knockdown. (K) Immunoblot analysis of PKR expression after overexpression of PKR by retroviral transduction for 24 hr. p38 was used as a loading control. (L) qPCR analysis of mRNA expression of Ifnb, ISGs and osteoblast markers. Data are mean ± SD. *p<0.05. **p<0.01. n.s., not statistically significant.
-
Figure 6—source data 1
Source data for Figure 6.
- https://cdn.elifesciences.org/articles/59659/elife-59659-fig6-data1-v1.xlsx
Figure 6—figure supplement 1
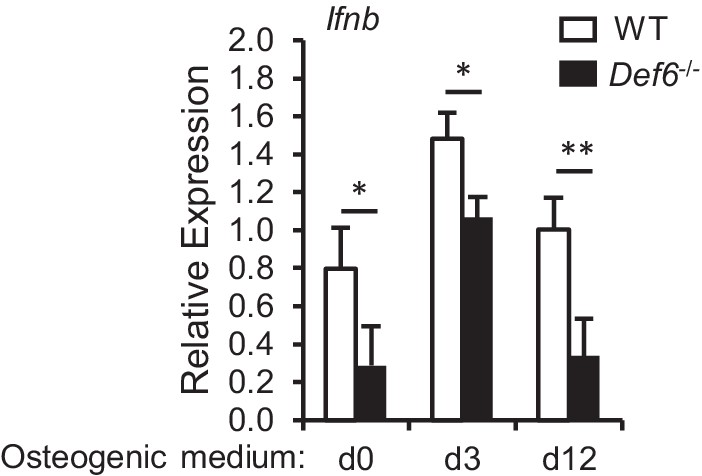
qPCR analysis of mRNA expression of Ifnb during osteoblast differentiation.
-
Figure 6—figure supplement 1—source data 1
Source data for Figure 6—figure supplement 1.
- https://cdn.elifesciences.org/articles/59659/elife-59659-fig6-figsupp1-data1-v1.xlsx
Figure 6—figure supplement 2
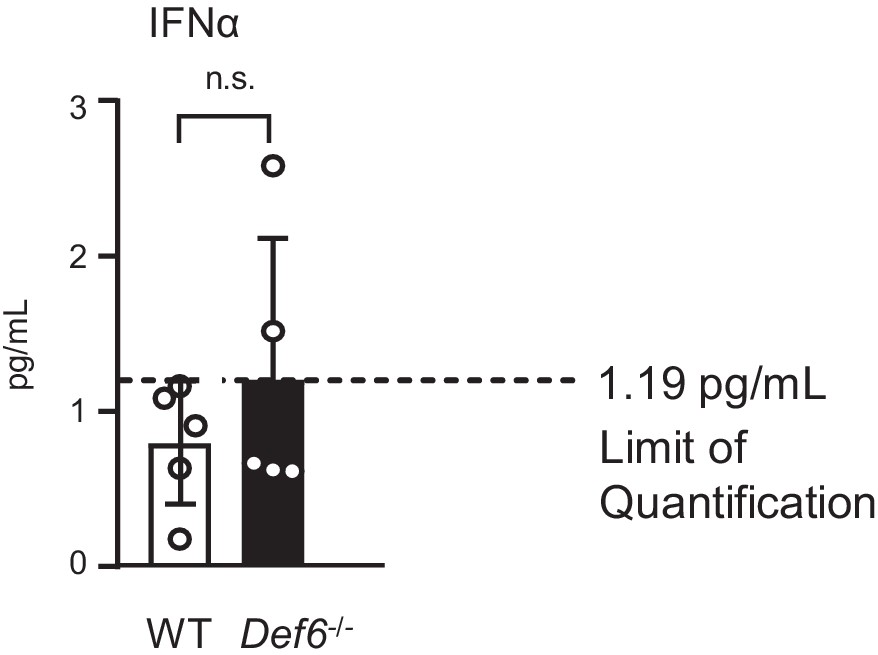
ELISA analysis of IFNα level in the serum of 8 week old WT and Def6-/- mice.
n = 5.
-
Figure 6—figure supplement 2—source data 1
Source data for Figure 6—figure supplement 2.
- https://cdn.elifesciences.org/articles/59659/elife-59659-fig6-figsupp2-data1-v1.xlsx
Tables
Key resources table
| Reagent type (species) or resource | Designation | Source or reference | Identifiers | Additional information |
|---|---|---|---|---|
| Genetic reagent (M. musculus) | Def6-/- | PMID:16470246 | RRID:MGI:3628445 | |
| Genetic reagent (M. musculus) | Ifnar-/- | PMID:8009221 | RRID:MGI:3765898 | |
| Cell line (Homo sapiens) | Platinum-E (Plat-E) | Cell Biolabs | Cat# RV-101 RRID:CVCL_B488 | Has been authenticated by STR profiling and tested negative for mycoplasma |
| Cell line (M. musculus) | ST2 | DSMZ | Cat# ACC333 RRID:CVCL_2205 | Has been authenticated by STR profiling and tested negative for mycoplasma |
| Cell line (M. musculus) | MC3T3-E1 | ATCC | Cat# CRL-2594 RRID:CVCL_5437 | Has been authenticated by STR profiling and tested negative for mycoplasma |
| Antibody | anti-IBP/Def6 (rabbit polyclonal) | PMID:12923183 | WB (1:1000) IF (1:100) | |
| Antibody | anti-IFN-α/βRα (mouse monoclonal) | Santa Cruz Biotechnology | Cat# sc-7391 RRID:AB_2122749 | WB (1:1000) |
| Antibody | anti-mouse IFN Beta, neutralizing (rabbit polyclonal) | PBL Assay Science | Cat# 32400–1 RRID:AB_387872 | 10 U/ml |
| Antibody | anti-Stat1 (rabbit polyclonal) | Santa Cruz Biotechnology | Cat# sc-346 RRID:AB_632435 | WB (1:1000) |
| Antibody | anti-Stat3 (rabbit monoclonal) | Cell Signaling Technology | Cat# 12640 RRID:AB_2629499 | WB (1:1000) |
| Antibody | anti- Phospho-Stat1 (Ser727) (rabbit polyclonal) | Cell Signaling Technology | Cat# 9177 RRID:AB_2197983 | WB (1:1000) |
| Antibody | anti- Phospho-Stat1 (Tyr701) (rabbit polyclonal) | Cell Signaling Technology | Cat# 9171 RRID:AB_331591 | WB (1:1000) |
| Antibody | anti-Phospho-Stat3 (Tyr705) (rabbit polyclonal) | Cell Signaling Technology | Cat# 9131 RRID:AB_331586 | WB (1:1000) |
| Antibody | anti-PKR (mouse monoclonal) | Santa Cruz Biotechnology | Cat# sc-6282 RRID:AB_628150 | WB (1:1000) |
| Antibody | anti-p38α (rabbit polyclonal) | Santa Cruz Biotechnology | Cat# sc-535 RRID:AB_632138 | WB (1:3000) |
| Antibody | anti-Gapdh (rabbit polyclonal) | Santa Cruz Biotechnology | Cat# sc-25778 RRID:AB_10167668 | WB (1:3000) |
| Recombinant DNA reagent | pMXs-IRES-GFP (plasmid) | Cell Biolabs | Cat# RTV-013 | |
| Recombinant DNA reagent | pMXs-mPKR-FLAG-IG (plasmid) | Addgene | Cat# 101792 RRID:Addgene_101792 | |
| Sequence-based reagent | siEif2ak2 LNA | Qiagen | Cat#300600 | 40 nM for knockdown |
| Peptide, recombinant protein | Recombinant mouse IFNβ | PBL Assay Science | Cat#12400–1 | 10 U/ml |
| Peptide, recombinant protein | Recombinant Murine TNFα | Peprotech | Cat# 315-01A | 40 ng/ml |
| Peptide, recombinant protein | Recombinant Murine M-CSF | Peprotech | Cat# 315–02 | 20 ng/ml |
| Commercial assay or kit | VeriKine-HS Mouse IFN Beta Serum ELISA Kit | PBL Assay Science | Cat#42410–1 | |
| Commercial assay or kit | Mouse IFN Alpha All Subtype ELISA Kit | PBL Assay Science | Cat#42115–1 | |
| Chemical compound, drug | FuGENE 6 Transfection Reagent | Promega | Cat# E2691 | |
| Chemical compound, drug | TransIT-TKO Transfection Reagent | Mirus | Cat#MIR2150 | |
| Software, algorithm | HISAT2 | PMID:31375807 | RRID:SCR_015530 | http://daehwankimlab.github.io/hisat2/ |
| Software, algorithm | HTseq | PMID:25260700 | RRID:SCR_005514 | https://htseq.readthedocs.io/en/master/# |
| Software, algorithm | edgeR | PMID:19910308 PMID:22287627 | RRID:SCR_012802 | https://bioconductor.org/packages/release/bioc/html/edgeR.html |
| Software, algorithm | pheatmap | https://cran.r-project.org/web/packages/ pheatmap/index.html | RRID:SCR_016418 | https://cran.r-project.org/web/packages/pheatmap/index.html |
| Software, algorithm | Enrichr | PMID:23586463 PMID:27141961 | RRID:SCR_001575 | https://maayanlab.cloud/Enrichr/ |
| Software, algorithm | ImageJ (v1.50i) | PMID:22930834 | RRID:SCR_003070 | https://imagej.nih.gov/ij/index.html |
| Software, algorithm | Graphpad Prism 8 | GraphPad Software | RRID:SCR_002798 | |
| Software, algorithm | Osteomeasure | OsteoMetrics, Inc | ||
| Other | ProLong Gold Antifade Mountant with DAPI | Thermo Fisher scientific | Cat#P36941 |
Additional files
Download links
A two-part list of links to download the article, or parts of the article, in various formats.
Downloads (link to download the article as PDF)
Open citations (links to open the citations from this article in various online reference manager services)
Cite this article (links to download the citations from this article in formats compatible with various reference manager tools)
Def6 regulates endogenous type-I interferon responses in osteoblasts and suppresses osteogenesis
eLife 9:e59659.
https://doi.org/10.7554/eLife.59659


