Dichotomous role of the human mitochondrial Na+/Ca2+/Li+ exchanger NCLX in colorectal cancer growth and metastasis
- Department of Cellular and Molecular Physiology, The Pennsylvania State University College of Medicine, United States
- Department of Public Health Sciences, The Pennsylvania State University College of Medicine, United States
- Department of Biochemistry and Molecular Biology, The Pennsylvania State University College of Medicine, United States
- Penn State Cancer Institute. The Pennsylvania State University College of Medicine, United States
- Department of Surgery, Division of Colon and Rectal Surgery, The Pennsylvania State University College of Medicine, United States
- Department of Physiology and Cell Biology, Faculty of Health Sciences, Ben-Gurion University of the Negev, Israel
- Department of Pharmacology, The Pennsylvania State University College of Medicine, United States
Figures
Figure 1 with 1 supplement
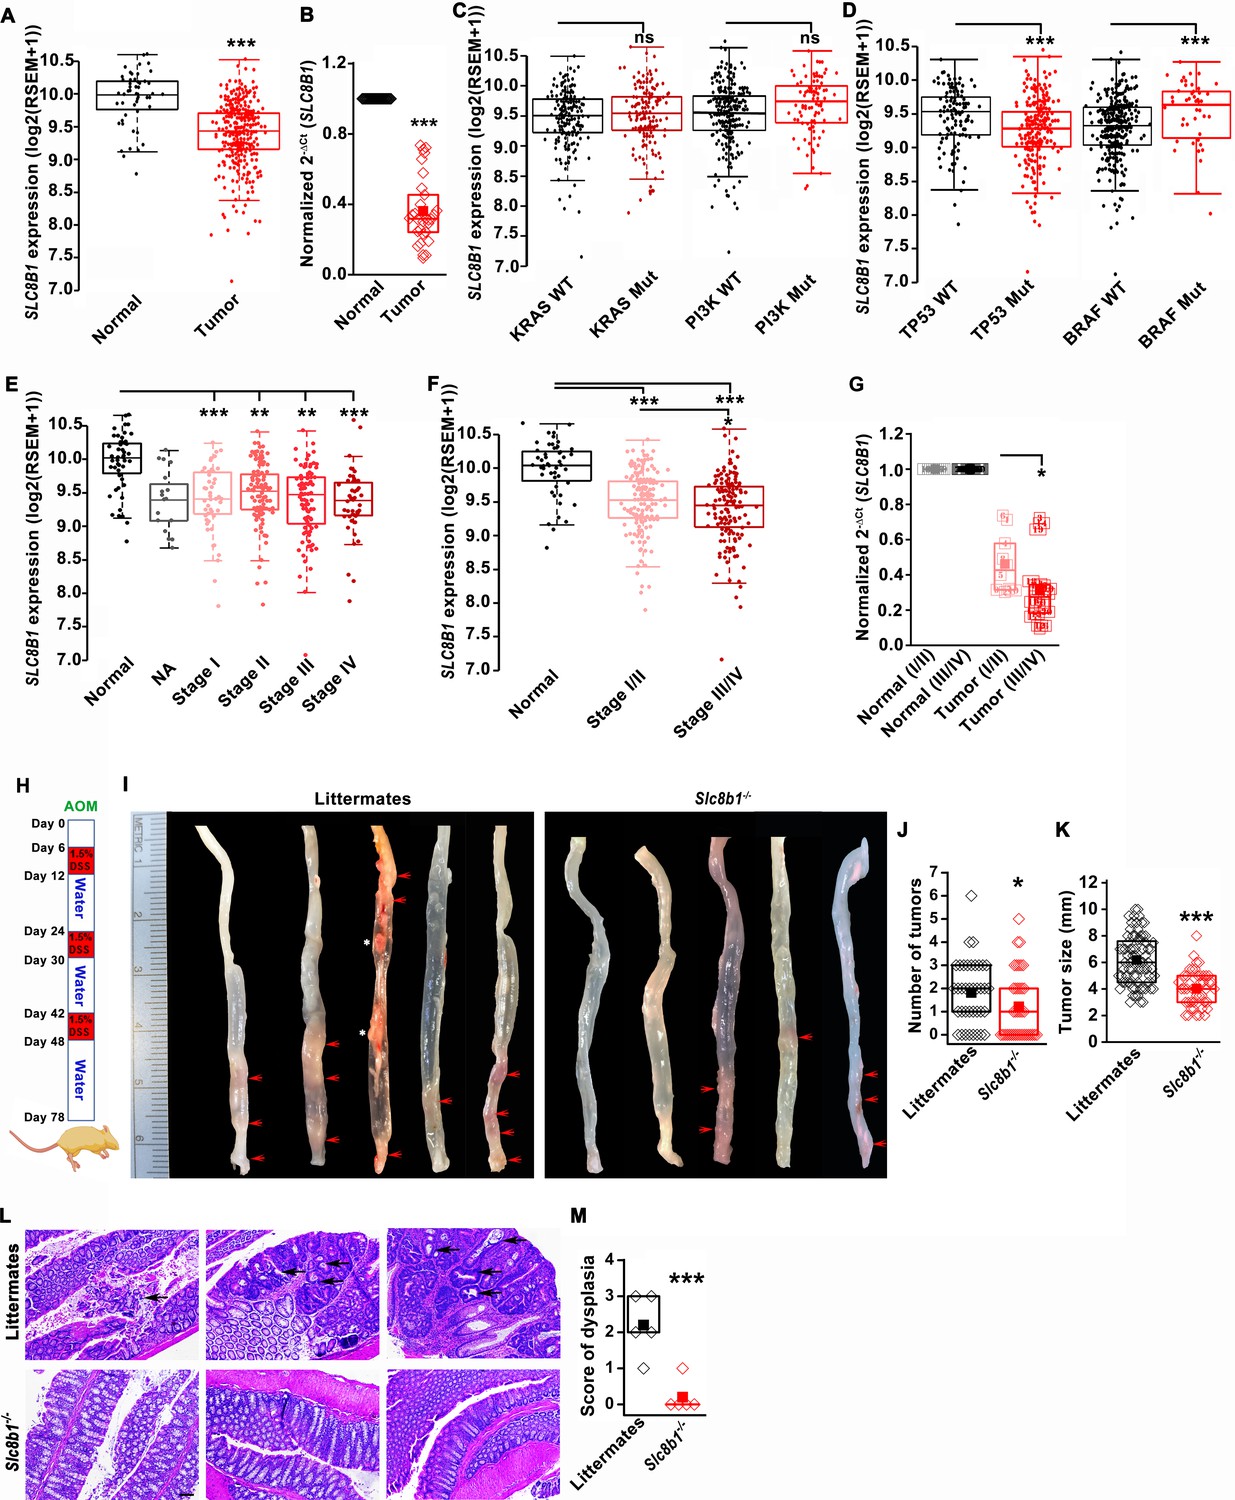
The expression of NCLX, a mtCa2+ extrusion mediator in CRC cells, is decreased in CRC tumor samples from human patients.
(A) TCGA data analysis showing SLC8B1 mRNA levels in tumor tissues and adjacent normal tissues of COADREAD (colon and rectal adenocarcinoma) patients. Each data point represents an individual sample. (B) RT-qPCR analysis of SLC8B1 mRNA in tumor tissues (n = 30) and adjacent normal tissues (n = 30) of CRC patients from Penn State University Hospital. (C, D) TCGA data analysis showing SLC8B1 mRNA level in patients with and without KRAS, PI3K, (C) TP53, and BRAF (D) mutation. (E–F) TCGA data analysis showing NCLX mRNA in tumors at different cancer stages (stages I–IV) (E) or combined stage I/II (early stage) and stage III/IV (late-stage) (F) of COADREAD tissues compared to adjacent normal tissues. NA = stage not known (G) RT-qPCR analysis of SLC8B1 mRNA in combined stage I/II (n = 9) and stage III/IV (n = 20) CRC tumor samples compared to their adjacent normal tissues obtained from Penn State University hospital. (H) Schematic representation of the colitis-associated regimen of AOM and DSS treatment. (I–K) Five representative colons from each experimental group are shown (I), quantification of the number of tumors (J), and tumor volume (K) in NCLX KO and control littermate mice at day 78 after AOM/DSS treatment. The red arrow indicates polyps in the colon and the white star represents fat tissue; n ≥ 30 mice per group. (L, M) Three replicates of representative H and E staining of colon sections where black arrows indicate dysplasia (scale bar 500 µm) (L), histology score of dysplasia (scale bar 500 µm) (M). Kruskal-Wallis ANOVA was performed to test single variables between the two groups. *p<0.05, **p<0.01, and ***p<0.001.
-
Figure 1—source data 1
Source data Figure 1.
- https://cdn.elifesciences.org/articles/59686/elife-59686-fig1-data1-v3.xlsx
Figure 1—figure supplement 1
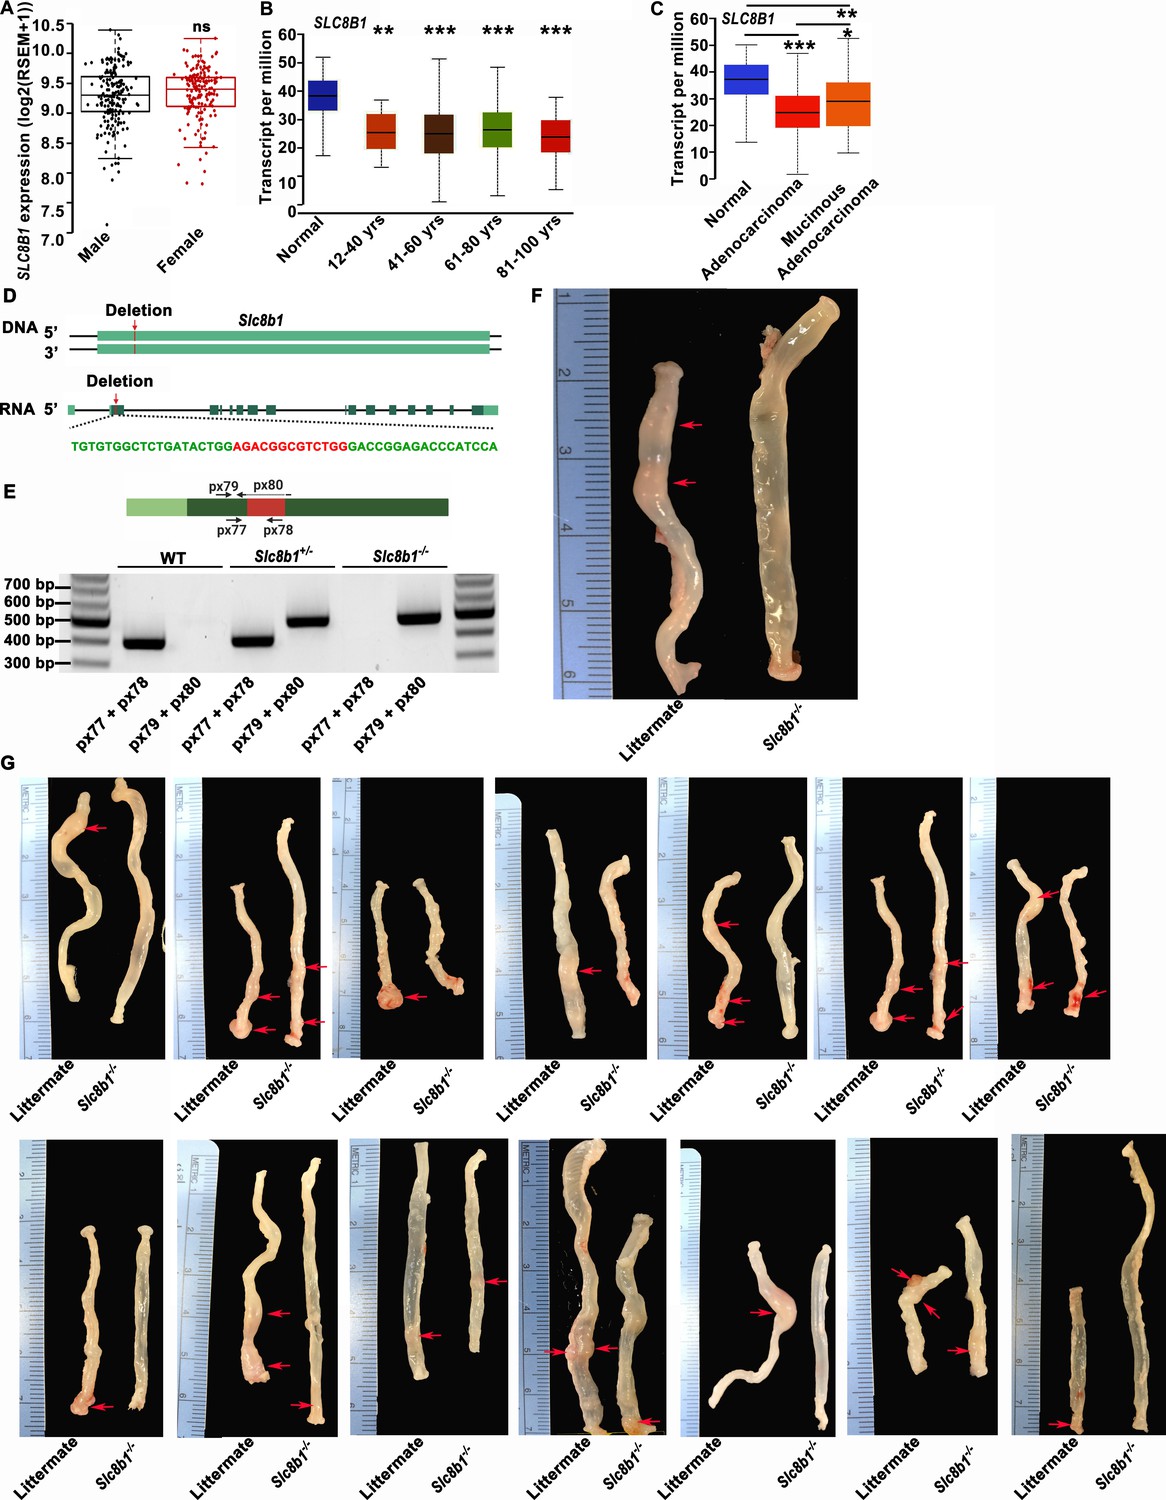
Loss of NCLX reduces tumor number and size in the colitis-associated cancer model.
(A) TCGA data analysis showing SLC8B1 mRNA levels in tumors of male and female COADREAD patients. (B, C) TCGA data analysis showing a comparison of SLC8B1 mRNA levels in COAD patients based on age (B) and the origin of adenocarcinoma (C). (D) Cartoon depicting the position of the nucleotides deleted from the Slc8b1 gene in Slc8b1-/-(NCLX KO) mice. The red color depicts the deleted region, the light green bar represents the Slc8b1 gene, and the dark green boxes represent the coding regions in the exons. (E) Cartoon representing the annealing position of the primer pair sets used for genotyping NCLX KO mice, and products of the PCR performed on genomic DNA from wild type (WT), heterozygotes (Slc8b1-/+), and NCLX KO mice tails. (F, G) Magnified image of a colon from an NCLX KO mouse and a littermate control mouse where the tumors are marked by red arrows (F) and colons isolated at day 78 from fifteen NCLX KO mice and control littermate mice subjected to AOM/DSS treatment (G). In TCGA analysis, each data point represents individual patients. Kruskal-Wallis ANOVA was used to calculate statistics. *p<0.05, **p<0.01, and ***p<0.001.
Figure 2 with 1 supplement
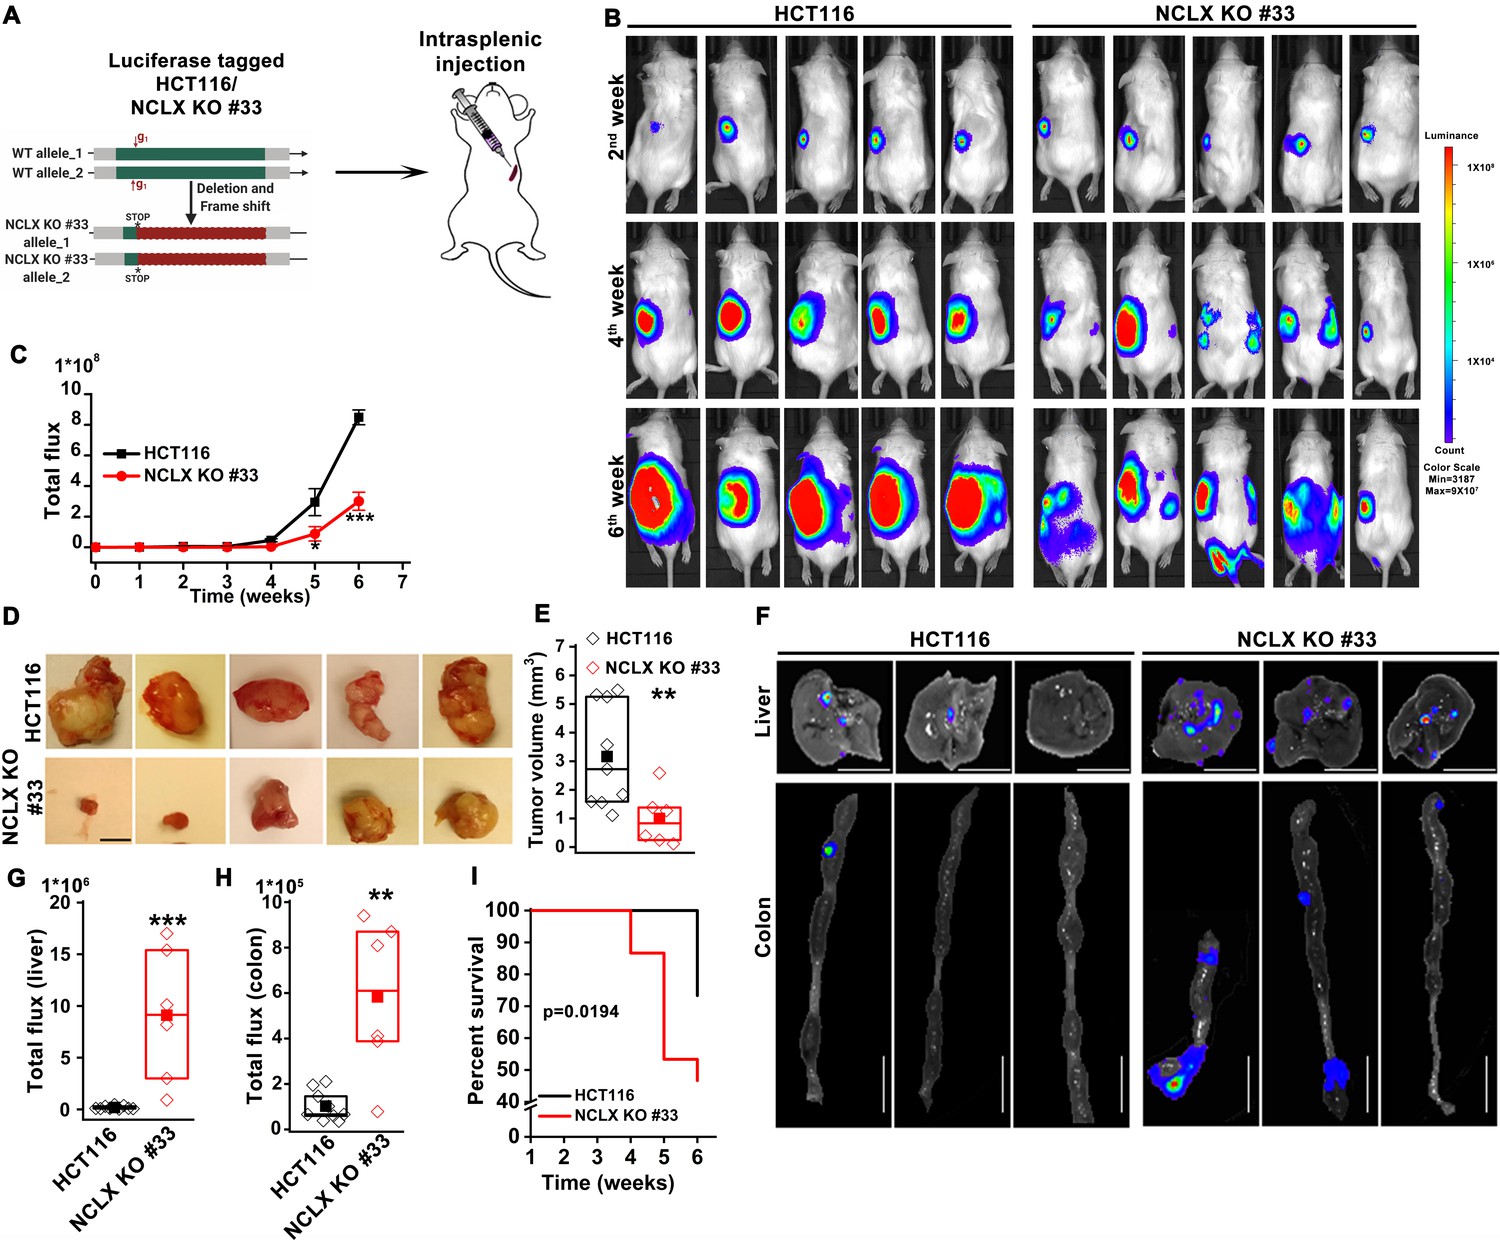
Loss of NCLX has a dichotomous role in tumor growth and metastasis in vivo.
(A) Schematic representation of CRISPR-generated HCT116 NCLX KO #33 cells. Luciferase-tagged control HCT116 and HCT116 NCLX KO #33 cells were injected at 5 × 10⁵ cells/mice into spleens of male NOD-SCID mice. (B–C) Representative bioluminescence images (five mice per group) of cancer progression and metastasis in male NOD-SCID mice injected with luciferase-tagged HCT116 cells or HCT116 NCLX KO #33 cells (B) and quantification of whole-body luciferase count (C). (n = 15 mice per group). (D, E) Representative images of the primary tumors at the site of injection (D) and quantification of primary tumor volume at the time of sacrifice (E). Scale bar, 5 mm. (F–H) Representative image of the liver (scale bar, 5 mm) and corresponding colon (scale bar, 1 cm) (F), quantification of luciferase count from the liver (G) and the colon (H) from NOD-SCID mice injected with HCT116 cells or HCT16 NCLX KO #33 cells. (I) Survival curve of NOD-SCID mice injected with either HCT116 cells or HCT116 NCLX KO #33 cells (*p<0.0194, n = 15 mice per group). Kruskal-Wallis ANOVA was performed to test single variables between the two groups. *p<0.05, **p<0.01, and ***p<0.001.
-
Figure 2—source data 1
Source data Figure 2.
- https://cdn.elifesciences.org/articles/59686/elife-59686-fig2-data1-v3.xlsx
Figure 2—figure supplement 1
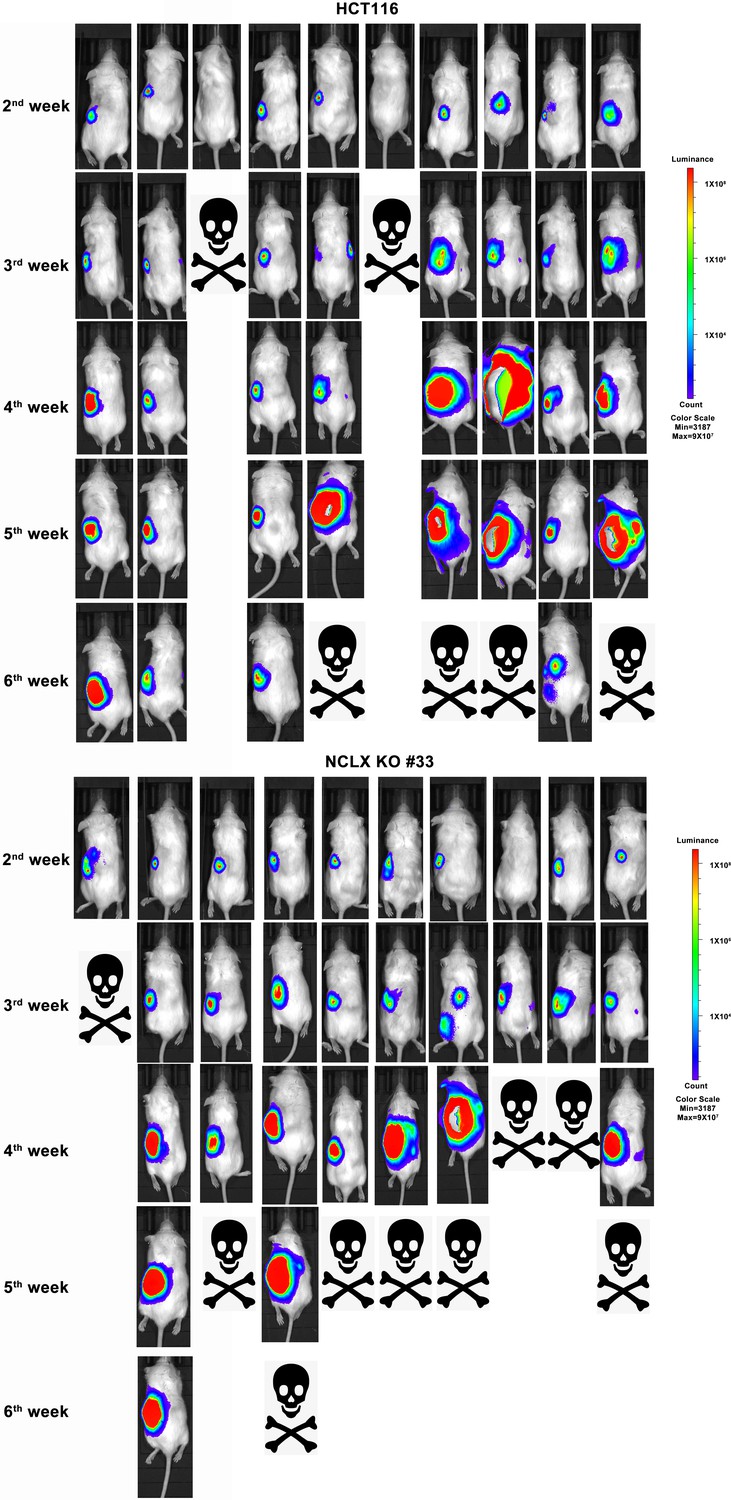
Xenografts of HCT116 cells and HCT116 NCLX KO #33 cells in NOD/SCID.
Bioluminescence images of male NOD/SCID mice injected with luciferase-tagged HCT116 cells or HCT116 NCLX KO #33 cells.
Figure 3 with 1 supplement
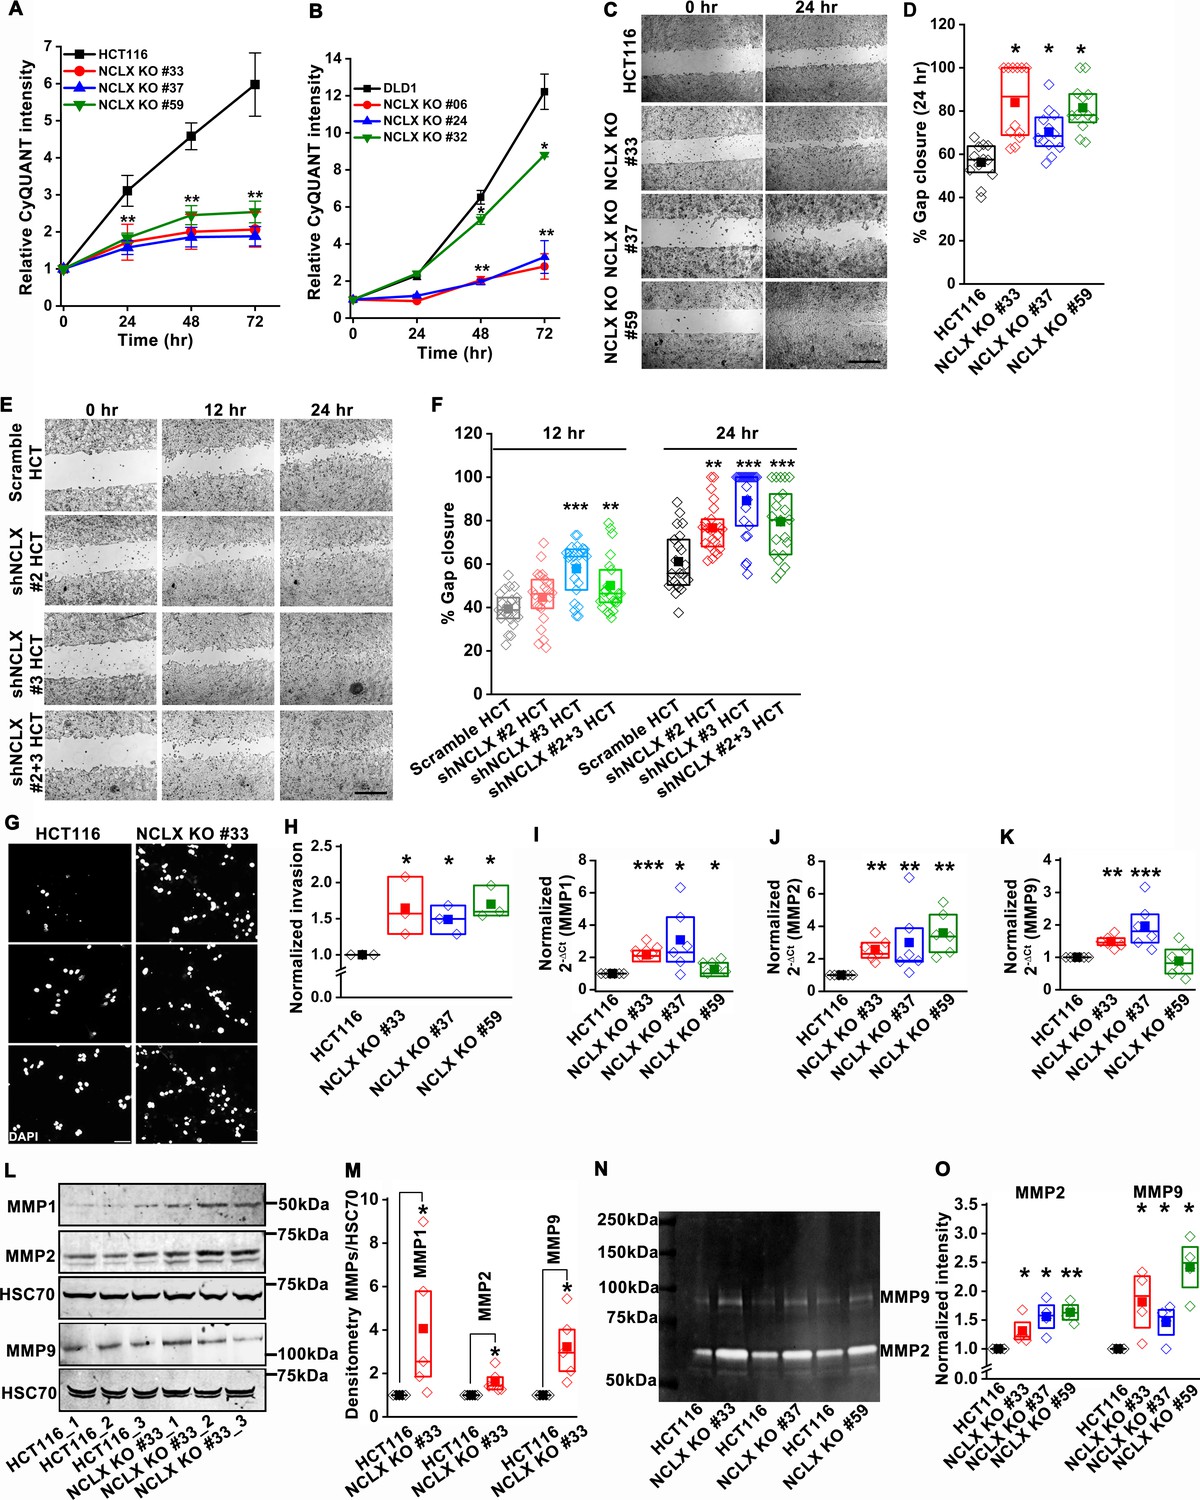
Loss of NCLX inhibits proliferation but enhances migration and invasion of CRC cells.
(A, B) CyQUANT proliferation assays of HCT116 cells (A), DLD1 cells (B), and their respective NCLX KO clones. (C, D) Representative bright-field images of in vitro wound healing migration assay (C), and quantification of % gap closure for HCT116 cells and clones of HCT116 NCLX KO cells after 24 hr (D). Scale bar, 1 mm. (E, F) In vitro migration assays of control HCT116 cells infected with either scramble shRNA or two different shRNA sequences against NCLX (E) and quantification of % gap closure (F). Scale bar, 1 mm. (G, H) Representative images of invasion assays performed in triplicates (G), and quantification of normalized invasion of HCT116 cells and clones of HCT116 NCLX KO cells (H). Scale bar, 50 µm. (I–K) RT-qPCR data showing mRNA expression for MMP1 (I), MMP2 (J), and MMP9 (K) in HCT116 cells and clones of HCT116 NCLX KO cells. (L, M) Western blot probed with anti-MMP1, anti-MMP2, anti-MMP9, and anti-HSC70 antibody as a loading control (L), and quantification of MMPs band intensities normalized to that of HSC70 (M). (N, O) Representative gelatin zymogram showing MMP2 and MMP9 activity from HCT116 cells, and their respective clones of HCT116 NCLX KO cells (N), quantification of band intensities of MMP2 and MMP9 activities (O). All experiments were performed ≥three times with similar results. Statistical significance was calculated using one-way ANOVA followed by a post-hoc Tukey test, except for M and O, where the paired t-test was performed. *p<0.05, **p<0.01 and ***p<0.001.
-
Figure 3—source data 1
Source data Figure 3.
- https://cdn.elifesciences.org/articles/59686/elife-59686-fig3-data1-v3.xlsx
Figure 3—figure supplement 1
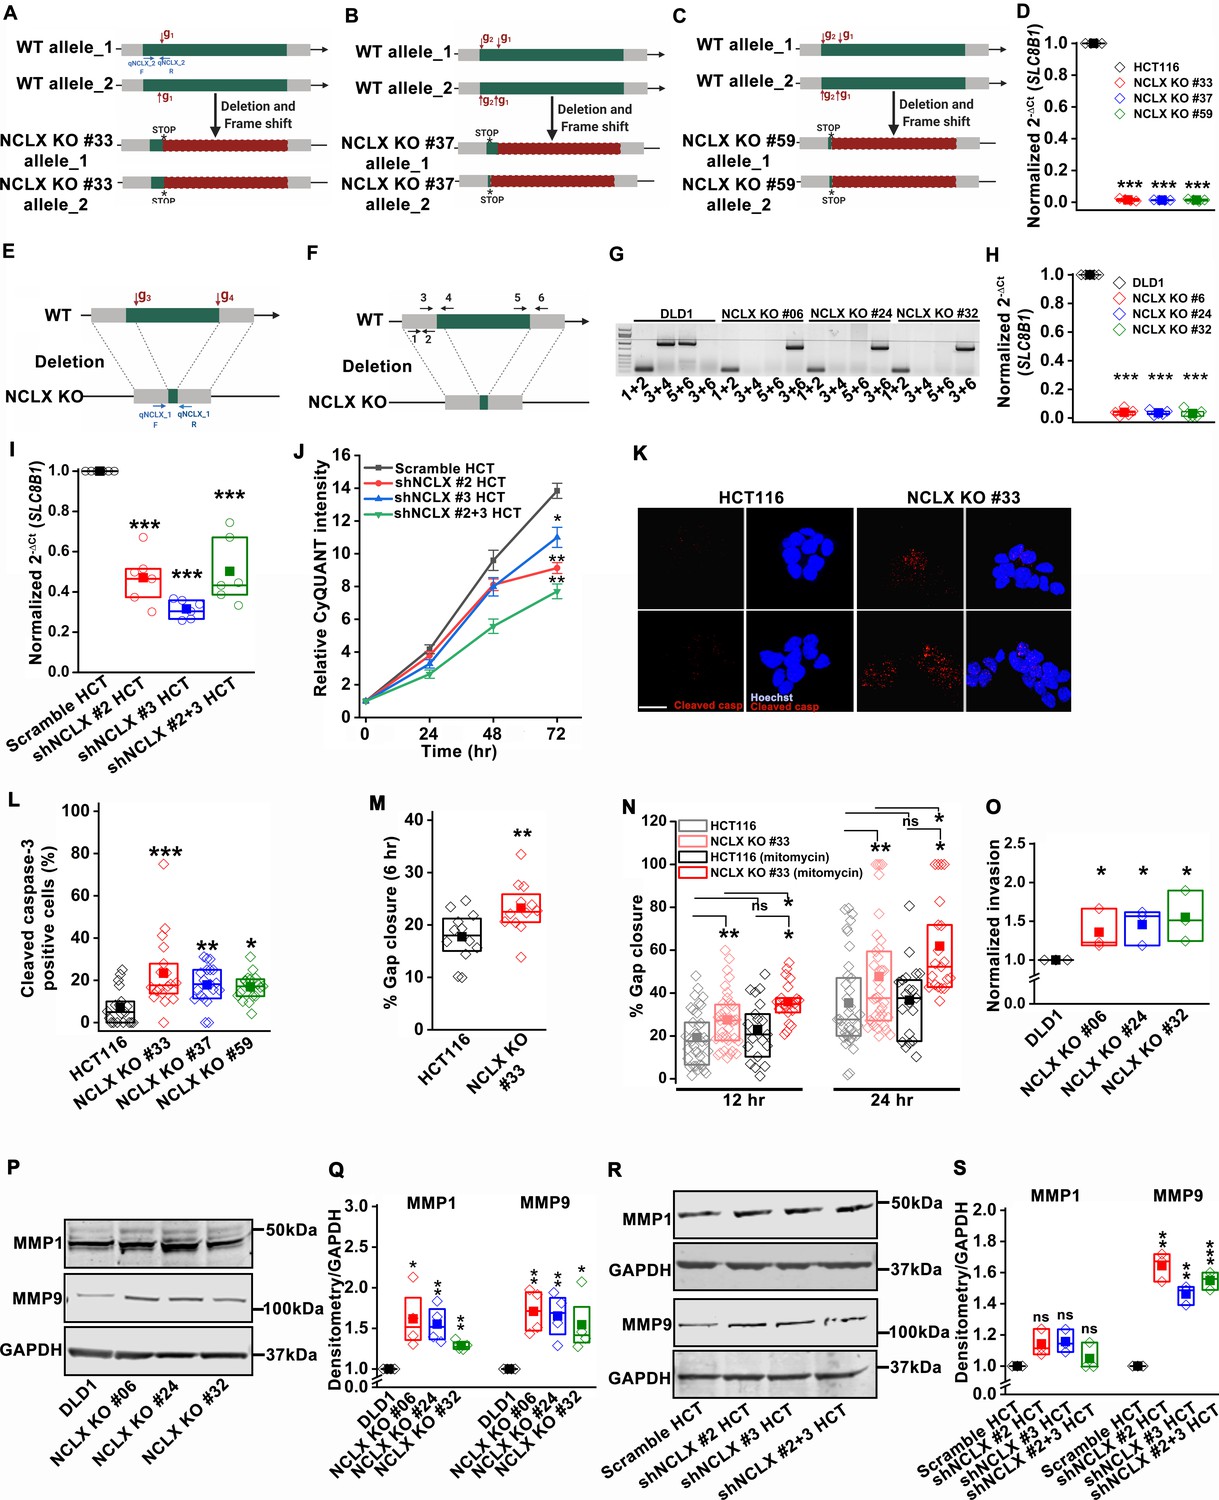
Deletion of NCLX results in reduced proliferation and increased migration and invasion.
(A–D) CRISPR/Cas9 knockout strategy of the SLC8B1 gene in NCLX KO clones #33 (A), #37 (B), and #59 (C) with g1 and g2 representing the cut site and red box non-translated region. Location of primers used for RT-qPCR are shown in (A), and SLC8B1 mRNA levels in clones of HCT116 NCLX KO cells compared to control HCT116 cells (D). (E–H) The binding site of guide RNA (gRNA) g3 and g4 on the SLC8B1 gene, the subsequent deletion, and location of primers used for RT-qPCR (E). The position on the SLC8B1 gene of the genotyping primers used to screen gene knockout of NCLX KO clones (F), PCR data on genomic DNA showing amplified products with primer pair sets (G), and RT-qPCR data from DLD1 cells and clones of DLD1 NCLX KO cells normalized to tubulin (H). (I) RT-PCR data showing SLC8B1 mRNA relative to tubulin in HCT116 cells transfected with shRNA against NCLX (shNCLX #2, shNCLX #3, and shNCLX #2+3) and normalized to scramble control. (J) Comparison of proliferation between HCT116 cells infected with scramble shRNA and two different NCLX shRNA sequences. (K, L) Representative image of HCT116 cells and HCT116 NCLX KO #33 cells stained with Hoechst and anti-cleaved caspase-3 antibody (K), and quantification of the percentage of cells showing cleaved caspase-3 staining (L). Each data point represents one replicate with each replicate representing the average values from at least three image fields. Total cell counted, HCT116 cells (n = 100), and HCT116 NCLX KO #33 cells (n = 135). (M, N) Quantification of % gap closure for HCT116 cells and clones of HCT116 NCLX KO cells after 6 hr (M), and with and without mitomycin (300 µM) treatment for 12 and 24 hr (N). (O) Quantification of in vitro invasion of DLD1 cells and clones of DLD1 NCLX KO cells. (P, Q) Western blots probed with anti-MMP1, anti-MMP9, and anti-GAPDH antibodies (P). Quantification of protein band intensities between DLD1 cells and DLD1NCLX KO clones relative to GAPDH (Q). (R, S) Western blots probed with anti-MMP1, anti-MMP9, and anti-GAPDH antibodies (R). Quantification of protein band intensities between HCT116 cells infected with scramble shRNA and NCLX shRNA #2, #3, and #2+three relative to GAPDH (S). All experiments were replicated ≥three times with similar results. Statistical significance was calculated using one-way ANOVA followed by a post-hock Tukey test, except for L, O, Q, and S, where paired t-test was used. *p<0.05, **p<0.01, and ***p<0.001.
-
Figure 3—figure supplement 1—source data 1
Source data Figure 3—figure supplement 1.
- https://cdn.elifesciences.org/articles/59686/elife-59686-fig3-figsupp1-data1-v3.xlsx
Figure 4 with 2 supplements
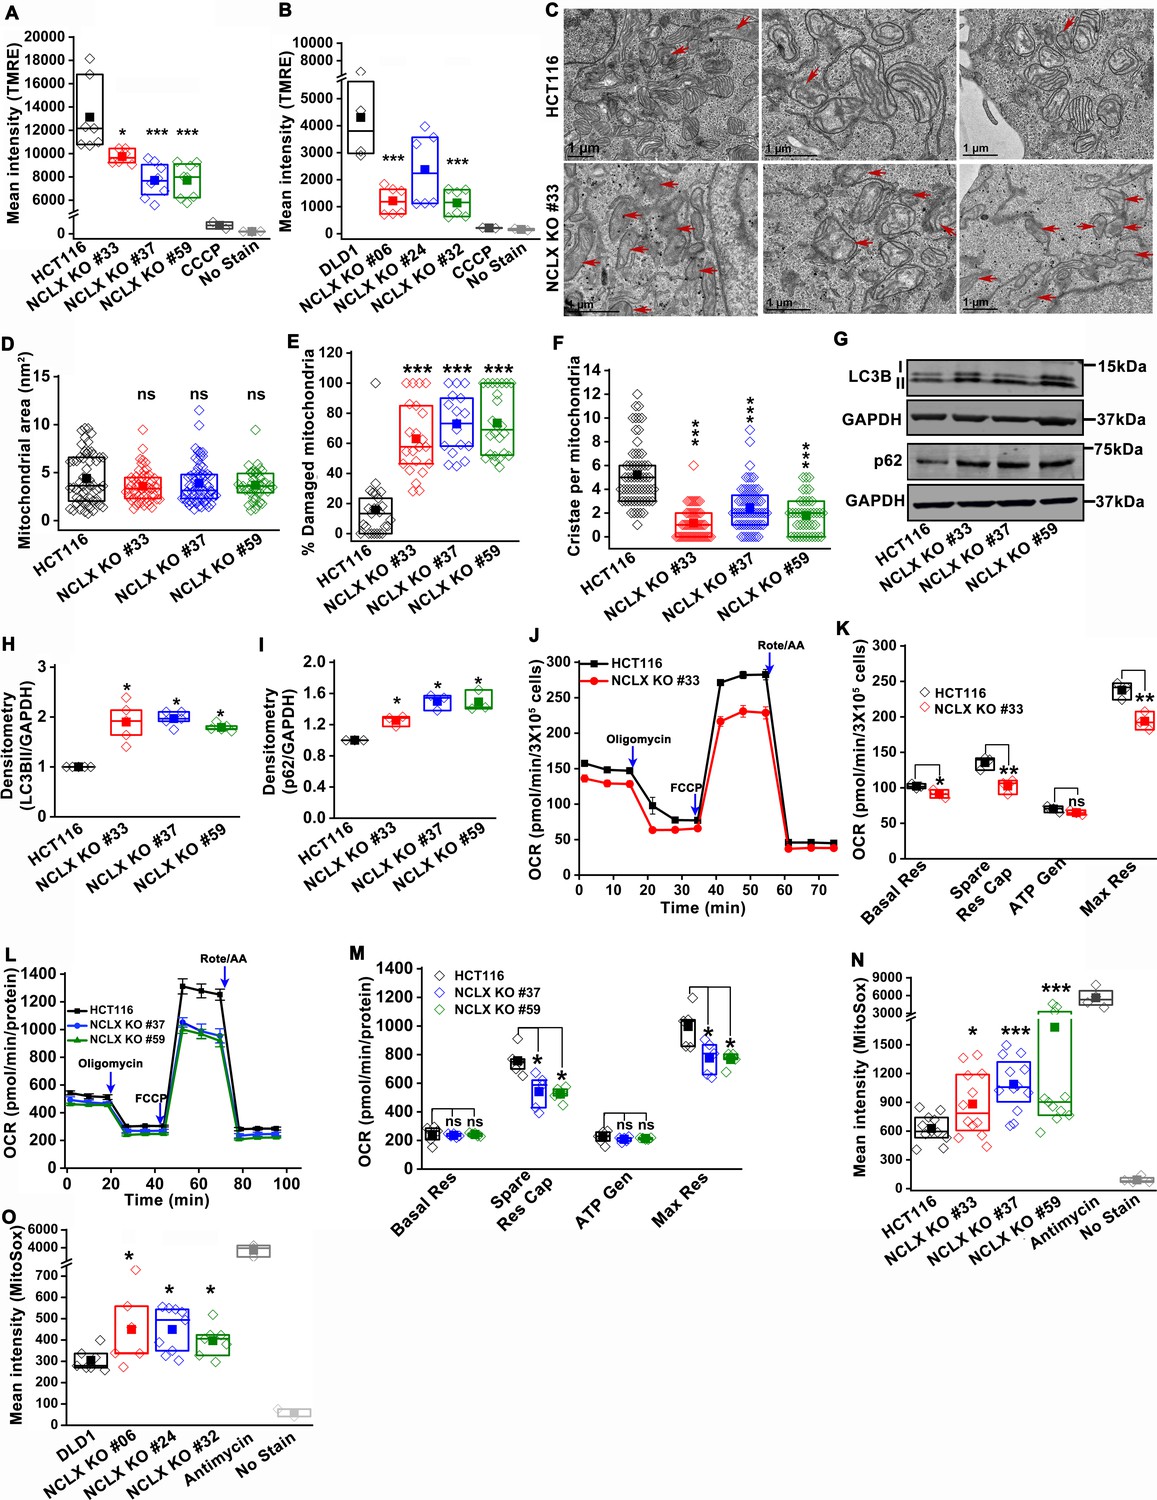
Abrogation of NCLX function in CRC cells causes mitochondrial damage, and enhances mitochondrial ROS.
(A, B) Flow cytometric analysis of mitochondrial membrane potential using the dye TMRE in HCT116 cells (A) and DLD1 cells (B) and their respective NCLX KO clones. Each data point represents one experimental replicate. 100 µM CCCP was added to cells as a positive control, and unstained cells were used as a negative control. (C) Representative images of a transmission electron micrograph of HCT116 cells and HCT116 NCLX KO cells. Red arrows indicate damaged mitochondria. (D–F) Quantification of mitochondrial area (D), number of damaged mitochondria (E), and number of cristae per mitochondria (F) in HCT116 cells and clones of HCT116 NCLX KO cells. (G–I) Western blots labeled with indicated antibodies with anti-GAPDH used as a loading control (G) and quantification of band intensity of LC3B II (H) and p62 (I) normalized to GAPDH in HCT116 cells and clones of HCT116 NCLX KO cells. (J–M) Oxygen consumption rate (OCR) of HCT116 cells and HCT116 NCLX KO clones (J,L), and quantification of basal respiration (Basal Res), spare respiratory capacity (Spare Res Cap), ATP generation (ATP Gen), and maximum respiration (Maximal Res) (K, M). (N, O) Flow cytometric analysis of mitochondrial ROS levels measured with the dye MitoSox in HCT116 cells (N) and DLD1 cells (O) and their respective NCLX KO clones. As a positive control, 50 µM antimycin was used and unstained cells were used as a negative control. All experiments were performed ≥three times with similar results. Statistical significance was calculated using one-way ANOVA followed by a post-hock Tukey test, except figure H, and I, where paired t-test was used. *p<0.05, **p<0.01, and ***p<0.001.
-
Figure 4—source data 1
Source data Figure 4.
- https://cdn.elifesciences.org/articles/59686/elife-59686-fig4-data1-v3.xlsx
Figure 4—figure supplement 1
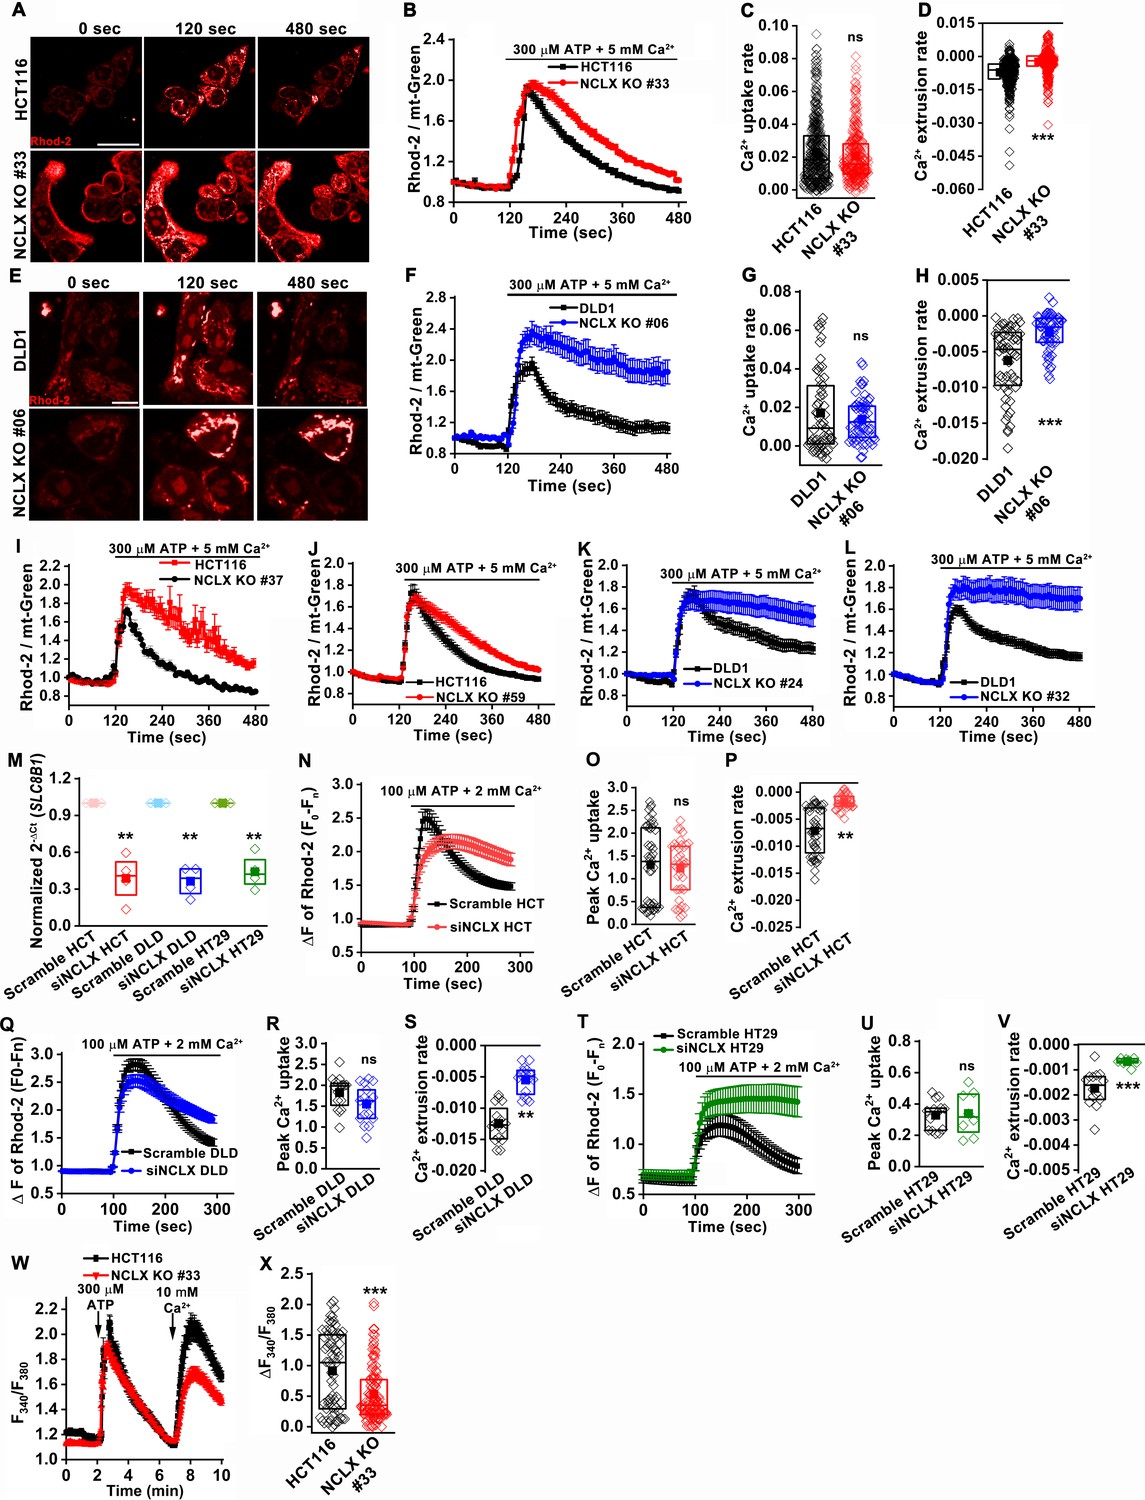
Loss of NCLX in CRC cells inhibits mtCa2+ extrusion.
(A) Representative images of HCT116 cells and HCT116 NCLX KO cells loaded with the mitochondrial Ca2+ dye Rhod-2 AM. Cells were stimulated with 300 µM ATP in 5 mM extracellular Ca2+ at time 0, and the intensity of Rhod-2 was monitored at different times after ATP stimulation. (B–D) The fluorescence ratio of Rhod-2/mt-Green in response to ATP stimulation is monitored as a function of time in HCT116 cells (n = 370), and HCT116 NCLX KO#33 cells (n = 340) loaded with Rhod-2 and the mitochondrial marker mt-Green (used to normalize the Rhod-2 signal). Stimulation with 300 µM ATP in 5 mM extracellular Ca2+ causes rapid mitochondrial Ca2+ uptake (ascending phase) followed by Ca2+ extrusion (descending phase) (B). Quantification of Ca2+ uptake rate (C) and Ca2+ extrusion rate (D) from all cells in (B). (E) Representative images of DLD1 cells and DLD1 NCLX KO#6 cells loaded with the mitochondrial Ca2+ dye Rhod-2 AM and stimulated with 300 µM ATP in 5 mM extracellular Ca2+ in a manner similar to (A). (F–H) Similar recordings and analysis as (B–D), except that DLD1 cells (n = 63) and DLD1 NCLX KO #6 cells (n = 60) were utilized. (I–L) ATP-stimulated mitochondrial Ca2+ uptake and Ca2+ extrusion measured with the dye Rhod-2 in HCT116 (n = 72), HCT116 NCLX KO #37 (n = 118) cells (I), HCT116 (n = 198), and HCT116 NCLX KO #59 (n = 256) cells (J). Similar recordings in DLD1 (n = 109), DLD1 NCLX KO #24 (n = 90) cells (K), DLD1 (n = 179) and DLD1 NCLX KO #32 (n = 107) cells (L). The Rhod-2 intensity was normalized to mitoGFP intensity. The traces are represented as mean ± S.E. (M) RT-qPCR data depicting SLC8B1 mRNA levels in HCT116, DLD1, and HT29 cells transfected with siRNA against NCLX compared to their respective siRNA control-transfected cells. (N–P) ATP-stimulated mitochondrial Ca2+ uptake and Ca2+ extrusion measured with the dye Rhod-2 in scramble HCT116 (n = 48) and siNCLX HCT116 (n = 38) (N), with rates of Ca2+ uptake (O) and Ca2+ extrusion (P). (Q–S) Similar recordings to (N–P) in DLD1 cells with scramble DLD1(n = 16) and siNCLX DLD1(n = 17) (Q), rates of Ca2+ uptake (R) and Ca2+ extrusion (S). (T–V) Similar recordings to (N–P) and (Q–S) in HT29 cells with scramble HT29 (n = 14) and siNCLX HT29 (n = 8) (T) and rates of Ca2+ uptake (U) and Ca2+ extrusion (V). All traces are represented as mean ± S.E. (W, X) Representative cytosolic Ca2+ measurements in HCT116 (n = 110) and HCT116 NCLX KO #33 cells (n = 100) measured with Fura-2 in response 300 µM ATP applied first in nominally Ca2+-free external solution and subsequently with 10 mM external Ca2+. The traces are represented as mean ± S.E (O), and peak SOCE after addition of 10 mM Ca2+ is quantified in (P). All experiments were replicated ≥three times with similar results. Kruskal-Wallis ANOVA was used to calculate statistical significance. *p<0.05, **p<0.01, and ***p<0.001.
-
Figure 4—figure supplement 1—source data 1
Source Data Figure 4—figure supplement 1.
- https://cdn.elifesciences.org/articles/59686/elife-59686-fig4-figsupp1-data1-v3.xlsx
-
Figure 4—figure supplement 1—source data 2
Source Data Figure 4—figure supplement 2.
- https://cdn.elifesciences.org/articles/59686/elife-59686-fig4-figsupp1-data2-v3.xlsx
Figure 4—figure supplement 2
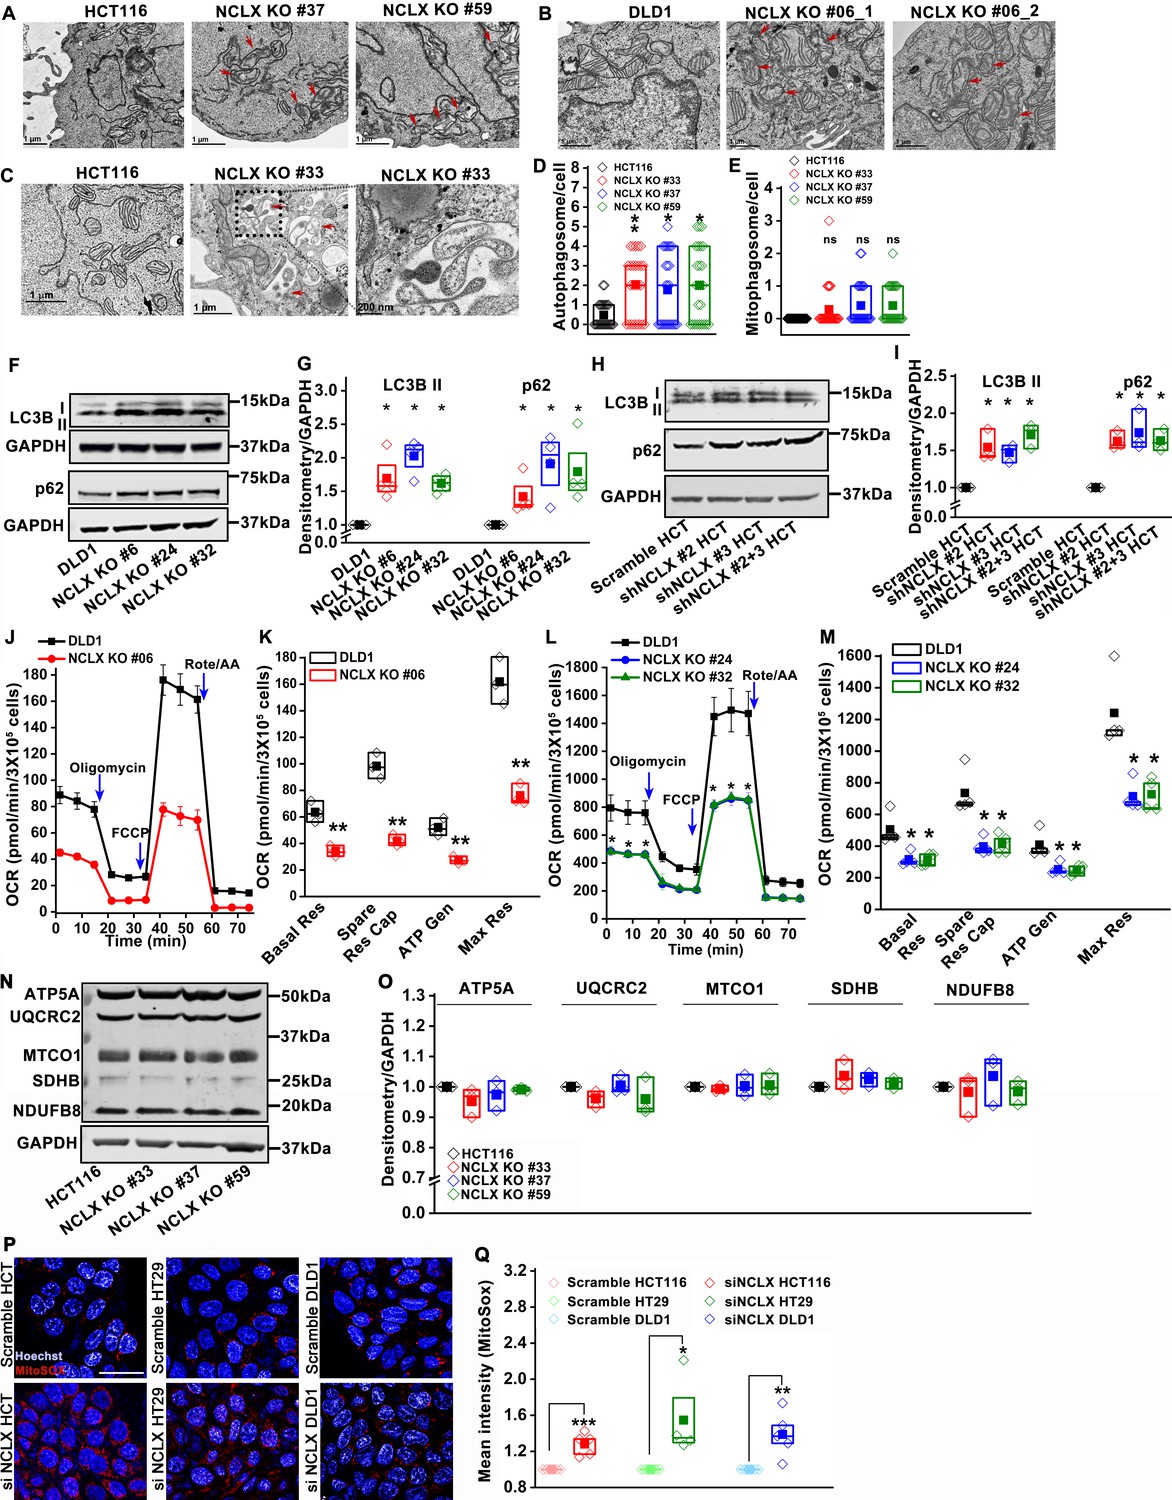
Loss of NCLX causes mitochondrial damage.
(A–C) Representative transmission electron micrographs (TEM) of mitochondria in HCT116, HCT116 NCLX KO #37 cells, HCT116 NCLX KO #59 cells (A), DLD1 cells, DLD1 NCLX KO#06 cells (B) with red arrows point to damaged mitochondria. TEM of mitochondria in HCT116 and HCT116 NCLX KO #33 cells, and the magnified image shows mitochondria encapsulated in a phagosome (C) with red arrow showing mitophagosomes (D, E) Quantification of autophagosome (D) and mitophagosomes (E) in HCT116 and HCT116 NCLX KO clones. (F, G) Western blots showing levels of LC3B and p62 in control DLD1 cells NCLX KO clones of DLD1 cells (F), and quantification of band intensity relative to loading control GAPDH (G). (H, I) Western blots probed with anti-LC3B and anti-p62 in HCT116 cells infected with control scrambled shRNA or three different NCLX shRNA conditions (H). Quantification of band intensity relative to HSC70 (I). (J–M) Measurement of OCR in DLD1 cells and DLD1 NCLX KO clone #06 (J, K) and from DLD1 NCLX KO clone #24, and clone #32 and (L, M). Quantification of Basal respiration (Basal Res), Spare respiratory capacity (Spare Res Cap), ATP generation (ATP Gen), and maximal respiration (Max Res) (K, M).(N, O) Western blots probed with a cocktail of antibody against electron transport chain complexes, including ATP5A for Complex-V, UQCRC2 for Complex-III, MTCO1 for Complex IV, SDHB for Complex-II, and NDUFB8 for Complex-I (N), and quantification of their band intensity (O). Same blot was probed with LC3B (Figure 4G) and OXPHOS proteins (Figure 4—figure supplement 2N). (P, Q) Representative images of mitoSox, and Hoechst fluorescence in siRNA control-transfected HCT116, HT29, and DLD1 cells with their respective siRNA NCLX-transfected cells (P). The mitoSox fluorescence intensity was quantified using flow cytometry (Q). All experiments were performed ≥three times. The statistics were calculated by paired t-test unless mentioned otherwise, *p≥0.05, **p≥0.01, ***p≥0.001.
Figure 5 with 1 supplement
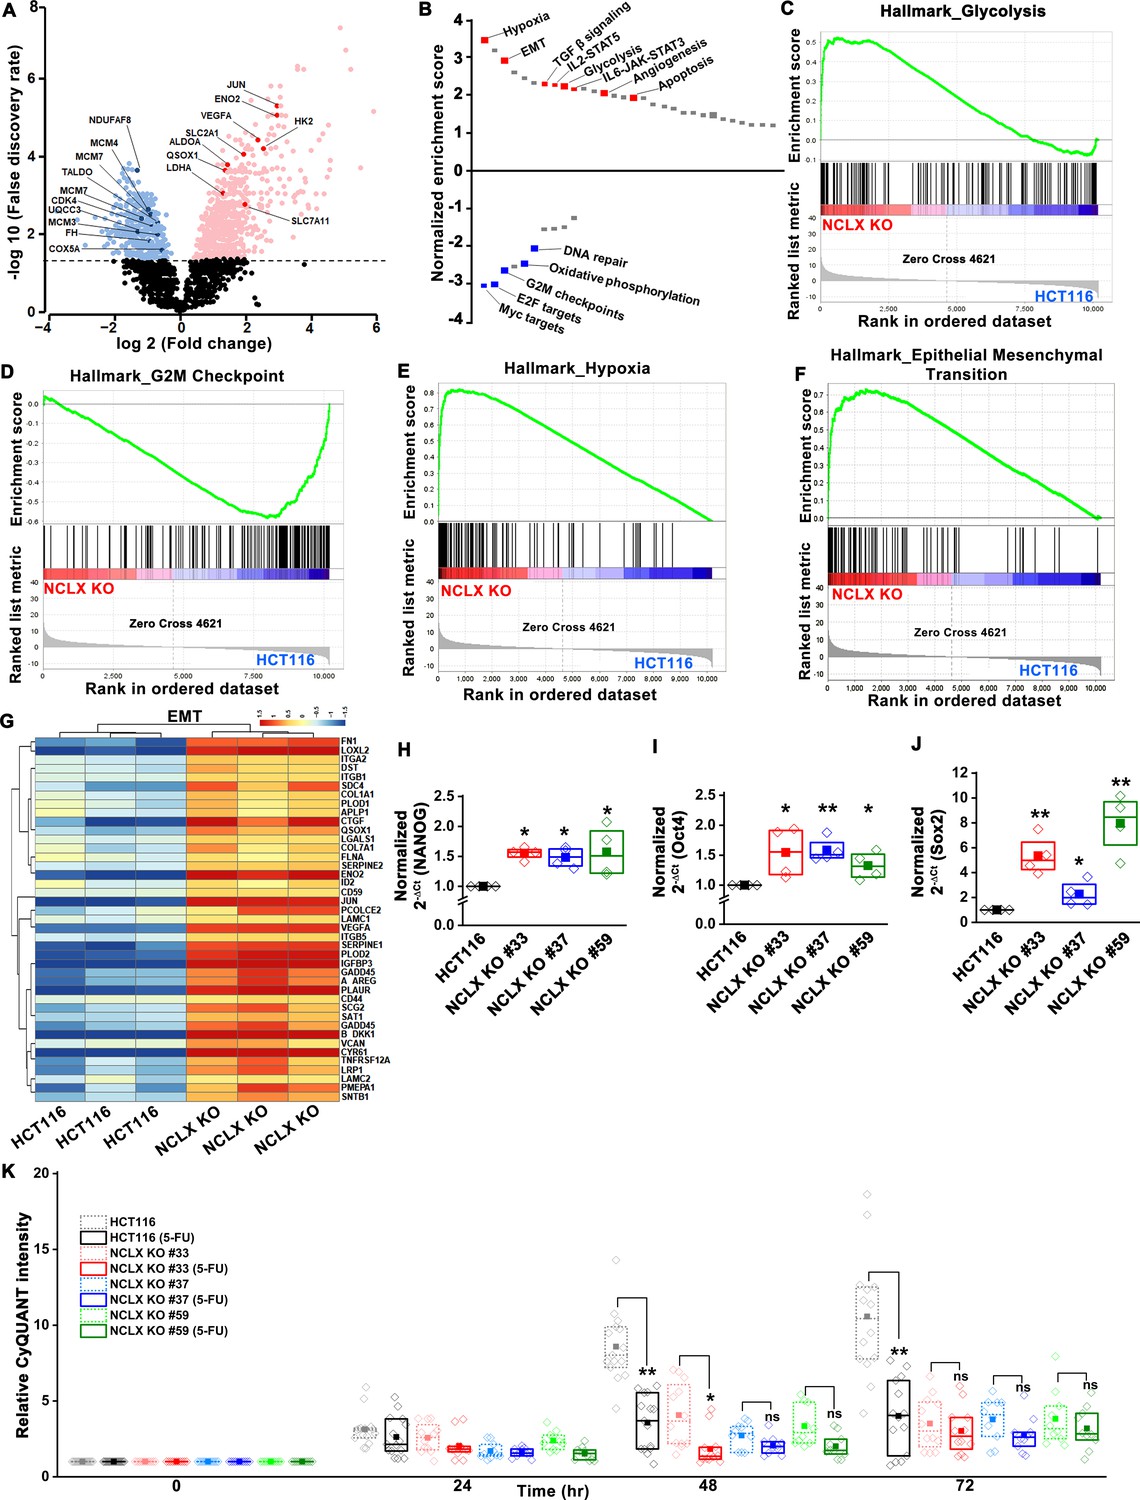
Loss of NCLX leads to pro-metastatic transcriptional reprogramming.
(A) Volcano plot of differentially expressed genes between HCT116 cells and HCT116 NCLX KO #33 cells showing Log2 fold change vs. false discovery rate. The thresholds in the figure correspond to a false discovery rate <0.05 and log2 fold change <−1.5 or>1.5. Genes that are significantly upregulated and downregulated are represented in pink and light blue, respectively. (B) Pathway analysis showing normalized enrichment score. Positive enrichment score shows upregulated pathways, and negative enrichment score depicts downregulated pathways. (C–F) GSEA analysis of HCT116 cells and HCT116 NCLX KO #33 cells show a positive correlation in the enrichment of hallmark of glycolysis genes (C), a negative correlation of hallmark of G2M checkpoint genes (D), a positive correlation of hallmark of hypoxia-related genes (E), and hallmarks of epithelial-to-mesenchymal transition genes (F). (G) The heat map shows significantly increased expression of EMT genes in HCT116 NCLX KO #33 cells as compared to control HCT116 cells. (H–J) RT-qPCR showing mRNA levels NANOG (H), octamer-binding transcription factor 4 (Oct4) (I), and SRY-Box Transcription Factor 2 (Sox2) (J) in HCT116 cells and clones of HCT116 NCLX KO cells. (K) The proliferation of HCT116 cells and HCT116 NCLX KO #33 cells with and without 10 µM 5-FU treatment. All experiments were performed ≥three times with similar results. Statistical significance was calculated using a paired t-test except for K, where one-way ANOVA followed by a post-hock Tukey test was used. *p<0.05, **p<0.01, and ***p<0.001.
-
Figure 5—source data 1
Source data Figure 5.
- https://cdn.elifesciences.org/articles/59686/elife-59686-fig5-data1-v3.xlsx
Figure 5—figure supplement 1

Abrogation of NCLX function leads to transcriptional reprogramming.
(A) Heat map of expression of glycolytic genes that are significantly different between HCT116 cells and HCT116 NCLX KO #33 cells. (B, C) Gene set enrichment analysis (GSEA), and of HCT116 cells, and HCT116 NCLX KO #33 shows enrichment of positive correlation of hallmark of apoptotic genes (B) and heat map of differentially expressed apoptosis-related genes in NCLX KO #33 cells (C). (D) Heat map of differentially regulated cell-cycle genes in HCT116 cells and HCT116 NCLX KO #33 cells. (E, F) Gene set enrichment analysis (GSEA) (E) and heat map (F) of significantly different genes between HCT116 cells and HCT116 NCLX KO #33 cells. (G–N) RT-qPCR data plotted as the 2-ΔCt mRNA value of SLC7A11 (G), GCLM (H) in clones of HCT116 NCLX KO cells normalized to control HCT116 cells, and SLC7A11 (I), GCLM (J) NANOG (K), Sox2 (L), Fox3 (M), and Oct4 (N) in clones of DLD1 NCLX KO cells relative to tubulin and normalized to control DLD1 cells. (O) Schematic representation of HIF1α induced transcriptional activation of SLC7A11 and GCLM, leading to increased transcription of stem cell genes NANOG, Oct4, and Sox2 in CRC cells. Statistical significance was calculated by one-way ANOVA followed by a post-hock Tukey. *p<0.05, **p<0.01, and ***p<0.001.
-
Figure 5—figure supplement 1—source data 1
Source Data Figure 5—figure supplement 1.
- https://cdn.elifesciences.org/articles/59686/elife-59686-fig5-figsupp1-data1-v3.xlsx
Figure 6 with 1 supplement
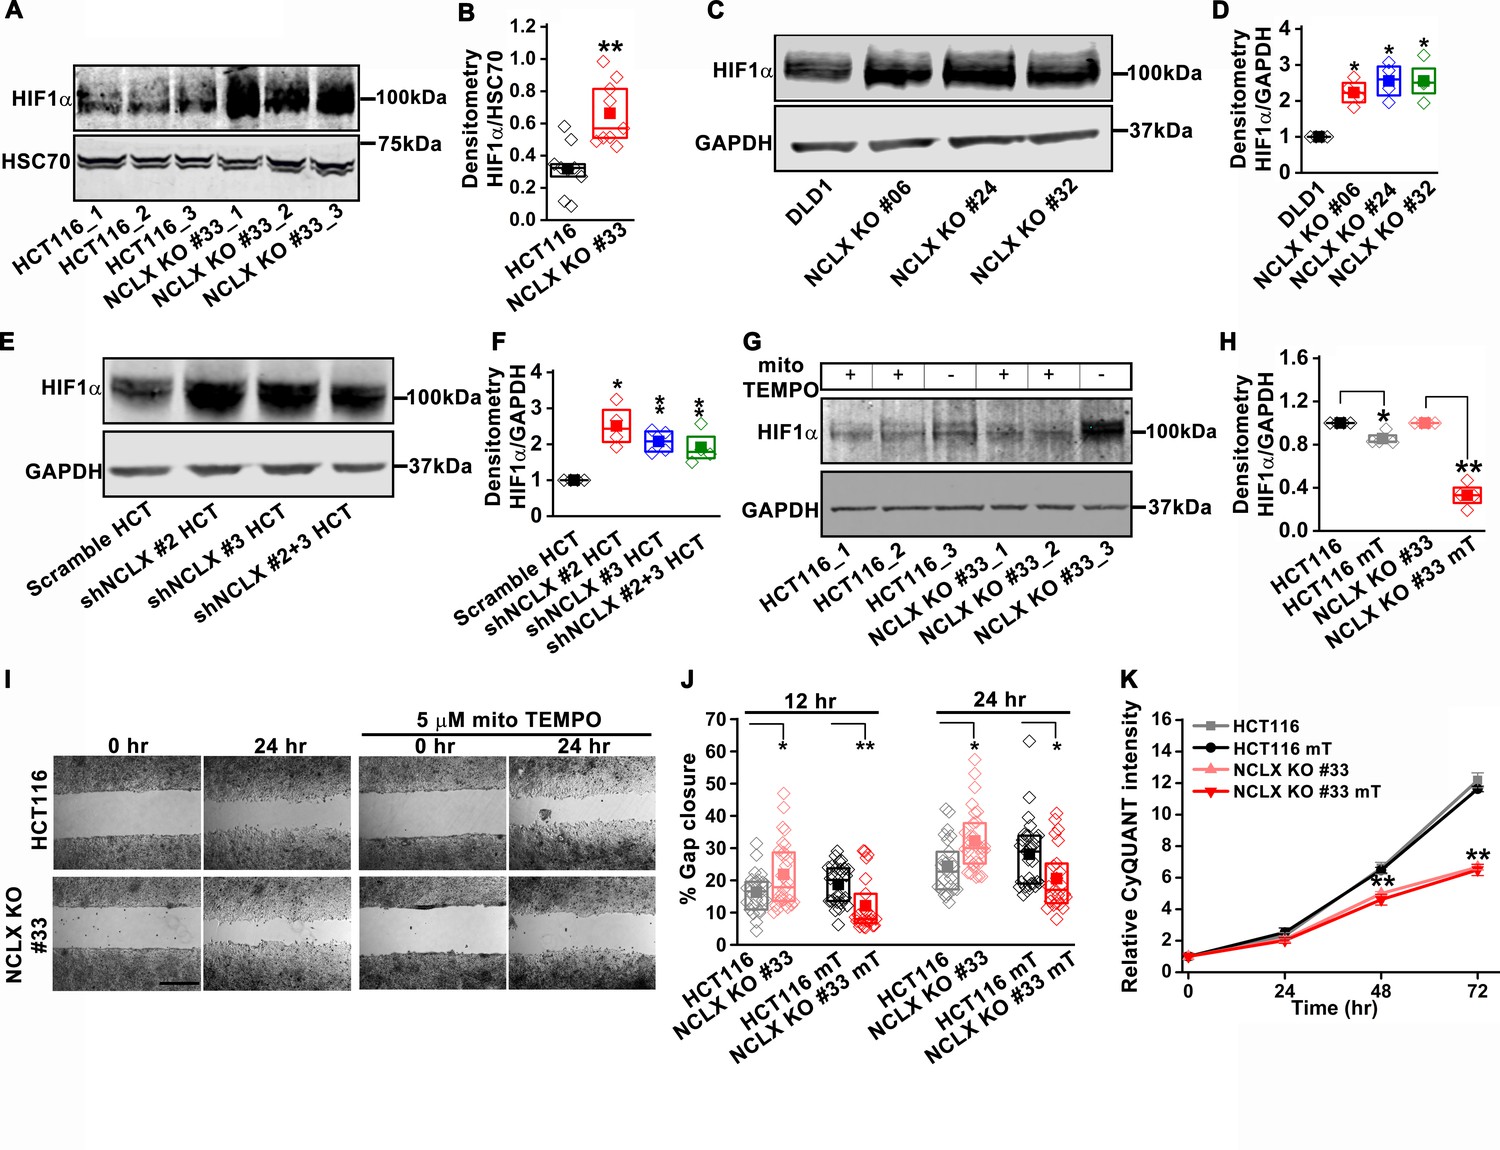
NCLX deficiency stabilizes HIF1α and regulates migration in a mtROS-dependent manner.
(A–F) Western blot of HCT116 cells and clones of HCT116 NCLX KO cells (A), DLD1 cells and clones of DLD1 NCLX KO cells (C) and HCT116 cells infected with either scramble shRNA or three combinations of shRNA against NCLX (E) probed with anti-HIF1α, anti-GAPDH and anti-HSC70 antibody as a loading control, and quantification of HIF1α band intensity relative to HSC70 or GAPDH (B, D, and F). (G, H) Western blot showing HIF1α proteins in HCT116 cells and clones of HCT116 NCLX KO cells after treatment with 5 µM mitoTEMPO overnight (G), and quantification of HIF1α band intensity normalized to GAPDH (H). (I, J) Representative bright-field images of in vitro migration assay (I), and quantification of % gap closure (J) of HCT116 cells and clones of HCT116 NCLX KO cells, with and without treatment with 5 µM mitoTEMPO. Scale bar, 1 mm. (K) Proliferation of HCT116 cells and HCT116 NCLX KO #33 cells with and without 5 µM mitoTEMPO. All experiments were performed ≥three times with similar results. Statistical significance was calculated using the paired t-test unless mentioned otherwise. *p<0.05, **p<0.01, and ***p<0.001.
-
Figure 6—source data 1
Source data Figure 6.
- https://cdn.elifesciences.org/articles/59686/elife-59686-fig6-data1-v3.xlsx
Figure 6—figure supplement 1
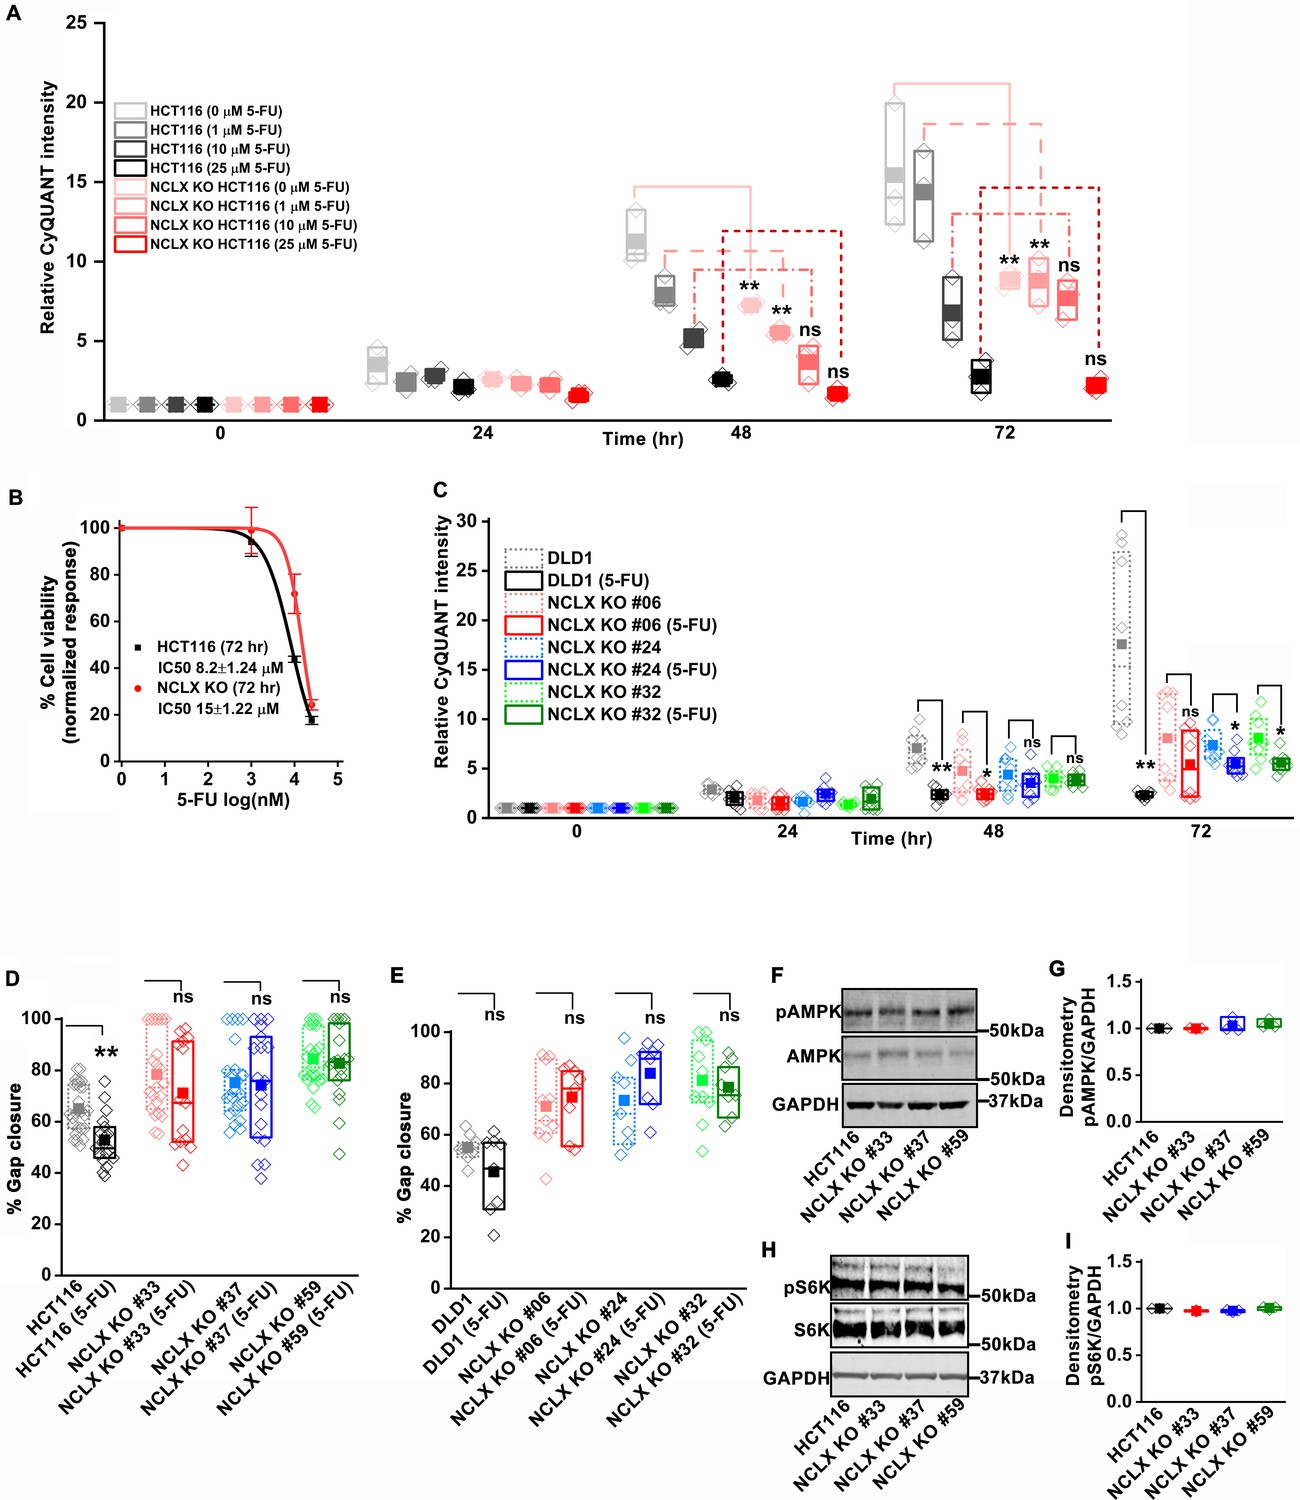
NCLX KO CRC cells show chemoresistance to 5-FU.
(A) The proliferation of HCT116 cells and HCT116 NCLX KO #33 cells in the presence of 0 µM, 1 µM, 10 µM, and 25 µM 5-FU (n = 3). (B) Measurement of IC50 of 5-FU for HCT116 and HCT116 NCLX KO #33 cells after treating the cells with 0 µM, 1 µM, 10 µM, and 25 µM 5-FU for 72 hr. (C) The proliferation of DLD1 cells and clones of DLD1 NCLX KO cells in the absence and presence of 10 µM 5-FU. (D, E) Quantification of migration of HCT116, clones of HCT116 NCLX KO cells (L), and DLD1 cells and clones of DLD1 NCLX KO cells (M) in the presence and absence of 10 µM 5-FU. (F–I) Immunoblot for phospho-AMPK, total AMPK (F), phosphor-S6K, total S6K (H) and loading control GAPDH protein levels, and quantification of band intensity normalized to GAPDH from HCT116 cells and HCT116 NCLX KO #33, #37, and #59 clones (G, I). All the experiments were replicated ≥three times with similar results. Statistical significance was calculated using the paired t-test, except for C, D, and E, where one-way ANOVA followed by a post-hock Tukey test was performed. *p<0.05, **p<0.01, and ***p<0.001.
-
Figure 6—figure supplement 1—source data 1
Source Data Figure 6—figure supplement 1.
- https://cdn.elifesciences.org/articles/59686/elife-59686-fig6-figsupp1-data1-v3.xlsx
Figure 7 with 1 supplement
Glycolysis is critical for migration of NCLX-deficient colorectal cancer cells.
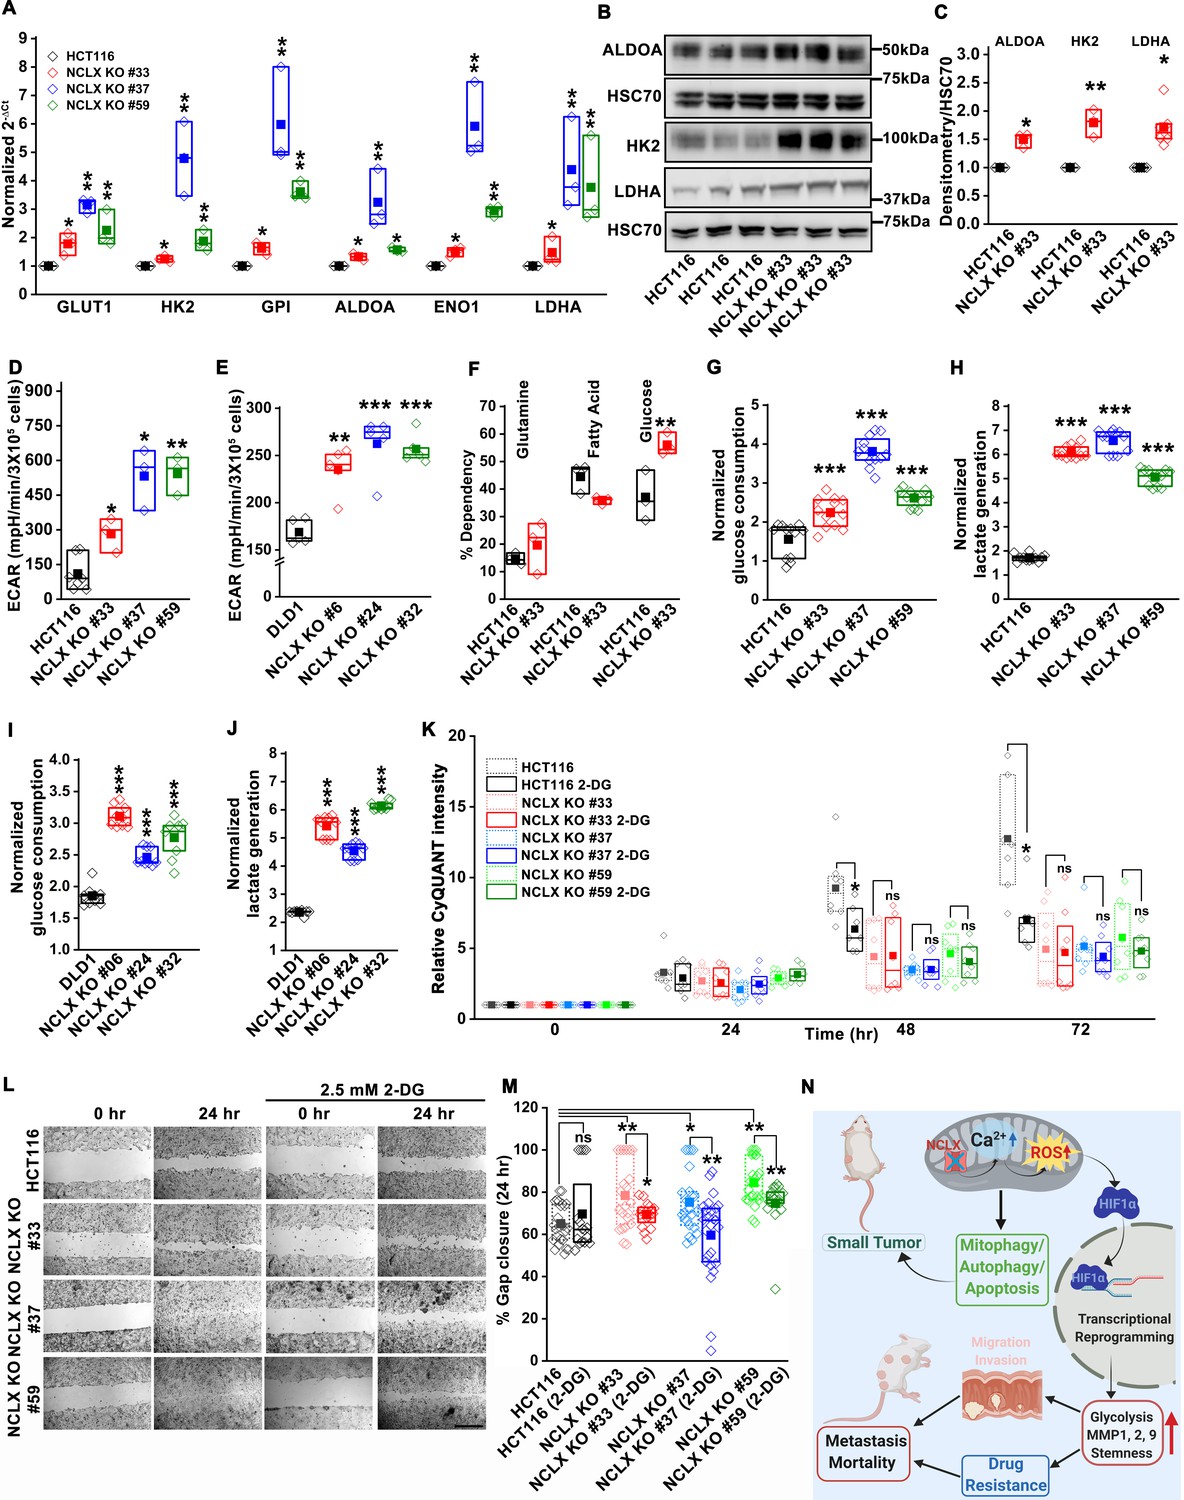
(A) RT-qPCR analysis of glycolytic gene expression in HCT116 cells and three clones of HCT116 NCLX KO cells. RT-qPCR results are plotted as 2-ΔCt relative to tubulin and normalized to control. (B, C) Representative western blots probed with anti-ALDOA, anti-HK2, and anti-LDHA antibodies in HCT116 cells and HCT116 NCLX KO #33 cells. Anti-HSC70 antibody is used as a loading control (B) and quantification of band intensity relative to that of HSC70 (C). (D, E) Extracellular acidification rate (ECAR) of HCT116 cells (D) and DLD1 cells (E) and their respective NCLX KO clones were measured with Seahorse using the glycolysis stress test, as described in methods. (F) The percentage of metabolite dependency of HCT116 cells and HCT116 NCLX KO #33 cells measured using the Mitochondrial Fuel Flexibility, Dependency, and Capacity test, as described in methods. (G–J) Measurement of glucose consumption and lactate generation in HCT116, clones of HCT116 NCLX KO (G, H), DLD1, and clones of DLD1 NCLX KO (I, J) cells normalized to the amount of protein. (K) Proliferation of HCT116 cells and clones of HCT116 NCLX KO cells in the presence and absence of 2.5 mM 2-DG. (L, M) In vitro migration (L), and quantification (M) of HCT116 cells and clones of HCT116 NCLX KO cells in the presence and absence of 2.5 mM 2-DG for 24 hr (scale bar, 1 mm). (N) Summary of the findings from the present study. All experiments were performed ≥three times with similar results. Statistical significance was calculated using paired t-test, except for K, M, where one-way ANOVA followed by a post-hock Tukey test was used. *p<0.05, **p<0.01, and ***p<0.001.
-
Figure 7—source data 1
Source data Figure 7.
- https://cdn.elifesciences.org/articles/59686/elife-59686-fig7-data1-v3.xlsx
Figure 7—figure supplement 1
Loss of NCLX enhances glycolysis and diminishes mitochondrial respiration.
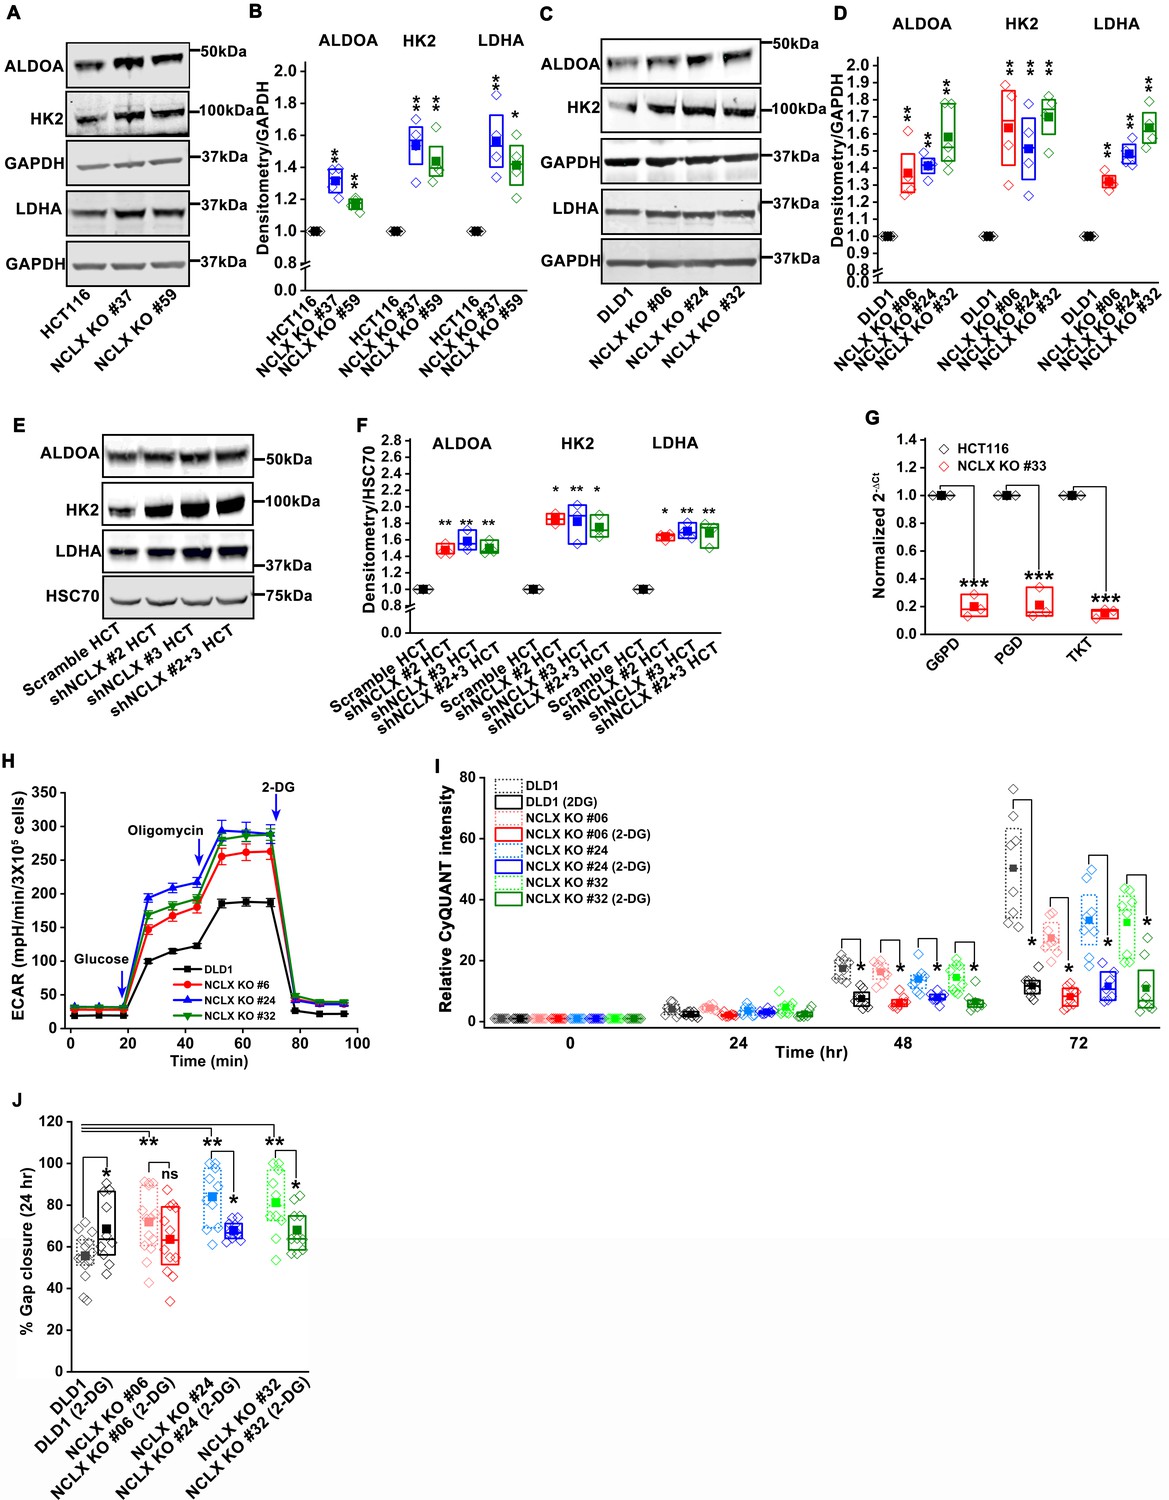
(A–D) Western blots for HK2, ALDOA, LDHA, with GAPDH as a loading control from HCT116, HCT116 NCLX KO #37, #59 (A), DLD1, clones of DLD1 NCLX KO cells (C), and quantification of band intensity normalized to GAPDH (B, D). (E, F) Western blots probed with anti-HK2, anti-ALDOA, anti-LDHA, and anti-HSC70 loading control (E), and quantification of band intensity (F) from HCT116 cells transfected with scramble and two different constructs of shNCLX. (G) RT-qPCR data plotted as 2-ΔCt mRNA values relative to tubulin and normalized to control, for Glucose-6-phosphate dehydrogenase (G6PD), Phosphogluconate dehydrogenase (PGD), and Transketolase (TKT) in HCT116 cells and HCT116 NCLX KO #33 cells. (H) Extracellular acidification rate (ECAR) measurement from DLD1 cells and clones of DLD1 NCLX KO cells. (I) The proliferation of DLD1 cells and clones of DLD1 NCLX KO cells in the presence and absence of 2.5 mM 2-DG. (J) Quantification of in vitro migration of DLD1 cells and clones of DLD1 NCLX KO cells in the presence and absence of 2.5 mM 2-DG for 24 hr. All experiments were performed ≥three times. The statistics were calculated by one-way ANOVA followed by post-hock Tukey's test except for B, D, and F where paired t-test was performed, *p≥0.05, **p≥0.01, ***p≥0.001.
-
Figure 7—figure supplement 1—source data 1
Source Data Figure 7—figure supplement 1.
- https://cdn.elifesciences.org/articles/59686/elife-59686-fig7-figsupp1-data1-v3.xlsx
Tables
Appendix 1—key resources table
| Reagent type (species) or resource | Designation | Source or reference | Identifiers | Additional information |
|---|---|---|---|---|
| Gene (Homo sapiens) | SLC8B1/NCLX | GenBank | Gene ID: 80024 | |
| Gene Mus musculus | Slc8b1/NCLX | GenBank | Gene ID: 170756 | |
| Genetic reagent Mus musculus | NOD.CB17-Prkdcscid/J | Jackson Laboratory | Stock No: 010636, RRID:IMSR_JAX:010636 | Male |
| Cell line (Homo-sapiens) | HCT116 (colon, epithelial) | ATCC | ATCC# CCL-247 | Male |
| Cell line (Homo-sapiens) | HT29 (colon, epithelial) | ATCC | ATCC# HTB-38 | Female |
| Cell line (Homo-sapiens) | DLD1 (colon, epithelial) | ATCC | ATCC# CCL-221 | Male |
| Cell line (Homo-sapiens) | HCT116 NCLX KO (colon, epithelial) | This paper | NCLX Knockout clones of HCT116 cells were generated by the Trebak lab using CRISPR/Cas9 and are available upon request | |
| Cell line (Homo-sapiens) | DLD1 NCLX KO (colon, epithelial) | This paper | NCLX Knockout clones of DLD1 cells were generated in the Trebak lab using CRISPR/Cas9 and are available upon request | |
| Cell line (Homo-sapiens) | HCT116 shNCLX KO (colon, epithelial) | This paper | HCT116 cells with stable shRNA-mediated knockdown of NCLX (shNCLX) were generated by the Trebak Lab using shRNA sequences (listed below in this table) cloned in the lentiviral vector pLKO. These plasmids are available upon request | |
| Cell line (Homo-sapiens) | DLD1 sh NCLX KO (colon, epithelial) | This paper | DLD1 cells with stable shRNA-mediated knockdown of NCLX (shNCLX) were generated by the Trebak Lab using shRNA sequences (listed below in this table) cloned in the lentiviral vector pLKO. These plasmids are available upon request | |
| Antibody | anti-Hif1α (Rabbit polyclonal) | Cell Signaling Technology | Cat# 14179s, RRID:AB_2622225 | WB (1:500) |
| Antibody | anti- ALDOA (Rabbit polyclonal) | Cell Signaling Technology | Cat# 8060S, RRID:AB_2797635 | WB (1:1000) |
| Antibody | anti- HK2 (Rabbit polyclonal) | Cell Signaling Technology | Cat# 2867S, RRID:AB_2232946 | WB (1:1000) |
| Antibody | anti- LDHA (Rabbit polyclonal) | Cell Signaling Technology | Cat# 2012S, RRID:AB_2137173 | WB (1:1000) |
| Antibody | anti- MMP1 (Rabbit polyclonal) | Abcam | Cat# ab38929, RRID:AB_776395 | WB (1:1000) |
| Antibody | anti- MMP2 (Mouse monoclonal) | Santa Cruz Biotechnology | Cat# sc-13594, RRID:AB_627956 | WB (1:500) |
| Antibody | anti- MMP9 (Rabbit polyclonal) | Abcam | Cat# ab73734, RRID:AB_1860201 | WB (1:1000) |
| Antibody | anti- LC3B (Rabbit polyclonal) | Abcam | Cat# ab51520, RRID:AB_881429 | WB (1:1000) |
| Antibody | anti- OXPHOS (Mouse monoclonal) | Abcam | Cat# ab110413, RRID:AB_2629281 | WB (1:5000) |
| Antibody | anti- GAPDH (Mouse monoclonal) | Millipore Sigma | Cat# MAB374, RRID:AB_2107445 | WB (1:10000) |
| Antibody | anti- HSC70 (Mouse monoclonal) | Santa Cruz Biotechnology | Cat# sc-24, RRID:AB_627760 | WB (1:5000) |
| Antibody | anti- p62 (Rabbit polyclonal) | Abcam | Cat# ab109012, RRID:AB_2810880 | WB (1:1000) |
| Antibody | anti- cleaved caspase-3 (Rabbit polyclonal) | Cell Signaling Technology | Cat# 9661S, RRID:AB_2341188 | WB (1:1000) IF (1:500) |
| Antibody | anti- pAMPK (Rabbit polyclonal) | Cell Signaling Technology | Cat# 2535S, RRID:AB_331250 | WB (1:1000) |
| Antibody | anti- AMPK (Rabbit polyclonal) | Cell Signaling Technology | Cat# 5831S, RRID:AB_10622186 | WB (1:1000) |
| Antibody | anti- pS6K (Rabbit polyclonal) | Cell Signaling Technology | Cat# 9234S, RRID:AB_2269803 | WB (1:1000) |
| Antibody | anti- S6K (Rabbit polyclonal) | Cell Signaling Technology | Cat# 2708S, RRID:AB_390722 | WB (1:1000) |
| Sequence-based reagent | SLC7A11_F | This paper | RT-PCR primers | AGGGTCACCTTCCAGAAATC |
| Sequence-based reagent | SLC7A11_R | This paper | RT-PCR primers | GAAGATAAATCAGCCCAGCA |
| Sequence-based reagent | GCLM _F | This paper | RT-PCR primers | CATTTACAGCCTTACTGGGAGG |
| Sequence-based reagent | GCLM _R | This paper | RT-PCR primers | ATGCAGTCAAATCTGGTGGCA |
| Sequence-based reagent | FOX3_F | This paper | RT-PCR primers | CGGCTTCGGCTCTTAGCAAA |
| Sequence-based reagent | FOX3_R | This paper | RT-PCR primers | CGGACAAACGGCTCACTCT |
| Sequence-based reagent | NANOG _F | This paper | RT-PCR primers | TTTGTGGGCCTGAAGAAAACT |
| Sequence-based reagent | NANOG _R | This paper | RT-PCR primers | AGGGCTGTCCTGAATAAGCAG |
| Sequence-based reagent | OCT4_F | This paper | RT-PCR primers | TTCAGCCAAACGACCATCTG |
| Sequence-based reagent | OCT4_R | This paper | RT-PCR primers | CACGAGGGTTTCTGCTTTGC |
| Sequence-based reagent | SOX2_F | This paper | RT-PCR primers | GCCGAGTGGAAACTTTTGTCG |
| Sequence-based reagent | SOX2_R | This paper | RT-PCR primers | GGCAGCGTGTACTTATCCTTCT |
| Sequence-based reagent | GLUT1_F | This paper | RT-PCR primers | TATCGTCAACACGGCCTTCACT |
| Sequence-based reagent | GLUT1_R | This paper | RT-PCR primers | AACAGCTCCTCGGGTGTCTTAT |
| Sequence-based reagent | HK2_F | This paper | RT-PCR primers | GCCATCCTGCAACACTTAGGG |
| Sequence-based reagent | HK2_R | This paper | RT-PCR primers | GTGAGGATGTAGCTTGTAGAGGGT |
| Sequence-based reagent | GPI_F | This paper | RT-PCR primers | TGTGTTCACCAAGCTCACAC |
| Sequence-based reagent | GPI_R | This paper | RT-PCR primers | GTAGAAGCGTCGTGAGAGGT |
| Sequence-based reagent | ALDOA_F | This paper | RT-PCR primers | AGGCCATGCTTGCACTCAG |
| Sequence-based reagent | ALDOA_R | This paper | RT-PCR primers | AGGGCCCAGGGCTTCAG |
| Sequence-based reagent | ENO1_F | This paper | RT-PCR primers | GACTTGGCTGGCAACTCTG |
| Sequence-based reagent | ENO1_R | This paper | RT-PCR primers | GGTCATCGGGAGACTTGAAG |
| Sequence-based reagent | LDHA_F | This paper | RT-PCR primers | GGTTGGTGCTGTTGGCATGG |
| Sequence-based reagent | LDHA_R | This paper | RT-PCR primers | TGCCCCAGCCGTGATAATGA |
| Sequence-based reagent | MMP1_F | This paper | RT-PCR primers | ATGCTGAAACCCTGAAGGTG |
| Sequence-based reagent | MMP1_R | This paper | RT-PCR primers | GAGCATCCCCTCCAATACCT |
| Sequence-based reagent | MMP2_F | This paper | RT-PCR primers | ACCAGCTGGCCTAGTGATGATG |
| Sequence-based reagent | MMP2_R | This paper | RT-PCR primers | GGCTTCCGCATGGTCTCGATG |
| Sequence-based reagent | MMP9_F | This paper | RT-PCR primers | ACGCACGACGTCTTCCAGTA |
| Sequence-based reagent | MMP9_R | This paper | RT-PCR primers | CCACCTGGTTCAACTCACTCC |
| Sequence-based reagent | qNCLX_1_F | This paper | RT-PCR primers | GCCAGCATTTGTGTCCATTT |
| Sequence-based reagent | qNCLX_1_R | This paper | RT-PCR primers | AATTCGTCTCGGCCACTTAC |
| Sequence-based reagent | qNCLX_2_F | This paper | RT-PCR primers | CCGGCAGAAGGCTGAATCTG |
| Sequence-based reagent | qNCLX_2_R | This paper | RT-PCR primers | ACCTTGCGGCAGTCTACCAC |
| Sequence-based reagent | GAPDH_F | This paper | RT-PCR primers | GGGAAACCCATCACCATCTT |
| Sequence-based reagent | GAPDH_R | This paper | RT-PCR primers | CCAGTAGACTCCACGACATACT |
| Sequence-based reagent | G6PD_F | This paper | RT-PCR primers | CGAGGCCGTCACCAAGAAC |
| Sequence-based reagent | G6PD_R | This paper | RT-PCR primers | GTAGTGGTCGATGCGGTAGA |
| Sequence-based reagent | PGD_F | This paper | RT-PCR primers | ATGGCCCAAGCTGACATCG |
| Sequence-based reagent | PGD_R | This paper | RT-PCR primers | AAAGCCGTGGTCATTCATGTT |
| Sequence-based reagent | TKT_F | This paper | RT-PCR primers | TCCACACCATGCGCTACAAG |
| Sequence-based reagent | TKT_R | This paper | RT-PCR primers | CAAGTCGGAGCTGATCTTCCT |
| Sequence-based reagent | g1 | This paper | Guide RNA sequences (Figure 2A and Figure 3—figure supplement 1A) | GCGCAGATTCAGCCTTCTGC |
| Sequence-based reagent | g2 | This paper | Guide RNA sequences (Figure 3—figure supplement 1B and C) | GGGATACTCACGTCTACCAC |
| Sequence-based reagent | g3 | This paper | Guide RNA sequences (Figure 3—figure supplement 1E) | GTAGACGTGAGTATCCCGGT |
| Sequence-based reagent | g4 | This paper | Guide RNA sequences (Figure 3—figure supplement 1E) | ACCCACACCAGCAGTCCGTC |
| Sequence-based reagent | shRNA (shNCLX#2) | This paper | Figure 3—figure supplement 1I | GCCTTCTTGCTGTCATGCAAT |
| Sequence-based reagent | shRNA (shNCLX#3) | This paper | Figure 3—figure supplement 1I | GCTCCTCTTCTACCTGAACTT |
| Sequence-based reagent | siRNA (siNCLX) | This paper | Figure 4—figure supplement 1M | AACGGCCCCUCAACUGUCUT |
| Sequence-based reagent | NCLX_1 | This paper | PCR primers for screening genomic DNA of NCLX KO clones (Figure 3—figure supplement 1F) | GCGTGCTGGTTACCACAG T |
| Sequence-based reagent | NCLX_2 | This paper | PCR primers for screening genomic DNA of NCLX KO clones (Figure 3—figure supplement 1F) | CCACGGAAGAGCATGAGGAA |
| Sequence-based reagent | NCLX_3 | This paper | PCR primers for screening genomic DNA of NCLX KO clones (Figure 3—figure supplement 1F) | ACTTAGCACATCGCCACC TG |
| Sequence-based reagent | NCLX_4 | This paper | PCR primers for screening genomic DNA of NCLX KO clones (Figure 3—figure supplement 1F) | CTGATCTGCACGCTGAAT GG |
| Sequence-based reagent | NCLX_5 | This paper | PCR primers for screening genomic DNA of NCLX KO clones (Figure 3—figure supplement 1F) | GAGGTACACAGCAGTTCT CCC |
| Sequence-based reagent | NCLX_6 | This paper | PCR primers for screening genomic DNA of NCLX KO clones (Figure 3—figure supplement 1F) | CAGCTGGTGCCCTCAAAC AC |
| Sequence-based reagent | px77 | This paper | PCR primers for genotyping NCLX -/- mice | TACAGTCTGGCTCGTTCC CT |
| Sequence-based reagent | px78 | This paper | PCR primers for genotyping NCLX -/- mice | CGGTCCCAGACGCCG T |
| Sequence-based reagent | px79 | This paper | PCR primers for genotyping NCLX -/- mice | CGCTGGGGTCCATCT TTG AT |
| Sequence-based reagent | px80 | This paper | PCR primers for genotyping NCLX -/- mice | TGGGTCTCCGGTCCCAGT A |
| Commercial assay or kit | cDNA Reverse Transcription Kit | Applied biosystems | Cat# 4368814 | |
| Commercial assay or kit | Seahorse XFp Mito Fuel Flex Test Kit | Agilent Technologies | Cat# 103270-100 | |
| Commercial assay or kit | Seahorse XFp Glycolysis Stress Test Kit | Agilent Technologies | Cat# 103017-100 | |
| Commercial assay or kit | Seahorse XFp Cell Mito Stress Test Kit | Agilent Technologies | Cat# 103010-100 | |
| Commercial assay or kit | BCA assay kit | Thermo Fisher Scientific | Cat# A53225 | |
| Commercial assay or kit | TMRE | Thermo Fisher Scientific | Cat# T669 | |
| Commercial assay or kit | CyQUANT | Thermo Fisher Scientific | Cat# C35006 | |
| Chemical compound, drug | Antibiotic and Antimycotic | Thermo Fisher Scientific | Cat# 15240062 | |
| Chemical compound, drug | McCoy’s 5A | Corning | Cat# 10-050CV | |
| Chemical compound, drug | RPMI-1640 | Corning | Cat# 10-040CV | |
| Chemical compound, drug | Lipofectamine 2000 | Thermo Fisher Scientific | Cat# 11668019 | |
| Chemical compound, drug | TrypLE | Thermo Fisher Scientific | Cat# 12605028 | |
| Chemical compound, drug | CoCl2 | Sigma-Aldrich | Cat# 15862 | |
| Chemical compound, drug | 2-deoxy-D-glucose (2-DG) | Sigma-Aldrich | Cat# D8375 | |
| Chemical compound, drug | 5- Fluorouracil | Sigma-Aldrich | Cat# F6627 | |
| Chemical compound, drug | Glucose | Sigma-Aldrich | Cat# D9434 | |
| Chemical compound, drug | Puromycin | MP Biomedical | Cat# 02100552 | |
| Chemical compound, drug | RIPA buffer | Sigma | Cat# R0278 | |
| Chemical compound, drug | ATP | Sigma | Cat# A9187 | |
| Chemical compound, drug | Dextrose | Fisher Scientific | Cat# D14 | |
| Chemical compound, drug | Tris Base | Fisher Scientific | Cat# BP152-5 | |
| Chemical compound, drug | NaCl | Fisher Scientific | Cat# S671 | |
| Chemical compound, drug | MOPS SDS running buffer | Thermo Fisher Scientific | Cat# NP0001 | |
| Chemical compound, drug | Tris-Glycine transfer buffer | Bio-rad | Cat#161-0734 | |
| Chemical compound, drug | KCl | Fisher Scientific | Cat# P217 | |
| Chemical compound, drug | MgCl2 | Fisher Scientific | Cat# M33 | |
| Chemical compound, drug | CaCl2 | Fisher Scientific | Cat# C614 | |
| Chemical compound, drug | HEPES | Fisher Scientific | Cat# BP310 | |
| Chemical compound, drug | LDS sample buffer | Thermo Fisher Scientific | Cat# NP0007 | |
| Chemical compound, drug | NuPAGE Bis-Tris precast gels | Thermo Fisher Scientific | Cat# NP0321 | |
| Chemical compound, drug | Polyvinylidene difluoride membrane | Li-Core Biosciences | Cat# 88518 | |
| Chemical compound, drug | Odyssey Blocking Buffer (TBS) | Li-Core Biosciences | Cat# 937-50003 | |
| Chemical compound, drug | Dextran sulfate sodium | MP Biomedical | Cat# 0216011080 | |
| Chemical compound, drug | Azoxymethane | Sigma | Cat# A5486 | |
| Chemical compound, drug | DNase I | Thermo Fisher Scientific | Cat# 18068-015 | |
| Chemical compound, drug | TRIzol | Thermo Fisher Scientific | Cat# 15596018 | |
| Chemical compound, drug | Seahorse XF DMEM Medium pH 7.4 | Agilent Technologies | Cat# 103575-100 | |
| Chemical compound, drug | Seahorse XF 100 mM pyruvate solution | Agilent Technologies | Cat# 103578-100 | |
| Chemical compound, drug | Seahorse XF 200 mM glutamine solution | Agilent Technologies | Cat# 103579-100 | |
| Chemical compound, drug | Seahorse XF 1.0 M glucose solution | Agilent Technologies | Cat# 103577-100 | |
| Chemical compound, drug | Zymogram Developing Buffer (10X) | Thermo Fisher Scientific | Cat# LC2671 | |
| Chemical compound, drug | Zymogram Renaturing Buffer (10X) | Thermo Fisher Scientific | Cat# LC2670 | |
| Chemical compound, drug | Tris-Glycine SDS Running Buffer (10X) | Thermo Fisher Scientific | Cat# LC2675 | |
| Chemical compound, drug | Tween 20 | Fisher Scientific | Cat# BP337 | |
| Software, algorithm | Image J | https://imagej.net/ | RRID:SCR_003070 | |
| Other | DAPI | Sigma-Aldrich | Cat# D9542 | 1µg/ml |
| Other | Hoechst | Thermo Fisher Scientific | Cat# H3570 | 1µg/ml |
| Other | IRDye 800CW Goat anti-Mouse | Li-Core Biosciences | Cat# 925-32210 | 1:10000 |
| Other | IRDye 800CW Donkey anti-Rabbit | Li-Core Biosciences | Cat# 925-32213 | 1:5000 |
| Other | MitoSox Red | Thermo Fisher Scientific | Cat# M36008 | |
| Other | Mito TEMPO | Thermo Fisher Scientific | Cat# SML0737 | |
| Other | Mito Tracker Green FM | Thermo Fisher Scientific | Cat# M7514 | |
| Other | Mito Tracker Deep red FM | Cell Signaling Technology | Cat# 8778S | |
| Other | Fura-2 AM | Thermo Fisher Scientific | Cat# F1221 | |
| Other | FluoroBlok | Corning | Cat# 351152 | |
| Other | BioCoat Tumor Invasion Plate | Corning | Cat# 80774380 | |
| Other | SYBER select master mix | Thermo Fisher Scientific | Cat# 4472920 | |
| Other | Novex 10% Zymogram Plus (Gelatin) Protein Gels, 1.0 mm, 10-well | Thermo Fisher Scientific | Cat# ZY00100 | |
| Other | SimplyBlue Safe Stain | Thermo Fisher Scientific | Cat# LC6060 |
Additional files
-
Source data 1
Source data RNAseq_HCT116_HCT116 NCLX KO.
- https://cdn.elifesciences.org/articles/59686/elife-59686-data1-v3.xlsx
-
Transparent reporting form
- https://cdn.elifesciences.org/articles/59686/elife-59686-transrepform-v3.docx
Download links
A two-part list of links to download the article, or parts of the article, in various formats.
Downloads (link to download the article as PDF)
Open citations (links to open the citations from this article in various online reference manager services)
Cite this article (links to download the citations from this article in formats compatible with various reference manager tools)
Dichotomous role of the human mitochondrial Na+/Ca2+/Li+ exchanger NCLX in colorectal cancer growth and metastasis
eLife 9:e59686.
https://doi.org/10.7554/eLife.59686


