Pregnancy-associated plasma protein-aa regulates endoplasmic reticulum–mitochondria associations
- Department of Integrative Biology, University of Wisconsin, United States
- Department of Neuroscience, University of Wisconsin, United States
- Neuroscience Training Program, University of Wisconsin, United States
Figures
Figure 1 with 1 supplement
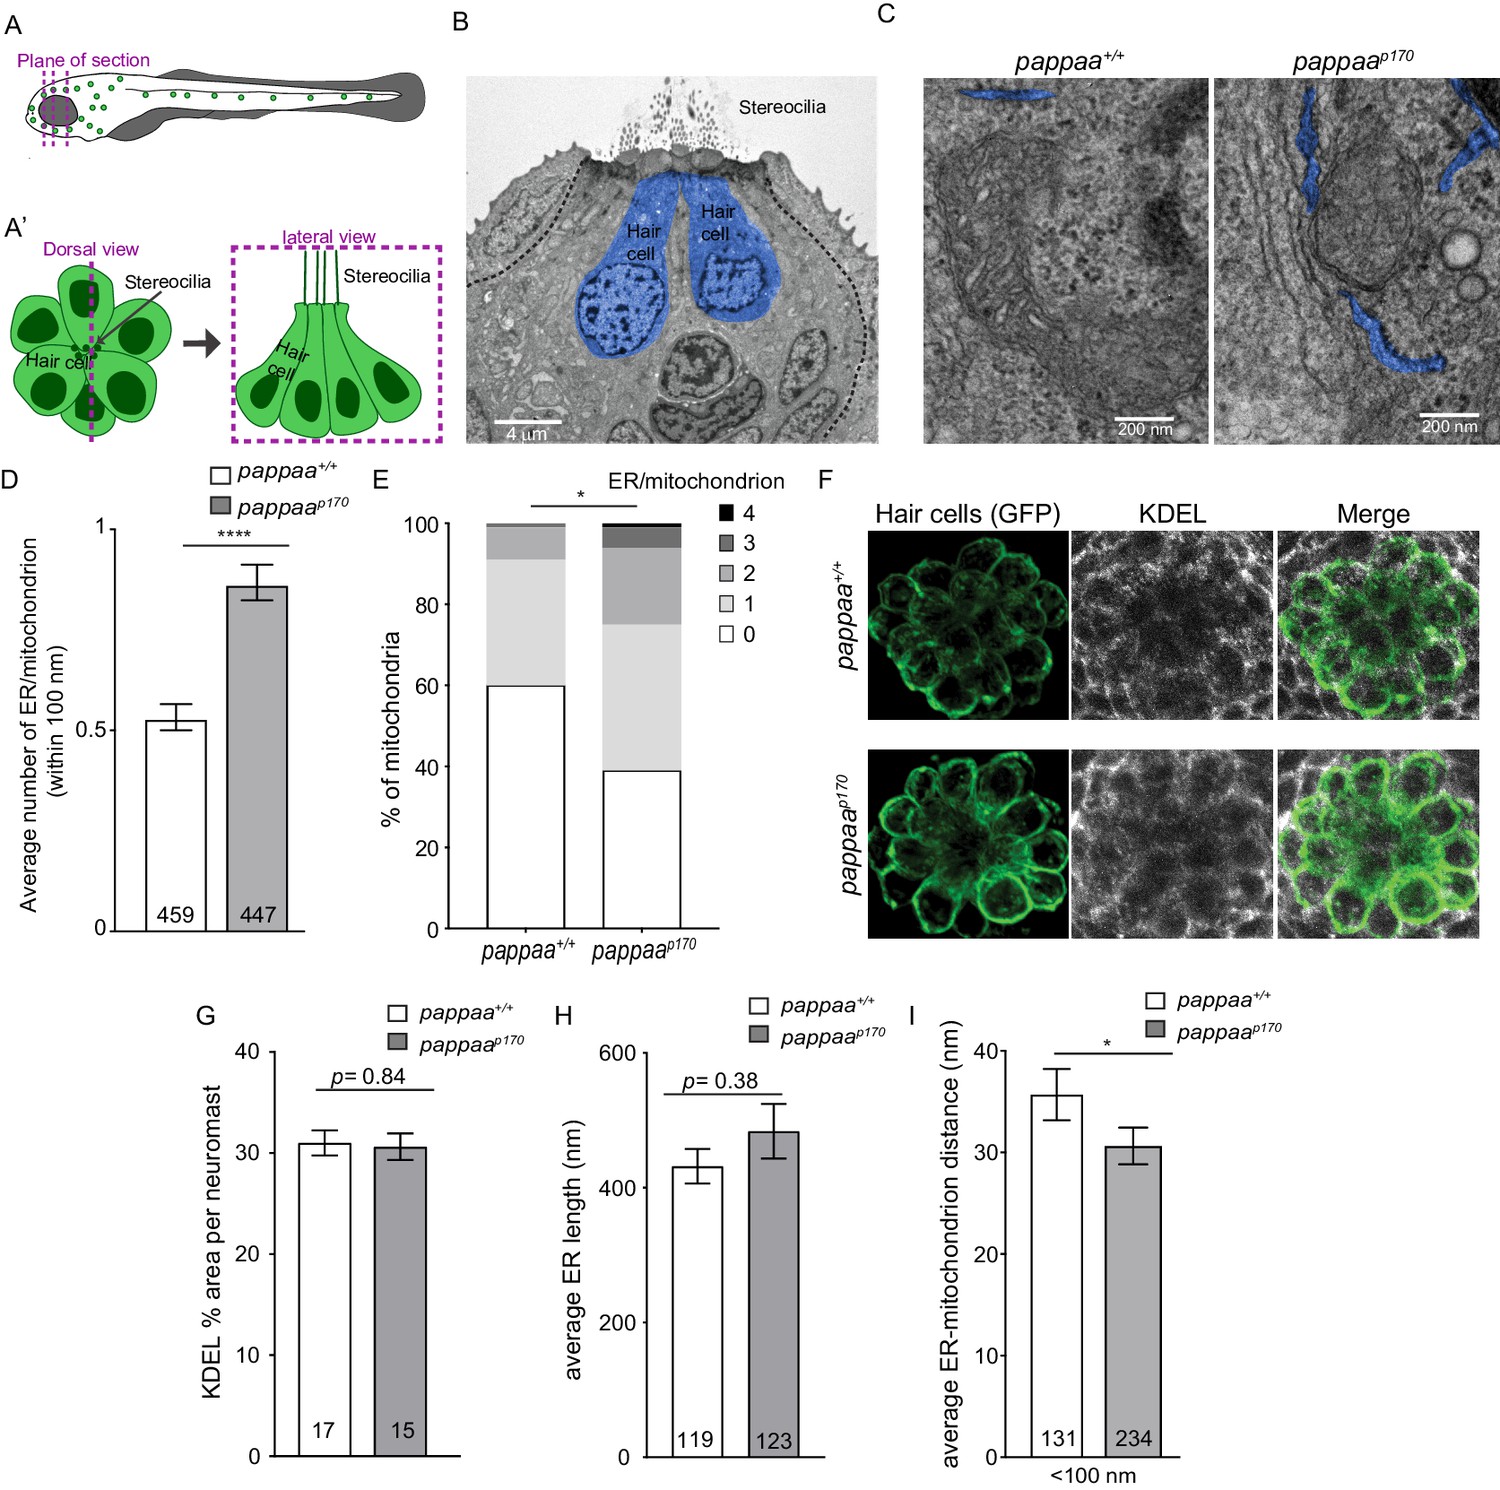
Pappaa regulates ER-mitochondria associations.
(A–A’) Schematic of zebrafish lateral line hair cells. (A) The dotted lines represent EM plane of section. (A’) Schematic of a dorsal view (left) and lateral view (right) of a single neuromast. (B) Representative EM section of lateral line neuromast taken along the apical-basal axis of lateral line hair cells (blue) in 5 dpf larva. Scale bar = 4 μm. (C) Representative EM images of ER-mitochondria associations in wild-type and pappaa hair cells. ER is pseudo colored in blue. Scale bar = 200 nm. (D) Mean number of ER tubules within 100 nm of mitochondria. ****p<0.0001 t-test, Mann–Whitney correction. N = 459 mitochondria (wild type) and 447 mitochondria (pappaap170) collected from six larvae/genotype. Error bars = SEM. (E) Percentages of mitochondria associated with 0, 1, 2, 3, or 4 ER tubules. *p<0.05 chi-square test. N = 459 mitochondria (wild type) and 447 mitochondria (pappaap170) collected from six larvae/genotype. (F) KDEL immunolabeling in 5 dpf wild-type and pappaap170 brn3c:mGFP-labeled hair cells. (G) Mean percentage of area covered by KDEL immunolabeling per neuromast. Unpaired t-test with Welch correction revealed no significant difference between groups p=0.84. N = 15–17 larvae/genotype (shown at base of bars), 1–3 neuromasts/larva. Total number of neuromasts included in the analysis = 35 (wild type) and 31 (pappaap170) neuromasts from two experiments. (H) Mean length of ER tubules. t-test with Mann–Whitney correction found no significant difference. N = 119 ER tubules (wild type) and 123 ER tubules (pappaap170) collected from six larvae/genotype. (I) Mean distance between the ER and mitochondria that are within 100 nm of each other. *p<0.05 t-test, Mann–Whitney correction. N = 131 ER-mitochondria associations (wild type) and 234 ER-mitochondria associations (pappaap170) collected from six larvae/genotype. Error bars=SEM.
-
Figure 1—source data 1
Mean number of ER tubules/mitochondrion.
- https://cdn.elifesciences.org/articles/59687/elife-59687-fig1-data1-v2.xlsx
-
Figure 1—source data 2
Percentages of mitochondria that are associated with 0, 1, 2, 3, or 4 ER tubules.
- https://cdn.elifesciences.org/articles/59687/elife-59687-fig1-data2-v2.xlsx
-
Figure 1—source data 3
Mean percentage of area covered by KDEL immunolabeling.
- https://cdn.elifesciences.org/articles/59687/elife-59687-fig1-data3-v2.xlsx
-
Figure 1—source data 4
Mean ER tubule length.
- https://cdn.elifesciences.org/articles/59687/elife-59687-fig1-data4-v2.xlsx
-
Figure 1—source data 5
Mean ER-mitochondria distance.
- https://cdn.elifesciences.org/articles/59687/elife-59687-fig1-data5-v2.xlsx
Figure 1—figure supplement 1
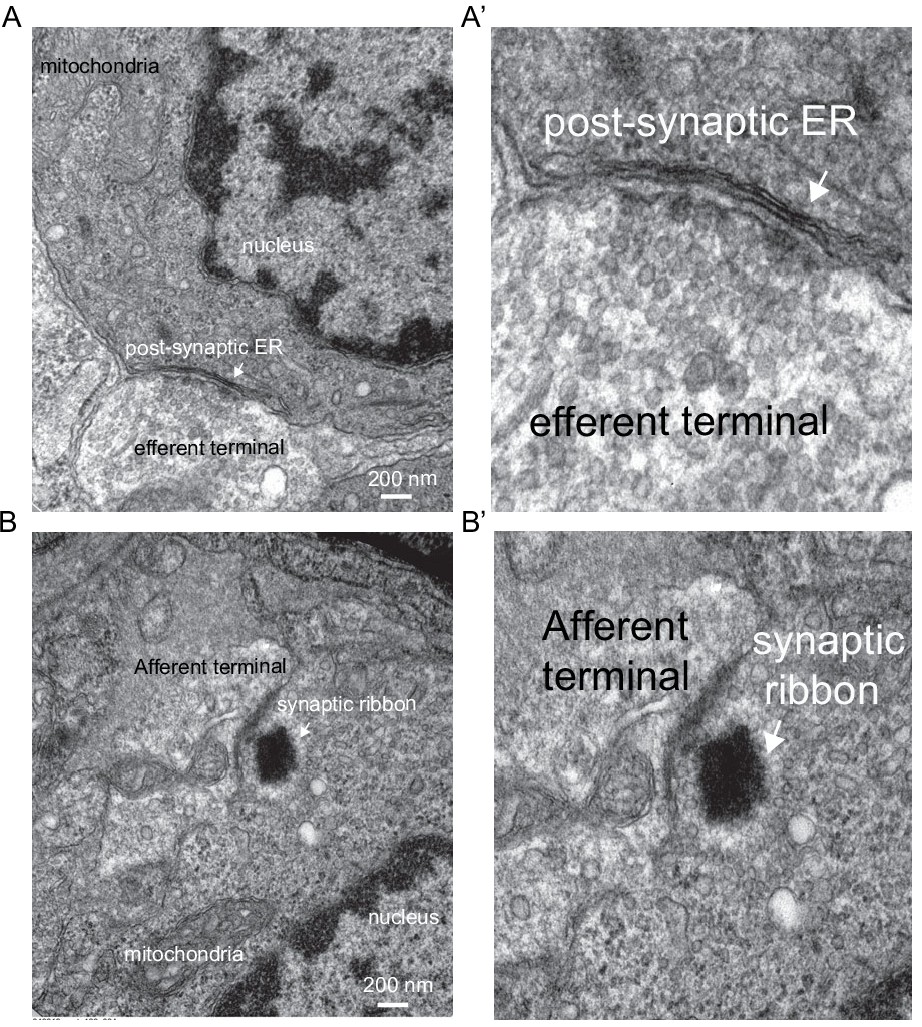
Representative EM images of (A–A’) an efferent contact showing the post-synaptic ER (arrow) and afferent (B–B’) contact identified by the synaptic ribbon (arrow).
Figure 2 with 1 supplement
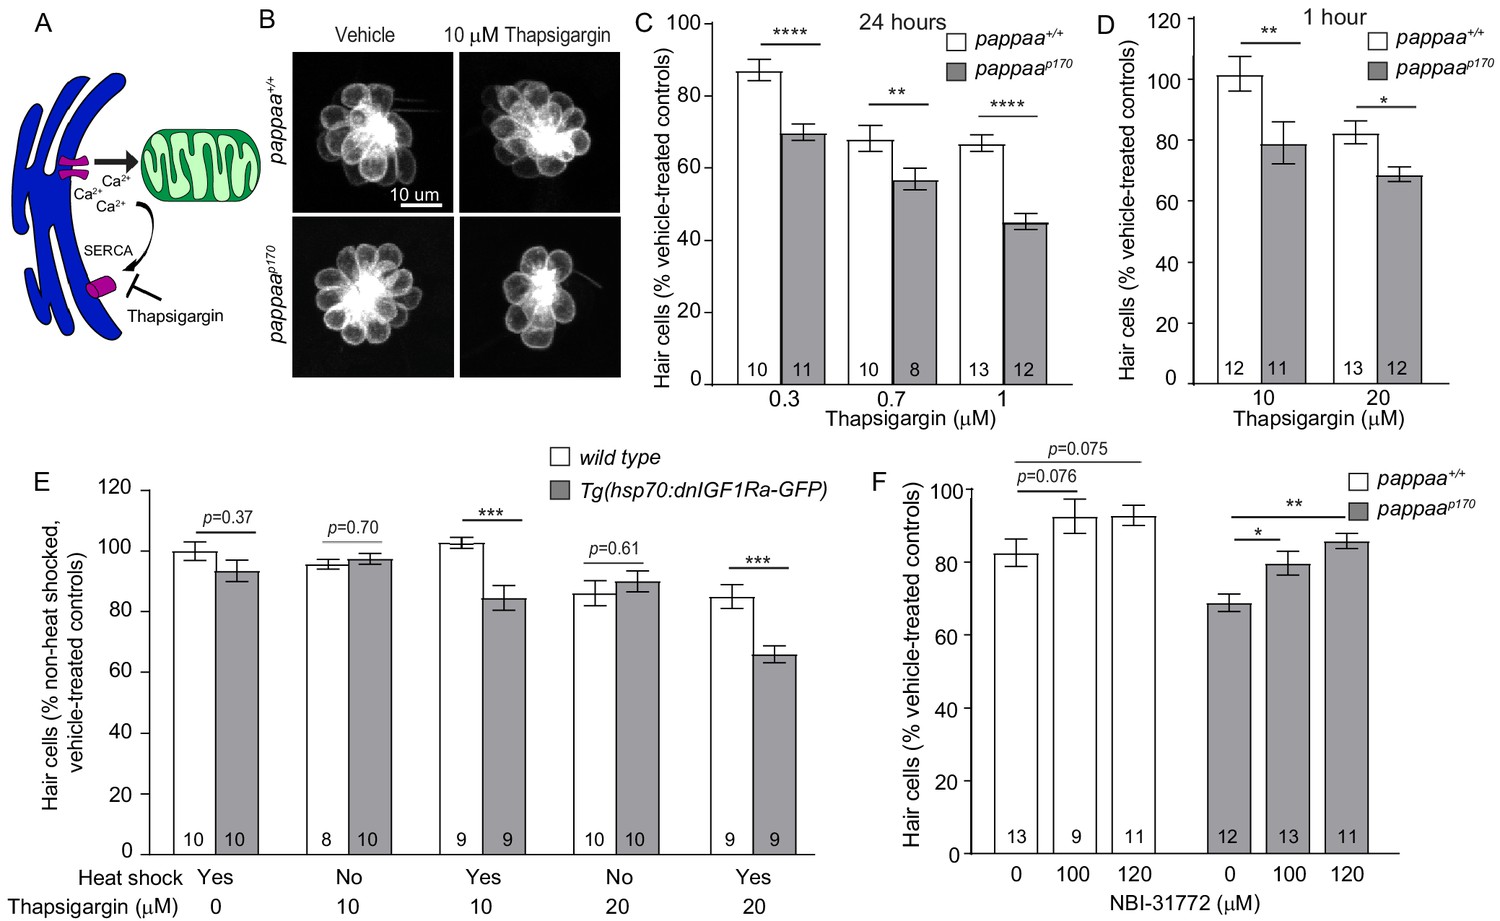
pappaap170 hair cells are more sensitive to disruption in ER–mitochondria calcium signaling.
(A) Thapsigargin increases calcium concentration at the ER-mitochondria junction by blocking the SERCA pump and inhibiting calcium uptake by the ER. (B) Representative images of brn3c:mGFP-labeled hair cells from vehicle or 10 µM thapsigargin-treated larvae. (C) Mean percentage of surviving hair cells following 24 hr treatments with thapsigargin starting at 4 dpf. To calculate hair cell survival percentage, hair cell number post-drug treatment was normalized to mean hair cell number in vehicle treated larvae of the same genotype. **p<0.01, ****p<0.0001, two-way ANOVA, Holm–Sidak post-test. N = 8–13 larvae per group (shown at base of bars), three neuromasts/larva were analyzed. Total number of neuromasts included in the analysis = 24 (wild type; vehicle-treated), 24 (pappaap170; vehicle-treated), 30 (wild type; 0.3 μM thapsigargin), 33 (pappaap170; 0.3 μM thapsigargin), 30 (wild type; 0.7 μM thapsigargin), 24 (pappaap170; 0.7 μM thapsigargin), 39 (wild type; 1 μM thapsigargin), 36 (pappaap170; 1 μM thapsigargin). (D) Mean percentage of surviving hair cells following 1 hr treatment with thapsigargin at 5 dpf. *p<0.05, **p<0.01, two-way ANOVA, Holm–Sidak post-test. N = 8–13 larvae per group (shown at base of bars), three neuromasts/larva from two experiments were analyzed. Total number of neuromasts included in the analysis = 60 (wild type; vehicle-treated), 60 (pappaap170; vehicle-treated), 36 (wild type; 10 μM thapsigargin), 33 (pappaap170; 10 μM thapsigargin), 39 (wild type; 20 μM thapsigargin), 36 (pappaap170; 20 μM thapsigargin). (E) Mean percentage of surviving hair cells following induction of dnIGF1R expression. To calculate hair cell survival percentage, hair cell number after 1 hr treatments with thapsigargin was normalized to mean hair cell number in non-heat-shocked, vehicle-treated larvae of the same genotype. ***p<0.001 two-way ANOVA, Holm–Sidak post-test. N = 8–10 larvae per group (shown at base of bars), three neuromasts per larva. Total number of neuromasts included in the analysis = 30 (wild type; non-heat-shocked, vehicle-treated), 27 (dnIGF1Ra; non-heat-shocked, vehicle-treated), 30 (wild type; heat-shocked, vehicle-treated), 30 (dnIGF1Ra; heat-shocked, vehicle-treated), 24 (wild type; non-heat-shocked, 10 μM thapsigargin), 30 (dnIGF1Ra; non-heat-shocked, 10 μM thapsigargin), 27 (wild type; heat-shocked, 10 μM thapsigargin), 27 (dnIGF1Ra; heat-shocked, 10 μM thapsigargin), 30 (wild type; non heat-shocked, 20 μM thapsigargin), 30 (dnIGF1Ra; non-heat-shocked, 20 μM thapsigargin), 27 (wild type; heat-shocked, 20 μM thapsigargin), 27 (dnIGF1Ra; heat-shocked, 20 μM thapsigargin). (F) Mean percentage of surviving hair cells following co-treatment with NBI-31772 and 20 µM thapsigargin. To calculate hair cell survival percentage, hair cell counts after treatment were normalized to hair cell number in vehicle treated larvae of the same genotype. *p<0.05, **p<0.01. Two-way ANOVA, Holm–Sidak post-test. N = 9–13 larvae per group (shown at base of bars), three neuromasts per larva. Total number of neuromasts included in the analysis = 24 (wild type; vehicle-treated), 24 (pappaap170; vehicle-treated), 39 (wild type; 20 μM thapsigargin), 36 (pappaap170; 20 μM thapsigargin), 27 (wild type; 20 μM thapsigargin+ 100 μM NBΙ−31772), 39 (pappaap170; 20 μM thapsigargin + 100 μM NBΙ−31772), 33 (wild type; 20 μM thapsigargin + 120 μM NBΙ−31772), and 33 (pappaap170; 20 μM Thapsigargin + 120 μM NBΙ−31772).
-
Figure 2—source data 1
Hair cell survival following 24 hr treatment with thapsigargin in wild-type and pappaap170 larvae.
- https://cdn.elifesciences.org/articles/59687/elife-59687-fig2-data1-v2.xlsx
-
Figure 2—source data 2
Hair cell survival following 1 hr treatment with thapsigargin in wild-type and pappaap170 larvae.
- https://cdn.elifesciences.org/articles/59687/elife-59687-fig2-data2-v2.xlsx
-
Figure 2—source data 3
Hair cell survival following induction of dnIGF1R expression.
- https://cdn.elifesciences.org/articles/59687/elife-59687-fig2-data3-v2.xlsx
-
Figure 2—source data 4
Hair cell survival following co-treatment with thapsigargin and NBI-31772 in wild-type and pappaap170 larvae.
- https://cdn.elifesciences.org/articles/59687/elife-59687-fig2-data4-v2.xlsx
Figure 2—figure supplement 1
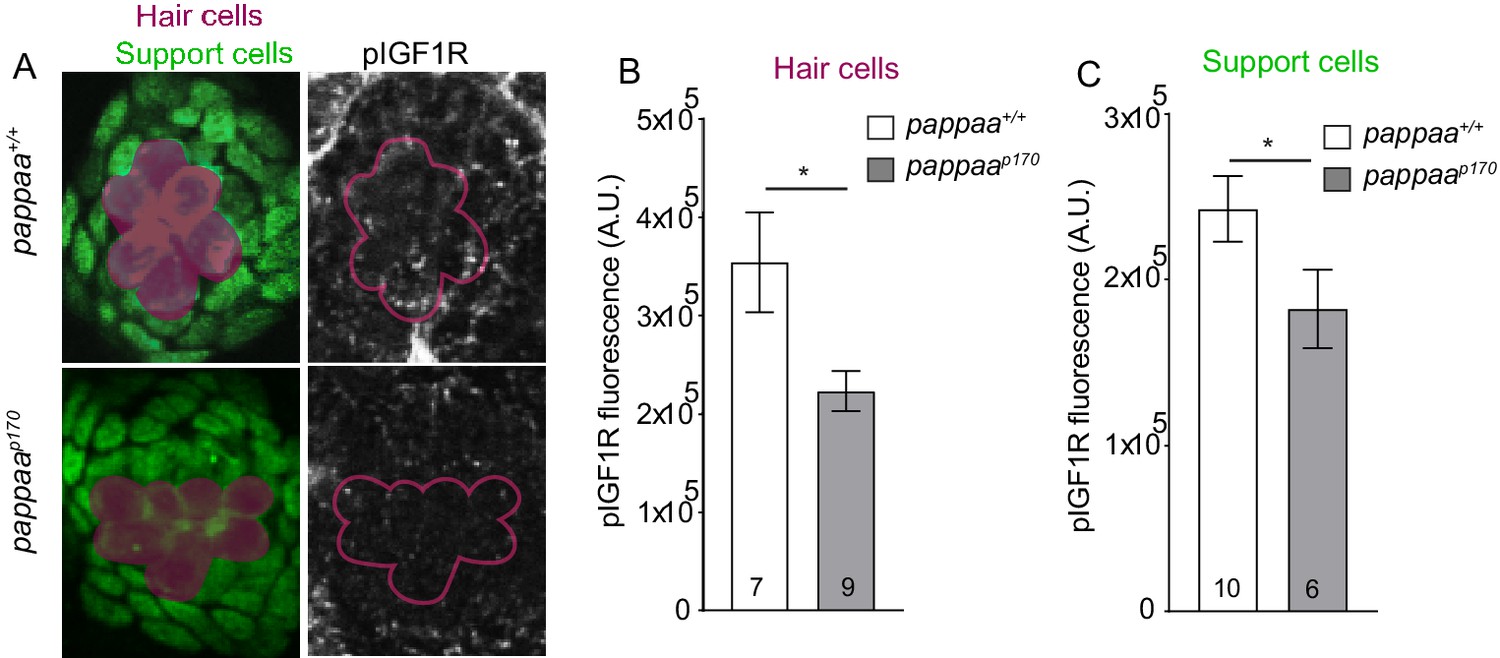
Anti-pIGF1R immunolabeling.
(A) brn3c:mGFP-labeled hair cells (magenta) and SOX2 labeled support cells (green) immunostained with anti-pIGF1R antibody (white). (B) Mean pIGF1R fluorescence from Z-stack summation projections of brn3c:mGFP-labeled hair cells. *p<0.05 t-test, Mann–Whitney correction. N = 7–9 larvae per group, 3–4 neuromast/larva. Total number of neuromasts included in the analysis = 23 (wild type) and 27 (pappaap170). (C) Mean pIGF1R fluorescence from Z-stack summation projections of 10 randomly selected support cells per neuromast. *p<0.05 t-test, Mann–Whitney correction. N = 6–10 larvae per group, 2–4 neuromast/larva. Total number of neuromasts included in the analysis = 26 (wild type) and 21 (pappaap170). Error bars=SEM.
-
Figure 2—figure supplement 1—source data 1
Mean pIGF1R fluorescence in wild-type and pappaap170 hair cells.
- https://cdn.elifesciences.org/articles/59687/elife-59687-fig2-figsupp1-data1-v2.xlsx
-
Figure 2—figure supplement 1—source data 2
Mean pIGF1R fluorescence in wild-type and pappaap170 support cells.
- https://cdn.elifesciences.org/articles/59687/elife-59687-fig2-figsupp1-data2-v2.xlsx
Figure 3
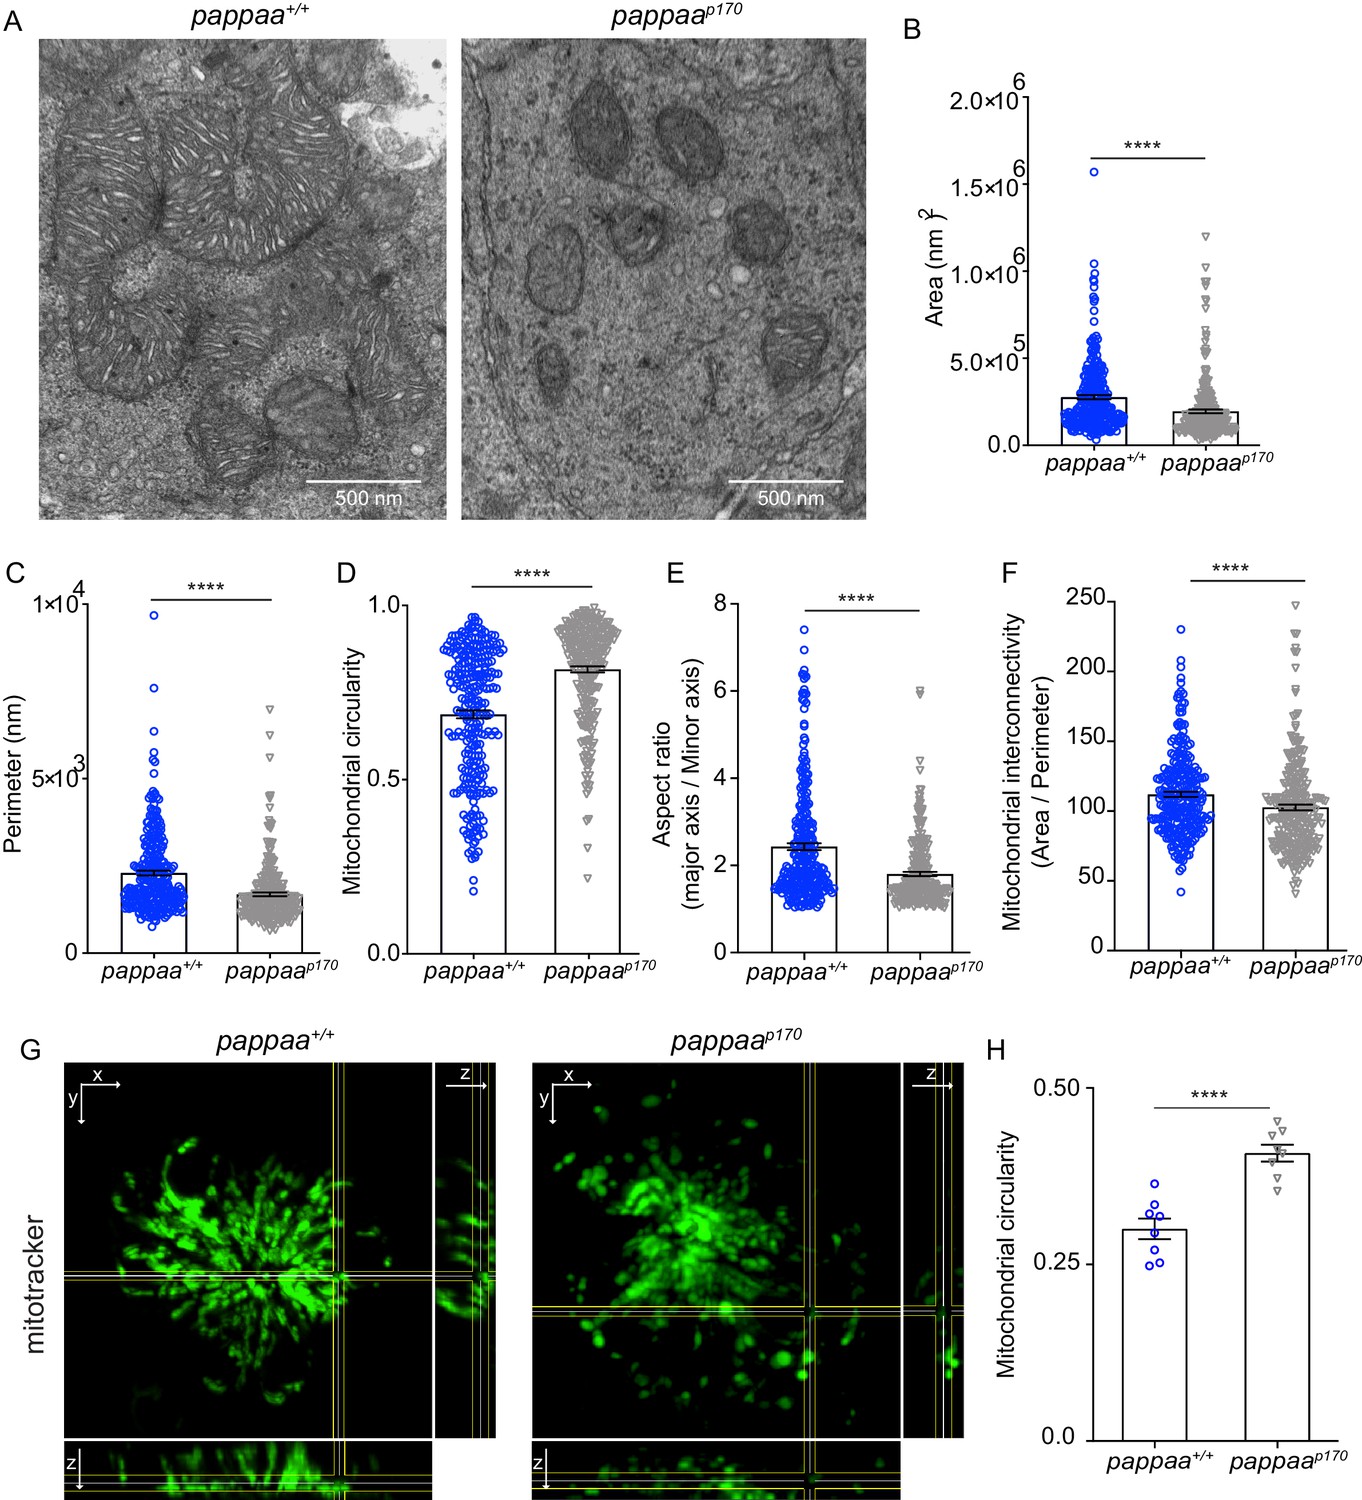
Pappaa loss causes mitochondrial fragmentation.
(A) Representative EM images of mitochondria in lateral line hair cells in 5 dpf wild-type and pappaap170 larvae. (B–F) Mean mitochondrial (B) area, (C) perimeter, (D) circularity, (E) aspect ratio, and (F) interconnectivity in 5 dpf wild-type and pappaap170 lateral line hair cells. ****p<0.0001 t-test, Mann–Whitney correction. N = 272 mitochondria (wild type) and 262 mitochondria (pappaap170) collected from six larvae/genotype. (G) Representative images of 5 dpf wild-type and pappaap170 lateral line hair cells loaded with the vital mitochondrial dye, Mitotracker. Images are maximum intensity projection through neuromast in xy view, with cross sections of yz plane shown at right and xz plane shown at bottom. (H) Mean mitochondrial circularity measured from Z-stack max intensity projections of wild-type and pappaap170 lateral line hair cells. ****p<0.0001 t-test, Welch correction. N = 8 larvae per group (shown at base of bars), one neuromast/ larva. Error bars=SEM. See Videos 1 and 2.
-
Figure 3—source data 1
Mitochondrial area in wild-type and pappaap170 lateral line hair cells.
- https://cdn.elifesciences.org/articles/59687/elife-59687-fig3-data1-v2.xlsx
-
Figure 3—source data 2
Mitochondrial perimeter in wild-type and pappaap170 lateral line hair cells.
- https://cdn.elifesciences.org/articles/59687/elife-59687-fig3-data2-v2.xlsx
-
Figure 3—source data 3
Mitochondrial circularity in wild-type and pappaap170 lateral line hair cells.
- https://cdn.elifesciences.org/articles/59687/elife-59687-fig3-data3-v2.xlsx
-
Figure 3—source data 4
Mitochondrial aspect ratio in wild-type and pappaap170 lateral line hair cells.
- https://cdn.elifesciences.org/articles/59687/elife-59687-fig3-data4-v2.xlsx
-
Figure 3—source data 5
Mitochondrial interconnectivity in wild-type and pappaap170 lateral line hair cells.
- https://cdn.elifesciences.org/articles/59687/elife-59687-fig3-data5-v2.xlsx
-
Figure 3—source data 6
Mitochondrial circularity in wild-type and pappaap170 lateral line hair cells measured by mitotracker.
- https://cdn.elifesciences.org/articles/59687/elife-59687-fig3-data6-v2.xlsx
Figure 4
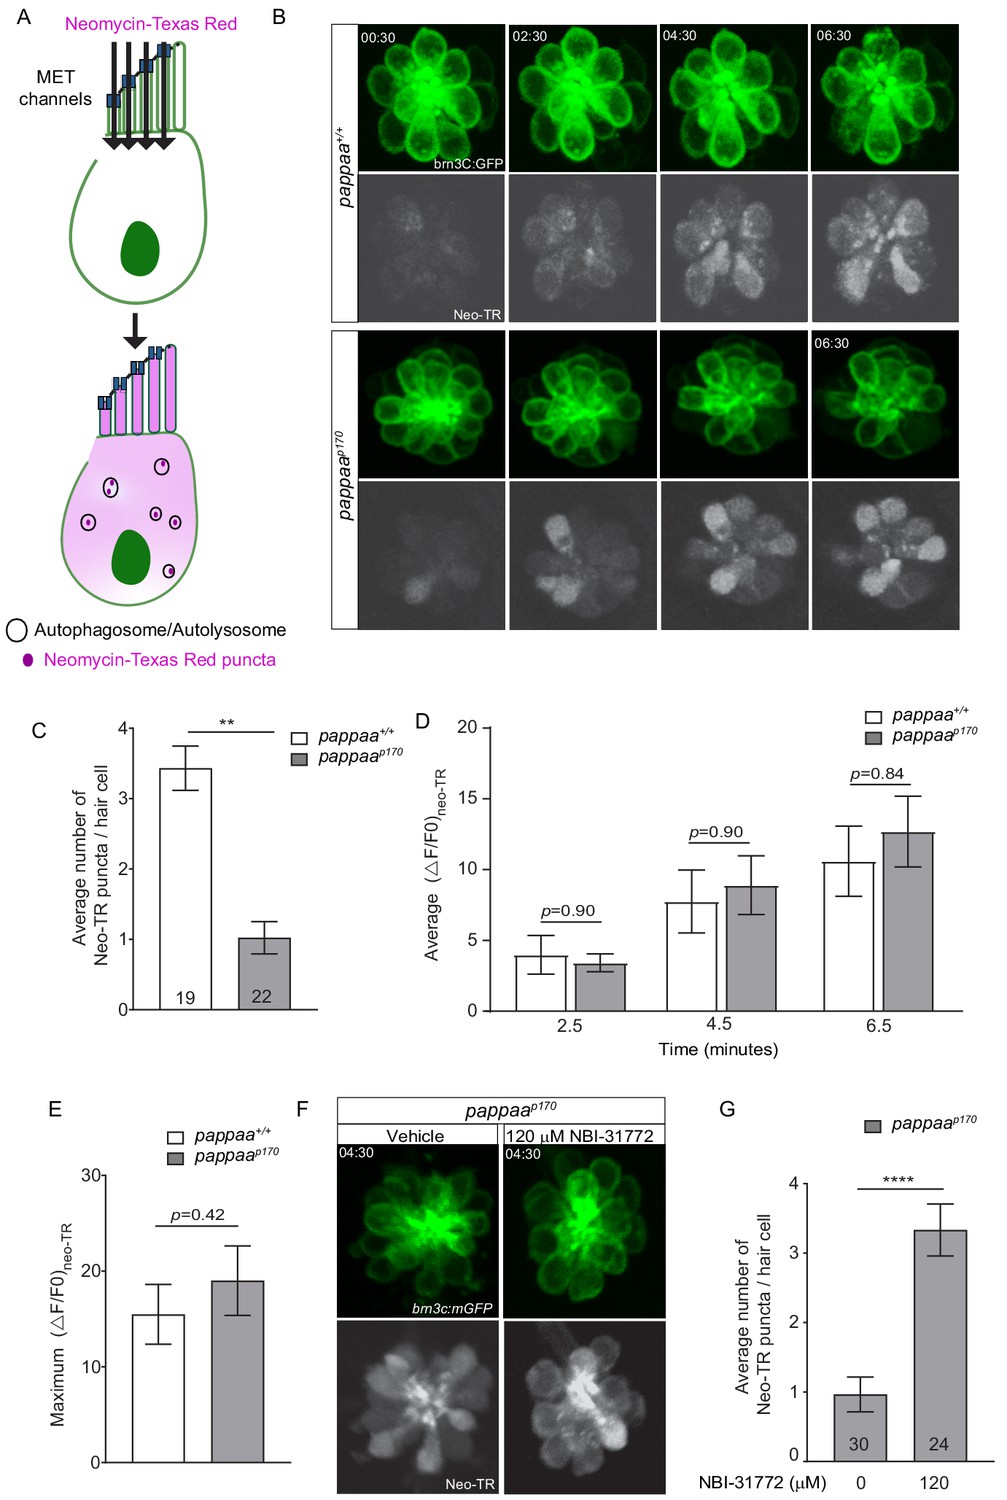
Pappaa regulates neomycin-induced autophagy.
(A) Schematic showing cell entry and autophagy of neomycin-Texas Red. (B) Representative time lapse images of brn3C:mGFP-labeled neuromast hair cells (green) at 5 dpf following exposure to 10 μM neomycin-Texas Red (white). (C) Mean number of neomycin-Texas Red puncta/hair cell in wild-type and pappaap170 larvae at 5 dpf. **p<0.01 t-test, Mann–Whitney correction. N = 19 hair cells (wild type) and 22 hair cells (pappaap170) collected from four larvae/genotype. (D) Mean neomycin-Texas Red ΔF/F0 at 2.5, 4.5, and 6.5 min post-exposure. Multiple t-test with Holm–Sidak correction found no significant difference. N = 22 hair cells (wild type) and 22 hair cells (pappaap170) collected from four larvae/genotype. (E) Maximum change in neomycin-Texas Red fluorescent intensity across treatment time. Unpaired t-test with Mann–Whitney correction found no significant difference. N = 22 hair cells (wild type) and 22 hair cells (pappaap170) collected from four larvae/genotype. See Videos 1 and 2. (F) Representative time lapse images of vehicle or 120 μM NBI-31772 treated brn3C:mGFP-labeled neuromast hair cells (green) of pappaap170 larvae at 5 dpf following exposure to 10 μM neomycin-Texas Red (white). (G) Mean number of neomycin-Texas Red puncta/hair cell in vehicle or 120 μM NBI-31772 treated pappaap170 larvae at 5 dpf. ****p<0.0001 t-test, Mann–Whitney correction. N = 30 hair cells (Vehicle) and 24 hair cells (120 μM NBI-31772) collected from four larvae/ group. Error bars=SEM.
-
Figure 4—source data 1
Mean number of neomycin-Texas Red puncta in wild-type and pappaap170 lateral line hair cells.
- https://cdn.elifesciences.org/articles/59687/elife-59687-fig4-data1-v2.xlsx
-
Figure 4—source data 2
Mean change in neomycin-Texas Red fluorescence over time in wild-type and pappaap170 lateral line hair cells.
- https://cdn.elifesciences.org/articles/59687/elife-59687-fig4-data2-v2.xlsx
-
Figure 4—source data 3
Maximum change in neomycin-Texas Red fluorescence in wild-type and pappaap170 lateral line hair cells.
- https://cdn.elifesciences.org/articles/59687/elife-59687-fig4-data3-v2.xlsx
-
Figure 4—source data 4
Mean number of neomycin-Texas Red puncta in NBI-31772-treated pappaap170 lateral line hair cells.
- https://cdn.elifesciences.org/articles/59687/elife-59687-fig4-data4-v2.xlsx
Figure 5

Pappaa loss causes ER stress.
(A) Schematic of the UPR pathway. The accumulation of unfolded proteins activates the UPR receptors, IRE1, ATF6, and PERK, signifying ER stress. In the early adaptive phase of ER stress, the UPR promotes cell survival through the upregulation of pro-survival factors including bip, atf4, and spliced xbp1. A switch from an adaptive to a pro-apoptotic UPR occurs during the late phase of ER stress in which Chop, a pro-apoptotic transcription factor, is upregulated. (B) Mean fold change in UPR mRNA levels in wild-type and pappaap170 hair cells at 5 dpf. N = 2–3 technical replicates/gene. *p<0.05, ***p<0.001, ****p<0.0001, two-way ANOVA, Holm–Sidak post-test. Error bars=SEM. (C) Representative images of TUNEL staining (magenta) in wild-type and pappaap170 lateral line hair cells. Stereocilia are counterstained with phalloidin (white). A 30 min treatment with 100 μM neomycin was used as positive control (top). (D) Mean percentage of surviving hair cells following a 24 hr treatment with tunicamycin starting from 4 dpf. To calculate hair cell survival percentage, hair cell number post-treatment was normalized to mean hair cell number in vehicle-treated larvae of the same genotype. *p<0.05, **p<0.01, two-way ANOVA, Holm–Sidak post-test. N = 8–10 larvae per group (shown at base of bars), three neuromasts/larva from two experiments were analyzed. Total number of neuromasts included in the analysis = 51 (wild type; vehicle treated), 57 (pappaap170; vehicle treated), 27 (wild type; 2 μM Tunicamycin), 27 (pappaap170; 2 μM Tunicamycin), 27 (wild type; 3 μM Tunicamycin), 27 (pappaap170; 3 μM Tunicamycin). Error bars=SEM.
-
Figure 5—source data 1
Mean fold change in UPR transcript levels in wild-type and pappaap170 lateral line hair cells.
- https://cdn.elifesciences.org/articles/59687/elife-59687-fig5-data1-v2.xlsx
-
Figure 5—source data 2
Hair cell survival following treatment with Tunicamycin in wild-type and pappaap170 larvae.
- https://cdn.elifesciences.org/articles/59687/elife-59687-fig5-data2-v2.xlsx
Videos
Video 1
3D rendering of mitotracker labeling in wild-type lateral line hair cells.
This video was constructed from a confocal z-stack of wild-type lateral line hair cells loaded with mitotracker.
Video 2
3D rendering of mitotracker labeling in pappaap170 lateral line hair cells.
This video was constructed from a z-stack of pappaap170 lateral line hair cells loaded with mitotracker.
Video 3
Wild-type lateral line hair cells following exposure to neomycin-Texas red.
This video was constructed from time lapse images of wild-type brn3c:mGFP lateral line hair cells (left) following exposure to 10 μM neomycin-Texas red (right).
Video 4
pappaap170 lateral line hair cells following exposure to neomycin-Texas red.
This video was constructed from time lapse images of pappaap170 brn3c:mGFP lateral line hair cells (left) following exposure to 10 μM neomycin-Texas red (right).
Tables
Key resources table
| Reagent type (species) or resource | Designation | Source or reference | Identifiers | Additional information |
|---|---|---|---|---|
| Gene (Danio rerio) | pappaap170 | PMID:25754827 | RRID:ZFIN_ZDB-GENO-190322-4 | Single-nucleotide nonsense mutation C>T at position 964 in Exon 3 |
| Strain, strain background (Danio rerio) | Tg(brn3c:GFP) | PMID:15930106 | RRID:ZFIN_ZDB-ALT-050728-2 | |
| Strain, strain background (Danio rerio) | TLF | Zebrafish International Resource Center (ZIRC) | RRID:ZFIN_ZDB-GENO-990623-2 | |
| Antibody | anti-KDEL (mouse monoclonal) | Calbiochem | AB_212090 | 1:500 |
| Antibody | anti-GFP (rabbit polyclonal) | ThermoFisher Scientific | RRID:AB_221569 | 1:500 |
| Antibody | Alexa 488, secondary (rabbit polyclonal) | ThermoFisher Scientific | RRID:AB_2576217 | 1:500 |
| Other | mitotracker greenFM | ThermoFisher Scientific | Catalog number: M7514 PubChem CID:70691021 | 100 nM for 5 min |
| Other | 0.25% trypsin-EDTA | Sigma-Aldrich | Catalog number: T3924 | |
| Other | TRIzol | Invitrogen | Catalog number: 15596026 | |
| Other | Texas Red | ThermoFisher Scientific | Catalog number: T6134 | |
| Other | Sso fast Eva Green Supermix | Bio-Rad | Catalog number: 1725200 | |
| Chemical compound, drug | Neomycin | Sigma-Aldrich | Catalog number: N1142 | |
| Chemical compound, drug | NBI-31772 | Fisher Scientific | Catalog number: 519210 | |
| Chemical compound, drug | Thapsigargin | Tocris | Catalog number: 1138 | |
| Chemical compound, drug | Tunicamysin | Caymen Chemical | Catalog number: 11445 | |
| Commercial assay or kit | SuperScript II Reverse Transcriptase | Invitrogen | Catalog number: 18064014 | |
| Software, algorithm | Fluoview (FV10-ASW 4.2) | Olympus | RRID:SCR_014215 | |
| Software, algorithm | Imaris | Bitplane | RRID:SCR_007370 | |
| Software, algorithm | ImageJ | PMID:22743772 | RRID:SCR_003070 | |
| Software, algorithm | GraphPad PRISM | graphpad | RRID:SCR_002798 | |
| Software, algorithm | JMP Pro 15.0 | SAS Institute Inc | RRID:SCR_014242 |
Additional files
Download links
A two-part list of links to download the article, or parts of the article, in various formats.
Downloads (link to download the article as PDF)
Open citations (links to open the citations from this article in various online reference manager services)
Cite this article (links to download the citations from this article in formats compatible with various reference manager tools)
Pregnancy-associated plasma protein-aa regulates endoplasmic reticulum–mitochondria associations
eLife 10:e59687.
https://doi.org/10.7554/eLife.59687


