High neural activity accelerates the decline of cognitive plasticity with age in Caenorhabditis elegans
- Centre for Discovery Brain Sciences, Edinburgh Medical School: Biomedical Sciences, The University of Edinburgh, United Kingdom
- Edinburgh Genomics (Genome Science), Ashworth Laboratories, The University of Edinburgh, United Kingdom
- United Kingdom Dementia Research Institute, The University of Edinburgh, United Kingdom
- ZJU-UoE Institute, Zhejiang University, China
Figures
Figure 1 with 1 supplement
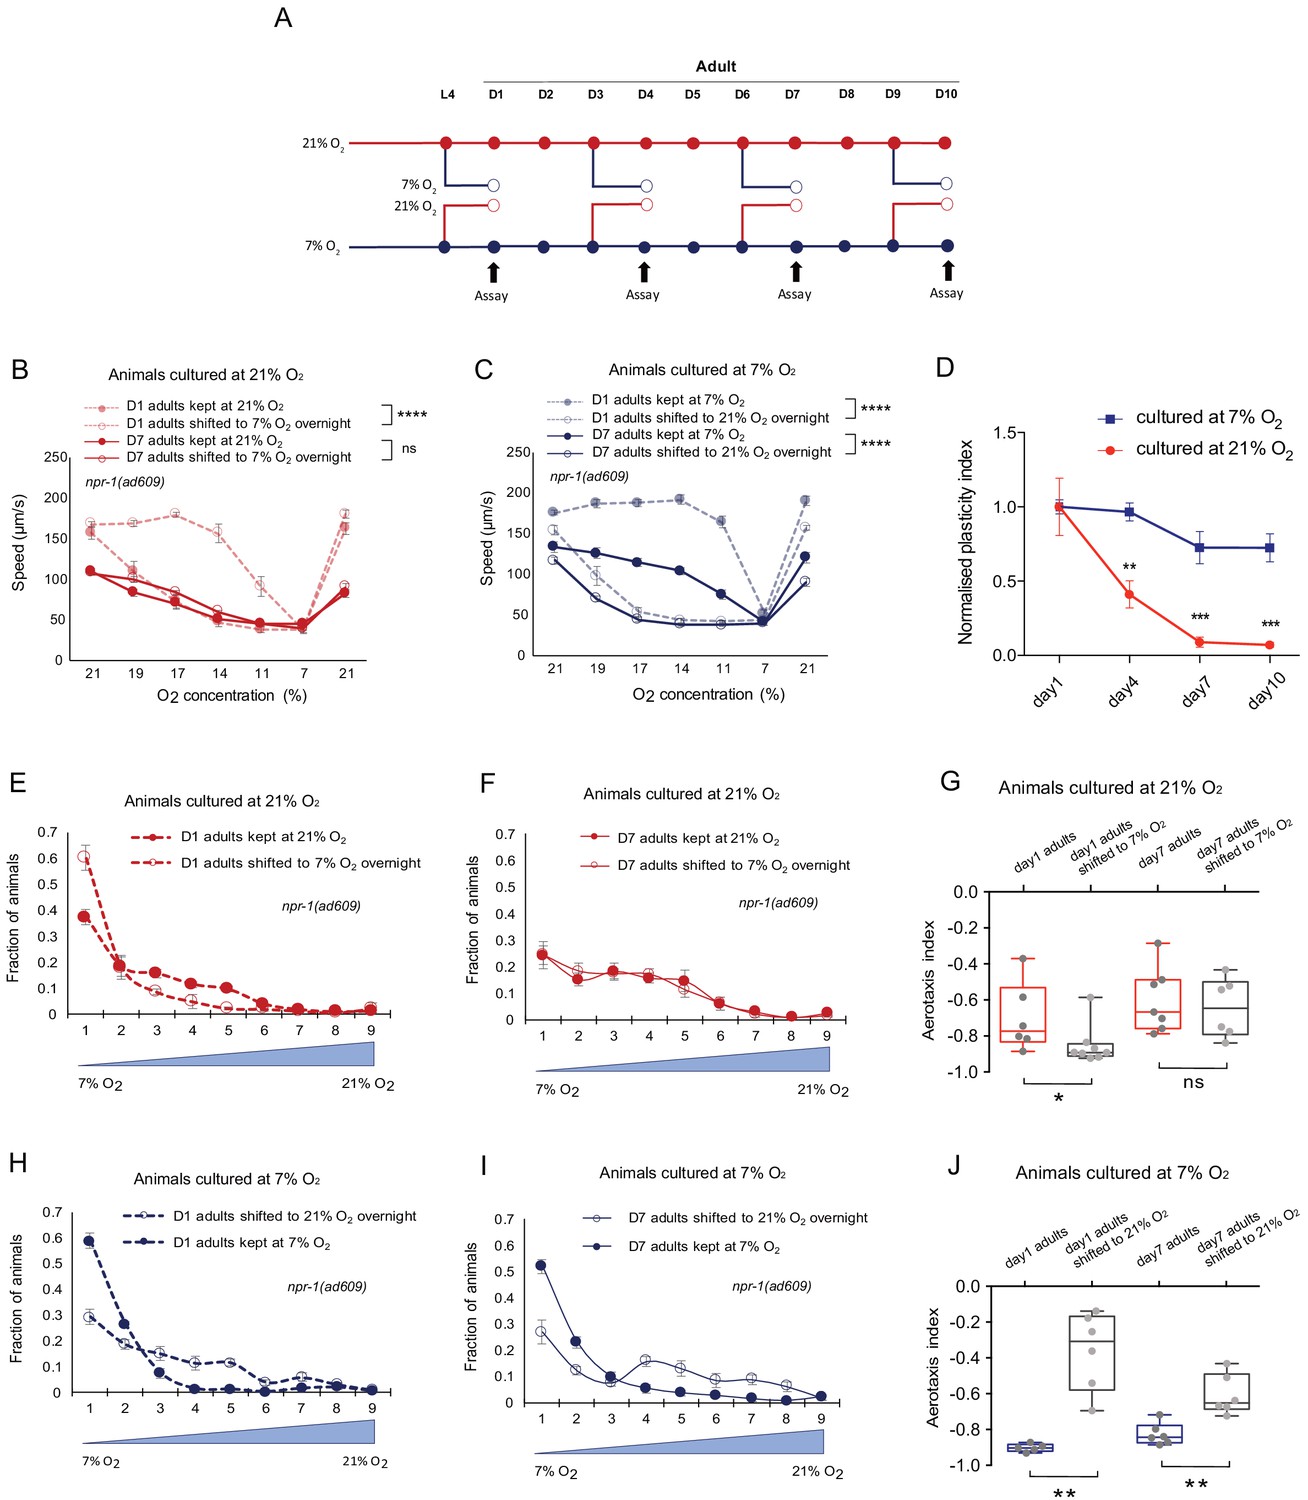
Previous oxygen experience determines the retention or loss of the plasticity of O2 responses with age in C. elegans.
(A) Assay scheme for testing O2-evoked speed responses of day 1, day 4, day 7, and day 10 adults. (B and C) O2-evoked speed responses of day 1 and day 7 adults cultured at 21% O2 (B) and 7% O2 (C), and speed responses after shifting to 7% O2 (B) and 21% O2(C) for overnight culturing at L4 stage and day 6 of adulthood respectively. Mean ± sem, n = 7 assays (70–140 animals) were performed for each condition, ****p<0.0001 indicates a significant effect of overnight O2 level shift on speed responses, ns, p>0.05, mixed model ANOVA. (D) Animals cultured at 7% O2 showed slower decline rate of plasticity with age compared to animals cultured at 21% O2. Mean ± sem, n = 3–7 assays (45–140 animals) for each condition, **p<0.01, ***p<0.001, asterisks indicate a significant difference between the normalized plasticity index of 21% and 7% O2 cultured animals, unpaired t-test with Holm-Sidak correction for multiple comparisons. (E and F) Aerotaxis assay showing O2 preference of day 1 (E) and day 7 adults (F) cultured at 21% O2 and after shifting to 7% O2 for overnight culturing. Animals were exposed to an O2 gradient from 7% to 21% O2 and the area was divided into nine grids for counting and calculation. Mean ± sem, n = 6–8 assays. (G) Aerotaxis index of day 1 adults cultured at 21% O2 showed plasticity after shifting to 7% O2, while day 7 adults cultured at 21% O2 showed no plasticity after shifting to 7% O2. Mean ± sem, *p<0.05, ns, p>0.05, Mann-Whitney U test. (H and I) Aerotaxis assay showing O2 preference of day 1 (H) and day 7 adults (I) cultured at 7% O2 and after shifting to 21% O2 for overnight culturing. Mean ±sem, n = 5–6 assays. (J) Aerotaxis index of day 1 and day 7 adults cultured at 7% O2 showed plasticity. Mean ± sem, **p<0.01, Mann-Whitney U test.
Figure 1—figure supplement 1

Behavioral assay program, O2-evoked speed responses during ageing, and assay paradigm validation.
(A) Behavioral assay set-up. Three cameras are located above each of the assay plates. During the assay, the chamber was sealed and mixed gas was pumped in at a steady flow rate. Worms were placed on the seeded low peptone plates inside the chamber. (B) Assay program for testing worms’ O2-evoked speed responses of 21% and 7% O2 cultured day 1 adults. A full round assay lasts for 32 min. Specifically, the program is set as 8 min of 21% O2, followed by 19%, 17%, 14%, 11%, 7%, 21% O2 for 4 min at each step. (C–E) O2-evoked speed responses gradually decline with age for animals cultured at 21% O2 throughout (C), or shifted to 7% O2 overnight (D), and animals cultured at 7% O2 throughout (E), or shifted to 21% O2 overnight (F). Mean ±sem, three or more assays were performed for each condition. (G and H) O2-evoked speed responses of day seven adults cultured at 21% and 7% O2 and shifted from 7% to 21% O2 (G) or shifting from 21% to 7% O2 (H). Mean ±sem, five or more assays were performed for each condition. (I) Plasticity of day 7 adults cultured at 7% O2 is significantly higher than animals cultured at 21% O2 after shifting from 7% to 21% O2 or shifting from 21% to 7% O2. Mean ±sem, *p<0.05, **p<0.01, unpaired t-test.
Figure 2 with 1 supplement
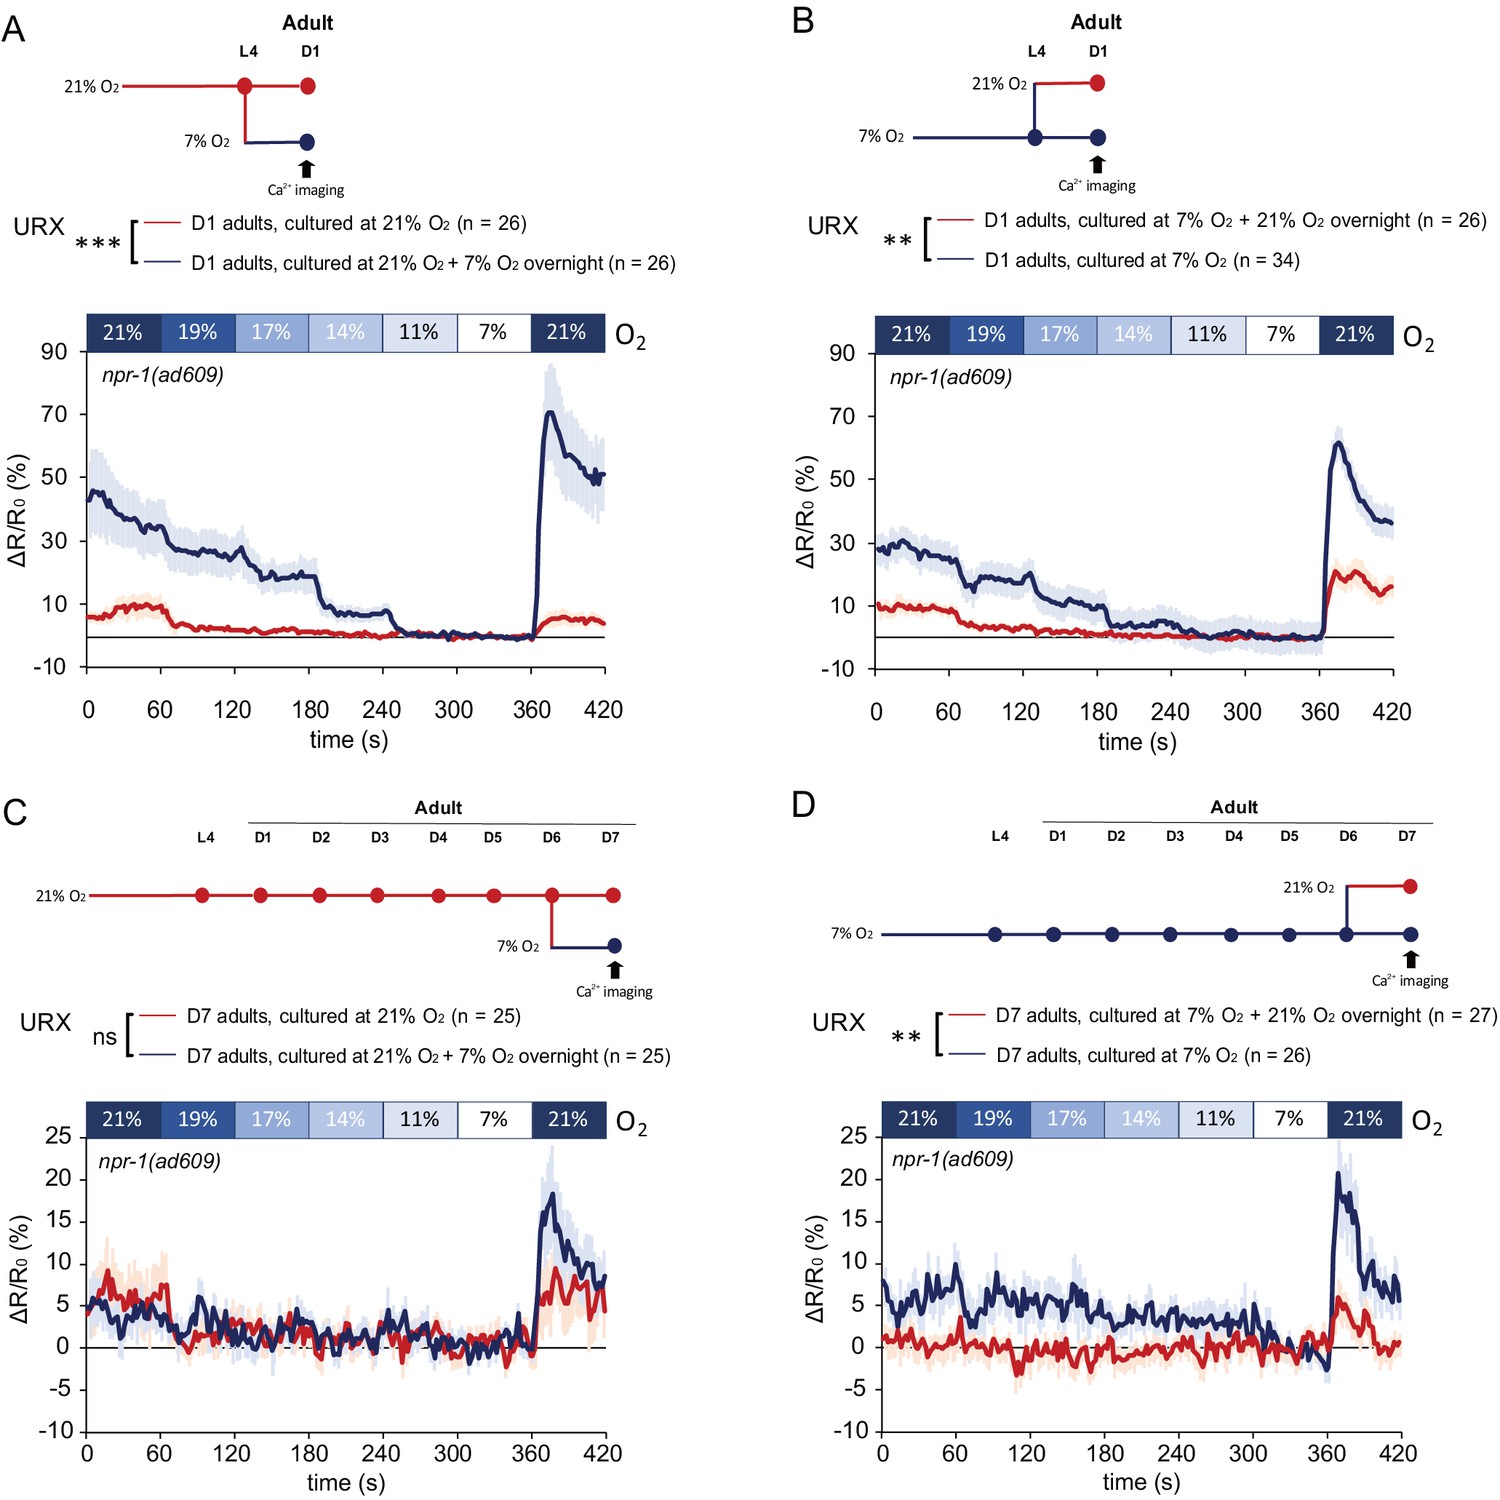
Plasticity of O2-evoked Ca2+ responses in URX of day7 adults is lost when neurons are chronically stimulated with 21% O2, but is retained when neurons are persistently inactive at 7% O2.
(A and B) Ca2+ responses of URX to O2 of day one adults grown at 21% (A) and 7% O2 (B), and Ca2+ responses of animals shifted to the opposite O2 condition the night before imaging. O2 was applied in the following order the same as speed assay: 21%, 19%, 17%, 14%, 11%, 7%, and 21%. Each step lasts for 1 min. Mean ± sem, n = 26–34 animals per condition, for each 1 min step, 11–60 s period was used for statistical analysis, **p<0.01, ***p<0.001, asterisks indicate a significant effect of overnight O2 level shift on Ca2+ responses, mixed model ANOVA. (C and D) Ca2+ responses of URX to O2 of day 7 adults grown at 21% (C) and 7% O2 (D), and Ca2+ responses of animals shifted to the opposite O2 condition the night before imaging. Mean ±sem, n = 25–27 animals per condition, for each 1 min step, 11–60 s period was used for statistical analysis, **p<0.01, ns, p>0.05, asterisks indicate a significant effect of overnight O2 level shift on Ca2+ responses, mixed model ANOVA.
Figure 2—figure supplement 1
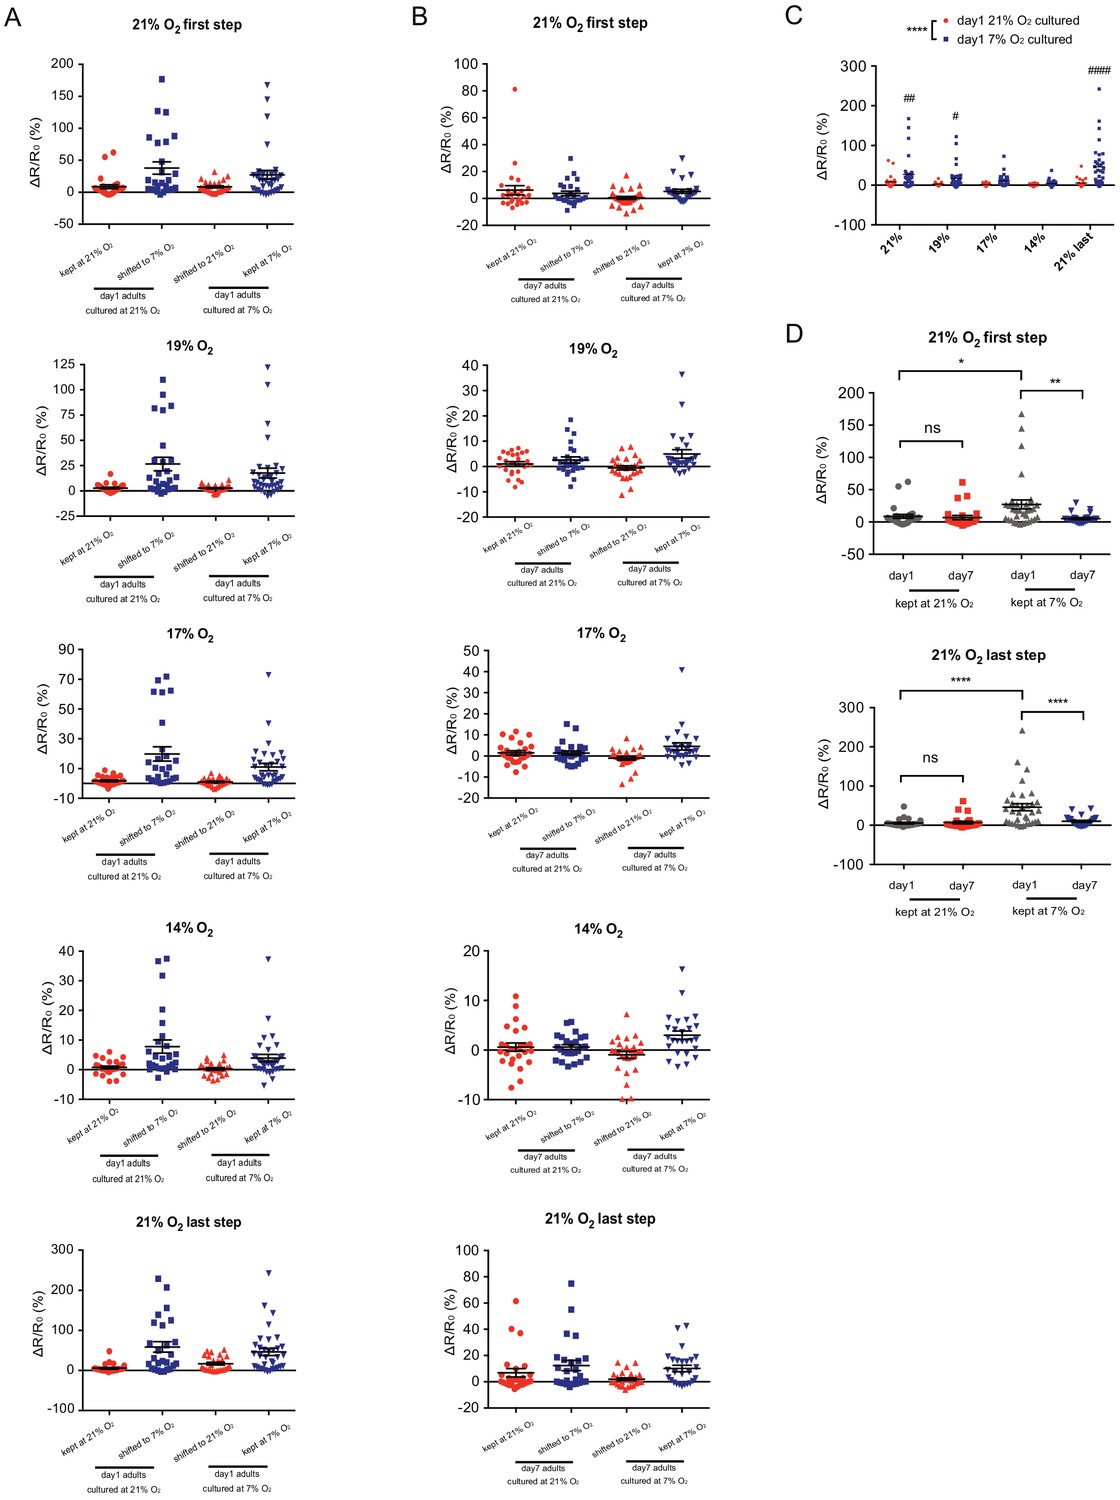
Scatter plots showing URX Ca2+ responses of day 1 and day 7 adults cultured at 21% or 7% O2.
(A–B) Scatter plots of URX Ca2+ responses of day 1 (A) and day 7 (B) adults at 21%, 19%, 17%, 14% O2 and after the upstep back to 21%O2. (CE) URX of 7% O2 cultured animals displays elevated [Ca2+] to high (21%) and intermediate (19%, 17%, 14%) O2 compared to 21% O2 cultured animals. ****p<0.00015 indicates a significant effect of O2 culture condition on Ca2+ responses, #p<0.5, ##p<0.01, ####p<0.0001 indicates a significant difference of Ca2+ response at that O2 concentration, mixed model ANOVA with Holm-Sidak test. (DF) URX Ca2+ responses to the initial and final (21%) O2 stimulus steps are increased in 1-day-old 7% O2 cultured animals relative to those of 21% O2 cultured animals, and decline with age only in the 7% O2 cultured animals. *p<0.05, **p<0.01, ****p<0.0001, ns, p>0.05, one-way ANOVA with Holm-Sidak test.
Figure 3 with 2 supplements
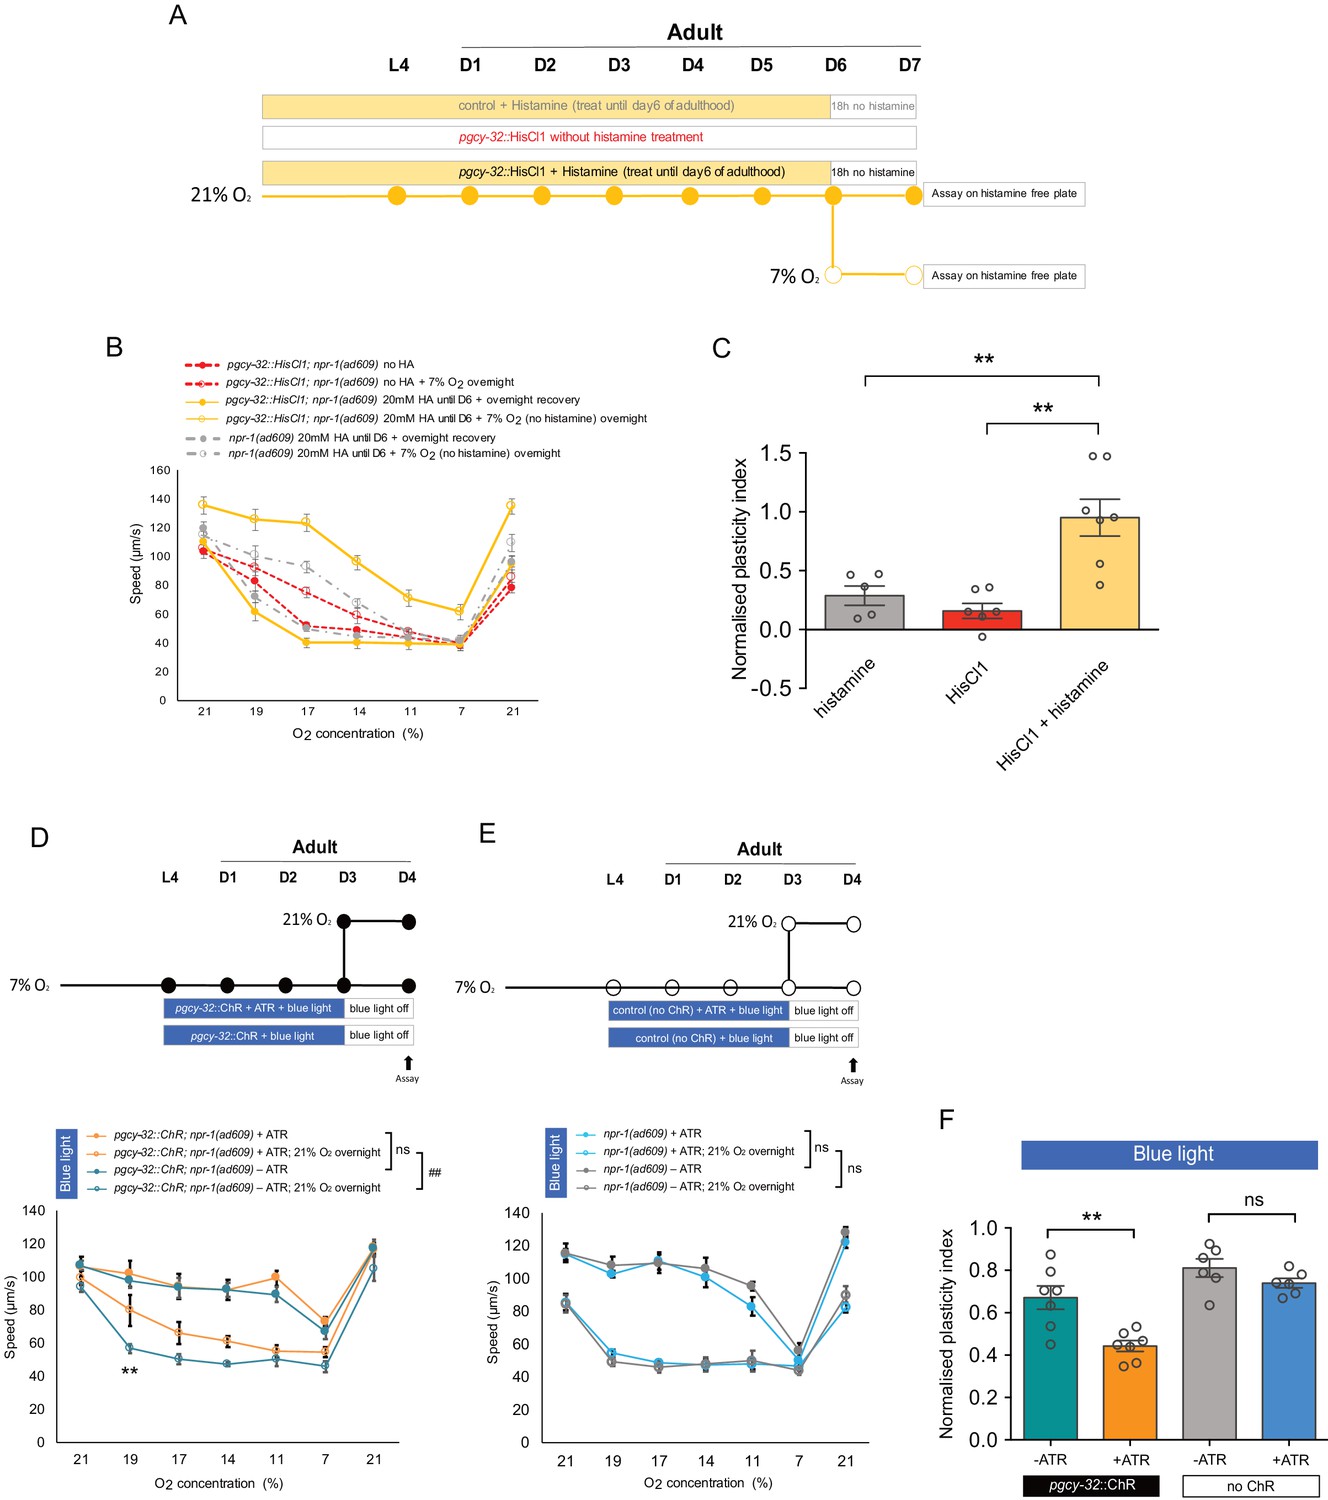
Long-term inhibition of neuronal activity restores, whereas long-term neuronal excitation accelerates the decline of age-related plasticity.
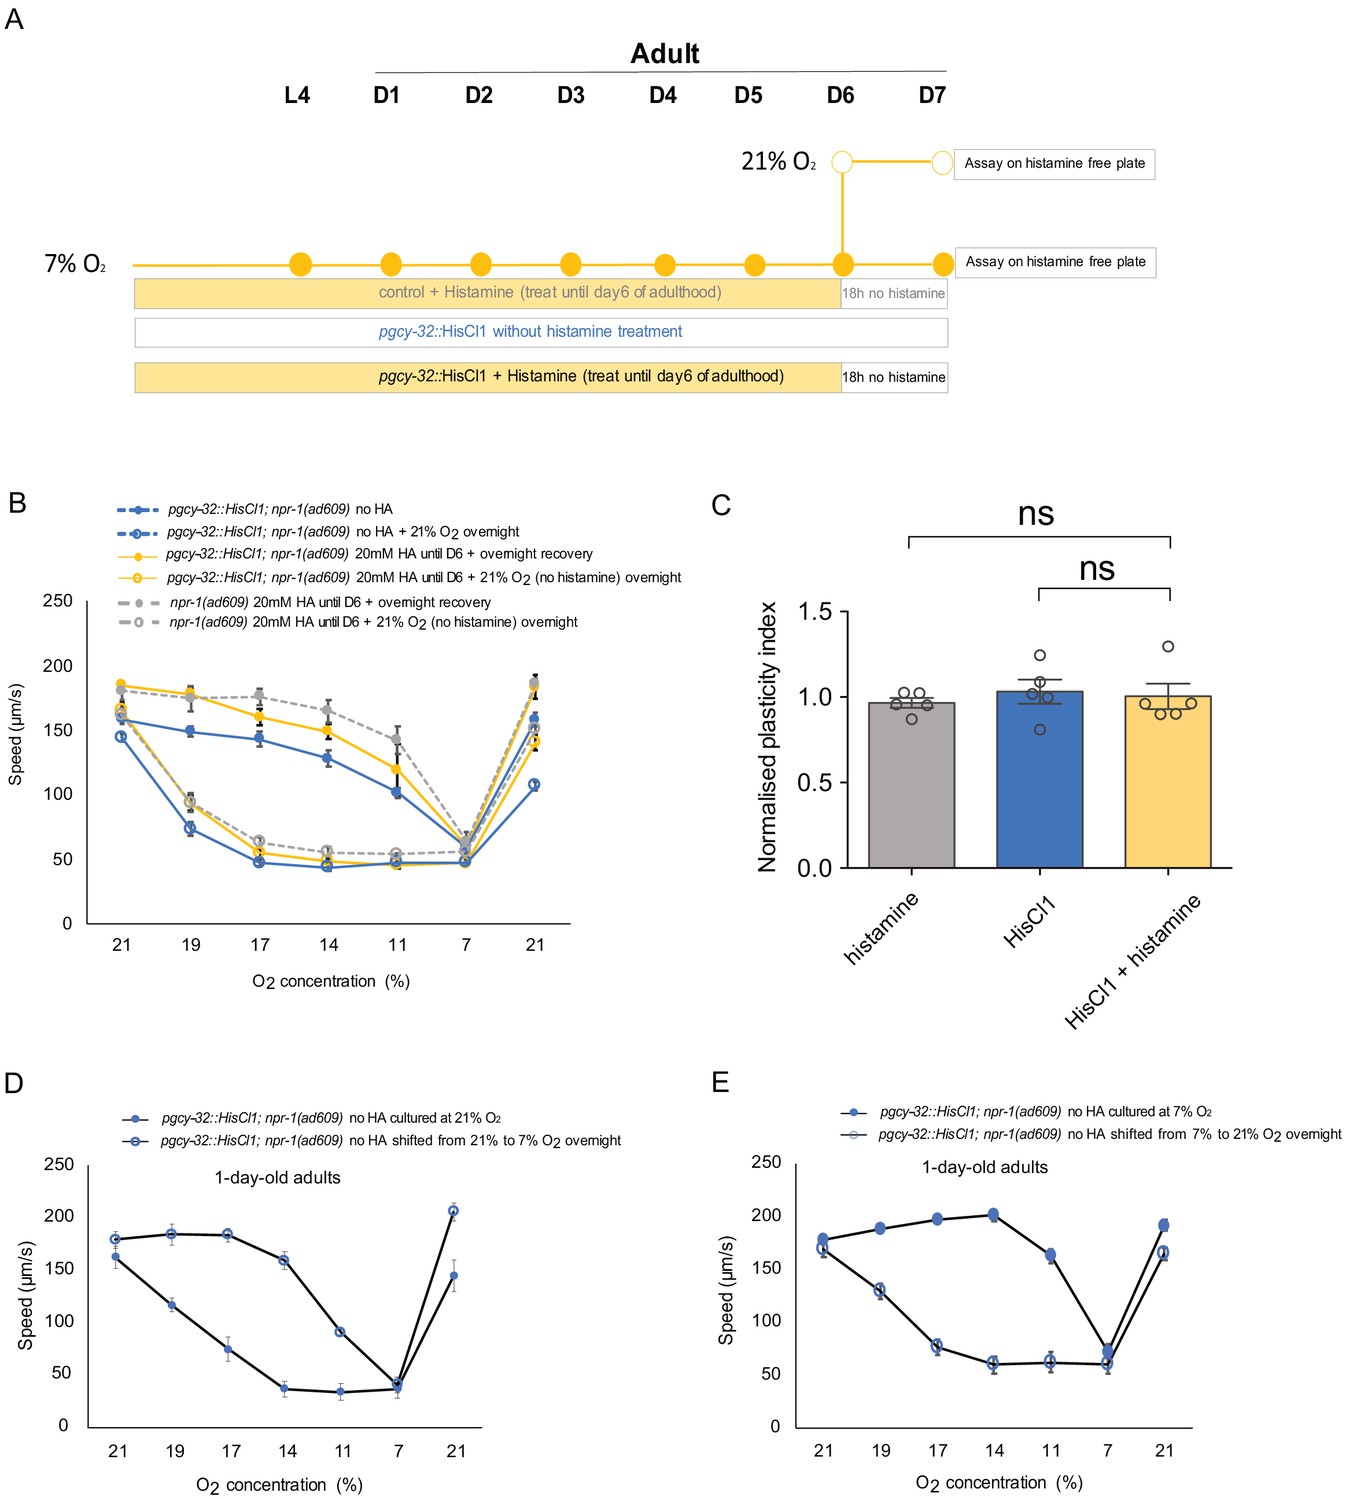
(A) Assay scheme of long-term silencing of O2-sensing neurons by histamine induced HisCl1 in O2-sensing neurons. (B) O2-evoked speed responses of pgcy-32::HisCl1 animals with and without 20 mM histamine treatment, and control animals with 20 mM histamine treatment. Mean ±sem, n = 5–7 assays (75–140 animals) per condition. Mean ±sem. (C) Plasticity of pgcy-32::HisCl1 day 7 adults treated with 20 mM histamine is significantly higher than pgcy-32::HisCl1 animals without histamine treatment, or control animals with 20 mM histamine treatment. Plasticity indices were normalized to day 1 no histamine treated pgcy-32::HisCl1 adults. Mean ±sem, **p<0.01, unpaired t-test. (D–E) O2-evoked speed responses of day 4 adults with (D) and without (E) pgcy-32::ChR expression treated with all-trans retinal (ATR) and blue light from L4 stage to day 3 of adulthood. Mean ±sem, n = 6–7 assays, ##p<0.01 indicates a significant difference of O2-evoked speed responses upon ATR treatment, **p<0.01 next to the data point in the plot indicates a significant difference of speed at this [O2] point, mixed model ANOVA with Holm-Sidak test. (F) Long-term optogenetic stimulation accelerates plasticity decline with age. Mean ±sem, **p<0.01, ns, p>0.05, unpaired t-test.
Figure 3—figure supplement 1
Inhibition of neuronal activity does not affect the plasticity of day seven adults cultured at 7% O2.
(A) Assay scheme of long-term silencing of O2-sensing neurons by histamine induced HisCl1 in O2-sensing neurons for animals cultured at 7% O2. (B) O2-evoked speed responses of pgcy-32::HisCl1 animals with and without 20 mM histamine treatment, and control animals with 20 mM histamine treatment. Mean ±sem, n = 5 assays per condition. Mean ±sem. (C) Inhibition of neuronal activity by HisCl1 at 7% O2 does not affect the plasticity of day 7 adults. Mean ±sem, **p<0.01, unpaired t-test. (D–E) O2-evoked speed responses of pgcy-32::HisCl1 animals cultured at 21% (D) or 7% (E) O2 at day 1 adulthood without histamine treatment. Mean ±sem, n = 3–4 assays per condition.
Figure 3—figure supplement 2
Organismal oxidative stress is not responsible for the accelerated plasticity decline with age for 21% O2 cultured animals.
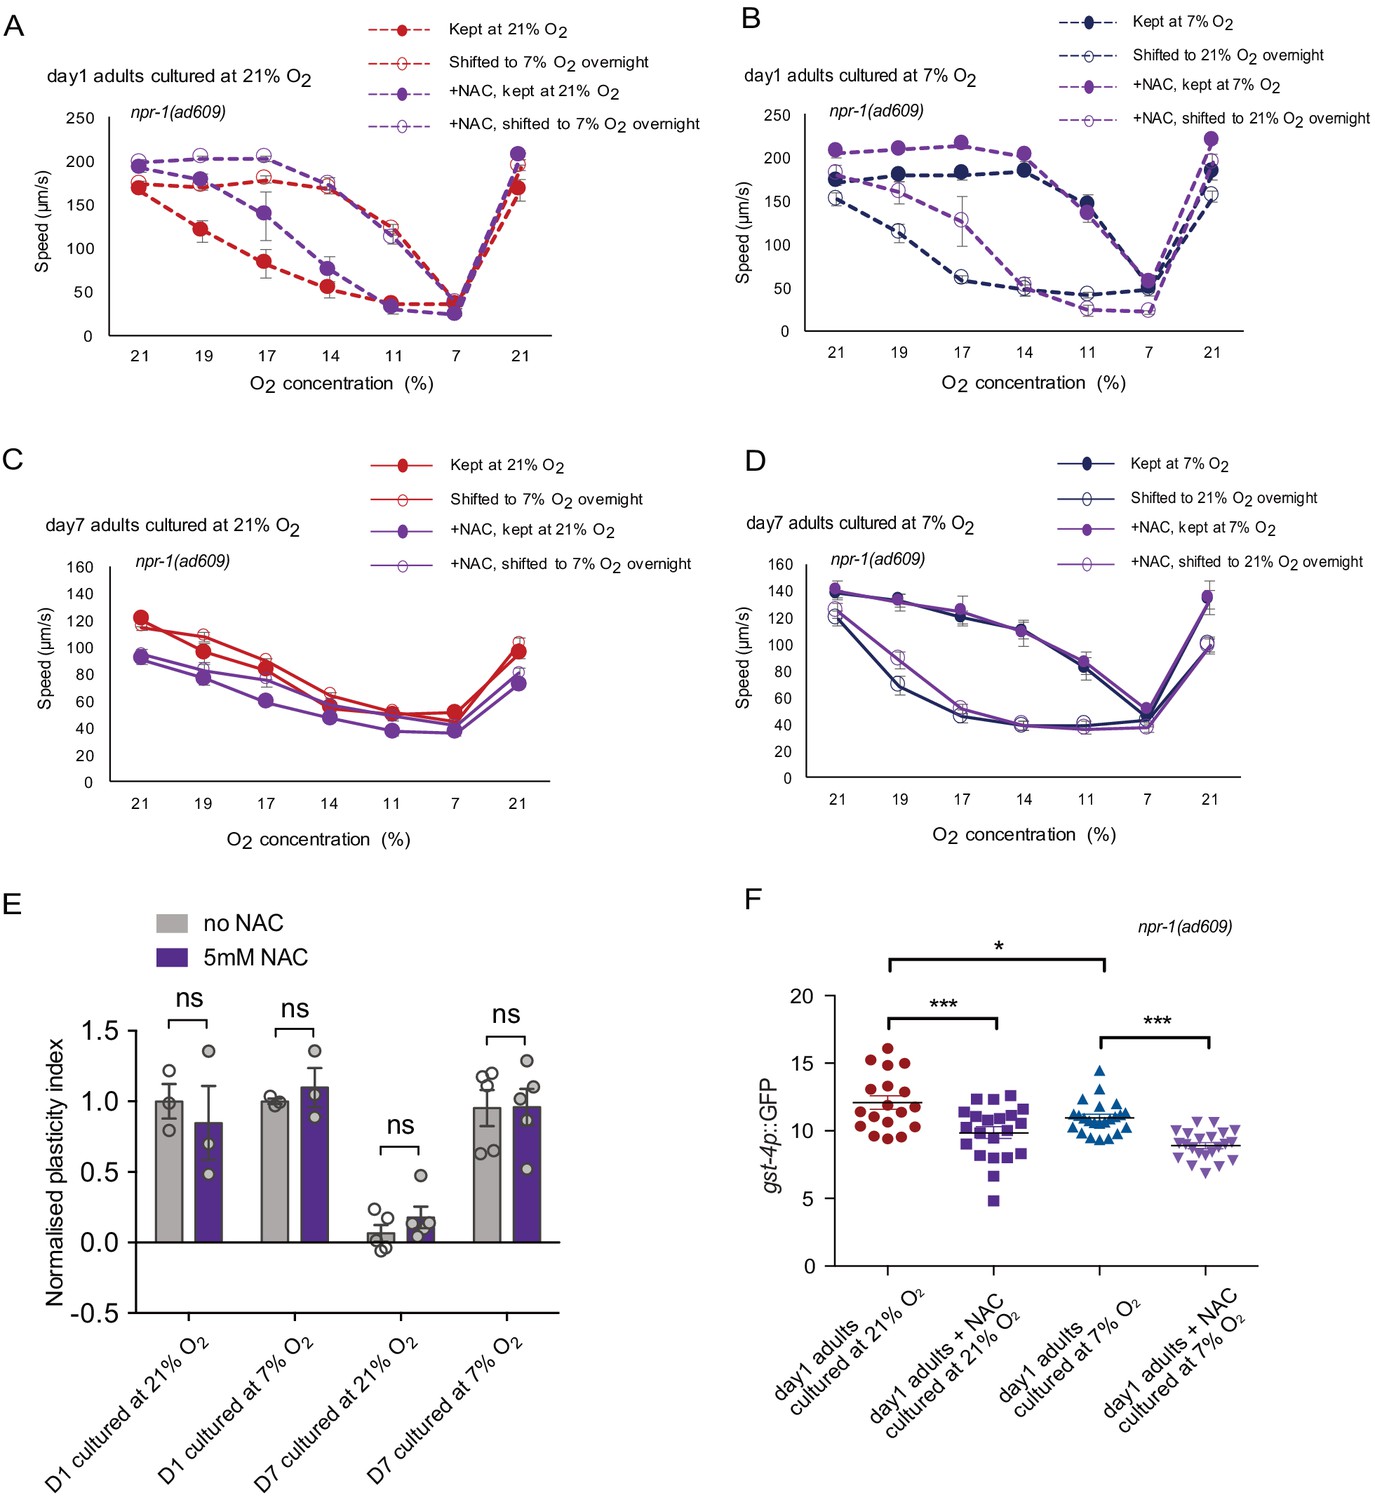
(A–D) O2-evoked speed responses of animals with and without 5 mM NAC treatment. Day 1 adults cultured at 21% O2 (A) and 7% O2 (B), and day 7 adults cultured at 21% O2 (C) and 7% O2 (D). Mean ±sem, three or more assays were performed for each condition. (E) 5 mM NAC treatment does not improve plasticity decline with age. Mean ±sem, ns, p>0.05, unpaired t-test. (F) Fluorescence quantification of gst-4p-induced GFP expression in animals with and without 5 mM NAC treatment. Mean ±sem, n = 13–23 animals each condition, *p<0.01, ***p<0.0001, ns, p>0.05, one-way ANOVA with Holm-Sidak test.
Figure 4 with 2 supplements
Neuronal activity state dynamically alters the expression of specific sets of genes in O2-sensing neurons of 1- and 7-day-old adults.
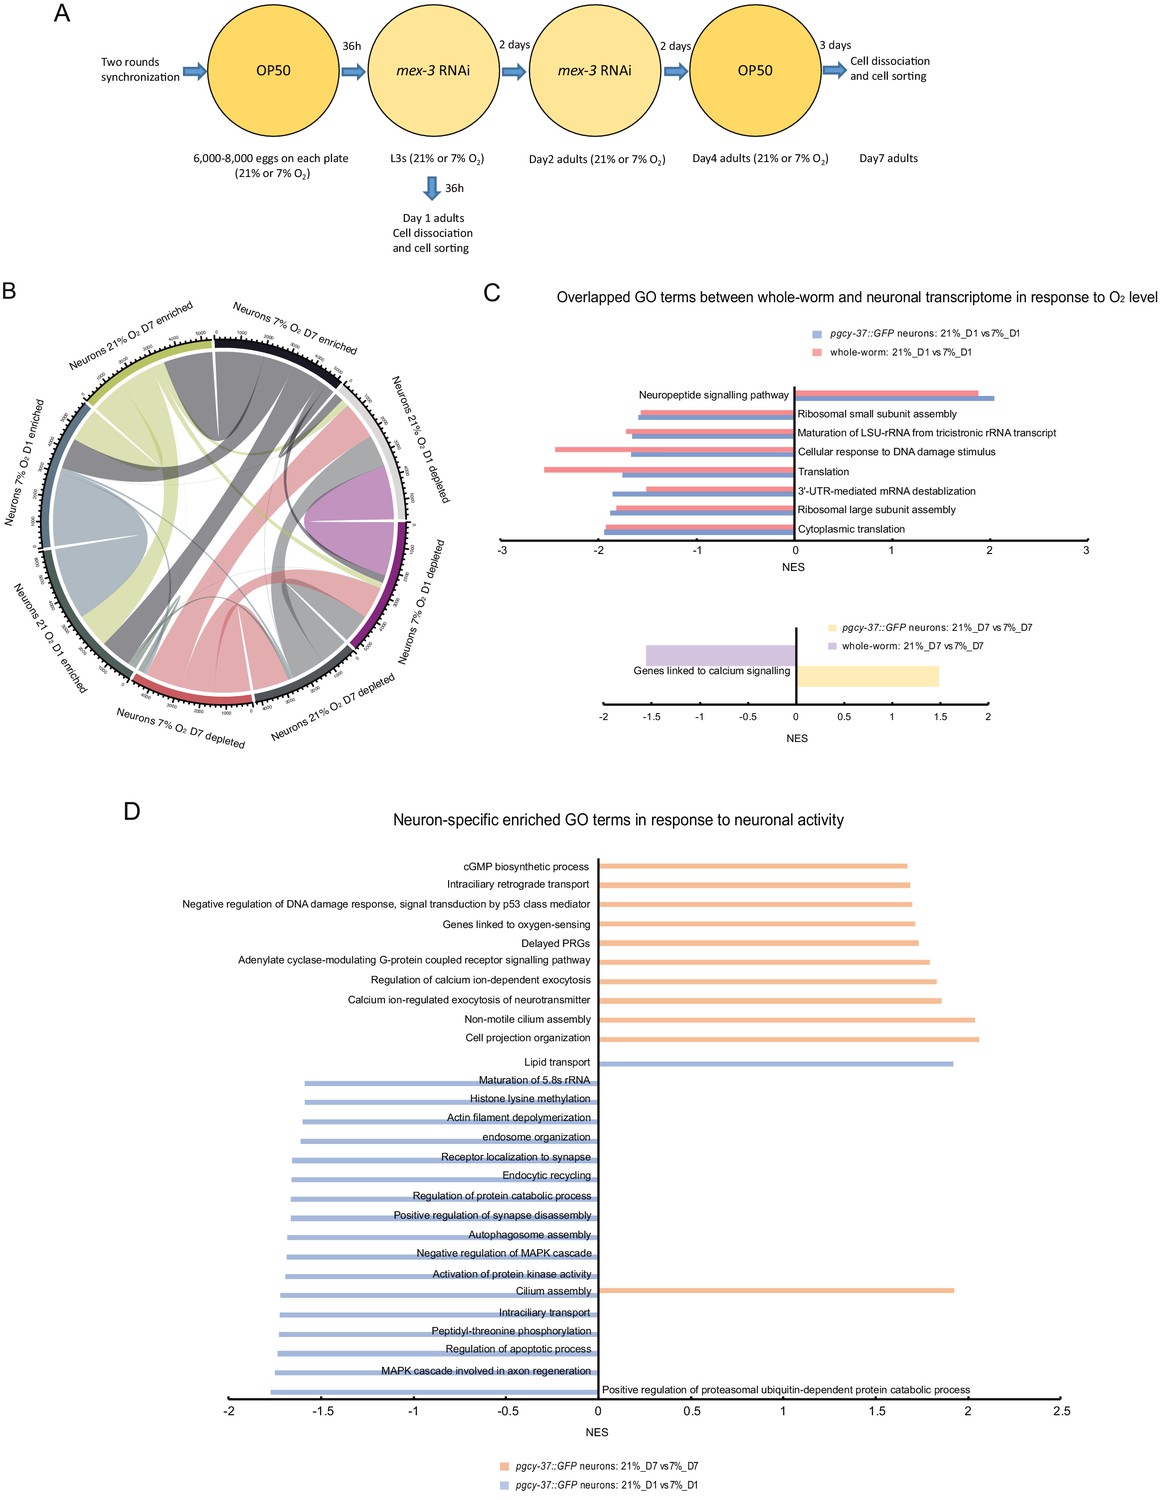
(A) Experimental overview of animal preparation and cell sorting for day 1 and day 7 adults. Animals were synchronized by bleaching and the eggs were plated on OP50 plates. L3 stage animals were transferred to mex-3 RNAi bacterial seeded plates to avoid progeny contamination (see Materials and methods for details). Day four adults were transferred to OP50 plate again until cell dissociation for FACS sorting and RNA preparation. (B) Chord diagram showing overlapped enriched and depleted genes across sorted neurons of day 1 and day 7 adults cultured at 21% and 7% O2 respectively. The numbers around the circle signify number of genes. FDR < 0.1 and fold change >1.5. (C) Enriched GO terms (with potential neuronal functions) for O2 level-induced changes that are present in both whole worm and sorted neurons of day 1 and day 7 adults respectively. NES, normalized enrichment score. p<0.05 and FDR < 0.25. (D) Neuron-specific GO terms (with potential neuronal functions) in response to O2-induced neuronal activity in day 1 and day 7 adults. p<0.05 and FDR < 0.25.
Figure 4—figure supplement 1

Structural and functional validation of the strain for cell-specific RNA-sequencing.
(A–B) O2-sensing neurons (URX, AQR and PQR) and a touch receptor neuron AVM with GFP expression in day 1 (A) and day 7 (B) adults. Neurons are intact in both day 1 and day 7 adults. Scale bar = 20 µm. (C–E) In vivo functional Ca2+ imaging for ASI (C), AVM (D), and URX (E) in response to O2 levels. AVM and ASI do not show response to 21% O2. Mean ±sem. (F) Cell-specific RNAi knockdown of mex-3 does not affect O2-evoked behavior and its plasticity. Mean ±sem, n = 3 assays. (G) mex-3 RNAi feeding for the whole worm does not affect O2-evoked behavior and its plasticity in day 2 adults. Mean ±sem, n = 3 assays. (H) mex-3 RNAi feeding for the whole worm does not affect activity-dependent decline of plasticity with age. Mean ±sem, n = 3 assays.
Figure 4—figure supplement 2
Comparison of activity-regulated DEGs between neuronal and whole worm, as well as between day 1 and day 7 samples.
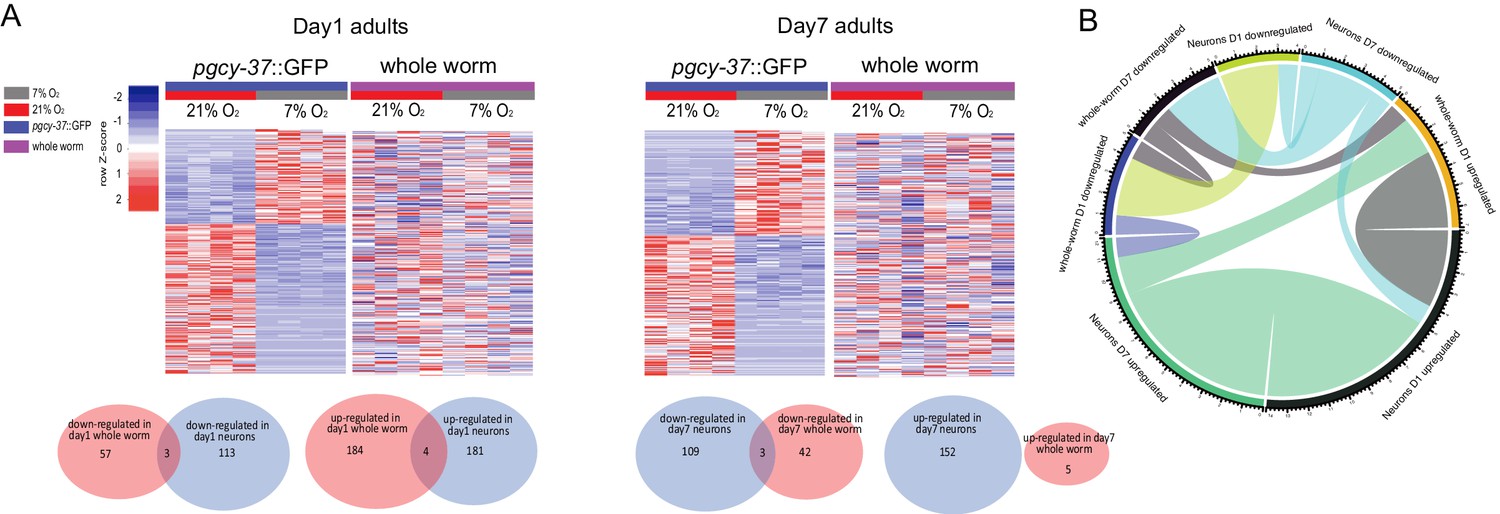
(A) Heatmaps and Venn diagrams showing the comparisons of the activity-regulated differentially expressed genes between sorted O2-sensing neurons and whole worm. FDR < 0.1 and fold change >1.5 for DEGs in sorted neurons. (B) Chord diagram showing overlapped O2-induced up- and down-regulated genes across whole worm and sorted O2-sensing neurons that cultured at 21% and 7% O2, respectively. The numbers around the circle signify number of genes. FDR < 0.1 and fold change >1.5.
Figure 5 with 1 supplement
Neuronal activity state alters age-related changes in the neuronal transcriptome of O2-sensing neurons.
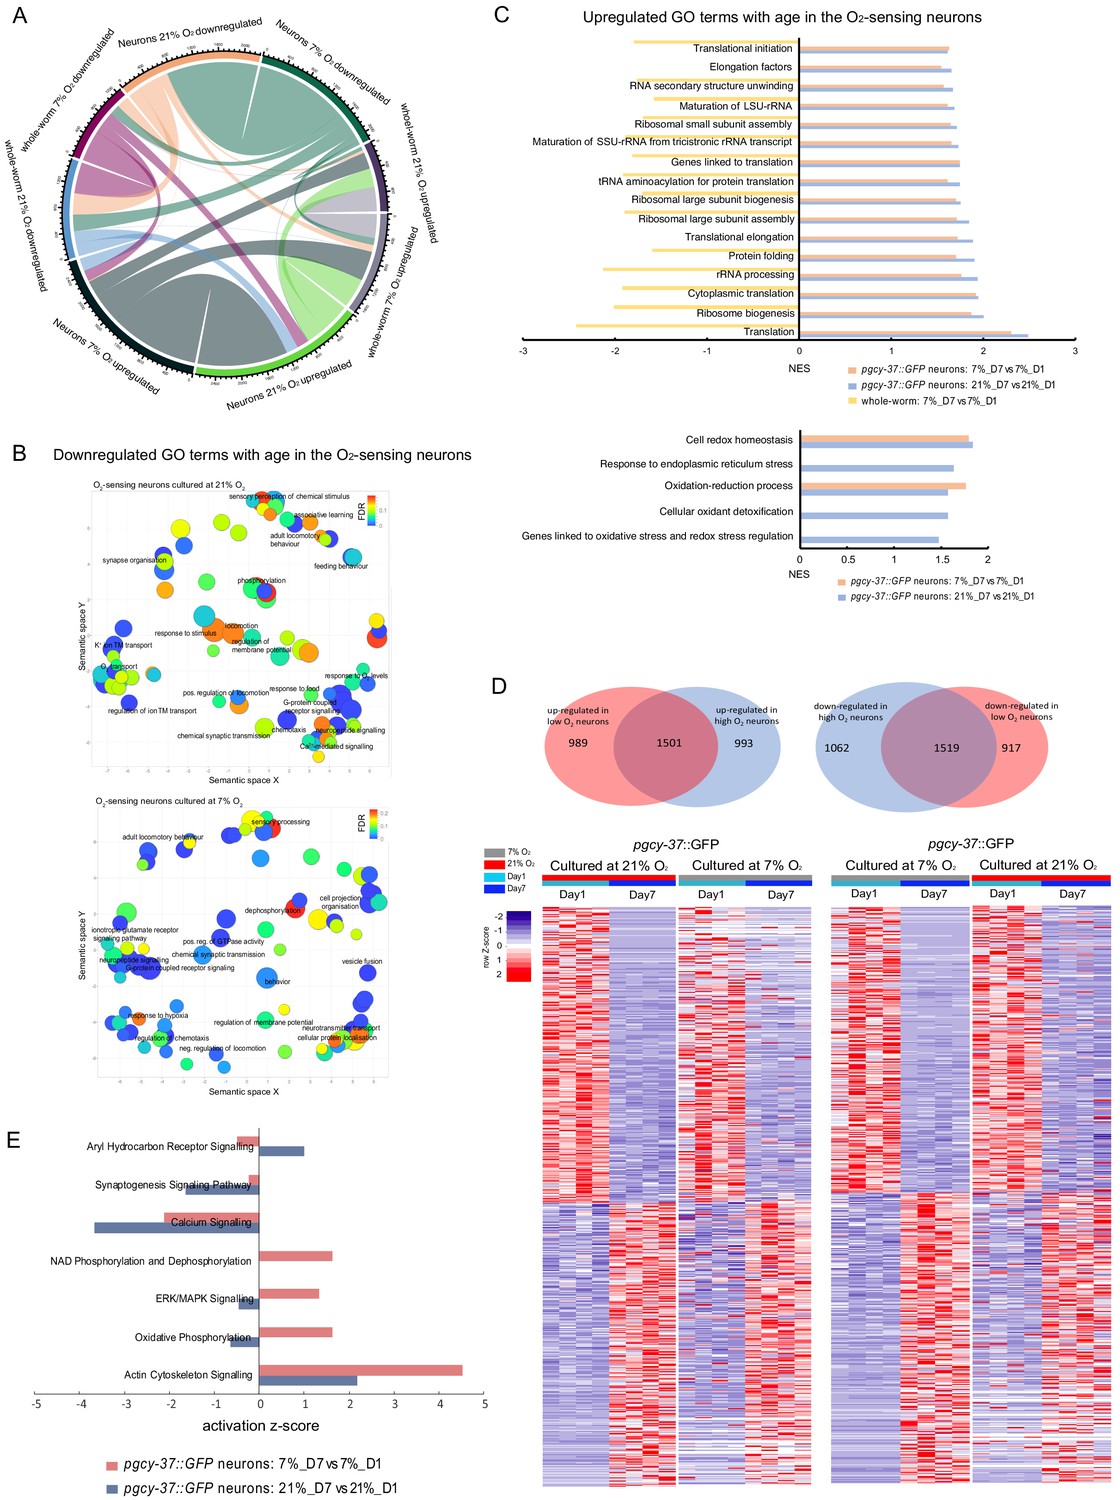
(A) Chord diagram showing overlapped age-related up- and down-regulated genes across whole worm and sorted neurons that cultured at 21% and 7% O2 respectively. The numbers around the circle signify number of genes. FDR < 0.1 and fold change >1.5. (B) GO terms related to the neuronal activity are generally downregulated in aged neurons. REVIGO plot. p<0.05 and FDR < 0.25. (C) GO terms related to antioxidant defenses and translation are generally upregulated in aged neurons. p<0.05 and FDR < 0.25. (D) Venn diagrams and heatmaps showing the comparison of age-related up- and down-regulated genes between low and high activity neurons. FDR < 0.1 and fold change >1.5. (E) Canonical pathways with potential neuronal functions with a difference of z-score >1.3 between 21% and 7% O2 exposed sorted neurons from IPA analysis. See supplementary file 8 for a full list.
Figure 5—figure supplement 1
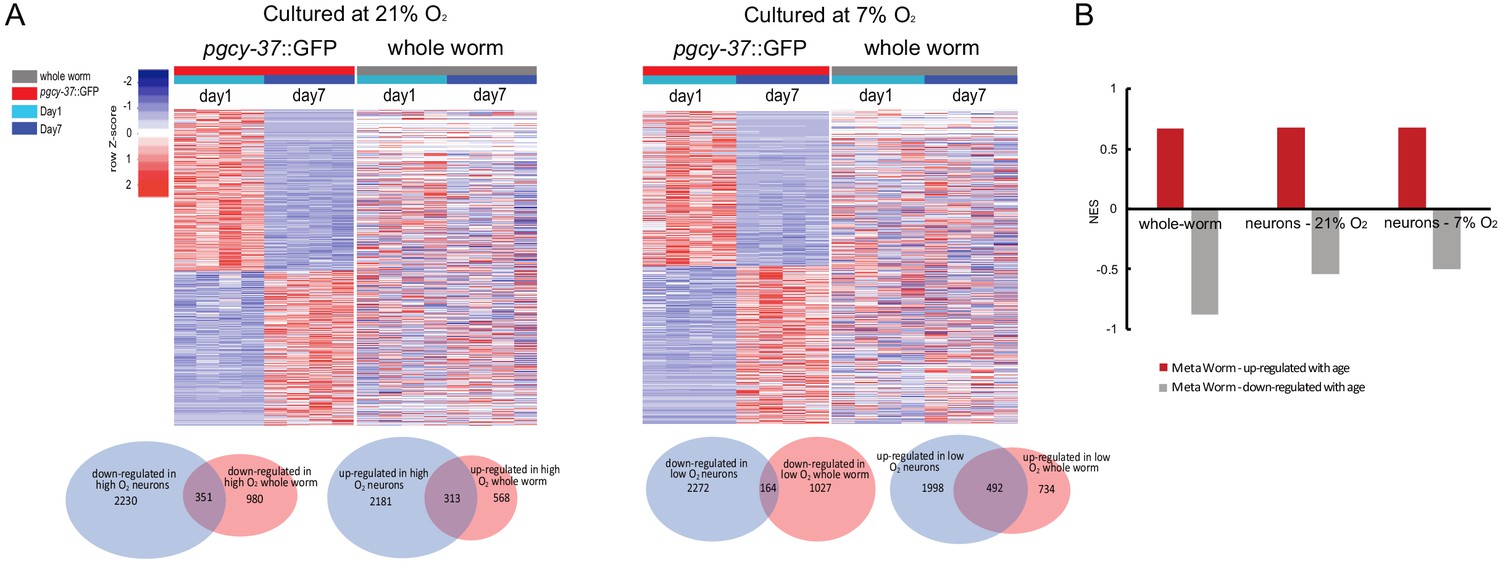
Comparison of age-regulated DEGs between neuronal and whole worm samples, and comparison of age-regulated DEGs with MetaWorm gene sets.
(A) Heatmaps and Venn diagrams showing the comparisons of the age-regulated differentially expressed genes between sorted O2-sensing neurons and whole worm samples. FDR < 0.1 and fold change >1.5 for DEGs in sorted neurons. (B) Gene set enrichment analysis for MetaWorm age-related upregulated and downregulated gene sets in age-related changes in whole-worm and neuronal transcriptomes. FDR < 0.05 for all NES reported here.
Figure 6 with 2 supplements
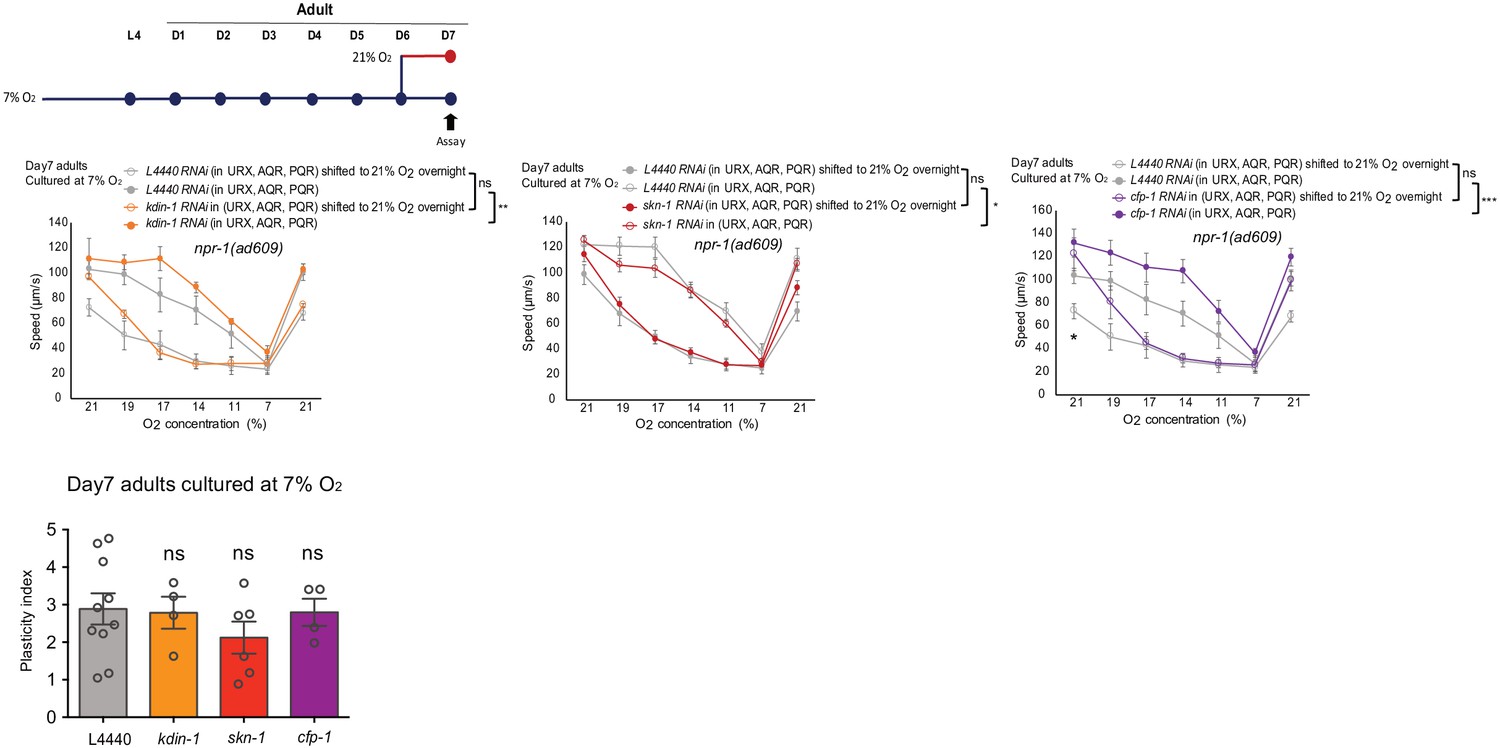
Genes selectively downregulated in ageing low-activity neurons underpin plasticity decline with age.
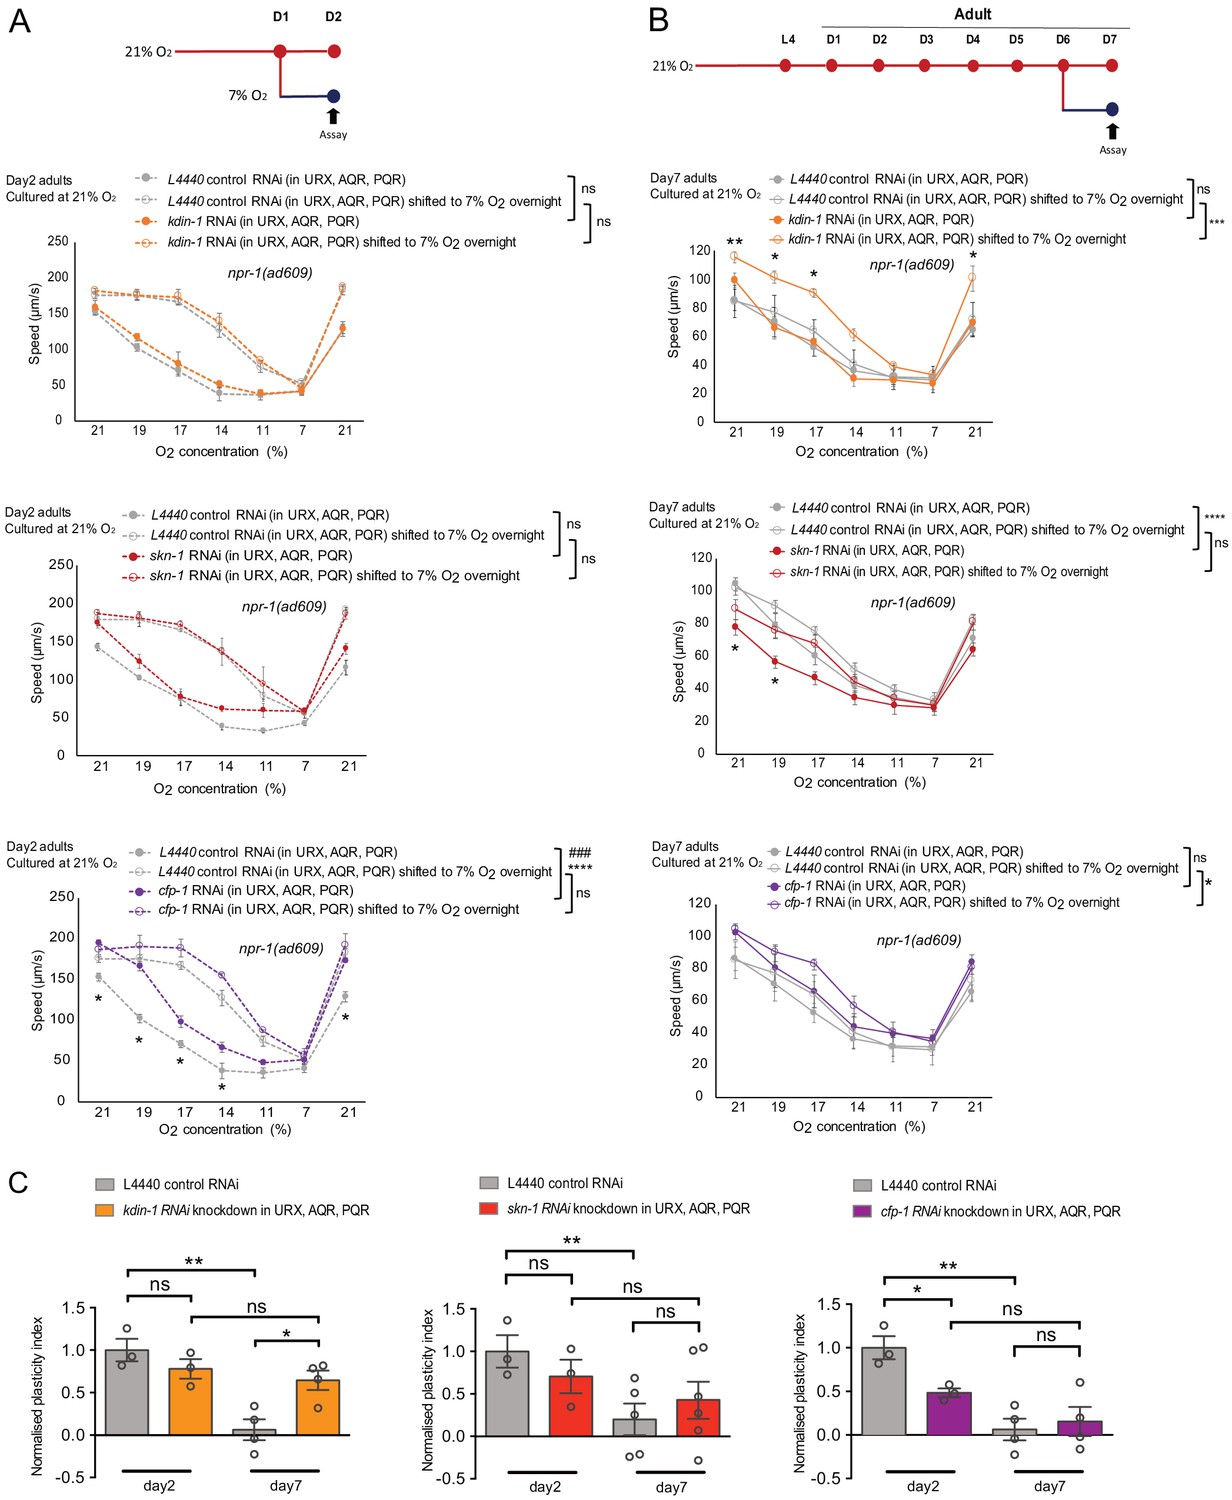
(A–B) Behavioral test of three DEGs from RNA-seq day 7 neuron samples that specifically downregulated in ageing low-activity neurons. Strain KL92 (sid-1(pk3321) V.; npr-1(ad609) X.; cipIs7[pgcy-32::sid-1::SL2-GFP] V) is used for cell-specific RNAi knockdown by feeding. Mean ±sem, *p<0.05, **p<0.01, ***p<0.001, ****p<0.0001, ns, p>0.05, asterisks above the speed plot indicate a significant interaction between the effect of gene knockdown and [O2] steps on speed responses, asterisks next to the data point in the plot indicate a significant difference of speed at this [O2] point compared to either RNAi feeding or control animals experienced the same O2 culture condition, ###p<0.001 indicates a significant gene knockdown effect on O2-evoked speed responses at that culture condition, mixed model ANOVA with Holm-Sidak test. (C) Normalized plasticity index of kdin-1, skn-1 and cfp-1 cell-specific RNAi knockdown animals. Mean ±sem, *p<0.05, **p<0.01, ns, p>0.05, unpaired t test.
Figure 6—figure supplement 1
Functional validation of top gene candidates from RNA-seq day one neuron samples.
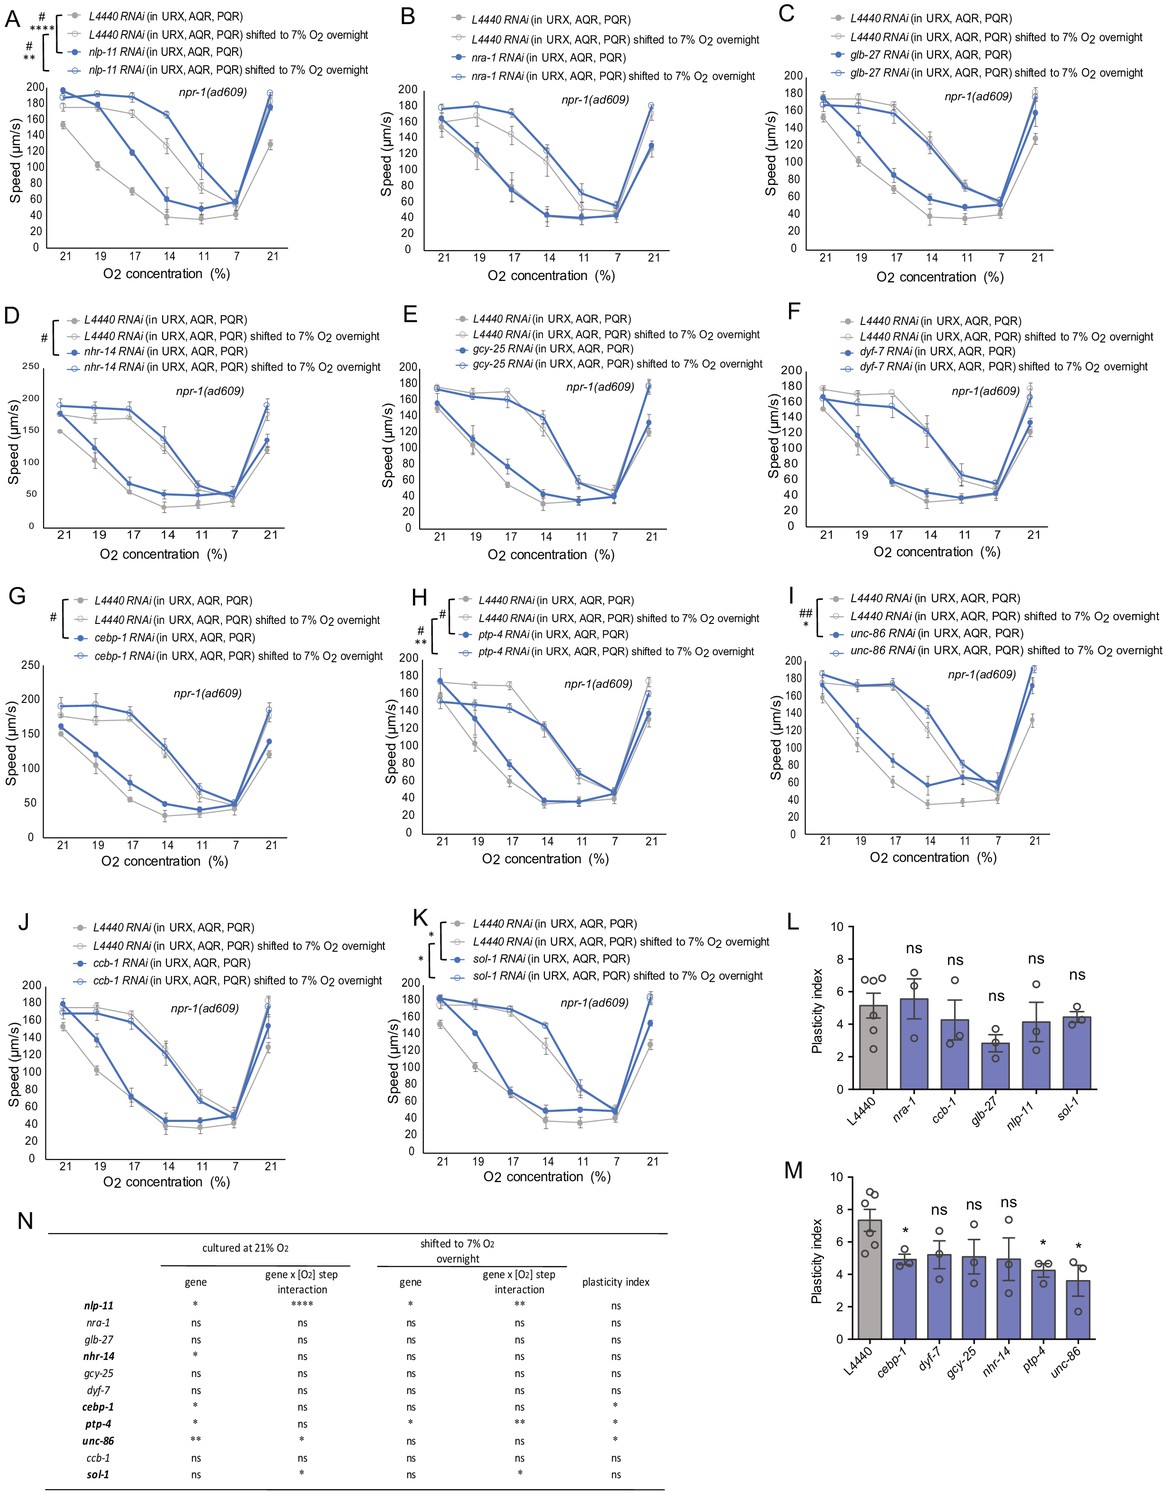
(A–K) Behavioral validation of top gene candidates from RNA-seq day one neuron samples. 6 out of 11 showed phenotypes of O2-evoked speed responses or its plasticity in young adults. Mean ±sem, three or more assays were performed for each gene each condition, *p<0.05, **p<0.01, ***p<0.001, ****p<0.0001, indicates a significant interaction between the effect of gene knockdown and [O2] steps on speed responses, #p<0.05, ##p<0.01 indicates a significant gene knockdown effect on O2-evoked speed responses at that culture condition. (L and M) Plasticity index of gene candidates tested. Mean ±sem, *p<0.05, ns, p>0.05. (N) Statistical summary of candidates tested by mixed model ANOVA.
Figure 6—figure supplement 2
O2-evoked speed responses and plasticity index of 7% O2 cultured day 7 adults.
Mean ±sem, *p<0.05, **p<0.01, ***p<0.001, ns, p>0.05, asterisks above the speed plot indicate a significant interaction between the effect of gene knockdown and [O2] steps on speed responses, asterisks next to the data point in the plot indicate a significant difference of speed at this [O2] point compared to either RNAi feeding or control animals experienced the same O2 culture condition.
Figure 7 with 2 supplements
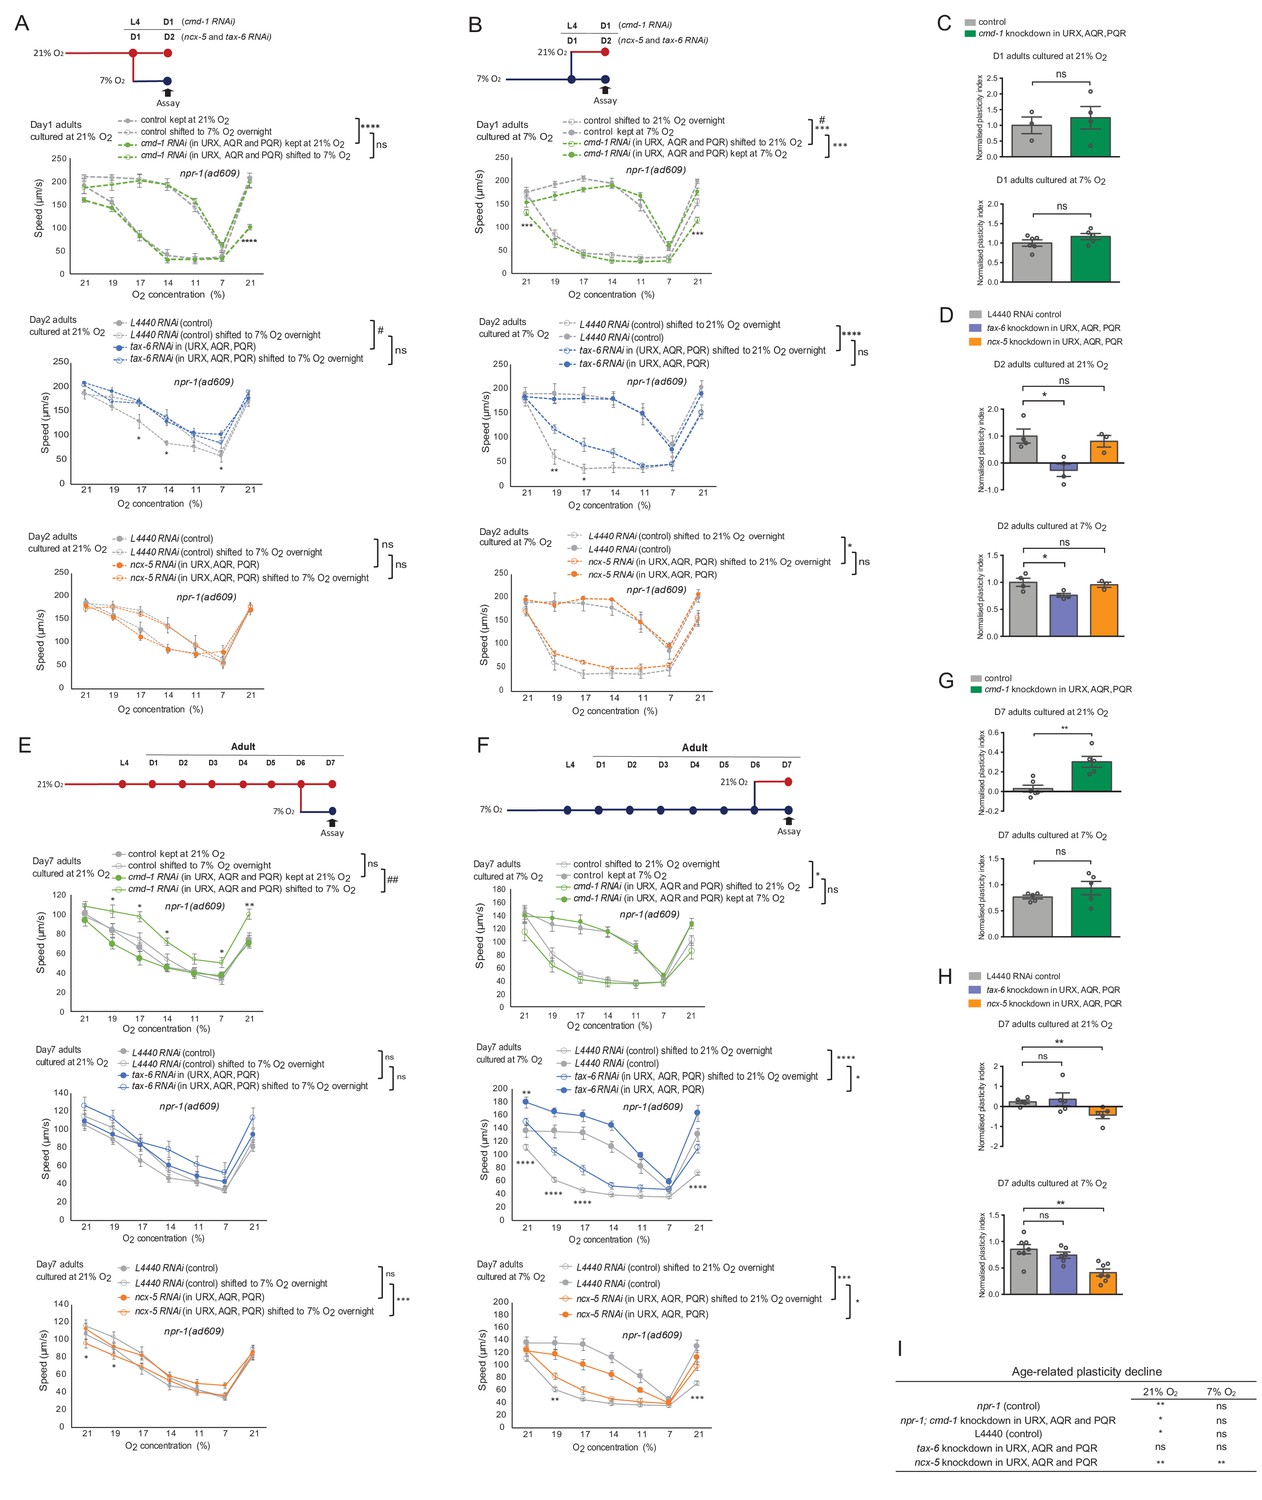
Neuronal Ca2+ signaling plays an essential role in the activity-dependent decline of plasticity with age.
(A and B) O2-evoked speed responses of young adults with cell-specific knockdown of cmd-1, ncx-5 and tax-6 in O2-sensing neurons URX, AQR, and PQR. Strain KL92 (sid-1(pk3321) V.; npr-1(ad609) X.; cipIs7[pgcy-32::sid-1::SL2-GFP] V) is used for cell-specific RNAi knockdown by feeding. Mean ±sem, three or more assays were performed for each condition, *p<0.05, **p<0.01, ***p<0.001, ****p<0.0001, asterisks above the speed plot indicate a significant interaction between the effect of gene knockdown and [O2] steps on speed responses, asterisks next to the data point in the plot indicate a significant difference of speed at this [O2] point compared to either RNAi feeding or control animals experienced the same O2 culture condition, #p<0.05 indicates a significant gene knockdown effect on O2-evoked speed responses at that culture condition, mixed model ANOVA with Holm-Sidak test. (C and D) Normalized plasticity index of young adults with cell-specific knockdown of cmd-1, ncx-5 and tax-6. Mean ±sem, *p<0.05, ns, p>0.05, unpaired t test. (E and F) O2-evoked speed responses of day 7 adults with cell-specific knockdown of cmd-1, ncx-5 and tax-6. Strain KL92 (sid-1(pk3321) V.; npr-1(ad609) X.; cipIs7[pgcy-32::sid-1::SL2-GFP] V) is used for cell-specific RNAi knockdown by feeding. Mean ±sem, five or more assays were performed for each condition, *p<0.05, **p<0.01, ***p<0.001, ****p<0.0001, asterisks above the speed plot indicate a significant interaction between the effect of gene knockdown and [O2] steps on speed responses, asterisks next to the data point in the plot indicate a significant difference of speed at this [O2] point compared to either RNAi feeding or control animals experienced the same O2 culture condition, ##p<0.01 indicates a significant gene knockdown effect on O2-evoked speed responses at that culture condition, mixed model ANOVA with Holm-Sidak test. (G and H) Normalized plasticity index of day 7 adults with cell-specific knockdown of cmd-1, ncx-5 and tax-6 in O2-sensing neurons. Mean ±sem, **p<0.01, ns, p>0.05, unpaired t test. (I) Table shows the age-related plasticity changes in controls and cell-specific RNAi knockdown animals. Mean ±sem, *p<0.05, **p<0.01, ns, p>0.05, unpaired t test.
Figure 7—figure supplement 1
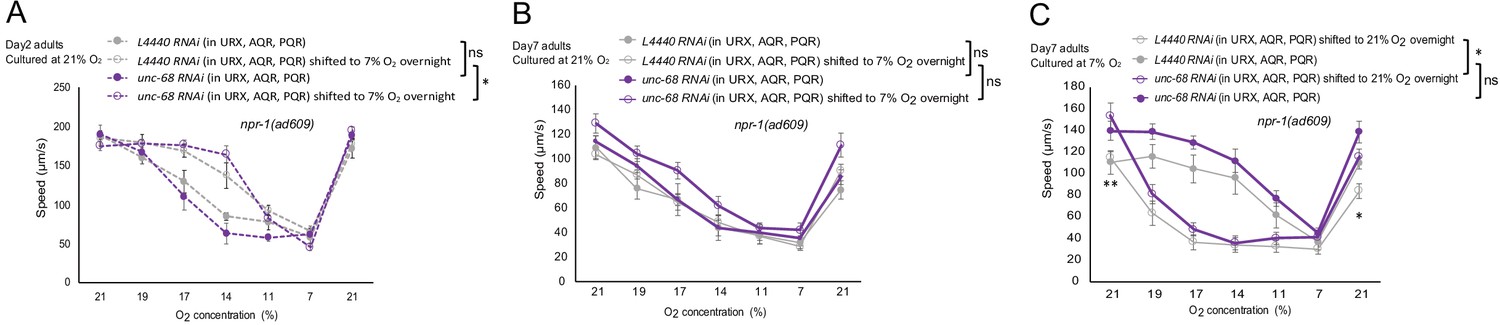
O2-evoked speed responses of animals with unc-68 cell-specific knockdown in O2-sensing neurons.
Mean ±sem, *p<0.05, **p<0.01 asterisks above the speed plot indicate a significant interaction between the effect of gene knockdown and [O2] steps on speed responses, asterisks next to the data point in the plot indicate a significant difference of speed at this [O2] point compared to either RNAi feeding or control animals experienced the same O2 culture condition.
Figure 7—figure supplement 2
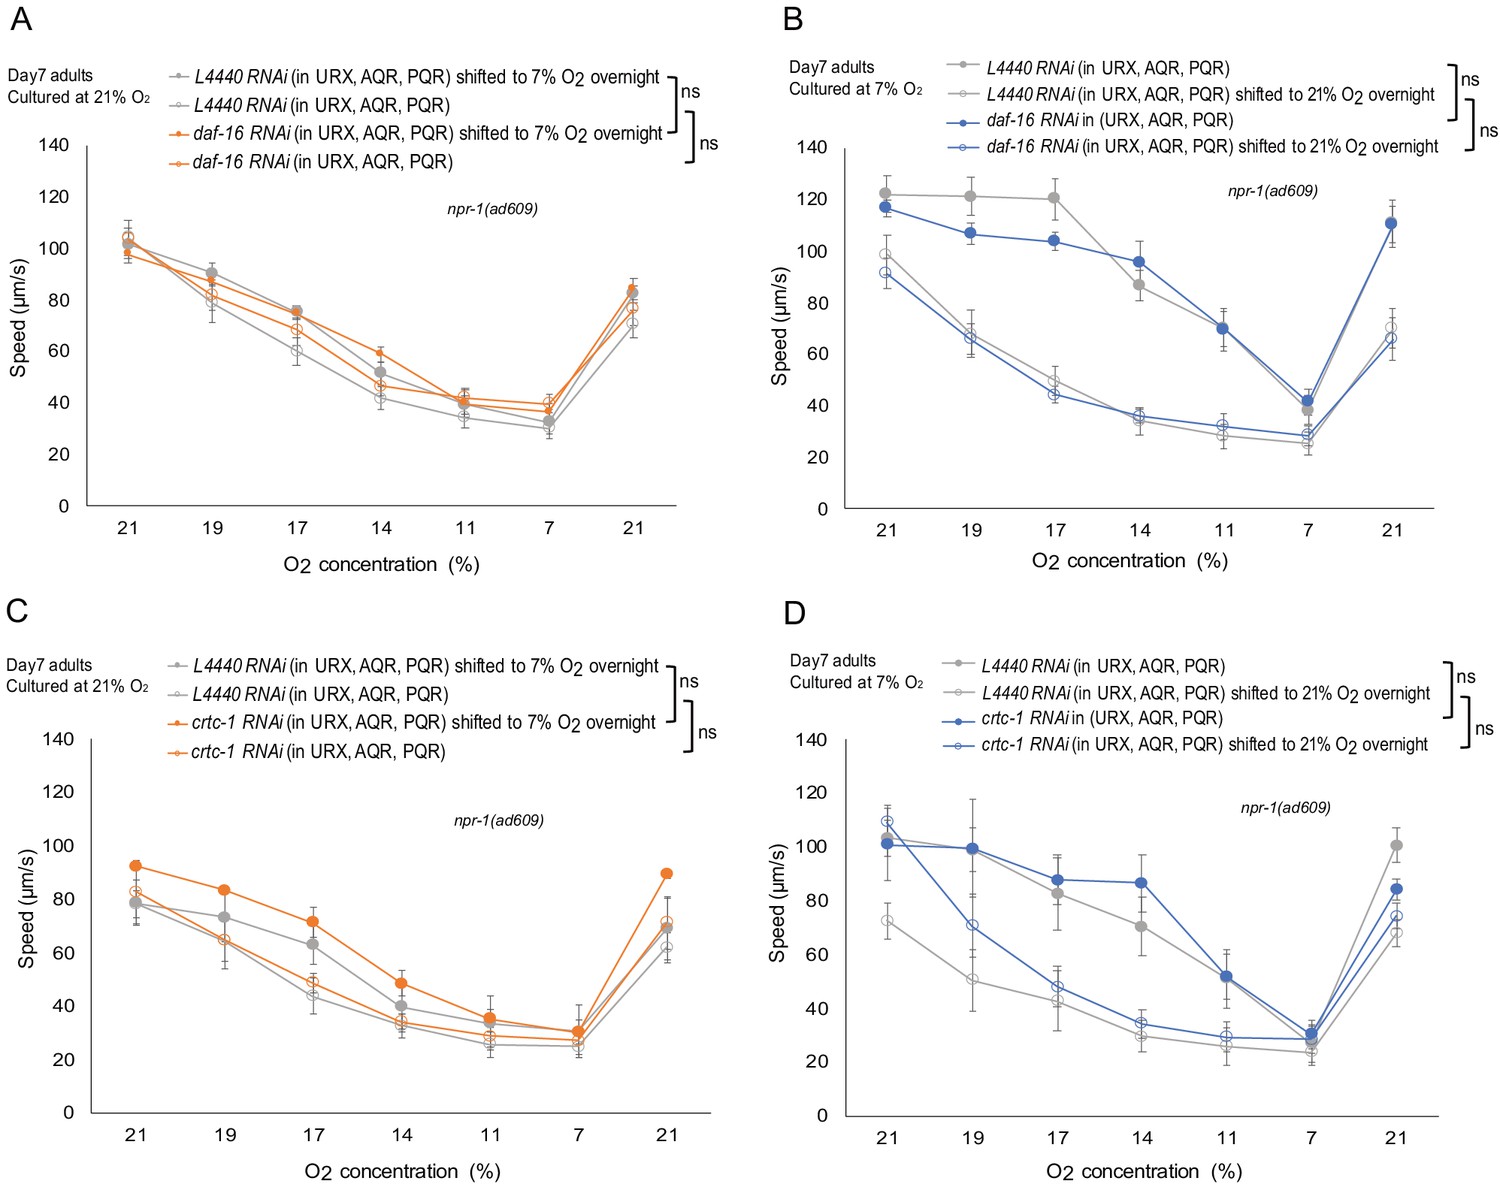
O2-evoked speed responses of day 7 adults with daf-16 or crtc-1 specifically knocked down in O2-sensing neurons.
(A–B) O2-evoked speed responses of day 7 adults were not affected by daf-16 specifically knockdown in O2-sensing neurons. n = 5–6 assays per condition. Mean ±sem, ns, p>0.05. (C–D) O2-evoked speed responses of day 7 adults were not affected by crtc-1 specifically knockdown in O2-sensing neurons. n = 4 assays per condition. Mean ±sem, ns, p>0.05.
Figure 8 with 1 supplement
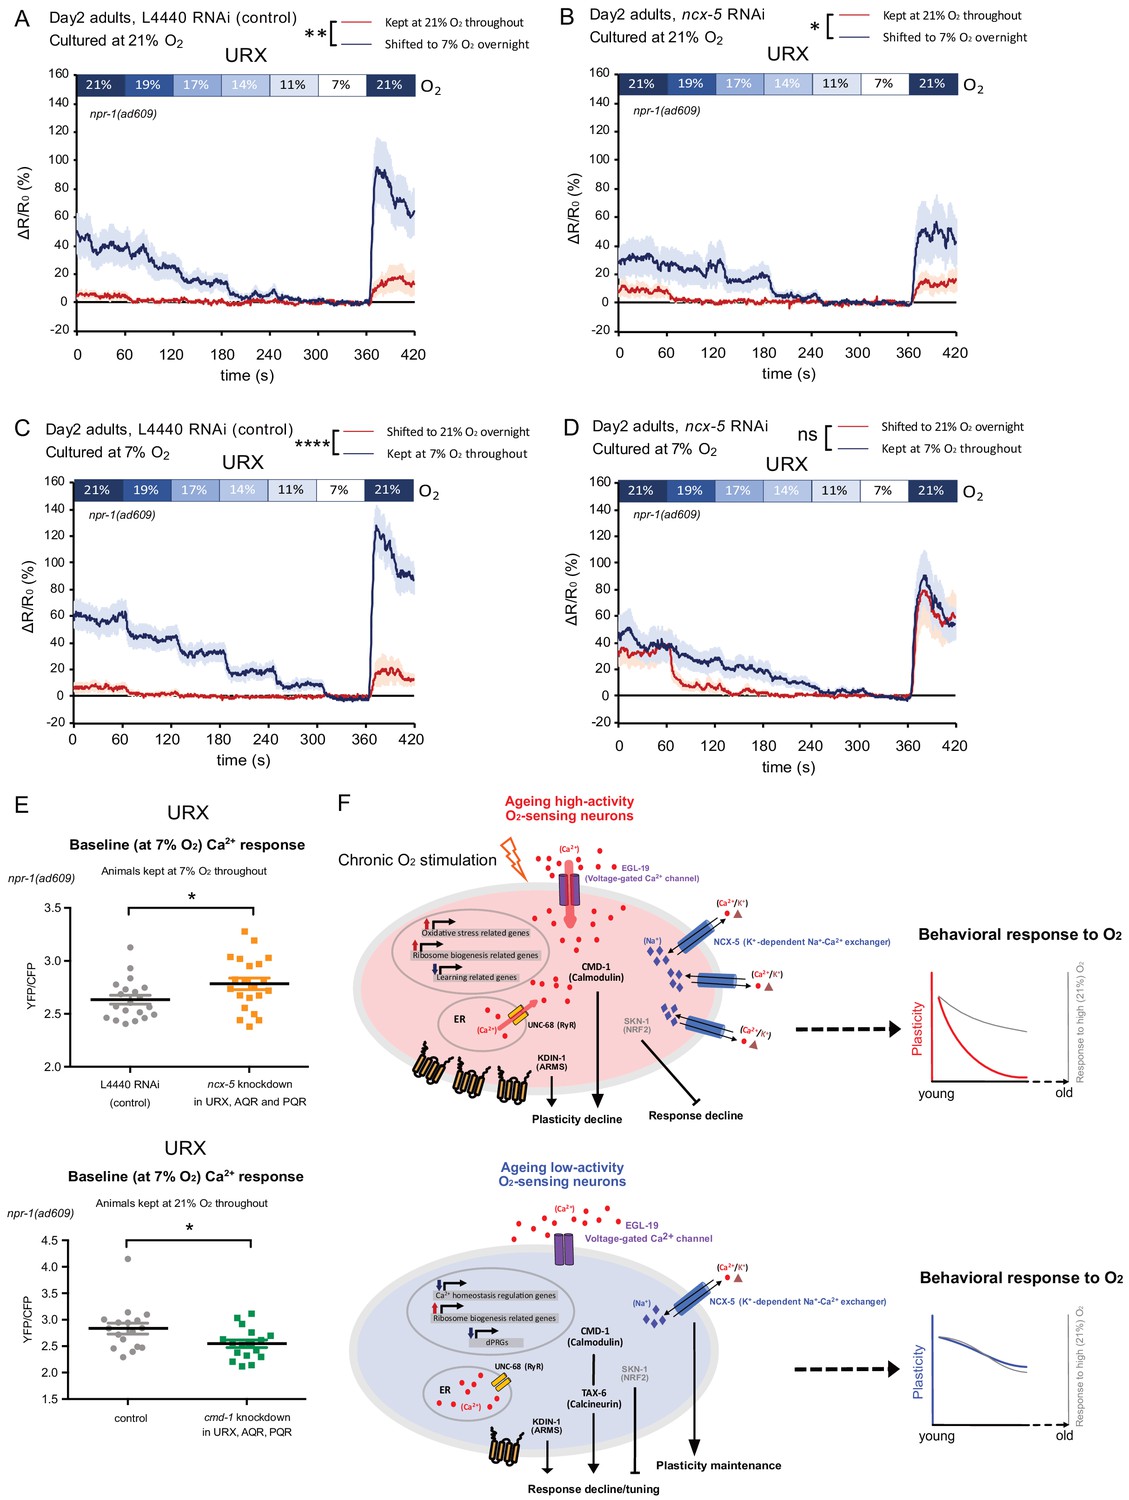
NCX-5 and CMD-1 control neuronal Ca2+ homeostasis to affect plasticity decline with age.
(A–B) URX Ca2+ responses of day 2 adults cultured at 21% O2 and shifted to 7% O2 overnight with control L4440 (A) and ncx-5 (B) RNAi knockdown in O2-sensing neurons. Strain KL317 (sid-1(pk3321) V; npr-1(ad609) X; cipIs7[pgcy-32::sid-1::SL2-GFP] V; dbEx(pgcy-32::YC3.60 lin-15(+))) is used for cell-specific RNAi knockdown by feeding followed by Ca2+ imaging. Each [O2] step lasts for 1 min. 21–50 s in each 1-min step was used for statistical analysis. Mean ±sem, n = 16–19 animals per condition, *p<0.05, **p<0.01, asterisks indicate a significant effect of overnight O2 level shift on Ca2+ responses, mixed model ANOVA. (C–D) URX Ca2+ responses of day two adults cultured at 7% O2 and shifted to 21% O2 overnight with control L4440 (C) and ncx-5 (D) RNAi knockdown in O2-sensing neurons. Each [O2] step lasts for 1 min. 21–50 s in each 1-min step was used for statistical analysis. Mean ±sem, n = 20–21 animals per condition. ****p<0.0001, ns, p>0.05, asterisks indicate a significant effect of overnight O2 level shift on Ca2+ responses, mixed model ANOVA. (E) Baseline URX Ca2+ response is higher in 7% O2 cultured animals (day two adults) with ncx-5 knockdown, and lower in 21% O2 cultured animals (day one adults) with cmd-1 knockdown in O2-sensing neurons. Mean Ca2+ response during 21–50 s of 7% O2 step was used for statistical analysis. Mean ±sem, n = 17–21 animals per condition. *p<0.05, unpaired t-test. (F) Models for molecular and cellular processes in ageing high- and low-activity neurons.
Figure 8—figure supplement 1
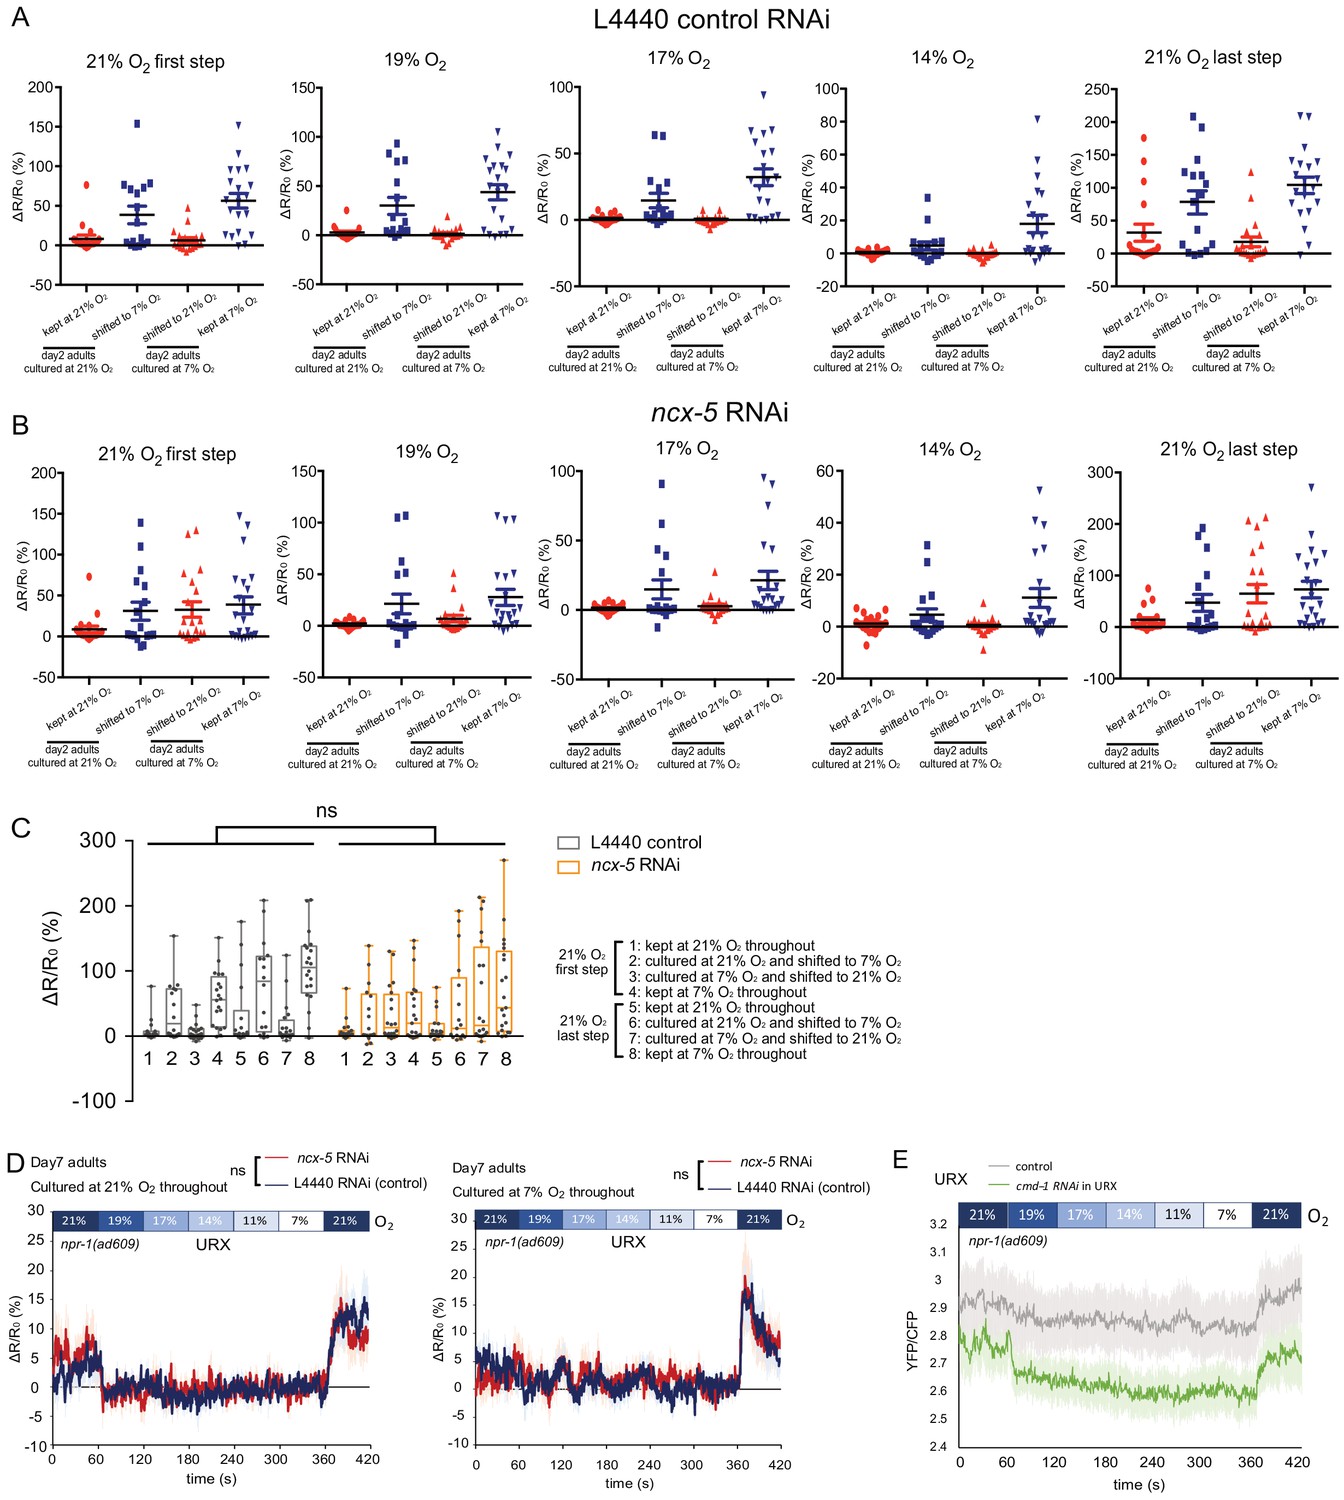
URX Ca2+ responses to [O2] of animals with ncx-5 or cmd-1 specifically knocked down in O2-sensing neurons.
(A–B) Scatter plot showing URX Ca2+ responses of day two adults with L4440 control RNAi (A) and ncx-5 (B) RNAi knockdown. (C) URX Ca2+ responses to 21% O2. No significant difference is seen between L4440 control RNAi and ncx-5 RNAi URX Ca2+ responses to 21% O2. ns, p>0.05. Two-way ANOVA. (D) URX Ca2+ responses of day seven adults cultured at 21% and 7% O2 throughout. ncx-5 RNAi knockdown animals showed no significant difference compared to controls. Each [O2] step lasts for 1 min. 21–50 s in each 1-min step was used for statistical analysis. Mean ±sem, n = 21–23 animals per condition. ns, p>0.05, mixed model ANOVA. (E) URX Ca2+ responses of 21% O2 cultured day 1 adults with cmd-1 knockdown in O2-sensing neurons. Mean ±sem.
Author response image 1
Tables
Key resources table
| Reagent type (species) or resource | Designation | Source or reference | Identifiers | Additional information |
|---|---|---|---|---|
| Strain, strain background (E. coli) | OP50 | CGC | RRID:WB-STRAIN:OP50 | |
| Strain, strain background (C. elegans) | AX204 | Coates and de Bono, 2002 | npr-1(ad609) X | |
| Strain, strain background (C. elegans) | AX1864 | Busch et al., 2012 | npr-1(ad609) X; dbEx(pgcy-32::YC3.60) | |
| Strain, strain background (C. elegans) | KL71 | This study | Figure 6 sid-1(pk3321) him5(e1490)V; npr-1(ad609)X | |
| Strain, strain background (C. elegans) | KL123 | This study | Figure 4—figure supplement 1 npr-1(ad609) X; iaIs25[Pgcy-37::GFP + unc-119(+)] | |
| Strain, strain background (C. elegans) | KL92 | This study | Figure 6 sid-1(pk3321) V.; npr-1(ad609) X.; cipIs7[pgcy-32::sid-1::SL2-GFP] V | |
| Strain, strain background (C. elegans) | KL269 | This study | Figure 3 npr-1(ad609)X; cipIs35[pgcy-32::HisCl1 codon optimized::SL2 GFP] | |
| Strain, strain background (C. elegans) | KL217 | This study | Figure 7 npr-1(ad609) X; cipIs31[pgcy-32::cmd-1 sense fragment::let-868 3'UTR; pgcy-32::cmd-1 antisense fragment::let-868 3'UTR; ccRFP] | |
| Strain, strain background (C. elegans) | KL317 | This study | Figure 8 sid-1(pk3321) V; npr-1(ad609) X; cipIs7[pgcy-32::sid-1::SL2-GFP] V; dbEx(pgcy-32::YC3.60 lin-15(+)) | |
| Strain, strain background (C. elegans) | KL325 | This study | Figure 3—figure supplement 2 dvIs19[(pAF15) gst-4p::GFP::NLS] III; npr-1(ad609) X | |
| Strain, strain background (C. elegans) | KL24 | This study | Figure 3 npr-1(ad609) X; Ex (pgcy-32::ChRcodopt-mCitrine) | |
| Commercial assay or kit | PicoPure RNA isolation kit | Arcturus Bioscience | KIT0204 | |
| Commercial assay or kit | Ovation RNA-seq system V2 | Nugen | 7102 | |
| Chemical compound, drug | Histamine | Sigma-Aldrich | H7250 | |
| Chemical compound, drug | All-trans retinal | Sigma-Aldrich | R2500 | |
| Chemical compound, drug | N-acetyl cysteine | Sigma | A7250 | |
| Software, algorithm | DinoCapture 2.0 | Dino-Lite Europe | RRID:SCR_019095 | https://www.dino-lite.eu/index.php/en/support/software |
| Software, algorithm | MCQ Gas Blender 100 | MCQ Instruments | https://www.mcqinst.com | |
| Software, algorithm | Matlab | MathWorks | RRID:SCR_001622 | |
| Software, algorithm | Fiji | GitHub | RRID:SCR_002285 | https://fiji.sc/ |
| Software, algorithm | GraphPad Prism | GraphPad | RRID:SCR_002798 | https://www.graphpad.com/scientific-software/prism/ |
| Software, algorithm | Cutadapt | Martin, 2011 | RRID:SCR_011841 | https://cutadapt.readthedocs.io/en/stable/ |
| Software, algorithm | STAR | Dobin et al., 2013 | RRID:SCR_015899 | https://github.com/alexdobin/STAR/releases |
| Software, algorithm | FeatureCounts | Liao et al., 2014 | RRID:SCR_012919 | http://bioinf.wehi.edu.au/featureCounts/ |
| Software, algorithm | DESeq2 | Love et al., 2014 | RRID:SCR_015687 | |
| Software, algorithm | GSEA | Subramanian et al., 2005 | RRID:SCR_003199 | https://www.gsea-msigdb.org/gsea/index.jsp |
| Other | 10 µm filter for cell filtration | CellTrics | 04-004-2324 |
Author response table 1
| Panel A | Panel B | Panel C | Panel D | |
|---|---|---|---|---|
| p values of recordings in first submission: | 0.0025 (**) | 0.0459 (*) | 0.7609 (ns) | 0.0478 (*) |
| p values with new recordings included: | 0.0004 (***) | 0.006 (**) | 0.6357 (ns) | 0.0031 (**) |
Additional files
-
Supplementary file 1
RNA-seq data for whole-worm and O2-sensing neurons isolated from day 1 and day 7 adults cultured at 21% and 7% O2.
The comma-separated file shows gene-wise differential expression log fold changes and false discovery rates.
- https://cdn.elifesciences.org/articles/59711/elife-59711-supp1-v1.csv.zip
-
Supplementary file 2
DrEdGe files for an interactive presentation of the dataset in Supplementary file 1.
- https://cdn.elifesciences.org/articles/59711/elife-59711-supp2-v1.zip
-
Supplementary file 3
Tissue and phenotype enrichment analysis.
- https://cdn.elifesciences.org/articles/59711/elife-59711-supp3-v1.xlsx
-
Supplementary file 4
Previously reported genes enriched in the O2-sensing neurons.
- https://cdn.elifesciences.org/articles/59711/elife-59711-supp4-v1.xlsx
-
Supplementary file 5
Significant GO terms from gene set enrichment analysis.
- https://cdn.elifesciences.org/articles/59711/elife-59711-supp5-v1.xlsx
-
Supplementary file 6
Manually curated gene sets for GSEA analysis.
- https://cdn.elifesciences.org/articles/59711/elife-59711-supp6-v1.xlsx
-
Supplementary file 7
MetaWorm data set of genes differentially regulated with age, with gene set enrichment analysis.
- https://cdn.elifesciences.org/articles/59711/elife-59711-supp7-v1.xlsx
-
Supplementary file 8
Activation z scores of pathways identified in the ingenuity pathway analysis.
- https://cdn.elifesciences.org/articles/59711/elife-59711-supp8-v1.xlsx
-
Supplementary file 9
List of RNAi clones used in this study.
- https://cdn.elifesciences.org/articles/59711/elife-59711-supp9-v1.xlsx
-
Transparent reporting form
- https://cdn.elifesciences.org/articles/59711/elife-59711-transrepform-v1.pdf
Download links
A two-part list of links to download the article, or parts of the article, in various formats.
Downloads (link to download the article as PDF)
Open citations (links to open the citations from this article in various online reference manager services)
Cite this article (links to download the citations from this article in formats compatible with various reference manager tools)
High neural activity accelerates the decline of cognitive plasticity with age in Caenorhabditis elegans
eLife 9:e59711.
https://doi.org/10.7554/eLife.59711


