New insights on the modeling of the molecular mechanisms underlying neural maps alignment in the midbrain
- Department of Biology and Psychology, University of Virginia, United States
- Donald K. Johnson Eye Institute, Krembil Research Institute, University Health Network, Canada
- Laboratory of Medicine and Pathobiology, University of Toronto, Canada
- Ophthalmology and Vision Sciences, University of Toronto, Canada
- Cell and System Biology, University of Toronto, Canada
- CNRS UPR 3212, University of Strasbourg, France
Figures
Figure 1
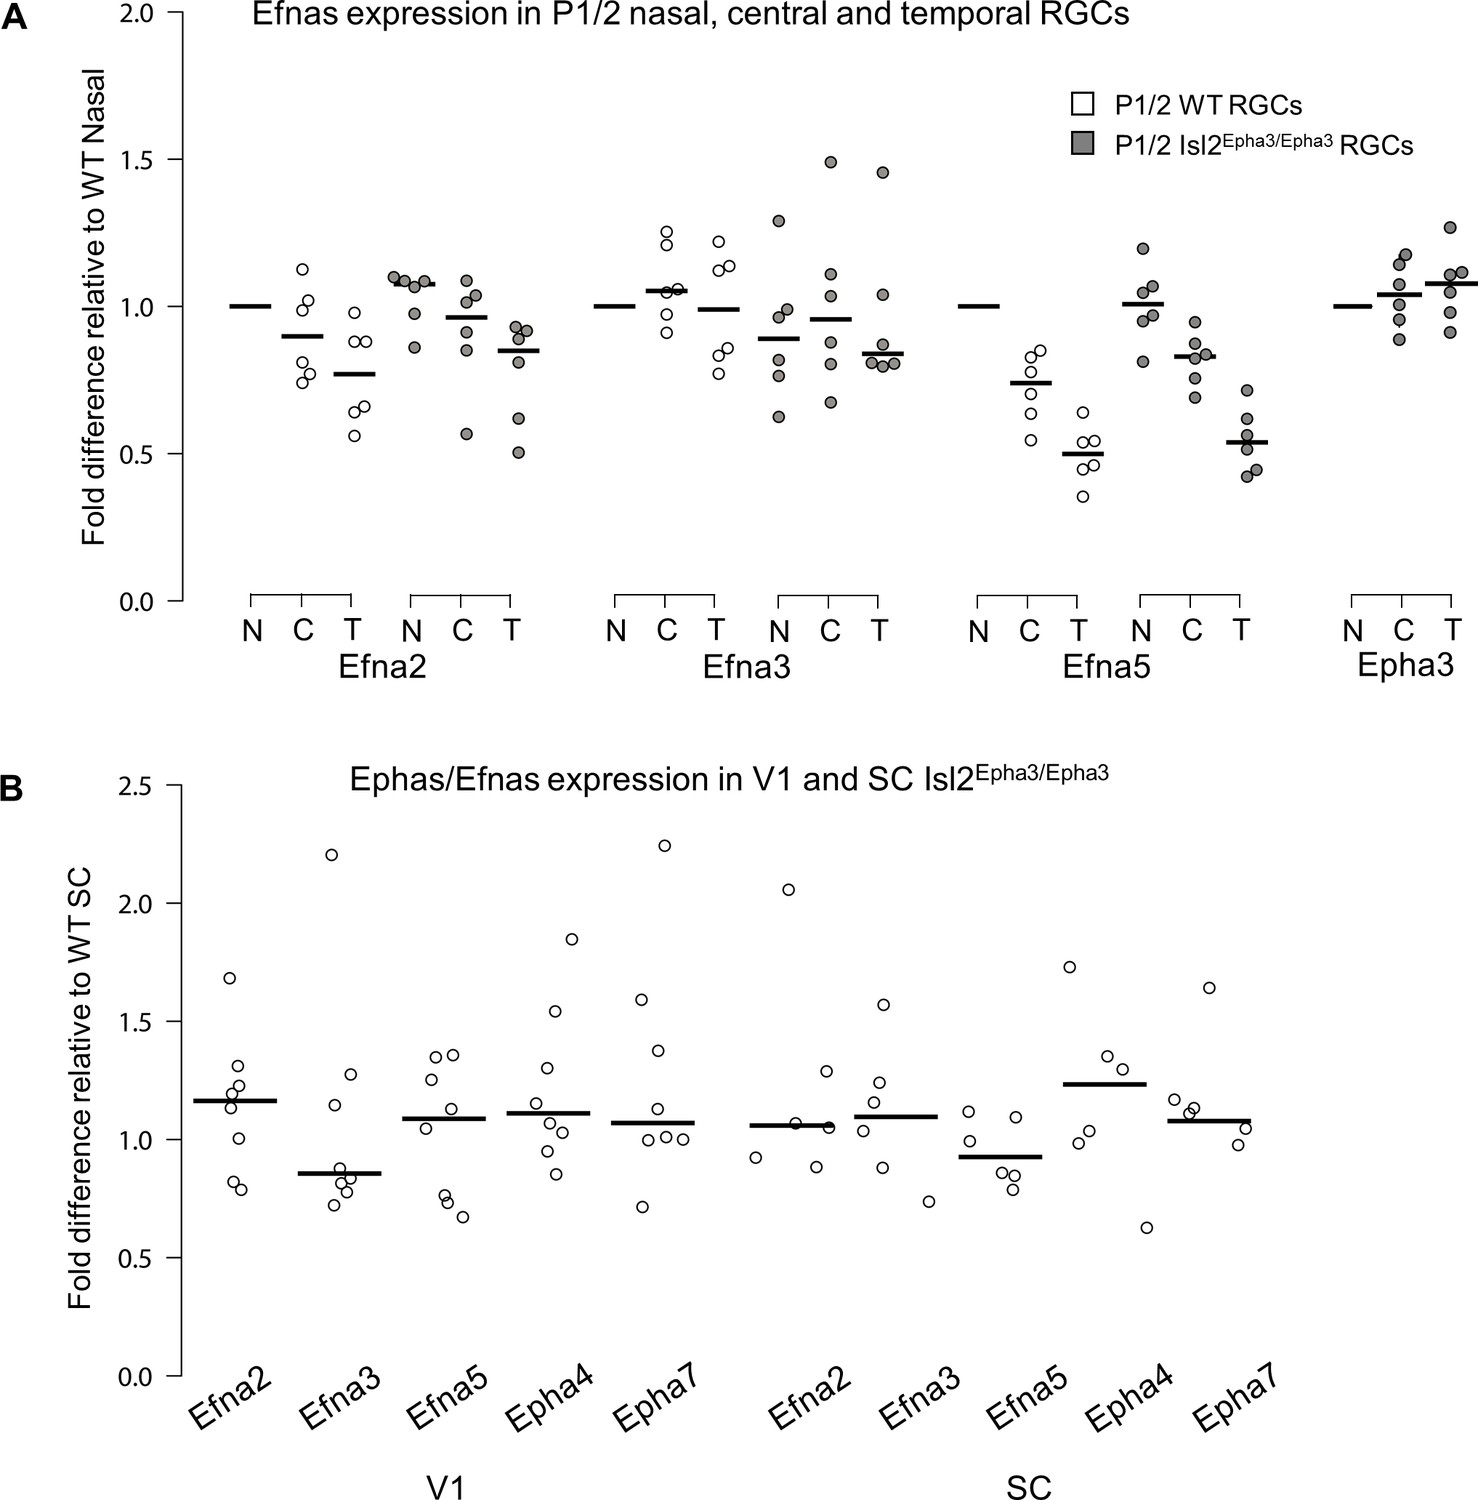
Dot plots representing Ephas/Efnas expression in Isl2Epha3/Epha3retinas, V1 cortex and SC.
(A) Median Efna2/a3/a5 expression levels (relative to wild-type nasal expression) in P1/2 wild-type (WT - white) and Isl2Epha3/Epha3 (gray) acutely isolated RGCs from nasal (N), central (C) and temporal (T) retinas (WT, Isl2Epha3/Epha3, n = 6 animals, 12 retinas), Two-way ANOVA without replication: Efna2 x genotype: F(1,2) = 3.72 < Fcrit.=18.5, p=0.19; Efna3 x genotype : F(1, 2)=11.13 < Fcrit.=18.5, p=0.07; Efna5 x genotype: F(1, 2)=3.58 < Fcrit.=18.5, p=0.20. (B) Median Efna2/a3/a5 ligands and Epha4/a7 receptors expression levels (relative to WT expression levels) in Isl2Epha3/Epha3 V1 (WT n = 5 animals, Isl2Epha3/Epha3n = 8 animals; variables are normally distributed, one sample t-test: Efna2: p=0.29; Efna3: p=0.43; Efna5: p=0.42; Epha4: p=0.07; Epha7: p=0.54) and SC (WT n = 5 animals, Isl2Epha3/Epha3n = 6 animals; variables are normally distributed, one sample t-test: Efna2: p=0.20; Efna3: p=0.65; Efna5: p=0.71; Epha4: p=0.11; Epha7: p=0.17). qPCRs were repeated three times with duplicates for each sample.
-
Figure 1—source data 1
Data for Figure 1A: Expression levels, relative to wild-type, of retinal Efna in Isl2Epha3/Epha3 animals.
Data for Figure 1B: Expression levels, relative to wild-type, of collicular and cortical V1 Ephas and Efnas in Isl2Epha3/Epha3 animals.
- https://cdn.elifesciences.org/articles/59754/elife-59754-fig1-data1-v1.xlsx
Figure 2
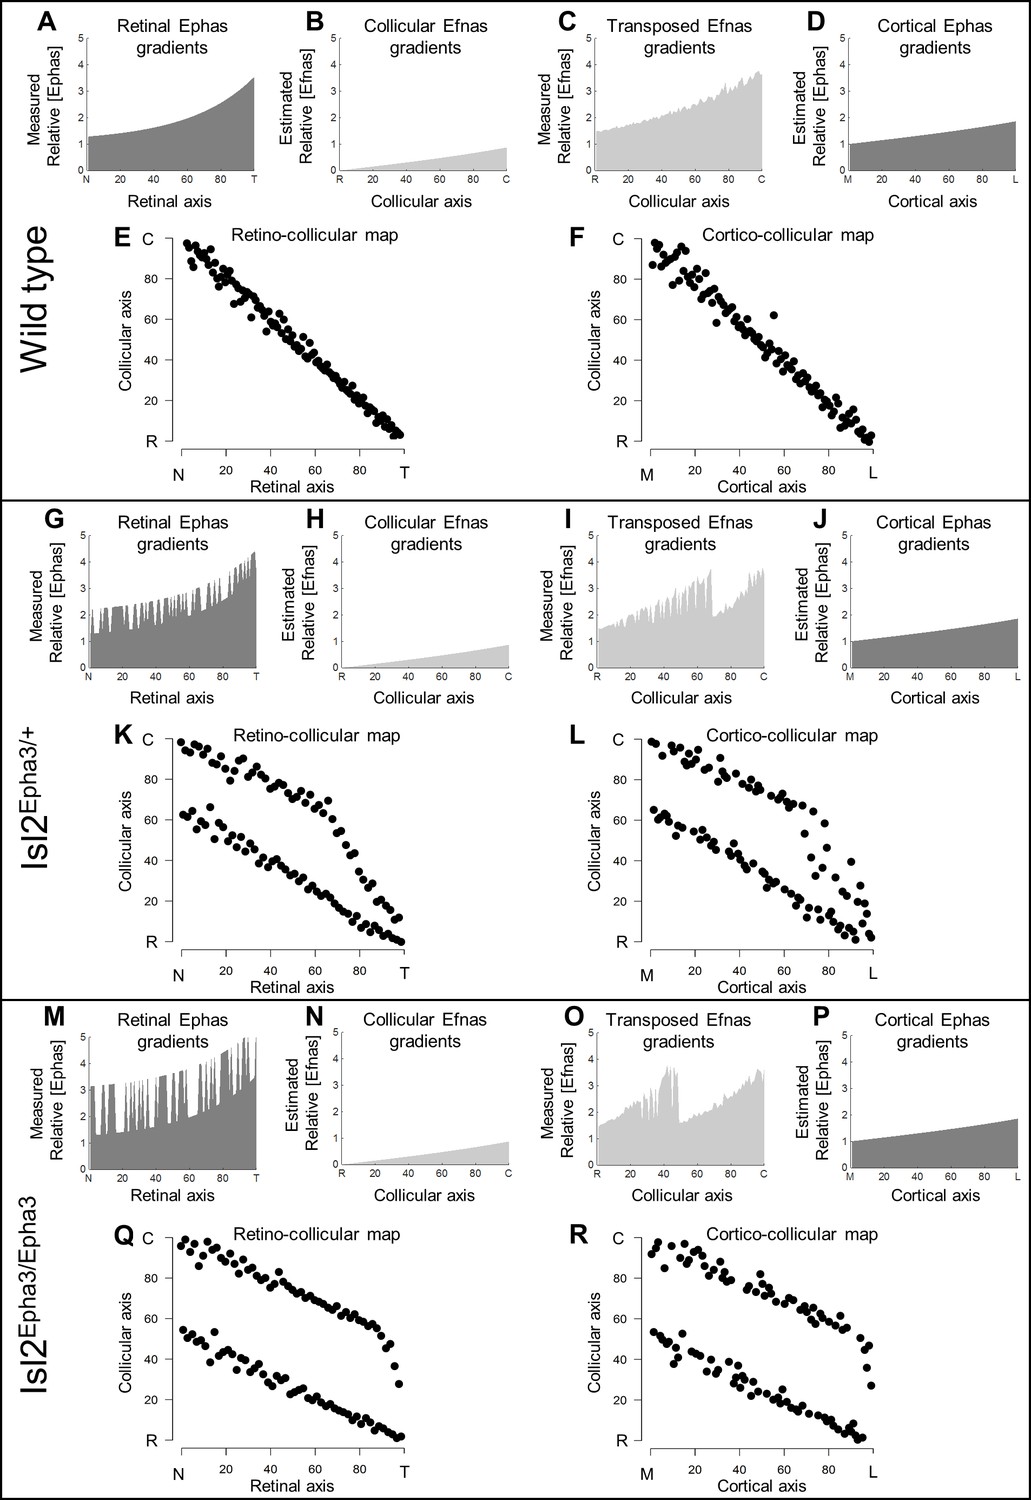
Simulations of retino- and cortico-collicular mapping in Isl2-Epha3KI animals.
(A, G, M) Representation of measured retinal Epha gradients along the nasal-temporal (NT) axis in WT (A), Isl2Epha3/+ (G) and Isl2Epha3/Epha3 (M) animals (see Materials and methods and Table 1 for equations). (B, H, N) Representation of the estimated collicular Efna gradients along the rostral-caudal (RC) axis in WT (B), Isl2Epha3/+ (H) and Isl2Epha3/Epha3 (N) animals (see Materials and methods and Table 1 for equations). (C, I, O) Representation of the transposed retinal Efna gradients into the SC along the RC axis in WT (C), Isl2Epha3/+ (I) and Isl2Epha3/Epha3 (O) animals (see Materials and methods and Table 1 for equations). (D, J, P) Representation of the estimated cortical Epha gradients along the medial-lateral (ML) axis in V1 in WT (D), Isl2Epha3/+ (J) and Isl2Epha3/Epha3 (P) animals (see Materials and methods and Table 1 for equations). (E, K, Q) Simulated RC map in in WT (E), Isl2Epha3/+ (K) and Isl2Epha3/Epha3 (Q) animals generated by the 3-step map alignment algorithm (representative of n = 20 runs). (F, L, R) Simulated cortico-collicular map in WT (F), Isl2Epha3/+ (L) and Isl2Epha3/Epha3 (R) animals generated by the 3-step map alignment algorithm (representative of n = 20 runs). Abbreviations: N, nasal; T, temporal; R, rostral; C, caudal; M, medial; L, lateral.
Figure 3
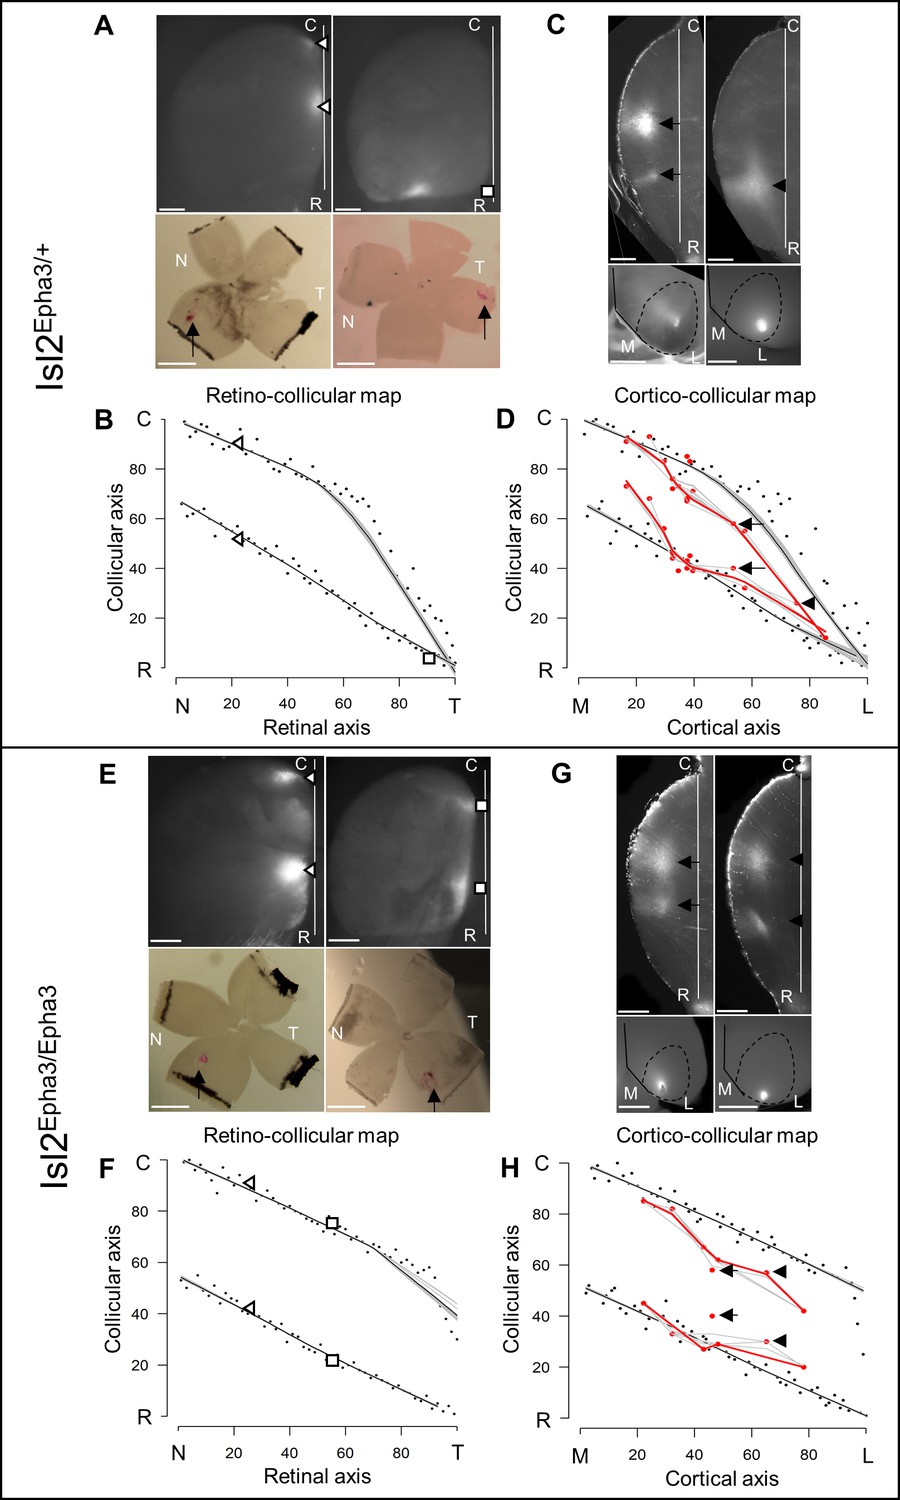
Experimental validation of retino- and cortico-collicular mapping in Isl2-Epha3KI animals.
(A) Images of two experimental injections showing the collicular terminations zones (triangles and square, top-view, upper panels) after focal retinal injections (arrows, flat-mount, lower panel) in Isl2Epha3/+ animals. (B) Cartesian representation of the injections (triangles and square) in (A) superimposed with the simulated RC map (black dots, n = 100) in Isl2Epha3/+. Map profile is calculated by LOESS smoothing (black and gray lines). (C) Images of two experimental injections showing the collicular termination zones (sagittal view, upper panels) after focal cortical V1 injection (top-view, lower panels). Arrows and arrowheads indicate the site of the termination zones. Lower left panel shows CO staining (dark gray) delineating V1. (D) Cartesian representation of the experimental (red dots/lines, n = 15 animals) and simulated (black dots, n = 100) CC maps calculated by LOESS smoothing (black, red and gray lines). Arrows and arrowhead represent the two injections shown in (C). Two-samples Kolmogorov-Smirnov test, D-stat = 0.273 < D-crit.=0.282, p=0.06, simulated and experimentally measured CC maps are not significantly different. (E) Images of two experimental injections showing the collicular terminations zones (triangles and squares, top-view, upper panels) after focal retinal injection (arrows, flat-mount, lower panel) in Isl2Epha3/Epha3 animals. (F) Cartesian representation of the injections (triangles and squares) in (E) superimposed with the simulated RC map (black dots, n = 100) in Isl2Epha3/Epha3. Map profile is calculated by LOESS smoothing (black and gray lines). (G) Images of two experimental injections showing the collicular duplicated termination zones (arrows and arrowheads, sagittal view, upper panels) after focal cortical V1 injection (top-view, lower panels). (H) Cartesian representation of the experimental (red dots/lines, n = 7 animals) and simulated (black dots, n = 100) CC maps calculated by LOESS smoothing (black, red and gray lines). Arrows and arrowheads represent the two examples in (G). Two-samples Kolmogorov-Smirnov test, D-stat = 0.190 < D-crit.=0.371, p=0.72, simulated and experimentally measured CC maps are not significantly different. Scale bars: 400 μm (A upper, C, E upper, G), 1 mm (A, E lower). Abbreviations: N, nasal; T, temporal; R, rostral; C, caudal; M, medial; L, lateral.
-
Figure 3—source data 1
Data for Figure 3B: Cartesian values of experimentally measured collicular termination zones and corresponding retinal injections in Isl2Epha3/+ animals.
Data for Figure 3D: Cartesian values of experimentally measured collicular termination zones and corresponding cortical V1 injections in Isl2Epha3/+ animals. Data for Figure 3F: Cartesian values of experimentally measured collicular termination zones and corresponding retinal injections in Isl2Epha3/Epha3 animals. Data for Figure 3B: Cartesian values of experimentally measured collicular termination zones and corresponding cortical V1 injections in Isl2Epha3/Epha3 animals.
- https://cdn.elifesciences.org/articles/59754/elife-59754-fig3-data1-v1.xlsx
Figure 4
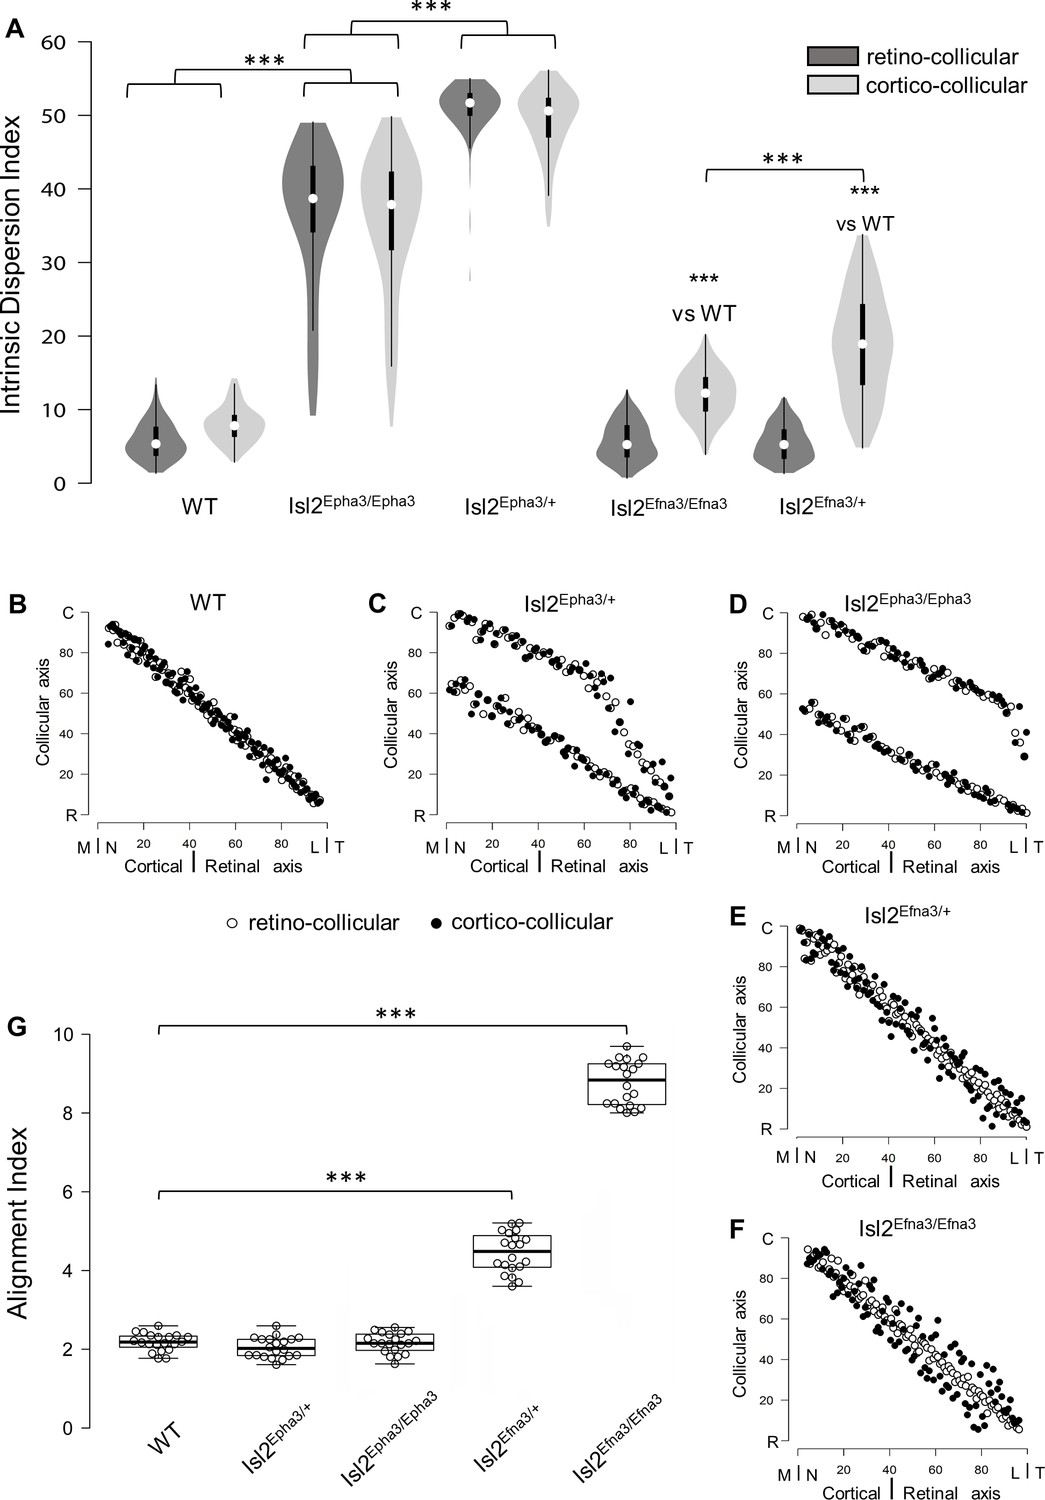
Intrinsic dispersion index (IDI) and alignment index (AI) in Isl2-Epha3KI and Isl2-Efna3KI animal models.
(A) Violin plot representation of the median IDIs (from n = 10 simulated maps, each composed of 100 projections) in WT, Isl2-Epha3KI and Isl2-Efna3KI animal models. Mann-Whitney test: WT IDIretino vs. Isl2Epha3/+ IDIretino, z-score = 12.08, effect r = 0.85, p=6E-55; WT IDIcortico vs. Isl2Epha3/+ IDIcortico, z-score = 12.04, effect r = 0.85, p=8E-52; Isl2Epha3/+ IDIretino vs Isl2Epha3/Epha3 IDIretino, z-score = 11.25, effect r = 0.80, p=2E-39; Isl2Epha3/+ IDIcortico vs Isl2Epha3/Epha3 IDIcortico, z-score = 10.53, effect r = 0.74, p=1E-32; WT IDIcortico vs Isl2Efna3/+ IDIcortico, z-score = 8.30, effect r = 0.59, p=1E-18; WT IDIcortico vs Isl2Efna3/Efna3 IDIcortico, z-score = 10.37, effect r = 0.73, p=3E-31; Isl2Efna3/+ IDIcortico vs Isl2Efna3/Efna3 IDIcortico, z-score = 6.93, effect r = 0.49, p=6E-13; ***p<0.001. (B, C, D, E, F) Representation and superimposition of simulated RC (retino-collicular) (white dots) and CC (cortico-collicular) (black dots) maps in WT (B), Isl2Epha3/+ (C), Isl2Epha3/Epha3 (D), Isl2Efna3/+ (E) and Isl2Efna3/Efna3 (F) animals (representative of n = 10 runs). (G) Box plot representation of median AI (from n = 20 simulated RC/CC maps) in WT, Isl2Epha3/+, Isl2Epha3/Epha3, Isl2Efna3/+ and Isl2Efna3/Efna3 animals. Mann-Whitney test: AI WT vs. AI Isl2Epha3/+, z-score = 1.62, effect r = 0.26 p=0.10; AI WT vs. AI Isl2Epha3/Epha3, z-score = 0.11, effect r = 0.02, p=0.90; AI WT vs AI Isl2Efna3/+, z-score = 5.40, effect r = 0.85, p=1.45E-11; AI WT vs AI Isl2Efna3/Efna3, z-score = 5.40, effect r = 0.85, p=1.45E-11. ***p<0.001. Abbreviations: IDI, intrinsic dispersion index; AI, alignment index; WT, wild-type; N, nasal; T, temporal; R, rostral; C, caudal; M, medial; L, lateral.
-
Figure 4—source data 1
Data for Figure 4A: Intrinsic Dispersion Index values for retino-collicular (RC) and cortical-collicular (CC) mapping in wild-type (WT), Isl2-Epha3KI and Isl2-Efna3KI animals.
Data for Figure 4G: Total RC and CC map alignment index (AI) values in wild-type (WT), Isl2-Epha3KI and Isl2-Efna3KI animals.
- https://cdn.elifesciences.org/articles/59754/elife-59754-fig4-data1-v1.xlsx
Figure 5
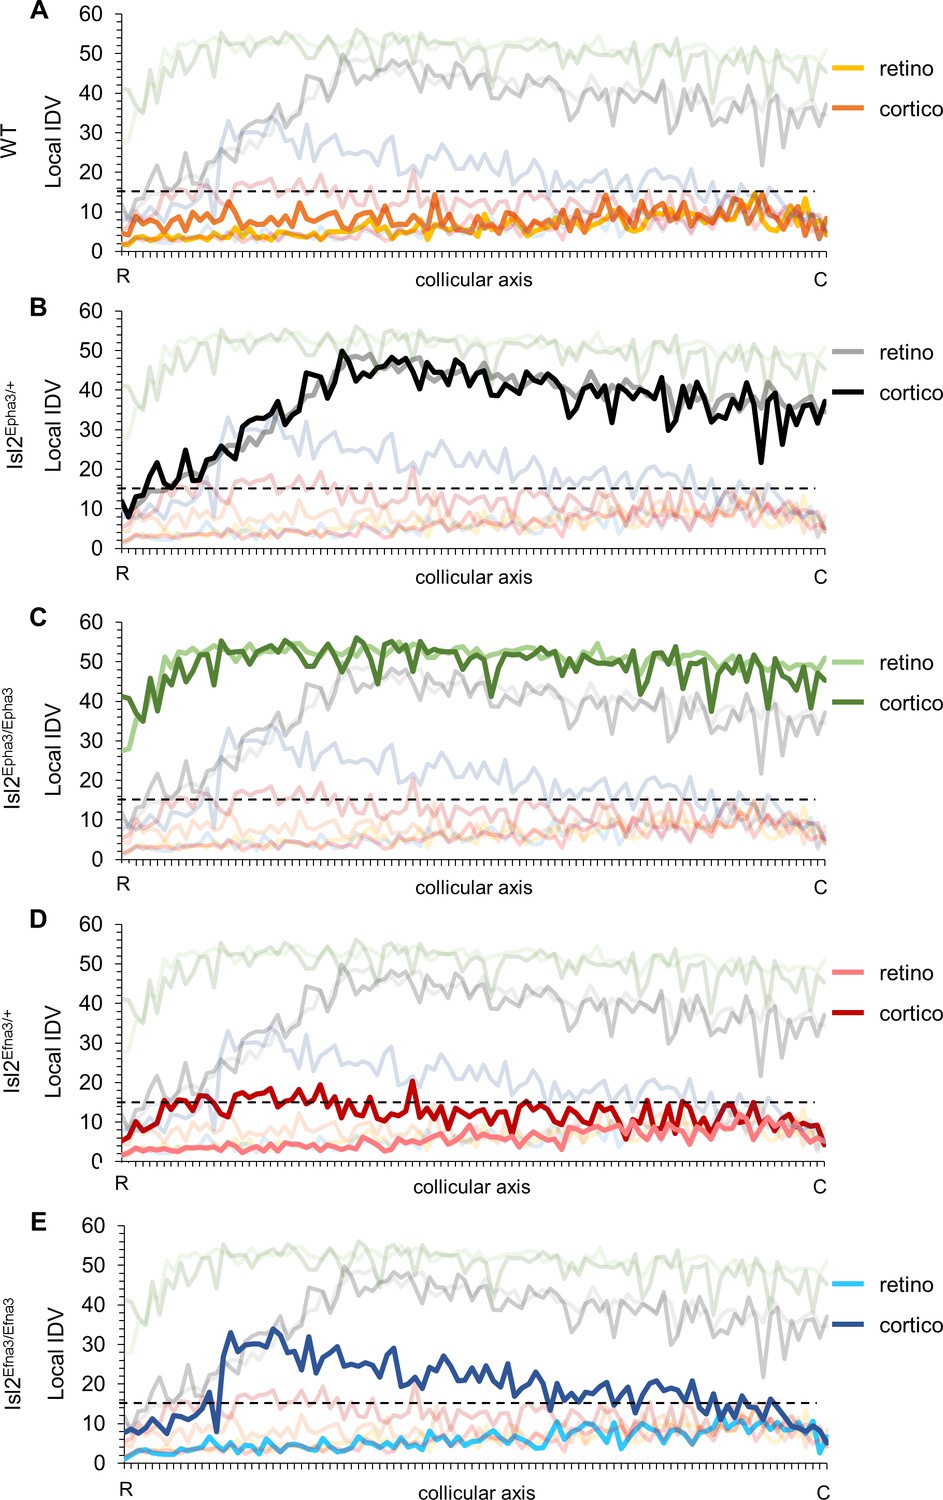
Local intrinsic dispersion variation (local IDV) in WT, Isl2-Epha3KI and Isl2-Efna3KI animal models.
(A, B, C, D, E) Representation of the local IDV values for both retinal (light colors) and cortical (dark colors) projections along the rostral R (0%) – caudal C (100%) axis of the SC in WT (A), Isl2Epha3/+ Isl2Epha3/+ (B), Isl2Epha3/Epha3 (C), Isl2Efna3/+ (D) and Isl2Efna3/Efna3 (E) animals (representative of n = 10 runs). Dashed line represents the threshold above which maps are duplicated. Abbreviations: IDV, intrinsic dispersion variation; WT, wild-type; R, rostral; C, caudal.
-
Figure 5—source data 1
Local intrinsic dispersion variation (local IDV) values for retino-collicular (RC) and cortical-collicular (CC) mapping in wild-type (WT), Isl2-Epha3KI and Isl2-Efna3KI animals.
- https://cdn.elifesciences.org/articles/59754/elife-59754-fig5-data1-v1.xlsx
Figure 6
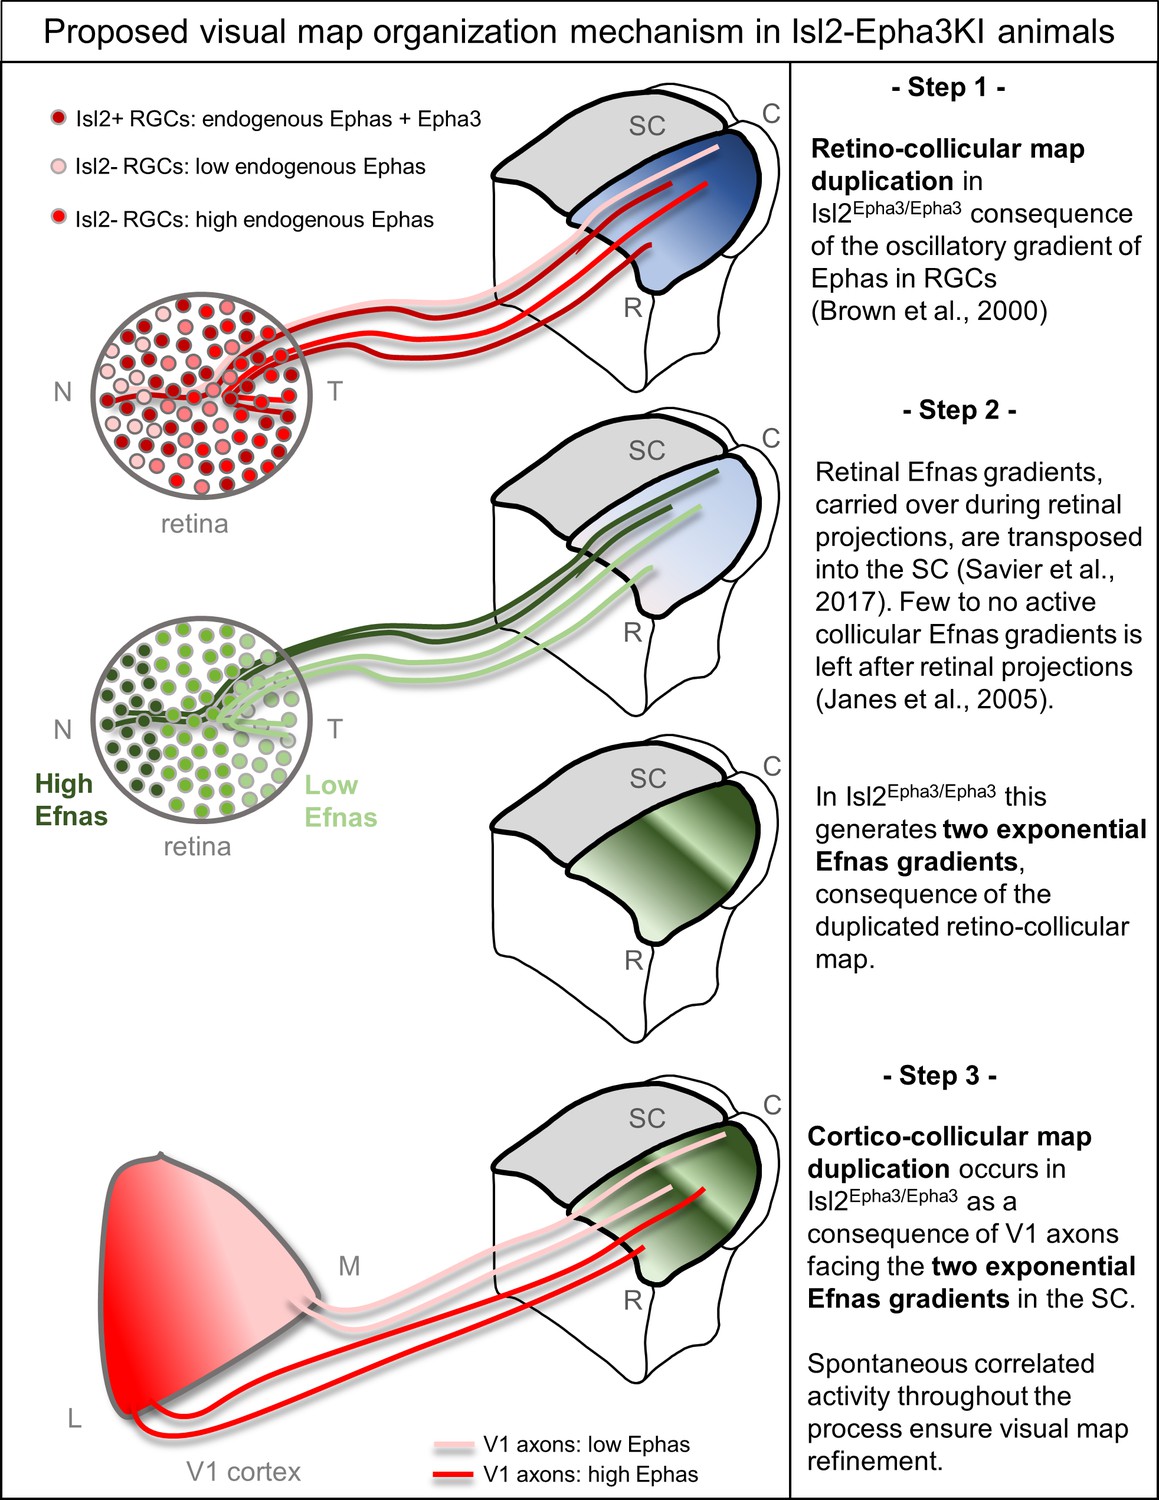
Proposed mechanism of visual map duplication and alignment in Isl2-Epha3KI animals based on the 3-step map alignment model.
Step 1: Isl2(+) RGCs expressing WT levels Ephas + ectopic Epha3 (dark red) and Isl2(-) RGCs expressing WT levels of Ephas (light red to red) send their axons into the SC during the first postnatal week. These retino-collicular (RC) projections form a duplicated map due to the oscillatory gradient of Ephas receptors in the RGCs reading the WT collicular Efna gradients (blue R-C gradient in SC) through forward signaling. Step 2: Retinal Efna gradients (high Efnas-nasal-dark green, low Efnas-temporal-light green) are carried to the SC during the formation of the RC projections. This transposition of retinal Efnas generates two exponential gradients of Efna in the SC, due to the duplication of the RC map and replaces the WT collicular Efna gradients previously used by the RGCs axons (Janes et al., 2005). Step 3: V1 axons, expressing smooth gradients of Ephas receptors (light red – red), are facing two exponential gradients of Efnas, of retinal origin, in SC. Through forward signaling, this two exponential Efna gradients generate a duplication of the CC projections, which aligns with the RC map. Abbreviations: N, nasal; T, temporal; M, medial; L, lateral; R, rostral; C, caudal; SC, superior colliculus; RGCs, retinal ganglion cells.
Tables
Key resources table
| Reagent type (species) or resource | Designation | Source or reference | Identifiers | Additional information |
|---|---|---|---|---|
| Genetic reagent (Mus. musculus) | Isl2tm1(Epha3)Grl | Lemke Lab (Salk Institute) | MGI:3056440 RRID:MGI:3057124 | |
| Commercial assay, kit | Neural tissue dissociation Kit – Postnatal neurons | Miltenyi | Cat # 130-094-802 | |
| Commercial assay, kit | RNeasy Mini kit | Qiagen | Cat # 74104 | |
| Commercial assay, kit | QuantiTect SYBR Green RT-PCR Kit | Qiagen | Cat # 204243 | |
| Antibody | Goat anti-rabbit IgG (H+L), polyclonal | Jackson Immunoresearch | Cat # 111-005-003 RRID:AB_2337913 | 1:3000 |
| Antibody | Goat anti-mouse IgM (H+L) | Biotrend | Cat # 610–1107 | 1:3000 |
| Antibody | Mouse anti-CD90, monoclonal | Biorad | Cat # MCA02R F7D5 IgM RRID:AB_323481 | 1:3000 |
| Antibody | Rabbit anti-rat macrophage, polyclonal | Life Science | Cat # AIA51240 | 1:3000 |
| Chemical compound, drug | Neurobasal medium | Gibco/Thermofisher | Cat # 21103049 | |
| Chemical compound, drug | B27 | Thermofisher | Cat # 17504044 | |
| Chemical compound, drug | BDNF | PeproTech | Cat # 450–02 | 25 ng/ml |
| Chemical compound, drug | CNTF | PeproTech | Cat # 450–13 | 10 ng/ml |
| Chemical compound, drug | Forskolin | Sigma | Cat # F3917 | 10 mM |
| Chemical compound, drug | Glutamine | Thermofisher | Cat # 25030149 | 2 mM |
| Chemical compound, drug | N-acetyl-l-cysteine | Sigma | Cat # A09165 | 60 mg/ml |
| Chemical compound, drug | Penicilin/streptomycin | Gibco | Cat # 15070–022 | 100 units/ml |
| Chemical compound, drug | Sodium pyruvate | Thermofisher | Cat # 11360070 | 1 mM |
| Chemical compound, drug | DiI (1,1-dioctadecyl-3,3,3,3-tetramethylindocarbocyanine perchlorate) | Thermofisher | Cat # D282 | |
| Chemical compound, drug | DiD (1,1’–dioctadecyl-3,3,3’,3’- tetramethylindodicarbocyanine, 4-chlorobenzenesulfonate) | Thermofisher | Cat # D7757 | |
| Software, algorithm | R Project for Statistical Computing | www.r-project.org | RRID:SCR_001905 | |
| Software, algorithm | ImageJ | https://imagej.nih.gov/ij | RRID:SCR_003070 | |
| Software, algorithm | MATLAB | RRID:SCR_001622 | ||
| Software, algorithm | 3-step map alignment | Reber Lab (Krembil) | https://github.com/michaelreber/3-step-Map-Aligment-Model/blob/master/threestepsMapAlignment.m | |
| Software, algorithm | LOESS smoothing | Reber Lab (Krembil) | https://github.com/michaelreber/Leave-one-out-LOESS/blob/master/wtloess.R |
Table 1
summary of the parameters of the 3-step map alignment algorithm.
| Receptor | Epha3 | Epha4 | Epha5 | Epha6 | Source |
|---|---|---|---|---|---|
| Retina | WT = 0 Epha3KI/KI = 1.86 Epha3KI/+ = 0.93 | 1.05 | 0.14e0.018x | 0.09e0.029x | Measured (Brown et al., 2000; Reber et al., 2004) |
| V1 | e(-x/100) – e((x – 200/100) + 1) | Estimated (Tsigankov and Koulakov, 2010; Tsigankov and Koulakov, 2006) | |||
| Ligand | Efna2 | Efna3 | Efna5 | ||
| Retina | 1.85 e-0.008x | 0.44 | 1.79 e-0.014x | Measured (Savier et al., 2017) | |
| SC | e((x – 100)100) – e((-x-100)/100) | Estimated (Cang et al., 2005; Savier et al., 2017; Tsigankov and Koulakov, 2010; Tsigankov and Koulakov, 2006) | |||
| Parameters | |||||
| 1 | Strength of activity interaction | ||||
| 200 | Chemical strength | ||||
| d | 3 | SC interaction distance | |||
| b | 0.11 | Retinal correlation distance | |||
Additional files
Download links
A two-part list of links to download the article, or parts of the article, in various formats.
Downloads (link to download the article as PDF)
Open citations (links to open the citations from this article in various online reference manager services)
Cite this article (links to download the citations from this article in formats compatible with various reference manager tools)
New insights on the modeling of the molecular mechanisms underlying neural maps alignment in the midbrain
eLife 9:e59754.
https://doi.org/10.7554/eLife.59754


