Model-based spatial-temporal mapping of opisthorchiasis in endemic countries of Southeast Asia
- Department of Medical Statistics, School of Public Health, Sun Yat-sen University, China
- Department of Parasitology, Institute of Ecology and Biological Resources, Graduate University of Science and Technology, Vietnam Academy of Sciences and Technology, Cau Giay, Viet Nam
- Lao Tropical and Public Health Institute, Ministry of Health, Lao People's Democratic Republic
- National Center for Parasitology, Entomology and Malaria Control, Ministry of Health, Cambodia
- Tropical and Parasitic Diseases Research Unit, Faculty of Medicine, Mahasarakham University, Thailand
- National Institute of Parasitic Diseases, Chinese Center for Disease Control and Prevention, China
- WHO Collaborating Centre for Tropical Diseases, Key Laboratory of Parasite and Vector Biology, Ministry of Health, China
- Sun Yat-sen Global Health Institute, Sun Yat-sen University, China
Figures
Figure 1 with 1 supplement
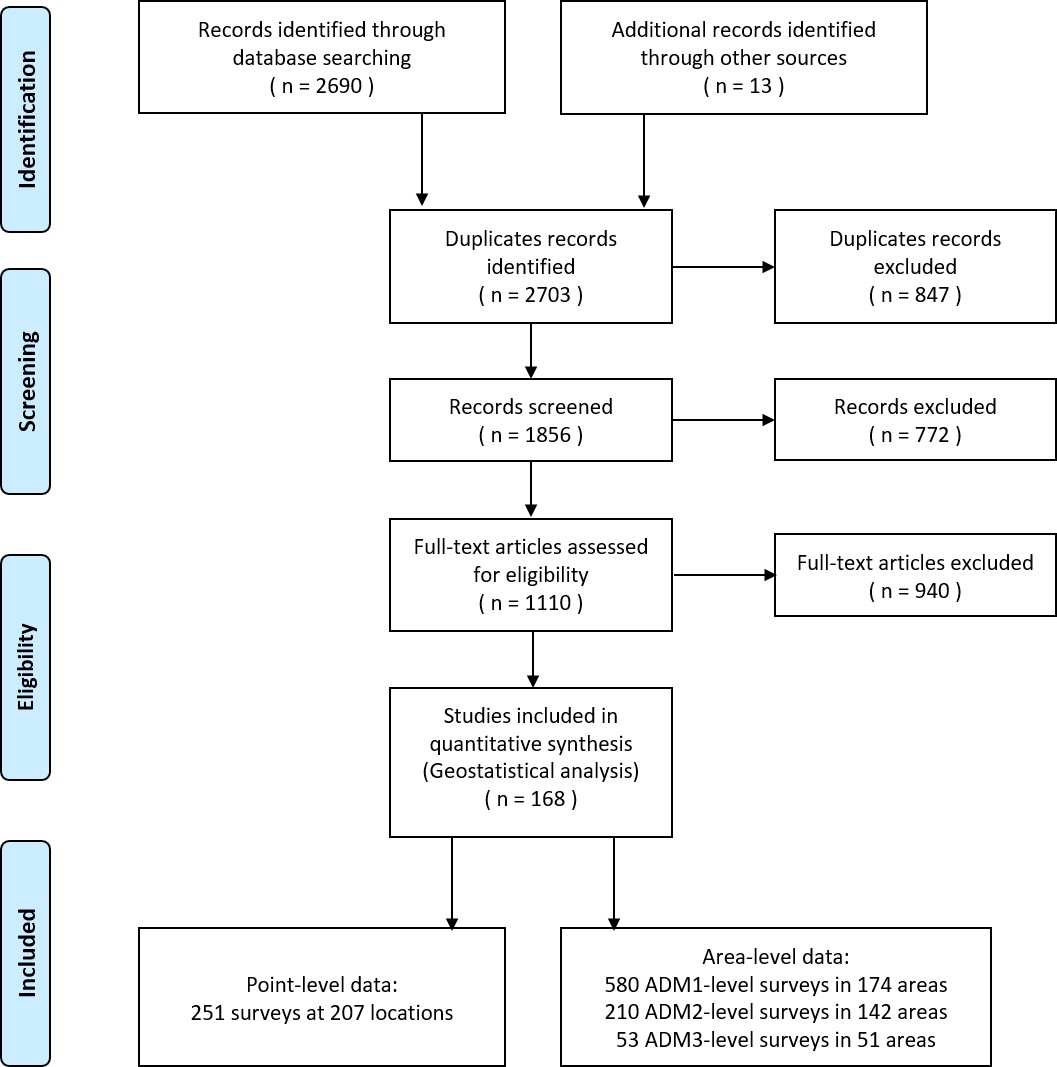
Data search and selection flow chart.
Figure 1—figure supplement 1
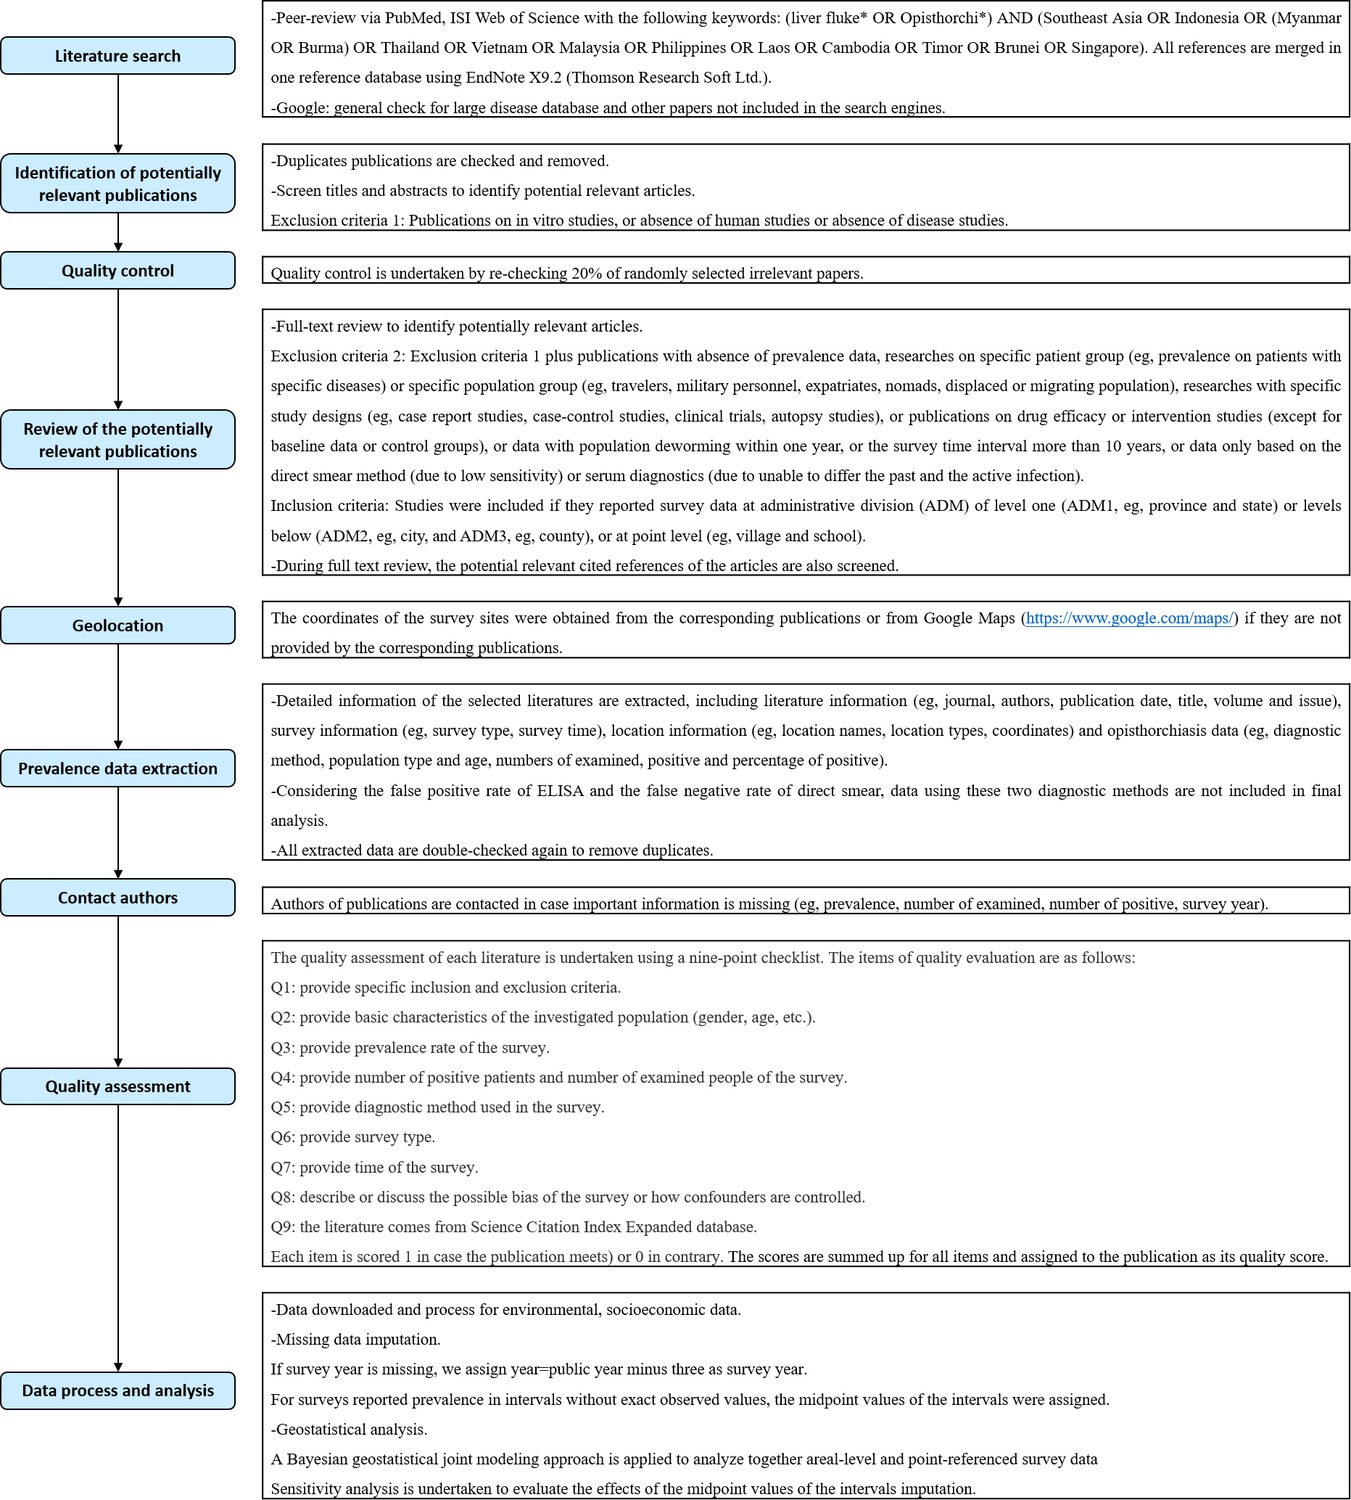
Study protocol.
Figure 2 with 1 supplement
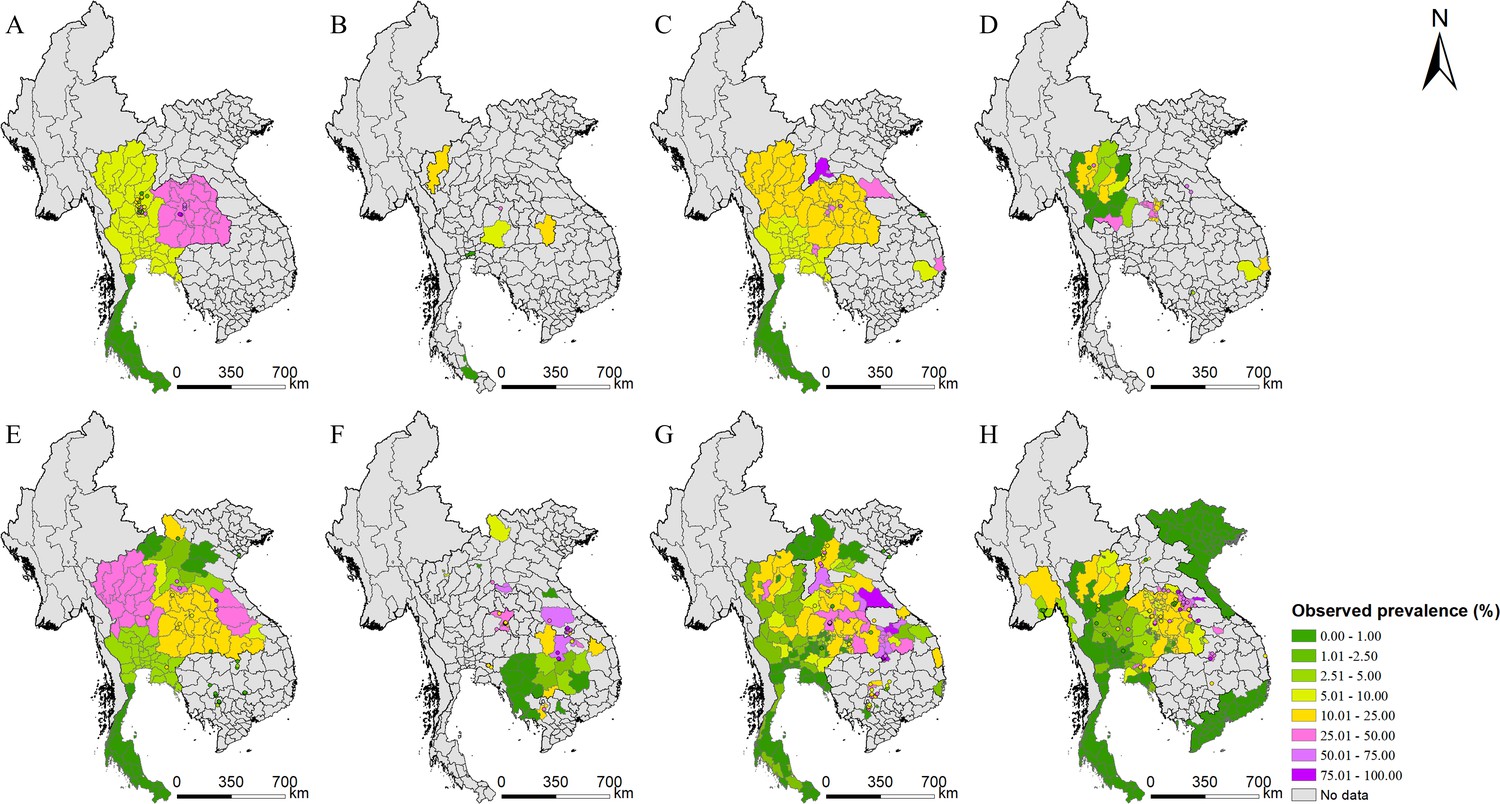
Survey locations and observed prevalence of O. viverrini infection in endemic countries of Southeast Asia.
(A) 1978–1982, (B) 1983–1987, (C) 1988–1992, (D) 1993–1997, (E) 1998–2002, (F) 2003–2007, (G) 2008–2012, and (H) 2013–2018.
-
Figure 2—source data 1
The original data of O. viverrini infection in endemic countries of Southeast Asia.
- https://cdn.elifesciences.org/articles/59755/elife-59755-fig2-data1-v2.xlsx
-
Figure 2—source data 2
The results of the preferential sampling test.
- https://cdn.elifesciences.org/articles/59755/elife-59755-fig2-data2-v2.docx
Figure 2—figure supplement 1
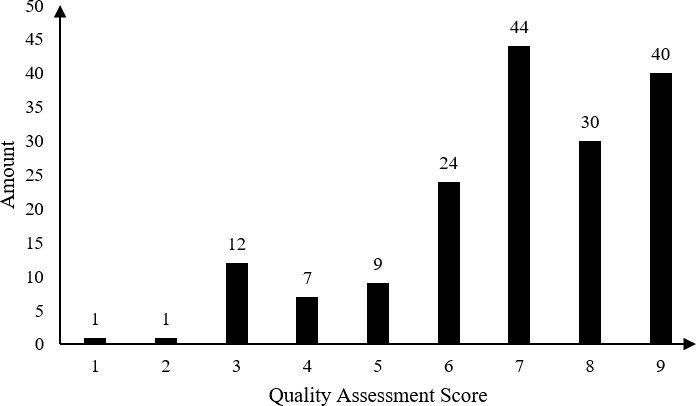
Result of quality assessment of eligible studies.
-
Figure 2—figure supplement 1—source data 1
The results of quality assessment.
- https://cdn.elifesciences.org/articles/59755/elife-59755-fig2-figsupp1-data1-v2.docx
Figure 3 with 1 supplement
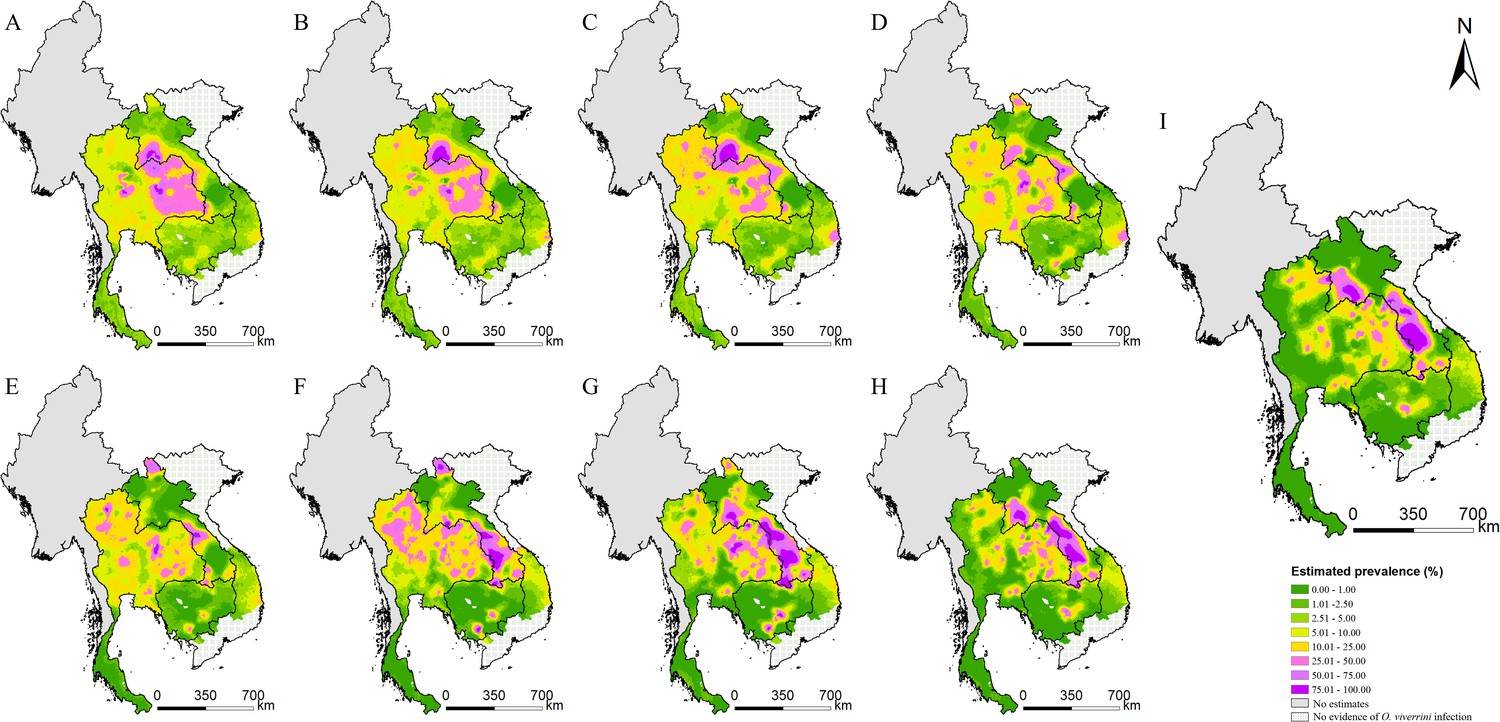
Model-based estimated risk maps of O. viverrini infection in endemic countries of Southeast Asia in different years.
Estimated prevalence based on the median of the posterior estimated distribution of infection risk in (A) 1978, (B) 1983, (C) 1988, (D) 1993, (E) 1998, (F) 2003, (G) 2008, (H) 2013, and (I) 2018.
-
Figure 3—source data 1
The sensitivity analysis results of model-based estimated risk maps in 2018.
- https://cdn.elifesciences.org/articles/59755/elife-59755-fig3-data1-v2.xlsx
Figure 3—figure supplement 1
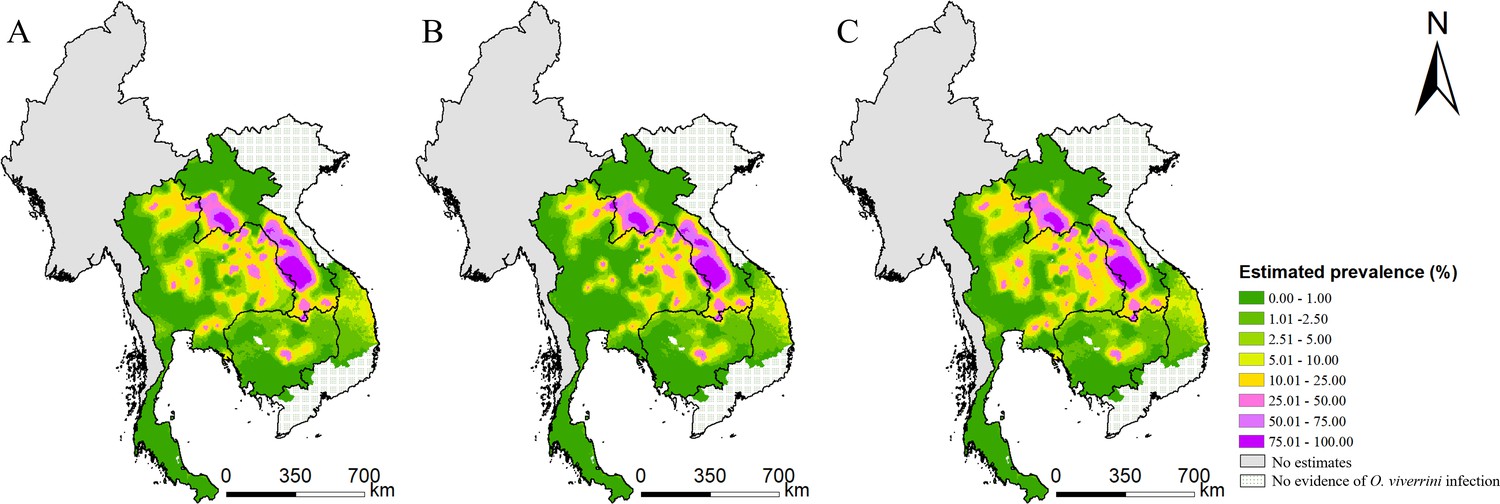
Model-based estimated risk maps of O. viverrini infection in 2018 under different values assigned to prevalence for surveys only reported prevalence in intervals.
(A) The midpoint values of the intervals, (B) the lower limits, and (C) the upper limits of the intervals were assigned to prevalence.
-
Figure 3—figure supplement 1—source data 1
Sensitivity analysis for surveys reported prevalence in intervals.
- https://cdn.elifesciences.org/articles/59755/elife-59755-fig3-figsupp1-data1-v2.docx
Figure 4
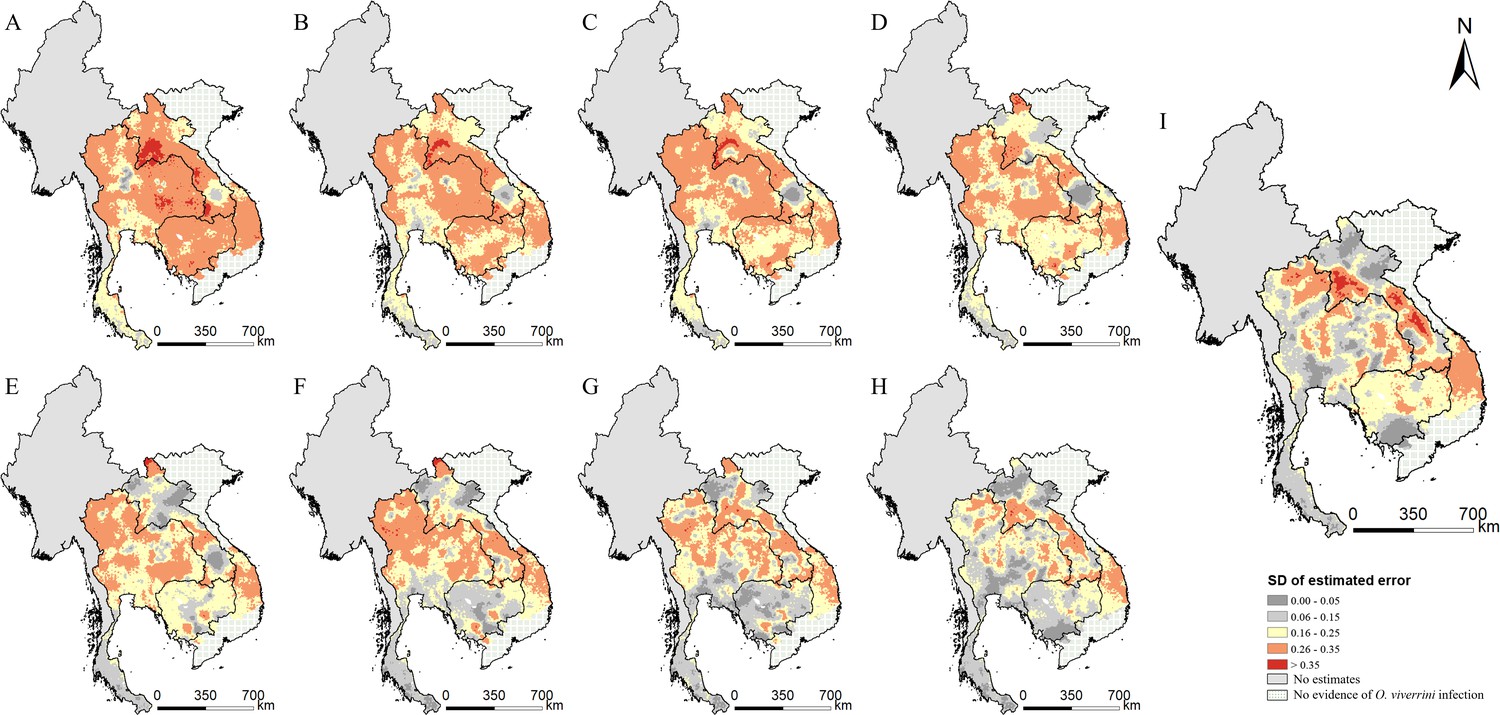
The estimation uncertainty in endemic countries of Southeast Asia in different years.
(A) 1978, (B) 1983, (C) 1988, (D) 1993, (E) 1998, (F) 2003, (G) 2008, (H) 2013, and (I) 2018.
-
Figure 4—source data 1
The results of the estimated uncertainty in endemic countries of Southeast Asia in different years.
- https://cdn.elifesciences.org/articles/59755/elife-59755-fig4-data1-v2.xlsx
Figure 5
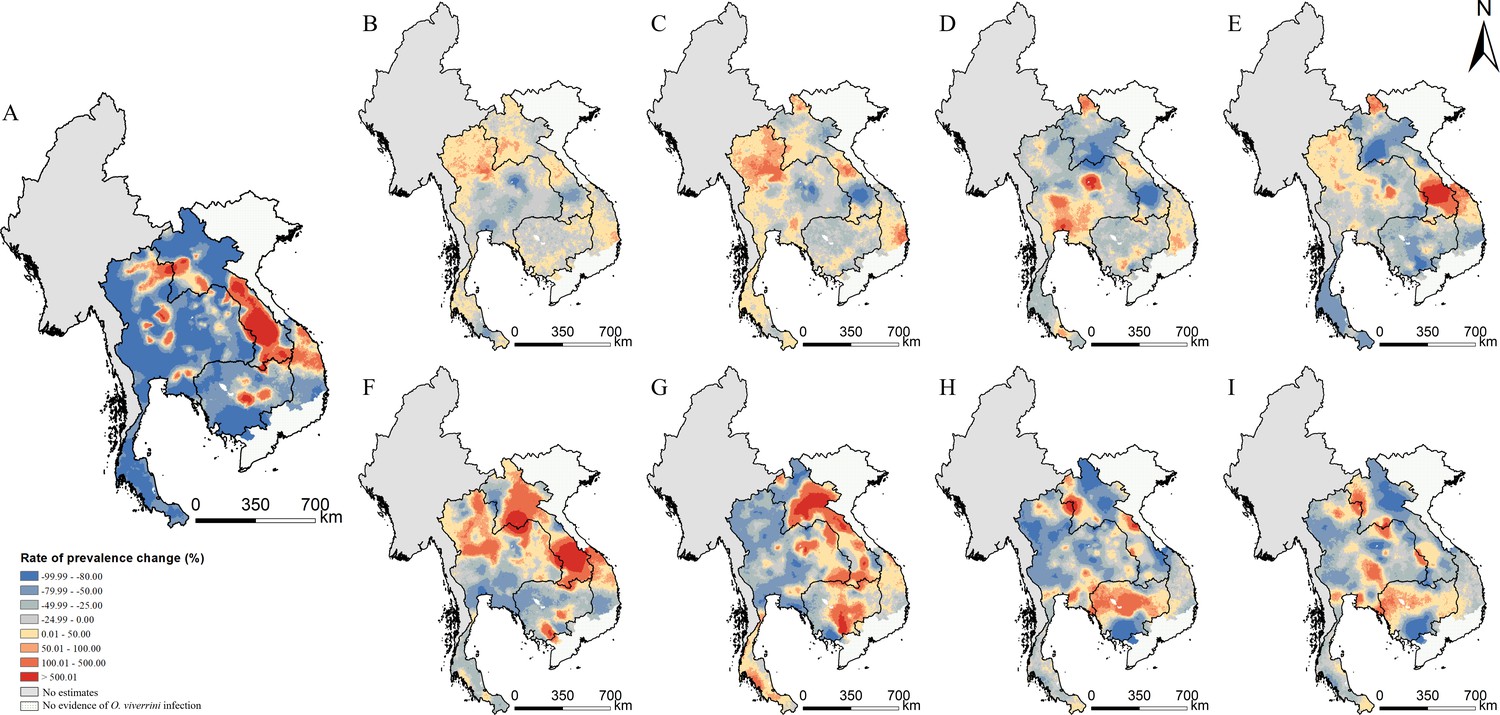
Changes of O. viverrini infection risk across time periods.
Changes were calculated by the median of the posterior estimated distribution of infection risk for the latter time period minus that for the former time period divided by that for the former time period. The risk changes (A) between 1978 and 2018; (B) between 1978 and 1983; (C) between 1983 and 1988; (D) between 1988 and 1993; (E) between 1993 and 1998; (F) between 1998 and 2003; (G) between 2003 and 2008; (H) between 2008 and 2013; and (I) between 2013 and 2018 (source data: Figure 5—source data 1).
-
Figure 5—source data 1
The results of the changes of O. viverrini infection risk across time periods.
- https://cdn.elifesciences.org/articles/59755/elife-59755-fig5-data1-v2.xlsx
Figure 6 with 9 supplements
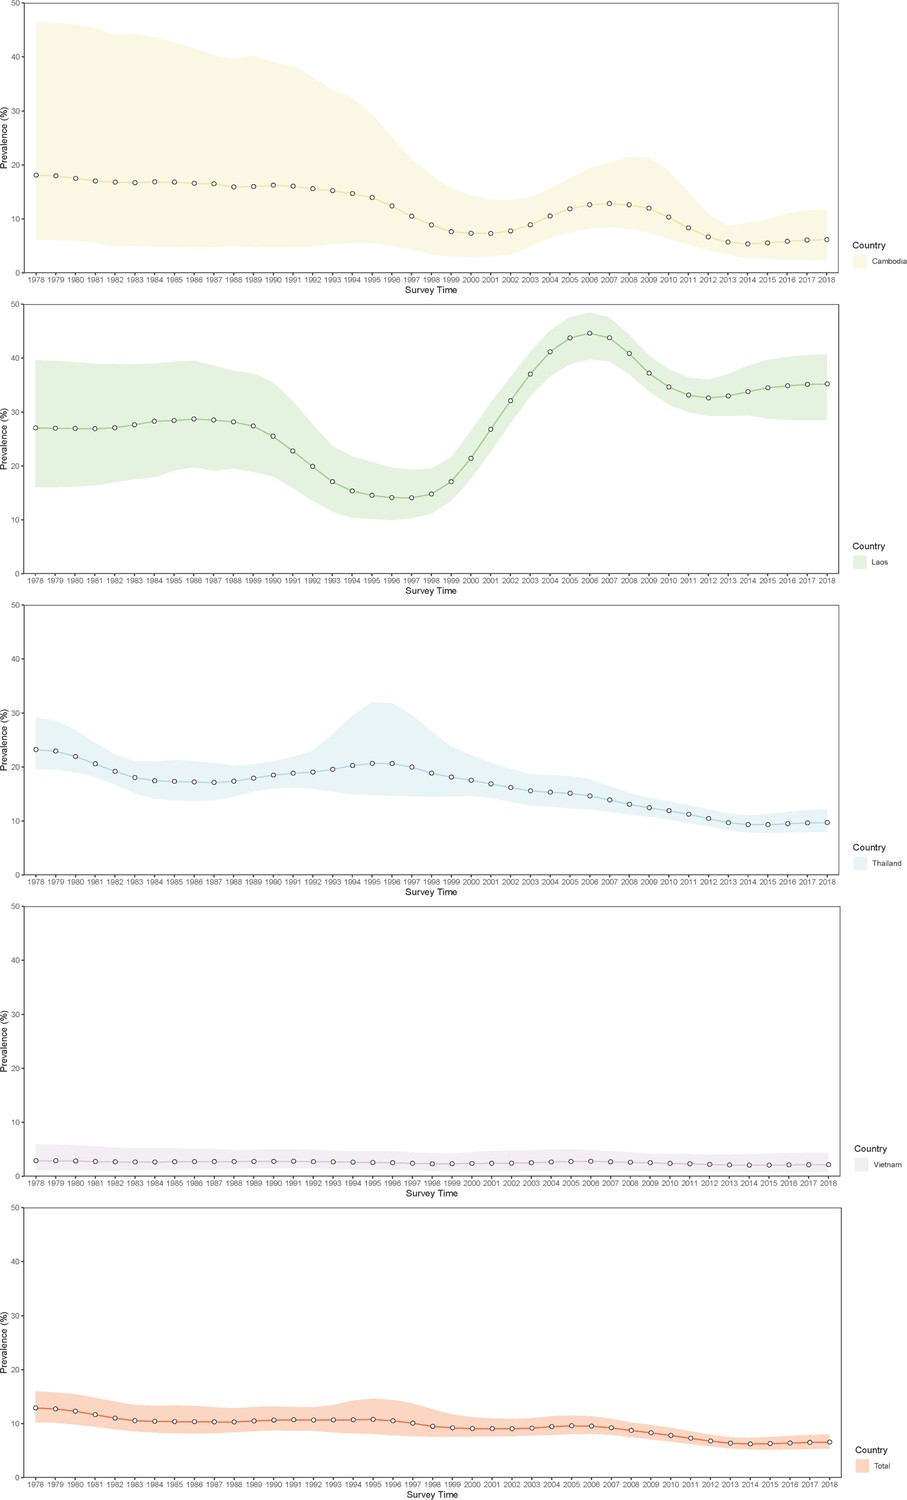
Trends in estimated prevalence of O. viverrini infection in Southeast Asia.
-
Figure 6—source data 1
The results of the estimated prevalence of O. viverrini infection in Southeast Asia in different years.
- https://cdn.elifesciences.org/articles/59755/elife-59755-fig6-data1-v2.xlsx
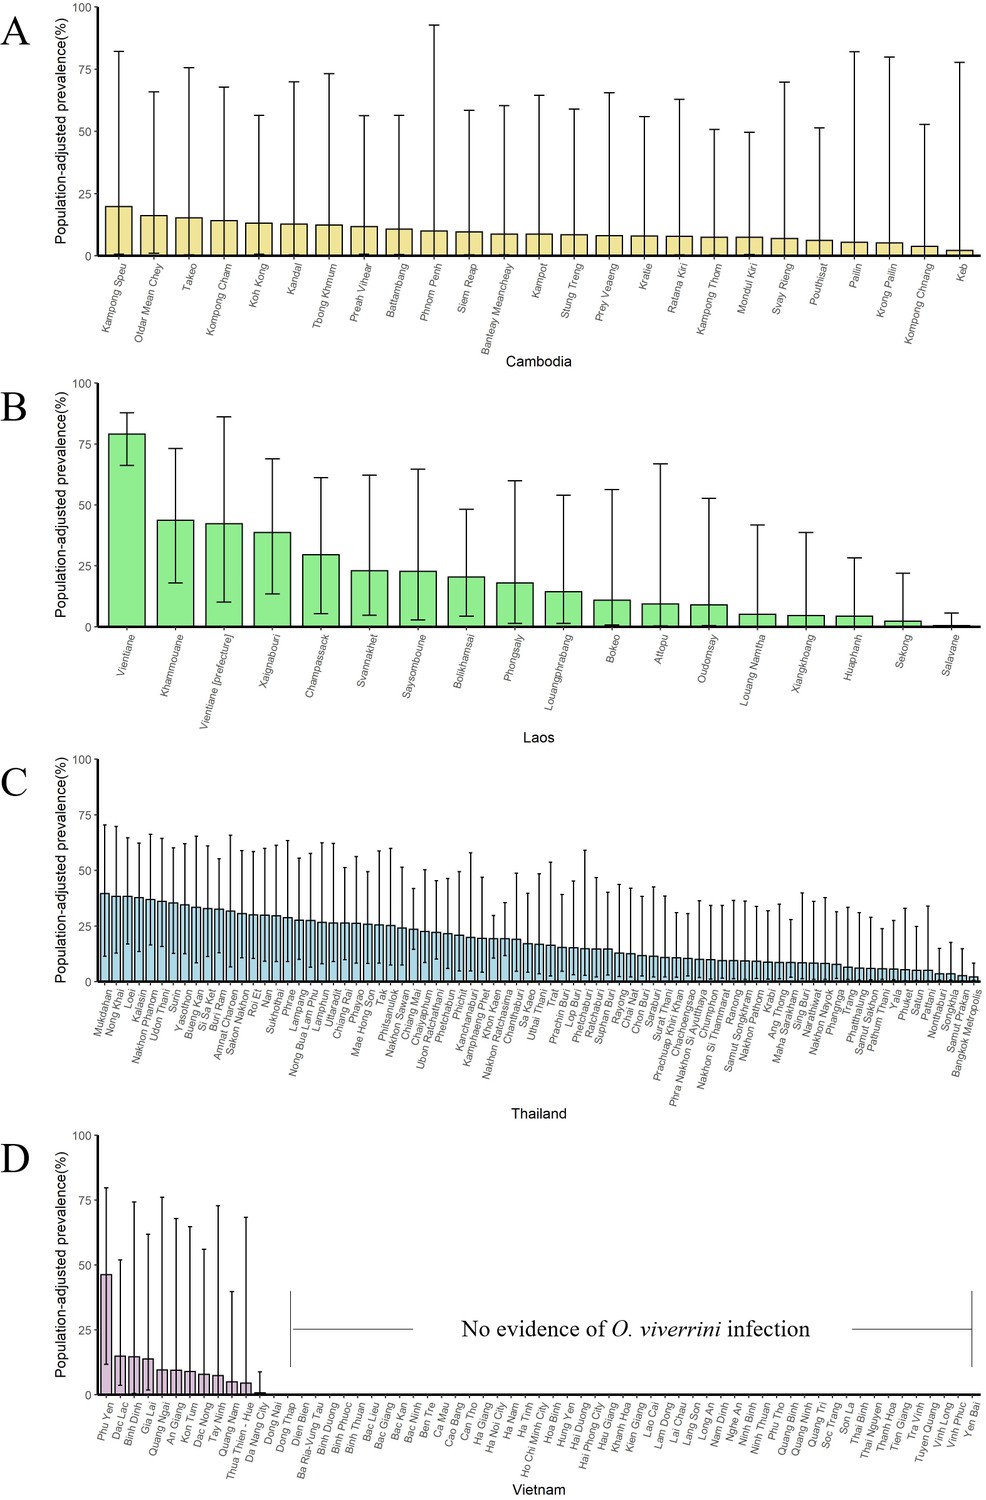
Figure 6—figure supplement 1
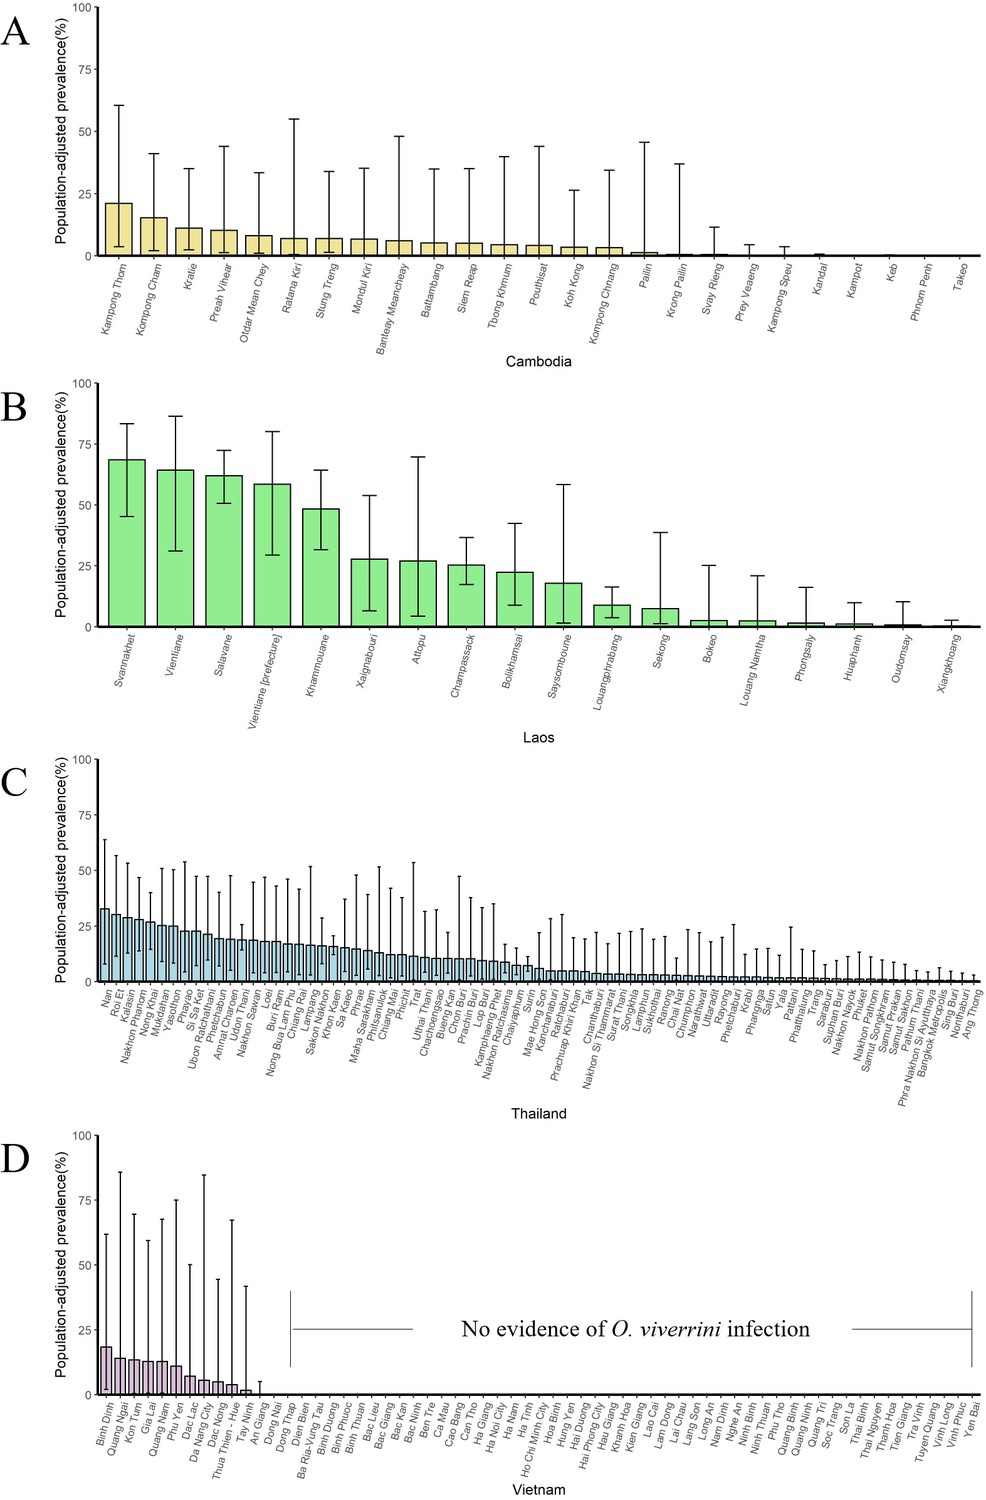
The population-adjusted estimated prevalence (median ± 95% BCI) in 2018 in four countries at administrative division of level 1.
(A) Cambodia, (B) Laos, (C) Thailand, and (D) Vietnam.
-
Figure 6—figure supplement 1—source data 1
The results of the population-adjusted estimated prevalence in 2018 in four countries at administrative division of level 1.
- https://cdn.elifesciences.org/articles/59755/elife-59755-fig6-figsupp1-data1-v2.xlsx
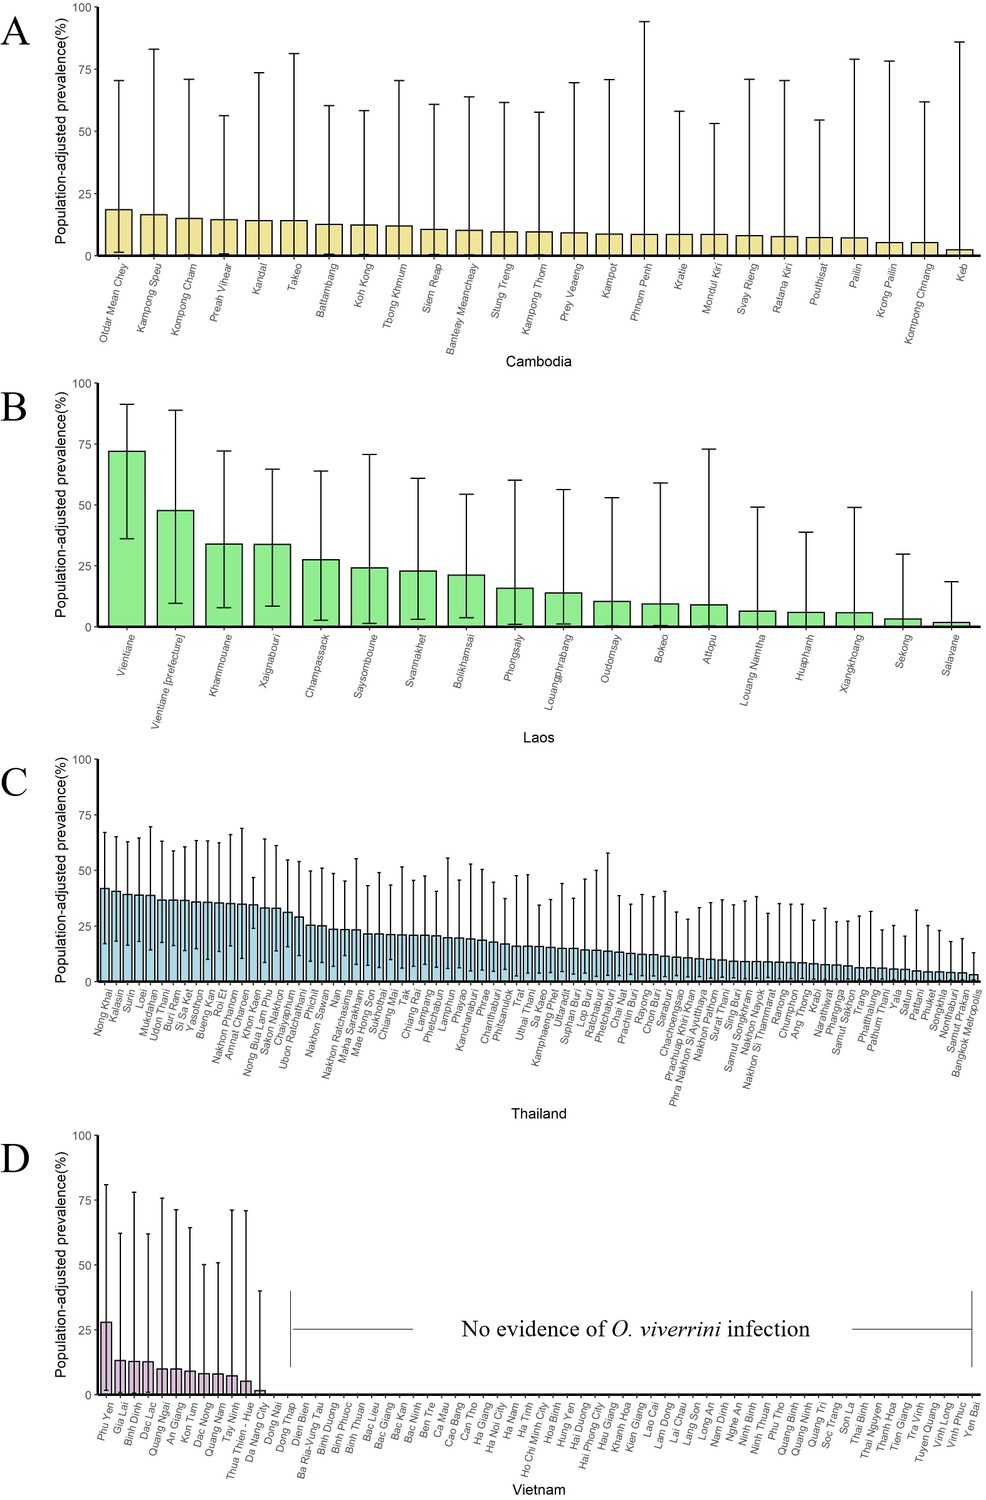
Figure 6—figure supplement 2
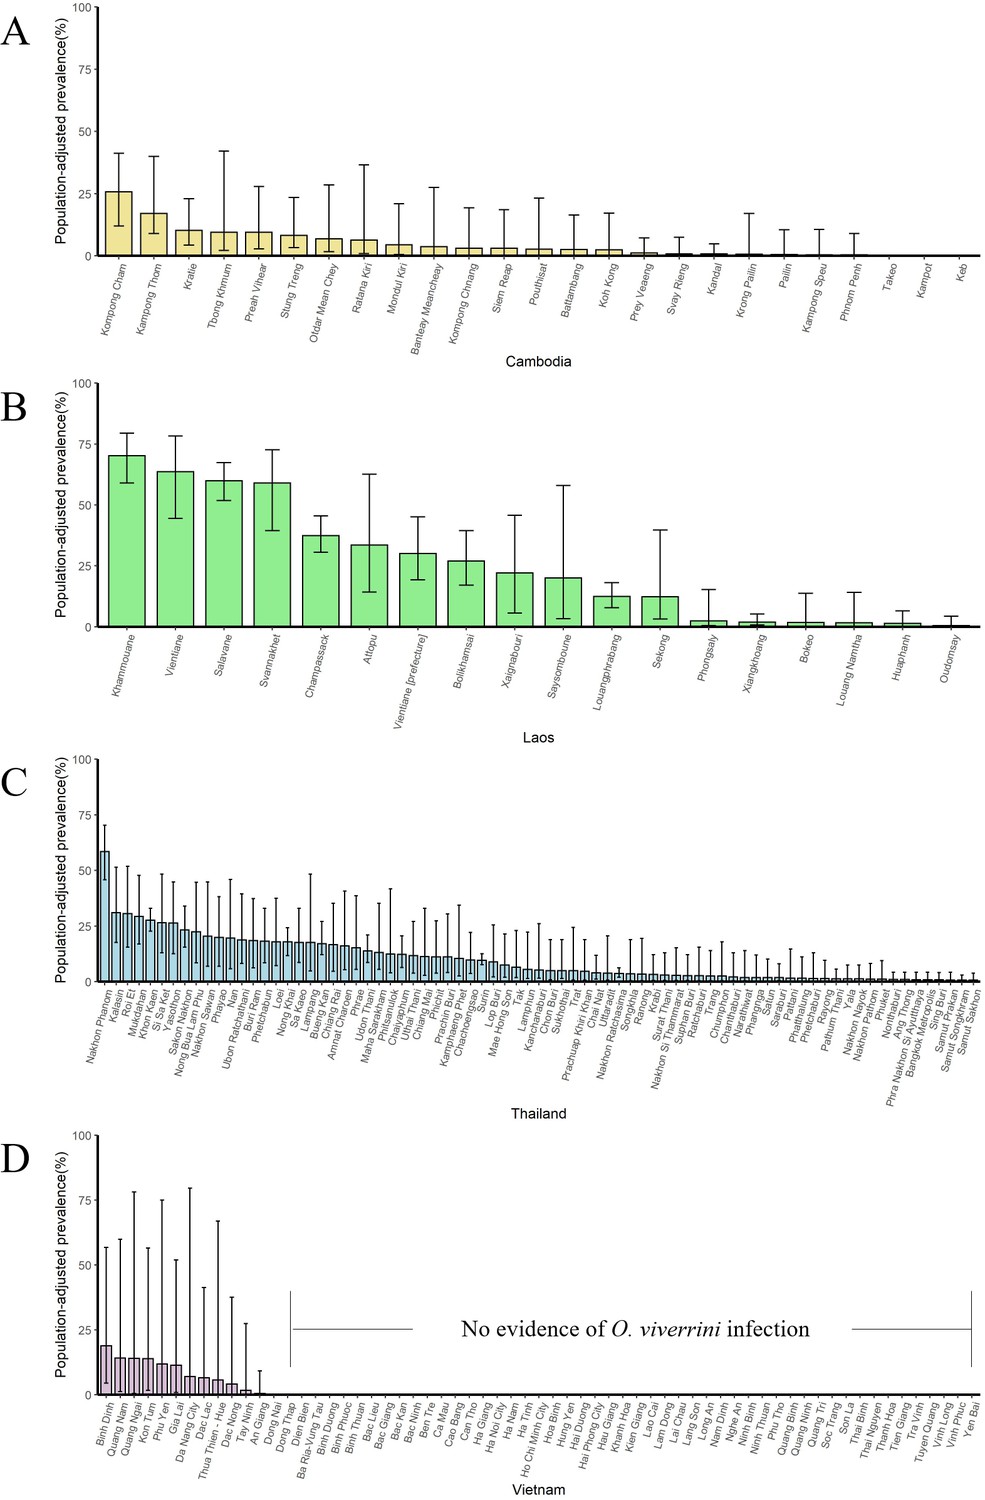
The population-adjusted estimated prevalence (median ± 95% BCI) in 2013 in four countries at administrative division of level 1.
(A) Cambodia, (B) Laos, (C) Thailand, and (D) Vietnam.
-
Figure 6—figure supplement 2—source data 1
The results of the population-adjusted estimated prevalence in 2013 in four countries at administrative division of level 1.
- https://cdn.elifesciences.org/articles/59755/elife-59755-fig6-figsupp2-data1-v2.xlsx
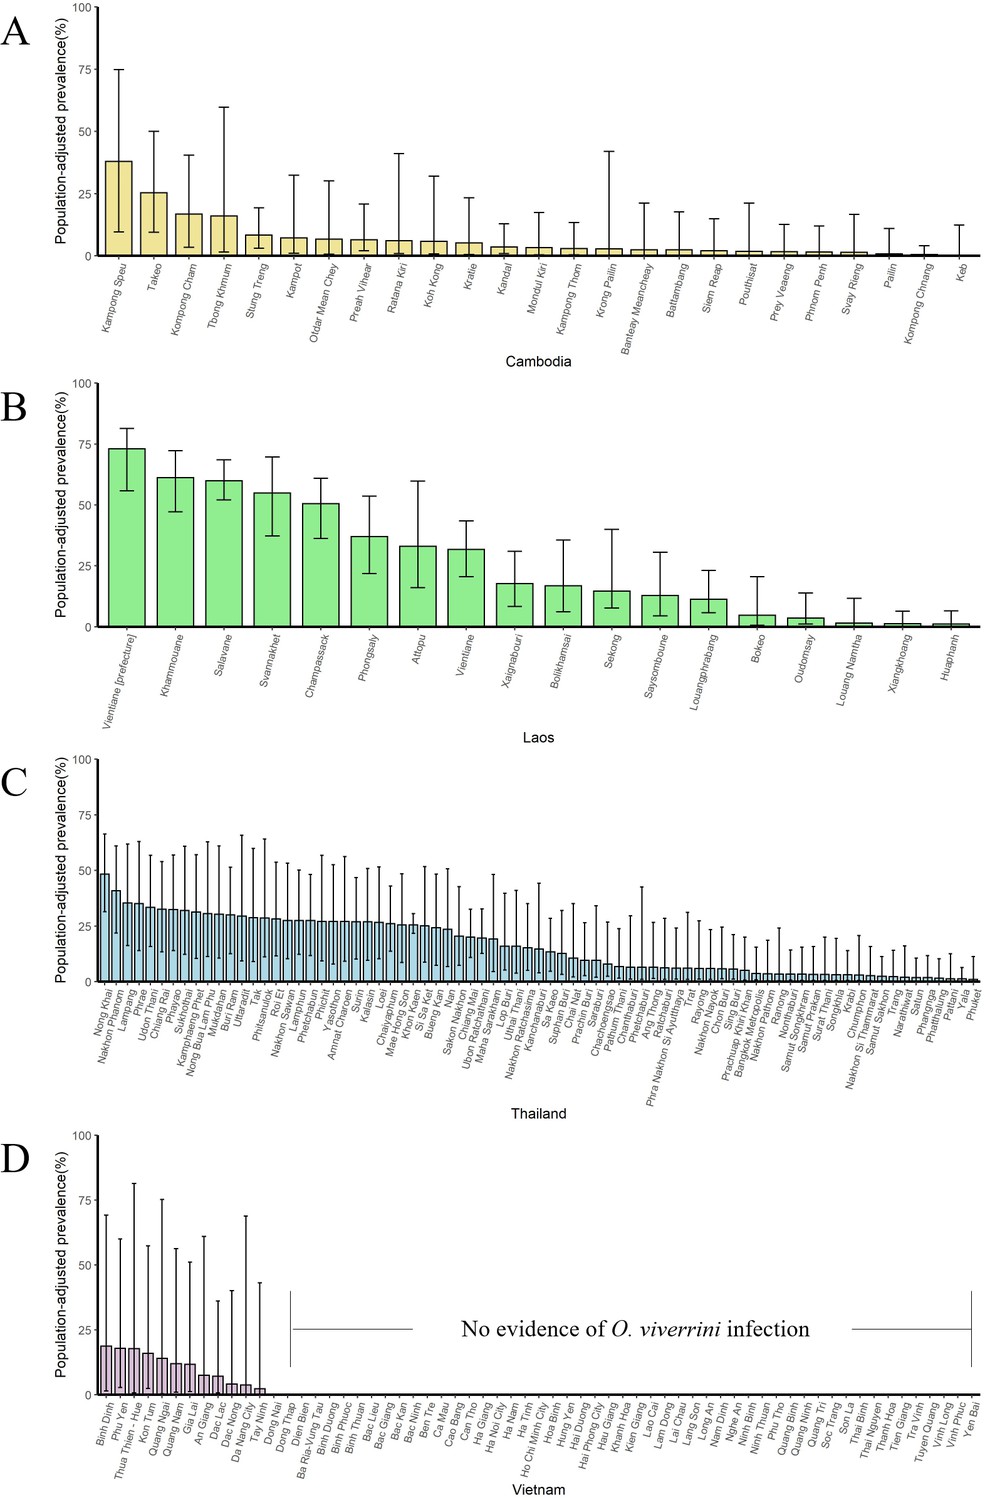
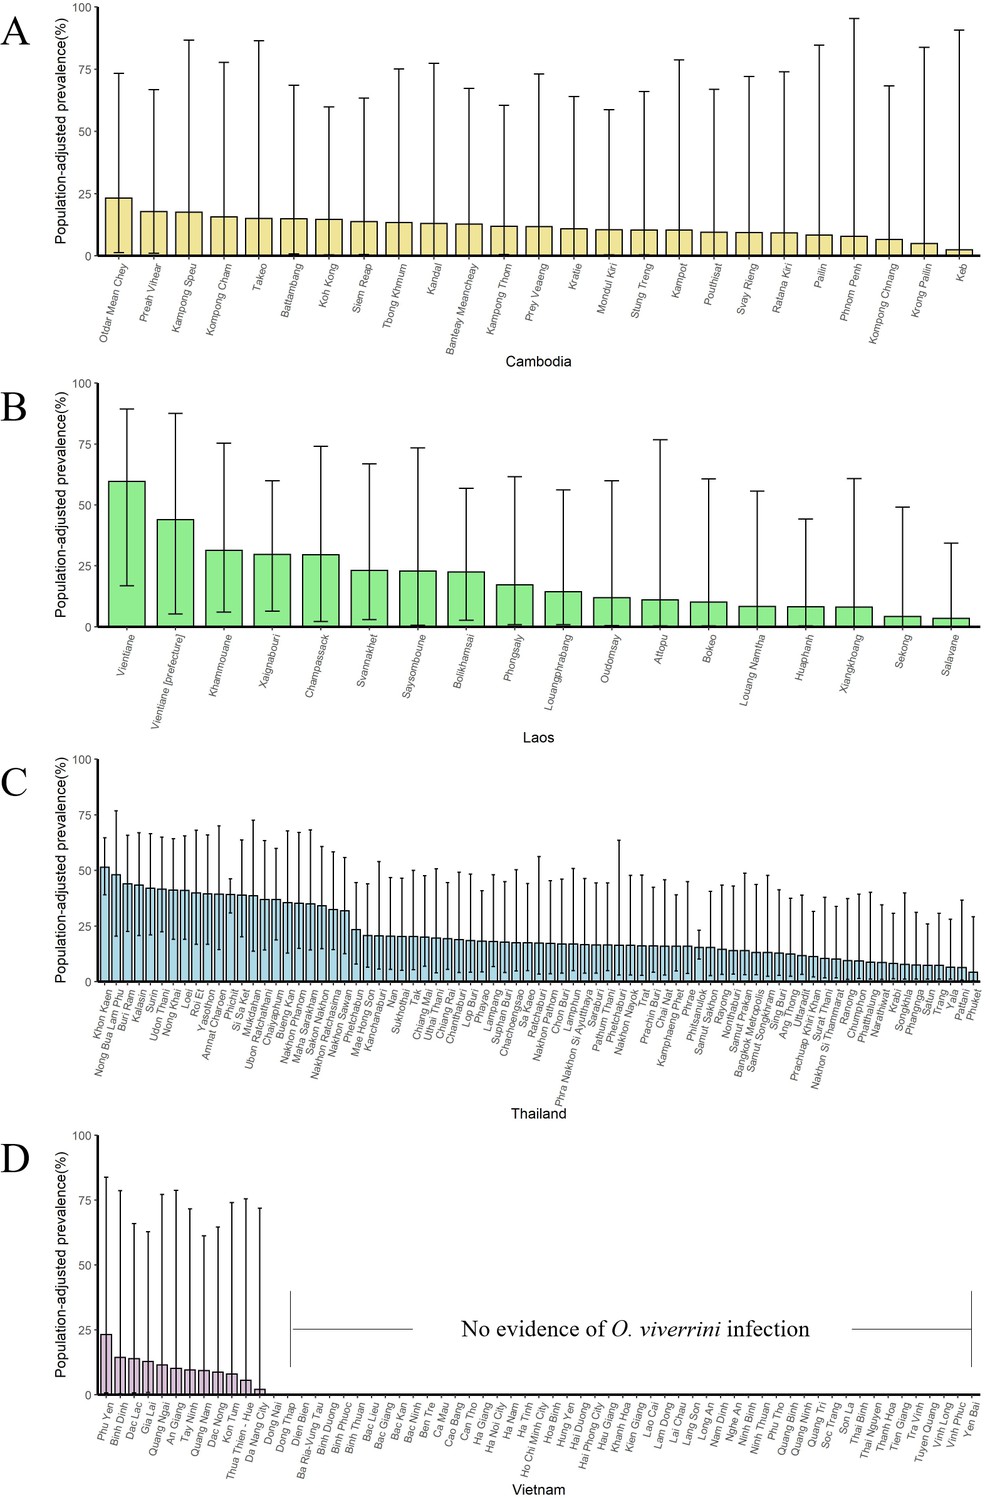
Figure 6—figure supplement 3

The population-adjusted estimated prevalence (median ± 95% BCI) in 2008 in four countries at administrative division of level 1.
(A) Cambodia, (B) Laos, (C) Thailand, and (D) Vietnam.
-
Figure 6—figure supplement 3—source data 1
The results of the population-adjusted estimated prevalence in 2008 in four countries at administrative division of level 1.
- https://cdn.elifesciences.org/articles/59755/elife-59755-fig6-figsupp3-data1-v2.xlsx
Figure 6—figure supplement 4
The population-adjusted estimated prevalence (median ± 95% BCI) in 2003 in four countries at administrative division of level 1.
(A) Cambodia, (B) Laos, (C) Thailand, and (D) Vietnam.
-
Figure 6—figure supplement 4—source data 1
The results of the population-adjusted estimated prevalence in 2003 in four countries at administrative division of level 1.
- https://cdn.elifesciences.org/articles/59755/elife-59755-fig6-figsupp4-data1-v2.xlsx
Figure 6—figure supplement 5

The population-adjusted estimated prevalence (median ± 95% BCI) in 1998 in four countries at administrative division of level 1.
(A) Cambodia, (B) Laos, (C) Thailand, and (D) Vietnam.
-
Figure 6—figure supplement 5—source data 1
The results of the population-adjusted estimated prevalence in 1998 in four countries at administrative division of level 1.
- https://cdn.elifesciences.org/articles/59755/elife-59755-fig6-figsupp5-data1-v2.xlsx
Figure 6—figure supplement 6

The population-adjusted estimated prevalence (median ± 95% BCI) in 1993 in four countries at administrative division of level 1.
(A) Cambodia, (B) Laos, (C) Thailand, and (D) Vietnam.
-
Figure 6—figure supplement 6—source data 1
The results of the population-adjusted estimated prevalence in 1993 in four countries at administrative division of level 1.
- https://cdn.elifesciences.org/articles/59755/elife-59755-fig6-figsupp6-data1-v2.xlsx
Figure 6—figure supplement 7
The population-adjusted estimated prevalence (median ± 95% BCI) in 1988 in four countries at administrative division of level 1.
(A) Cambodia, (B) Laos, (C) Thailand, and (D) Vietnam.
-
Figure 6—figure supplement 7—source data 1
The results of the population-adjusted estimated prevalence in 1988 in four countries at administrative division of level 1.
- https://cdn.elifesciences.org/articles/59755/elife-59755-fig6-figsupp7-data1-v2.xlsx
Figure 6—figure supplement 8
The population-adjusted estimated prevalence (median ± 95% BCI) in 1983 in four countries at administrative division of level 1.
(A) Cambodia, (B) Laos, (C) Thailand, and (D) Vietnam.
-
Figure 6—figure supplement 8—source data 1
The results of the population-adjusted estimated prevalence in 1983 in four countries at administrative division of level 1.
- https://cdn.elifesciences.org/articles/59755/elife-59755-fig6-figsupp8-data1-v2.xlsx
Figure 6—figure supplement 9
The population-adjusted estimated prevalence (median ± 95% BCI) in 1978 in four countries at administrative division of level 1.
(A) Cambodia, (B) Laos, (C) Thailand, and (D) Vietnam.
-
Figure 6—figure supplement 9—source data 1
The results of the population-adjusted estimated prevalence in 1978 in four countries at administrative division of level 1.
- https://cdn.elifesciences.org/articles/59755/elife-59755-fig6-figsupp9-data1-v2.xlsx
Figure 7
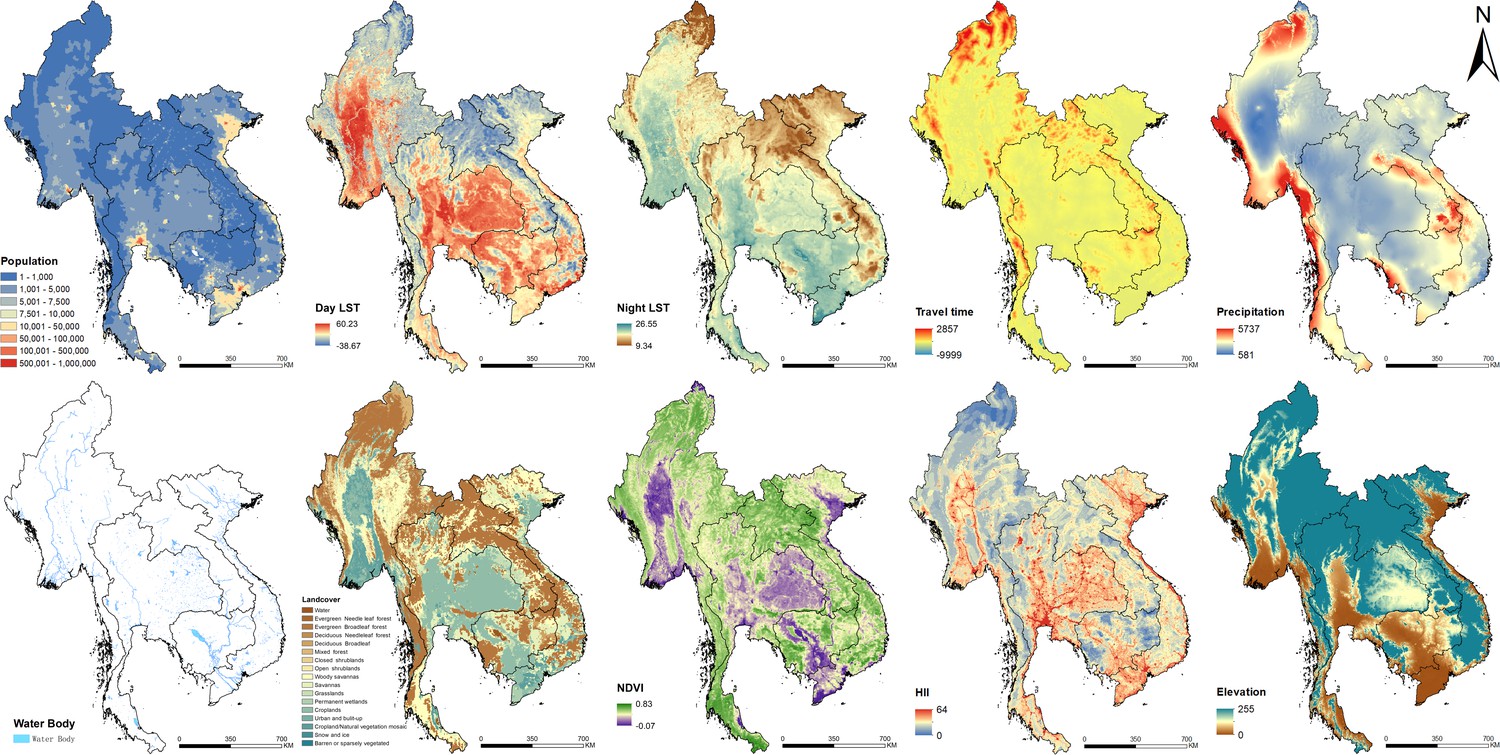
Images of spatial covariates used in the present study.
-
Figure 7—source data 1
The sources of covariate layers.
- https://cdn.elifesciences.org/articles/59755/elife-59755-fig7-data1-v2.docx
Tables
Table 1
Overview of opisthorchiasis survey data in Southeast Asia.
| Cambodia | Lao PDR | Myanmar | Thailand | Vietnam | Total | |
|---|---|---|---|---|---|---|
| Relevant papers | 14 | 43 | 2 | 97 | 15 | 168 |
| Total surveys/locations | 91/73 | 156/99 | 6/6 | 770/335 | 71/64 | 1094/574 |
| Survey type (surveys/locations) | ||||||
| School | 33/31 | 4/4 | 0/0 | 13/13 | 0/0 | 50/48 |
| Community | 58/46 | 152/94 | 6/6 | 757/325 | 71/64 | 1044/535 |
| Location type (surveys/locations) | ||||||
| Point-level | 55/43 | 63/51 | 3/3 | 125/105 | 5/5 | 251/207 |
| ADM3-level | 0/0 | 0/0 | 0/0 | 53/51 | 0/0 | 53/51 |
| ADM2-level | 14/11 | 35/27 | 0/0 | 159/102 | 2/2 | 210/142 |
| ADM1-level | 22/19 | 58/18 | 3/3 | 433/77 | 64/57 | 580/174 |
| Period | 1998–2016 | 1989–2016 | 2015–2016 | 1978–2018 | 1991–2015 | 1978–2018 |
| Year of survey (surveys/locations) | ||||||
| 1978–1982 | 0/0 | 0/0 | 0/0 | 123/115 | 0/0 | 123/115 |
| 1983–1987 | 0/0 | 0/0 | 0/0 | 7/6 | 0/0 | 7/6 |
| 1988–1992 | 0/0 | 2/2 | 0/0 | 97/89 | 1/1 | 100/92 |
| 1993–1997 | 0/0 | 9/5 | 0/0 | 18/18 | 6/2 | 33/25 |
| 1998–2002 | 25/22 | 28/22 | 0/0 | 103/103 | 2/2 | 158/149 |
| 2003–2007 | 3/2 | 26/24 | 0/0 | 15/15 | 1/1 | 45/42 |
| 2008–2012 | 62/48 | 75/54 | 0/0 | 166/153 | 9/8 | 312/263 |
| 2013–2018 | 1/1 | 16/16 | 6/6 | 241/201 | 52/52 | 316/276 |
| Diagnostic methods (surveys/locations) | ||||||
| Kato–Katz | 86/70 | 128/83 | 3/3 | 212/166 | 7/7 | 436/329 |
| FECT | 2/2 | 8/7 | 3/3 | 109/99 | 0/0 | 122/111 |
| Stoll’s | 0/0 | 0/0 | 0/0 | 38/28 | 0/0 | 38/28 |
| PCR | 0/0 | 5/4 | 0/0 | 1/1 | 0/0 | 6/5 |
| Combined | 3/3 | 14/13 | 0/0 | 14/12 | 0/0 | 31/28 |
| Others | 0/0 | 1/1 | 0/0 | 6/6 | 0/0 | 7/7 |
| NS* | 0/0 | 5/5 | 0/0 | 391/111 | 64/57 | 460/173 |
| Mean prevalence | 10.56% | 39.50% | 4.93% | 14.25% | 2.65% | 16.74% |
-
*NS: not stated or missing.
Table 2
Posterior summaries of model parameters.
| Estimated median (95% BCI) | OR | Prob (%)* | |
|---|---|---|---|
| Intercept | −4.51 (−5.08, –3.94) | ||
| Survey type | |||
| School-based survey | Ref | Ref | - |
| Community-based survey | 0.96 (0.70, 1.23) | 2.61 (2.10, 3.42) | >99.99 |
| Diagnostic methods | |||
| Kato–Katz | Ref | Ref | - |
| FECT | −0.28 (–0.49, –0.07) | 0.76 (0.61, 0.93) | 0.80 |
| Other methods | 0.01 (–0.07, 0.10) | 1.01 (0.93, 1.12) | 64.20 |
| Land surface temperature (LST) in the daytime (°C) | |||
| <30.65 | Ref | Ref | - |
| 30.65–32.07 | 0.25 (–0.001, 0.50) | 1.28 (0.999, 1.65) | 97.40 |
| >32.07 | 0.07 (–0.18, 0.33) | 1.07 (0.84, 1.39) | 73.40 |
| Human influence index | −0.01 (–0.02, –0.003) | 0.99 (0.98, 1.00) | 0.80 |
| Distance to the nearest open water bodies (km) | 0.24 (–1.45, 1.94) | 1.27 (0.23, 6.96) | 60.20 |
| Elevation (m) | −0.003 (–0.005,–0.001) | 0.997 (0.995, 0.999) | <0.01 |
| Travel time to the nearest big city (min) | 0.0001 (–0.002, 0.002) | 1.00 (0.998, 1.002) | 56.60 |
-
*Posterior probability of OR > 1.
Table 3
Population-adjusted estimated prevalence and number of individuals infected with O. viverrini in endemic countries of Southeast Asia in 2018*.
| Population (×103) | Prevalence (%) | No. infected (×103) | |
|---|---|---|---|
| Cambodia | 16227.39 | 6.15 (2.41, 11.73) | 997.95 (390.46, 1903.46) |
| Lao PDR | 6960.28 | 35.21 (28.50, 40.70) | 2450.54 (1983.38, 2832.96) |
| Thailand | 69112.64 | 9.71 (7.98, 12.17) | 6708.68 (5514.87, 8411.98) |
| Vietnam | 96421.69 | 2.15 (0.73, 4.40) | 2073.72 (703.46, 4244.85) |
| Total | 188722.01 | 6.57 (5.35, 7.98) | 12389.69 (10099.29, 15060.18) |
-
*Estimates were based on gridded population of 2018 and the median and 95% BCI of the posterior estimated distribution of the infection risk in 2018.
Key resources table
| Reagent type (species) or resource | Designation | Source or reference | Identifiers | Additional information |
|---|---|---|---|---|
| Software, algorithm | R Project for Statistical Computing | R Project for Statistical Computing | RRID:SCR_001905 | |
| Software, algorithm | ArcGIS for Desktop Basic | ArcGIS for Desktop Basic | RRID:SCR_011081 | |
| Software, algorithm | R-INLA Project | R-INLA Project | https://www.r-inla.org/ | |
| Software, algorithm | ‘PStestR’ R Package | ‘PStestR’ R Package | https://github.com/joenomiddlename/PStestR |
Additional files
-
Supplementary file 1
PRISMA 2009 Checklist and GATHER checklist.
Quality assessment: We did quality evaluation for each literature included in the final geostatistical modeling analysis, which is undertaken using a nine-point checklist. The items of quality evaluation are as follows: Q1: provide specific inclusion and exclusion criteria. Q2: provide basic characteristics of the investigated population (gender, age, etc.). Q3: provide prevalence rate of the survey. Q4: provide number of positive patients and number of examined people of the survey. Q5: provide diagnostic method used in the survey. Q6: provide survey type. Q7: provide time of the survey. Q8: describe or discuss the possible bias of the survey or how confounders are controlled. Q9: the literature comes from Science Citation Index Expanded database. Each item is scored 1 in case the publication meets or 0 in contrary. The scores are summed up for all items and assigned to the publication as its quality score. The score for each literature is listed in Figure 2—figure supplement 1—source data 1.
- https://cdn.elifesciences.org/articles/59755/elife-59755-supp1-v2.docx
-
Transparent reporting form
- https://cdn.elifesciences.org/articles/59755/elife-59755-transrepform-v2.docx
Download links
A two-part list of links to download the article, or parts of the article, in various formats.
Downloads (link to download the article as PDF)
Open citations (links to open the citations from this article in various online reference manager services)
Cite this article (links to download the citations from this article in formats compatible with various reference manager tools)
Model-based spatial-temporal mapping of opisthorchiasis in endemic countries of Southeast Asia
eLife 10:e59755.
https://doi.org/10.7554/eLife.59755


