Cross-talk between individual phenol-soluble modulins in Staphylococcus aureus biofilm enables rapid and efficient amyloid formation
- Aarhus University, Department of Biomedicine, Denmark
Figures
Figure 1 with 4 supplements
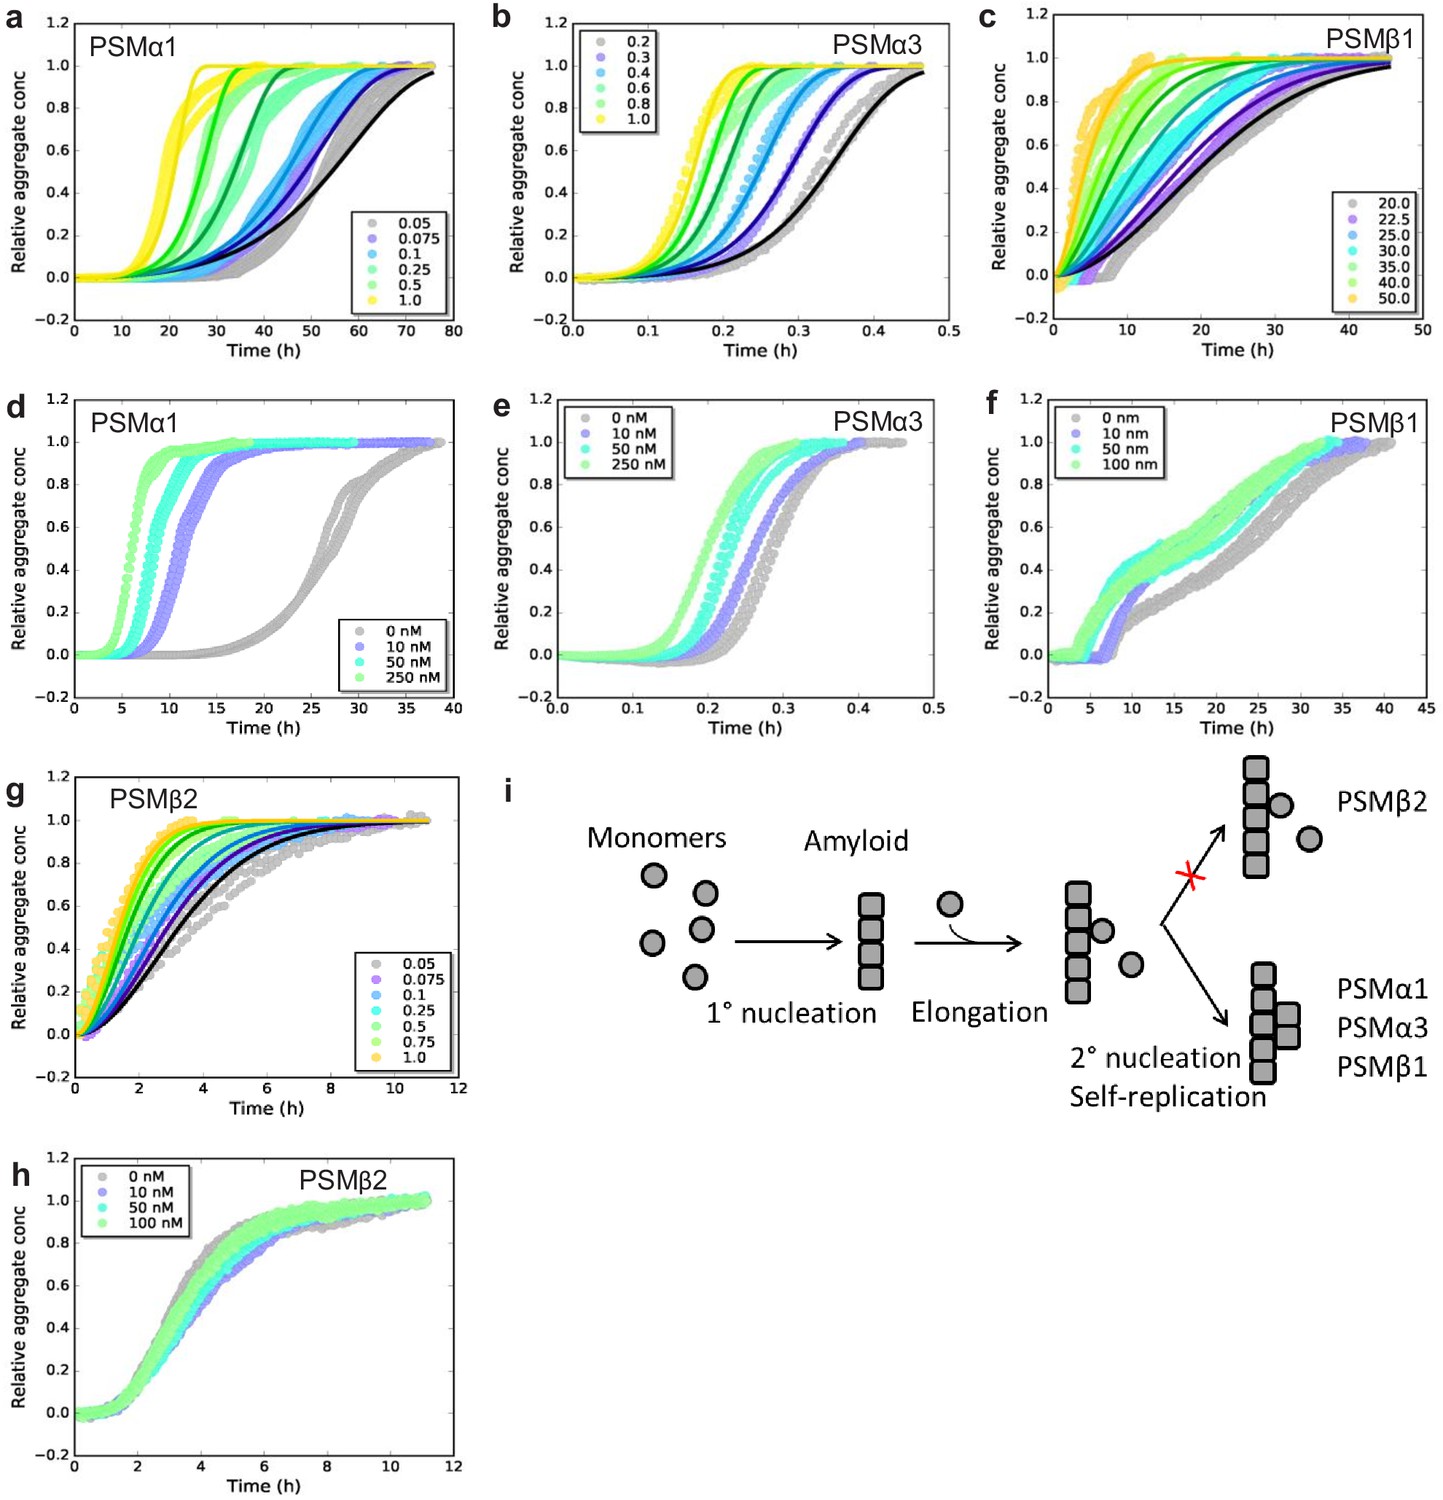
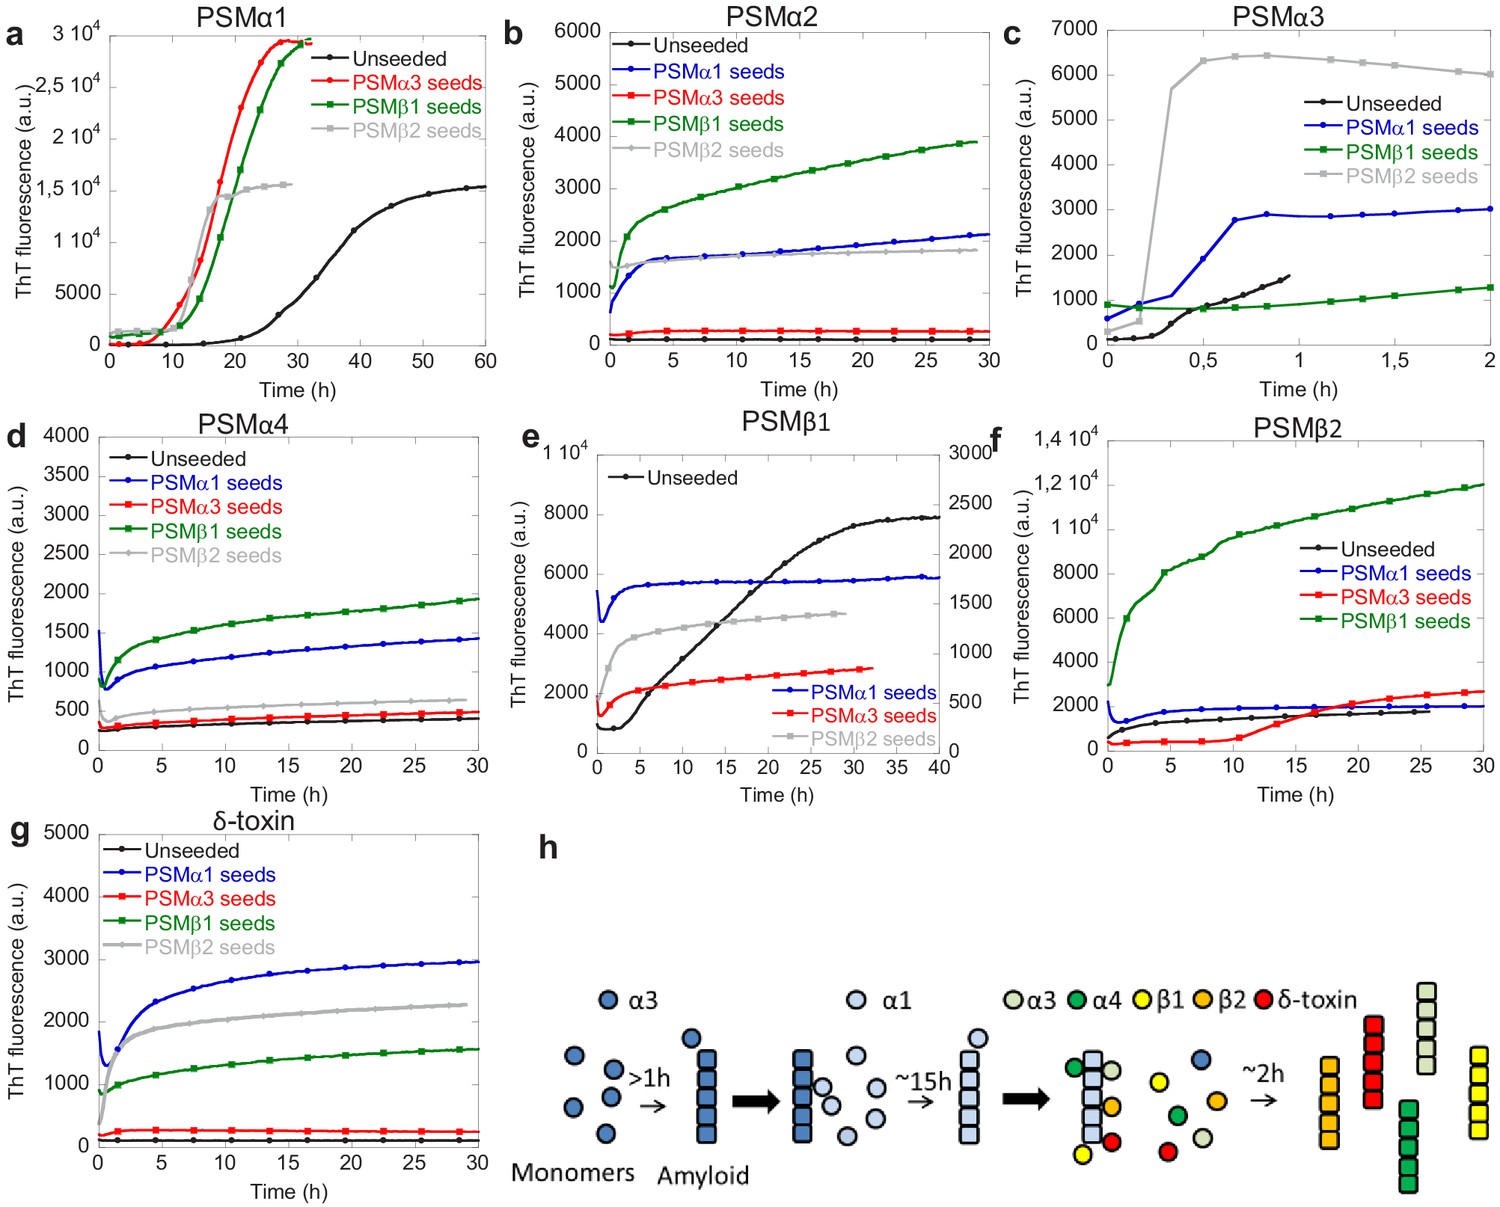
Experimental kinetic data for the aggregation of phenol-soluble modulin (PSMs) peptides from monomeric peptides.
(a) Aggregation of PSMα1 (0.05–1.0 mg/mL) fitted to a secondary nucleation model. (b) Aggregation of PSMα3 (0.2–1.0 mg/mL) fitted to a secondary nucleation model. (c) Aggregation of PSMβ1 (20–50 µg/mL) fitted to a secondary nucleation model. (d) Aggregation of PSMα1 in the presence and absence of low concentrations of preformed seeds (monomers: 0.5 mg/mL, seeds: 0–250 nM). Significant effects on the rate of aggregation were observed. (e) Aggregation of PSMα3 in the presence and absence of low concentrations of preformed seeds (monomers: 0.4 mg/mL, seeds: 0–250 nM). Significant effects on the rate of aggregation were observed. (f) Aggregation of PSMβ1 in the presence and absence of low concentration of preformed seeds (monomers: 0.025 mg/mL, seeds: 0–100 nM). Significant effects on the rate of aggregation were observed. (g) Aggregation of PSMβ2 (0.05–1.0 mg/mL) fitted to a nucleation-elongation model. (h) Aggregation of PSMβ2 in the presence and absence of low concentration of preformed seeds (monomers: 0.05 mg/mL, seeds: 0–100 nM). No significant effects on the rate of aggregation are evident. (i) Schematic illustration of the microscopic steps in PSM aggregation. Monomers of PSMβ2 nucleate through primary nucleation (rate constant: kn) and the aggregates grow by elongation (rate constant: k+). Additionally monomers of PSMα1, PSMα3, and PSMβ1 nucleate through secondary nucleation on the surface of already existing aggregate (rate constant: k2). All kinetic experiments were carried out in triplicates. Parameters from the data fitting are summarized in Table 1.
-
Figure 1—source data 1
Kinetic data for phenol soluble peptide aggregation.
- https://cdn.elifesciences.org/articles/59776/elife-59776-fig1-data1-v2.xlsx
Figure 1—figure supplement 1
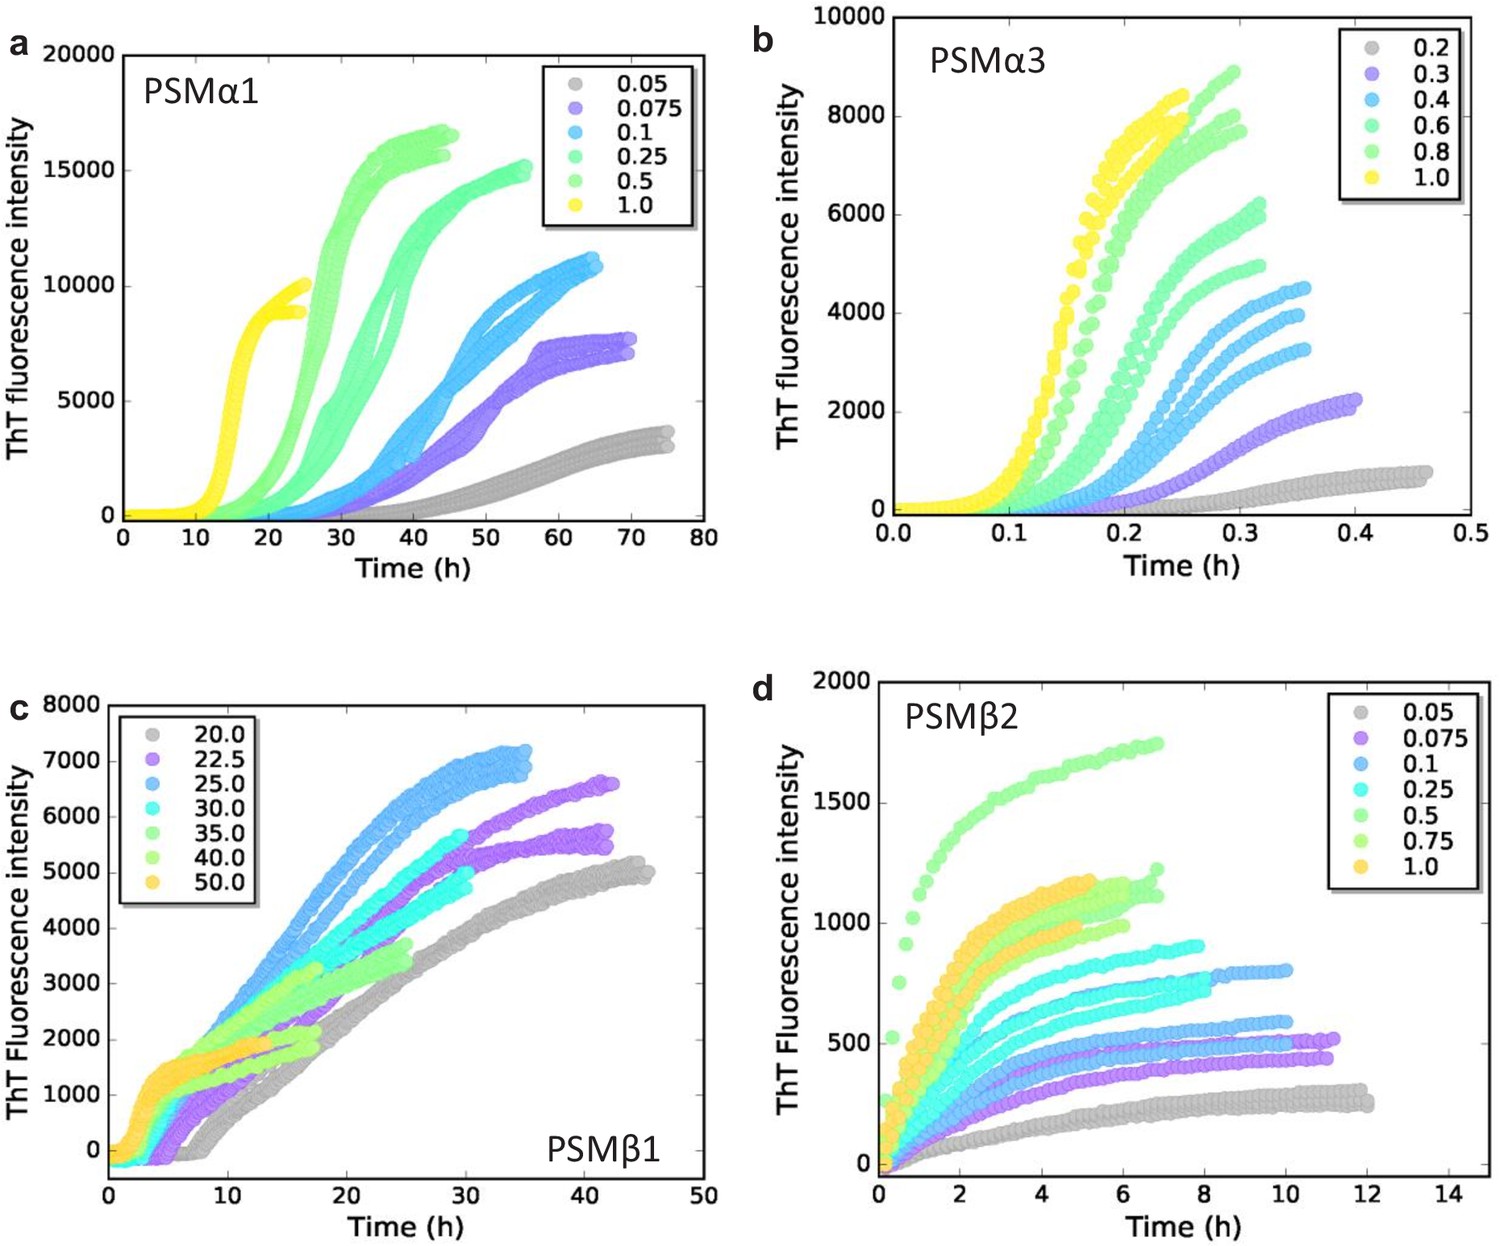
Experimental kinetic raw data.
Raw ThT fluorescence data for the aggregation of the phenol-soluble modulin (PSM) peptides under quiescent conditions at 37°C. (a) Aggregation of PSMα1 (0.05–1.0 mg/mL). (b) Aggregation of PSMα3 (0.2–1.0 mg/mL). (c) Aggregation of PSMβ1 (20–50 µg/mL). (d) Aggregation of PSMβ2 (0.05–1.0 mg/mL).
Figure 1—figure supplement 2
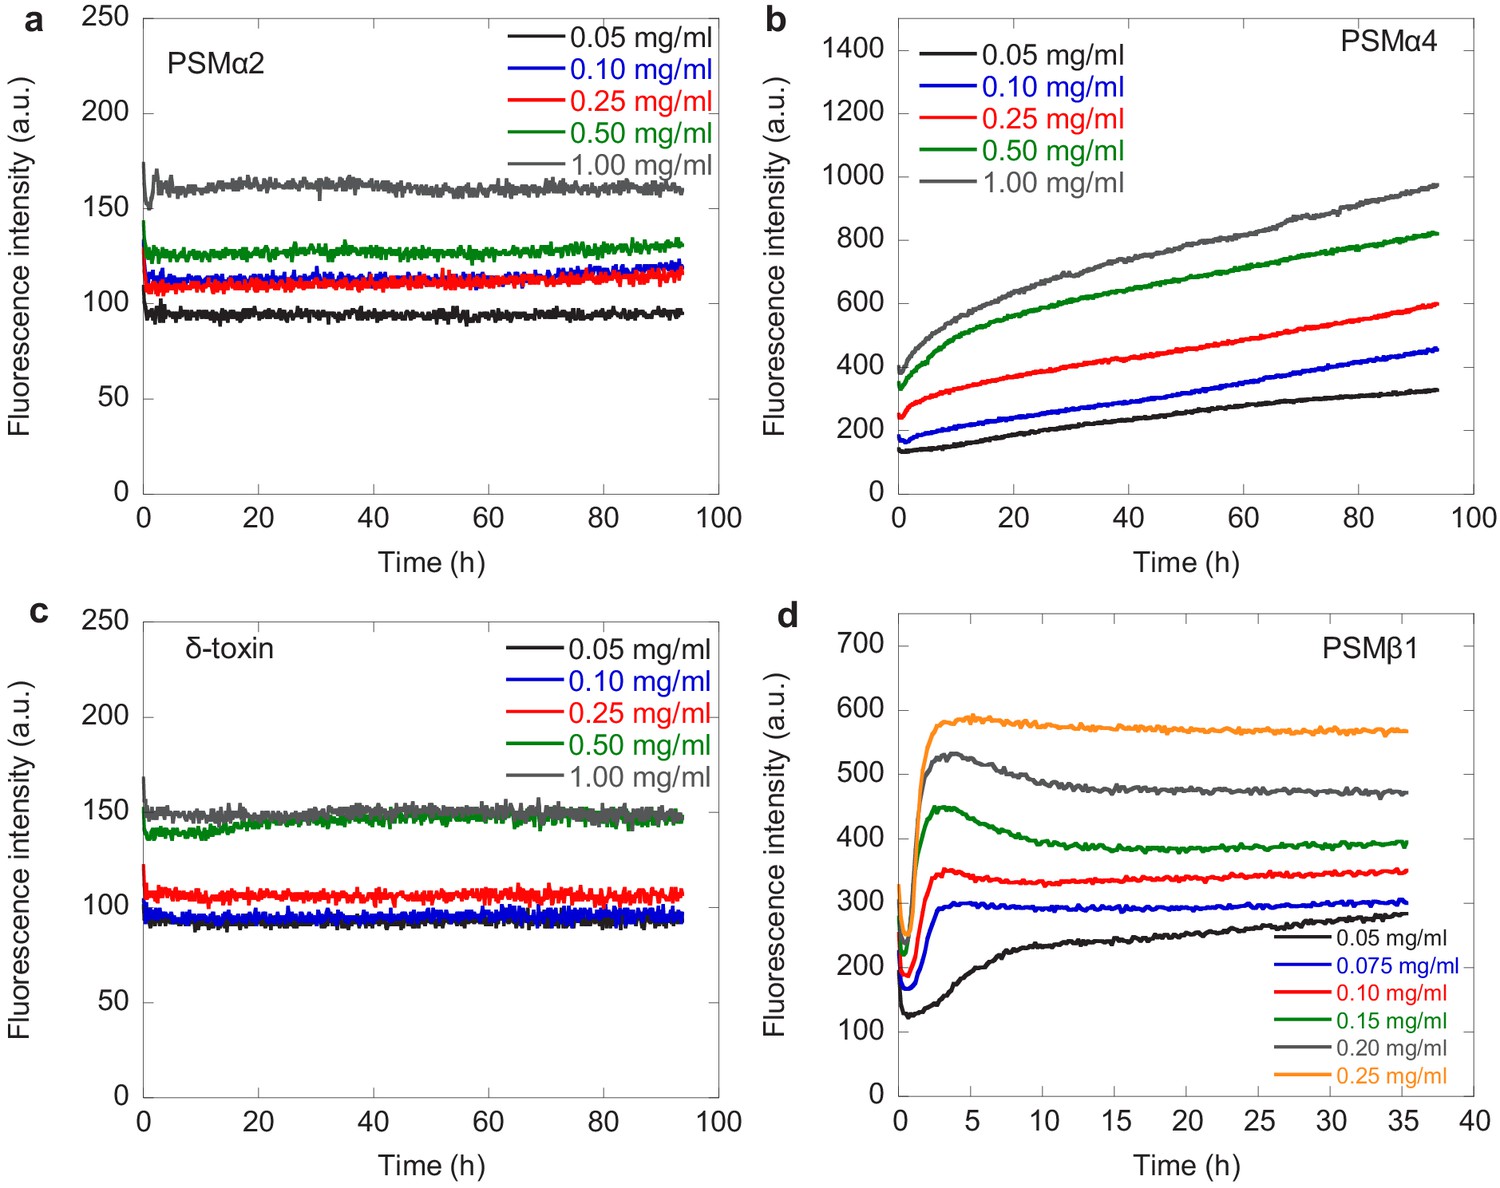
Kinetic data for phenol-soluble modulin (PSM)α2, PSMα4, δ-toxin, and PSMβ1.
Experimental kinetic data for the aggregation of the PSMs peptides under quiescent conditions. Aggregation of PSM peptides (a) PSMα2, (b) PSMα4, (c) δ-toxin, and (d) PSMβ1 from monomeric samples (0.05–0.25 mg/mL) is measured by ThT fluorescence at 37°C every 10 min. Three repeats were carried out at each condition. At higher concentrations of PSMβ1 the lag-time becomes independent of the monomer concentration indicating some sort of saturation effect.
-
Figure 1—figure supplement 2—source data 1
Kinetic data for PSMα2, PSMα4, δ-toxin and high concnetraions og PSMβ1.
- https://cdn.elifesciences.org/articles/59776/elife-59776-fig1-figsupp2-data1-v2.xlsx
Figure 1—figure supplement 3
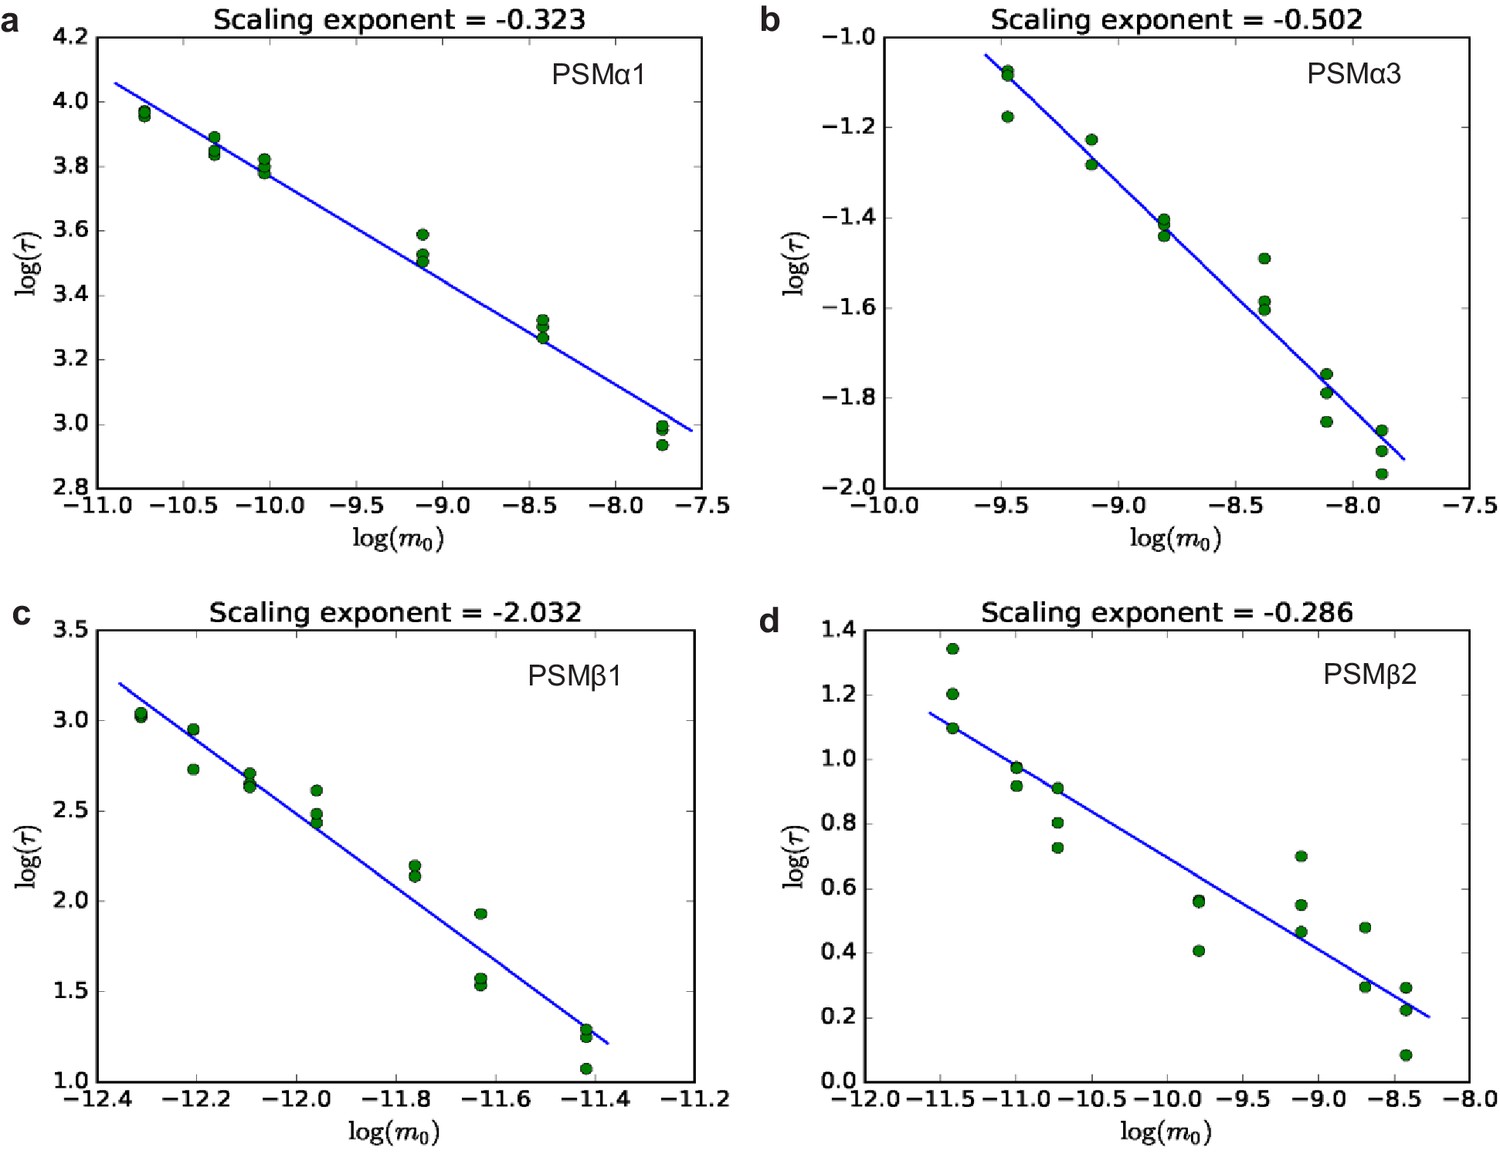
Half-time plots for phenol-soluble modulin (PSM)α1, PSMα3, PSMβ1, and PSMβ2.
The half times of fibril formation as a function of initial monomer concentration on double logarithmic axes. The slope of the fitted line gives the scaling exponent (γ), obtained from three repeats of the aggregation experiments for each peptide. (a) PSMα1, (b) PSMα3, (c) PSMβ1, and (d) PSMβ2. The straight line in all four plots indicates that the dominant mechanism of fibril multiplication is the same for all monomer concentrations for the individual peptides studied here.
-
Figure 1—figure supplement 3—source data 1
Source data for half-time plots.
- https://cdn.elifesciences.org/articles/59776/elife-59776-fig1-figsupp3-data1-v2.xlsx
Figure 1—figure supplement 4
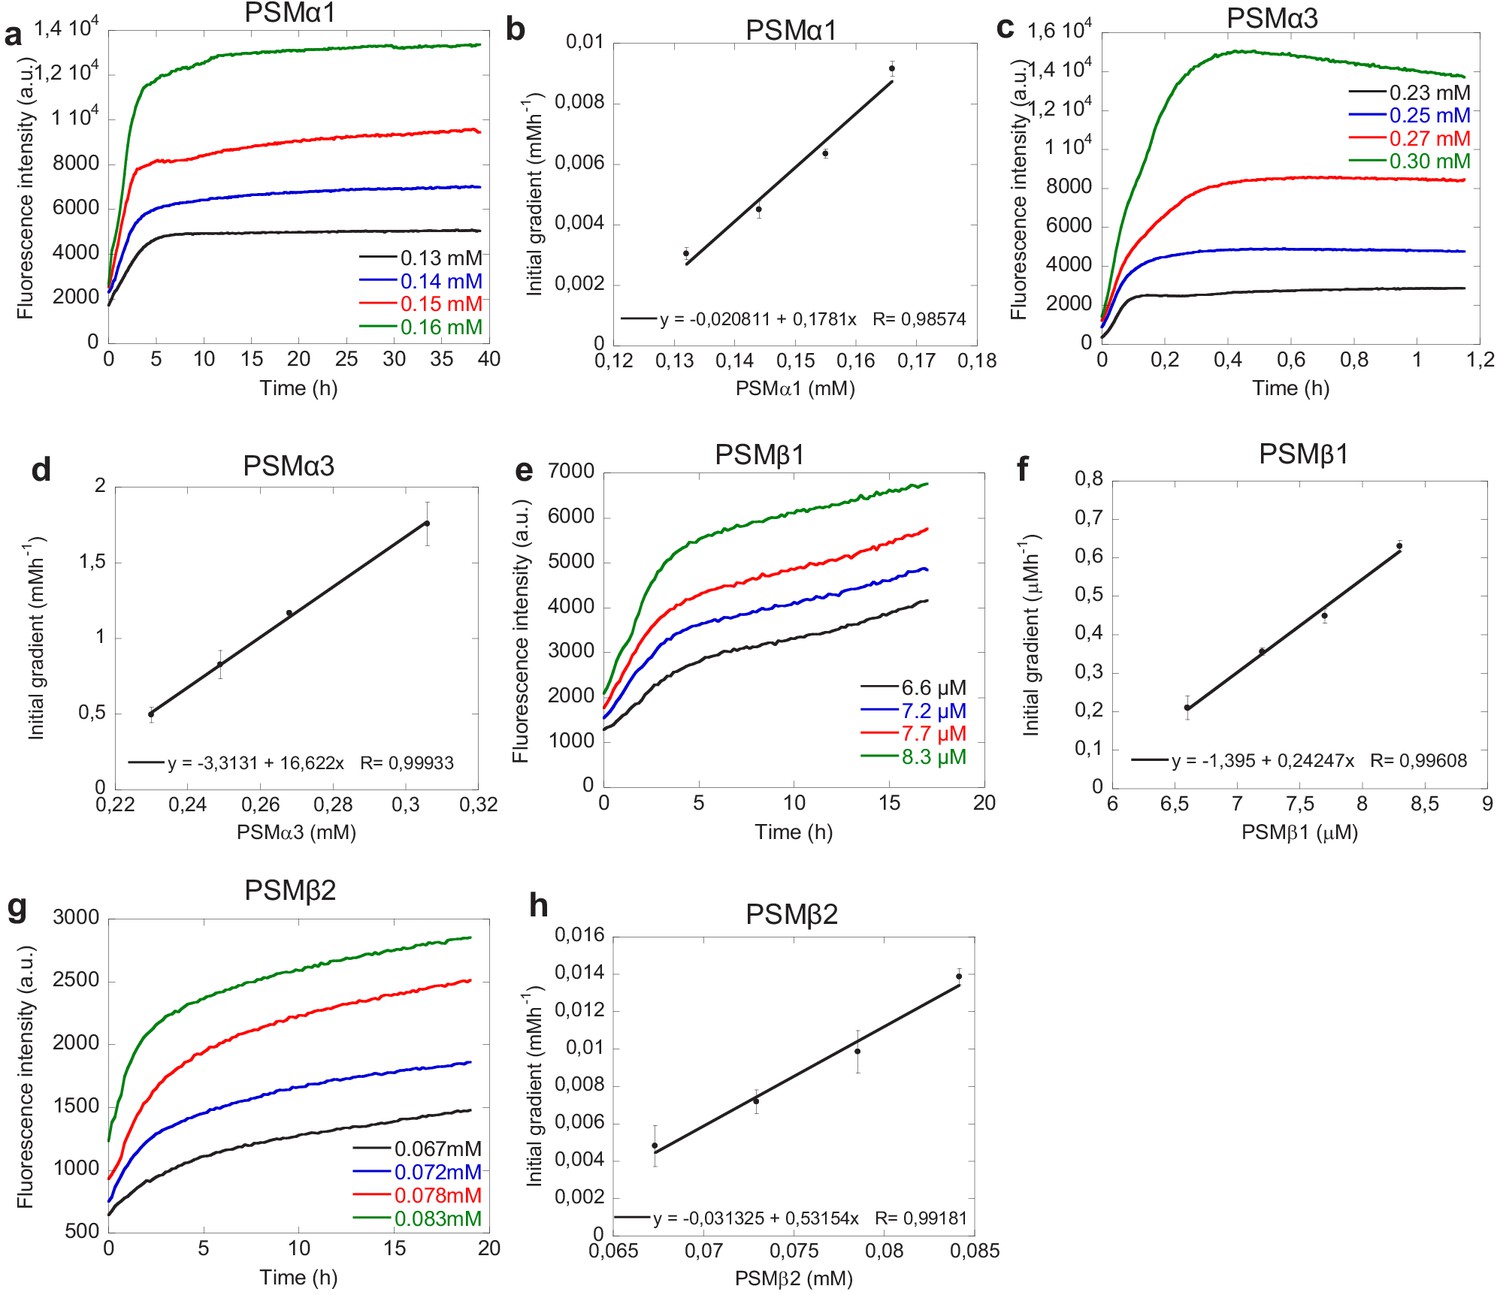
Seeding with high amounts of seeds.
Seeding of phenol-soluble modulin (PSM) peptides with 20–50% preformed fibrils seeds (in monomeric equivalents) at different monomeric concentration. (a) Changes in ThT fluorescence when monomeric PSMα1 at fixed concentration (0.25 mg/mL) was incubated in the presence of high concentrations of preformed fibrils from the PSMα1 under quiescent conditions at 37°C. (b) Initial gradient of the ThT fluorescence curves of PSMα1 used to estimate the elongation rates. The initial gradient (first 120 min) is plotted against the free monomer concentration. A straight line was fitted to these points, with the slope proportional to the number of seed fibrils and the elongation rate constant. (c) Changes in ThT fluorescence when monomeric PSMα3 at fixed concentration (0.5 mg/mL) was incubated in the presence of high concentrations of preformed fibrils from the PSMα3 under quiescent conditions at 37°C. (d) Initial gradient of the ThT fluorescence curves of PSMα3 used to estimate the elongation rates. The initial gradient (first 2 min) is plotted against the free monomer concentration. A straight line was fitted to these points, with the slope proportional to the number of seed fibrils and the elongation rate constant. (e) Changes in ThT fluorescence when monomeric PSMβ1 at fixed concentration (0.025 mg/mL) was incubated in the presence of high concentrations of preformed fibrils from the PSMβ1 under quiescent conditions at 37°C. (f) Initial gradient of the ThT fluorescence curves of PSMβ1 used to estimate the elongation rates. The initial gradient (first 120 min) is plotted against the free monomer concentration. A straight line was fitted to these points, with the slope proportional to the number of seed fibrils and the elongation rate constant. (g) Changes in ThT fluorescence when monomeric PSMβ2 at fixed concentration (0.25 mg/mL) was incubated in the presence of high concentrations of preformed fibrils and the PSMβ2 under quiescent conditions at 37°C. (h) Initial gradient of the ThT fluorescence curves of PSMβ2 used to estimate the elongation rates. The initial gradient (first 120 min) is plotted against the free monomer concentration. A straight line was fitted to these points, with the slope proportional to the number of seed fibrils and the elongation rate constant.
-
Figure 1—figure supplement 4—source data 1
Seeding with high amounts of seeds for determination of elongation rates.
- https://cdn.elifesciences.org/articles/59776/elife-59776-fig1-figsupp4-data1-v2.xlsx
Figure 2 with 2 supplements
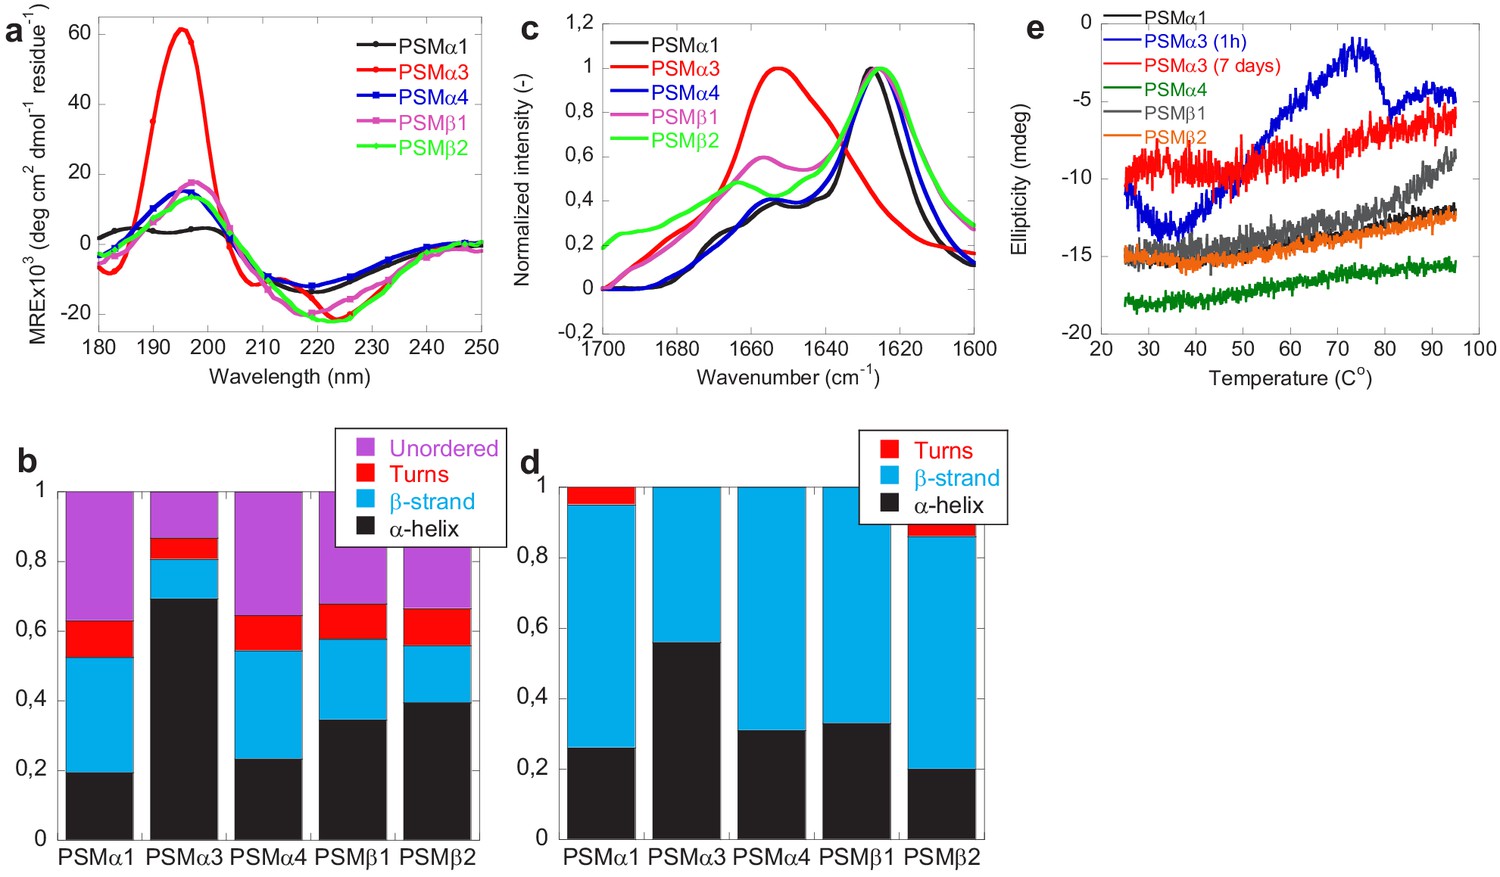
Structural comparison of fibrils formed by different phenol-soluble modulins (PSMs) variants.
(a) Synchrotron radiation (SR) far UV-CD spectra of PSMα1, PSMα3, PSMα4, PSMβ1, and PSMβ2 fibrils recorded after 7 days of incubated samples except for PSMα3 which is recorded after 1 hr of incubated samples. (b) Deconvolution of the SRCD spectra of fibrils of PSM variants into the individual structural components. (c) Fourier transform infrared (FTIR) spectroscopy of the amide I’ region (1600–1700 cm−1) of fibrils of PSMs variants. PSMα1, PSMα4, PSMβ1, and PSMβ2 show a peak at 1625 cm−1 corresponding to rigid amyloid fibrils. In contrast, PSMα3 shows a peak at and 1654 cm−1indicating α-helical structure in the fibrils. (d) Deconvolution of the FTIR spectra of fibrils of the PSM variants into the individual structural components. (e) CD (Jasco) thermal scans from 20°C to 95°C of PSMα1, PSMα3 (1 hr), PSMα3 (7 days), PSMα4, PSMβ1, and PSMβ2 fibrils.
-
Figure 2—source data 1
Source data for secondary structural analysis of phenol solube modulin aggregates.
- https://cdn.elifesciences.org/articles/59776/elife-59776-fig2-data1-v2.xlsx
Figure 2—figure supplement 1
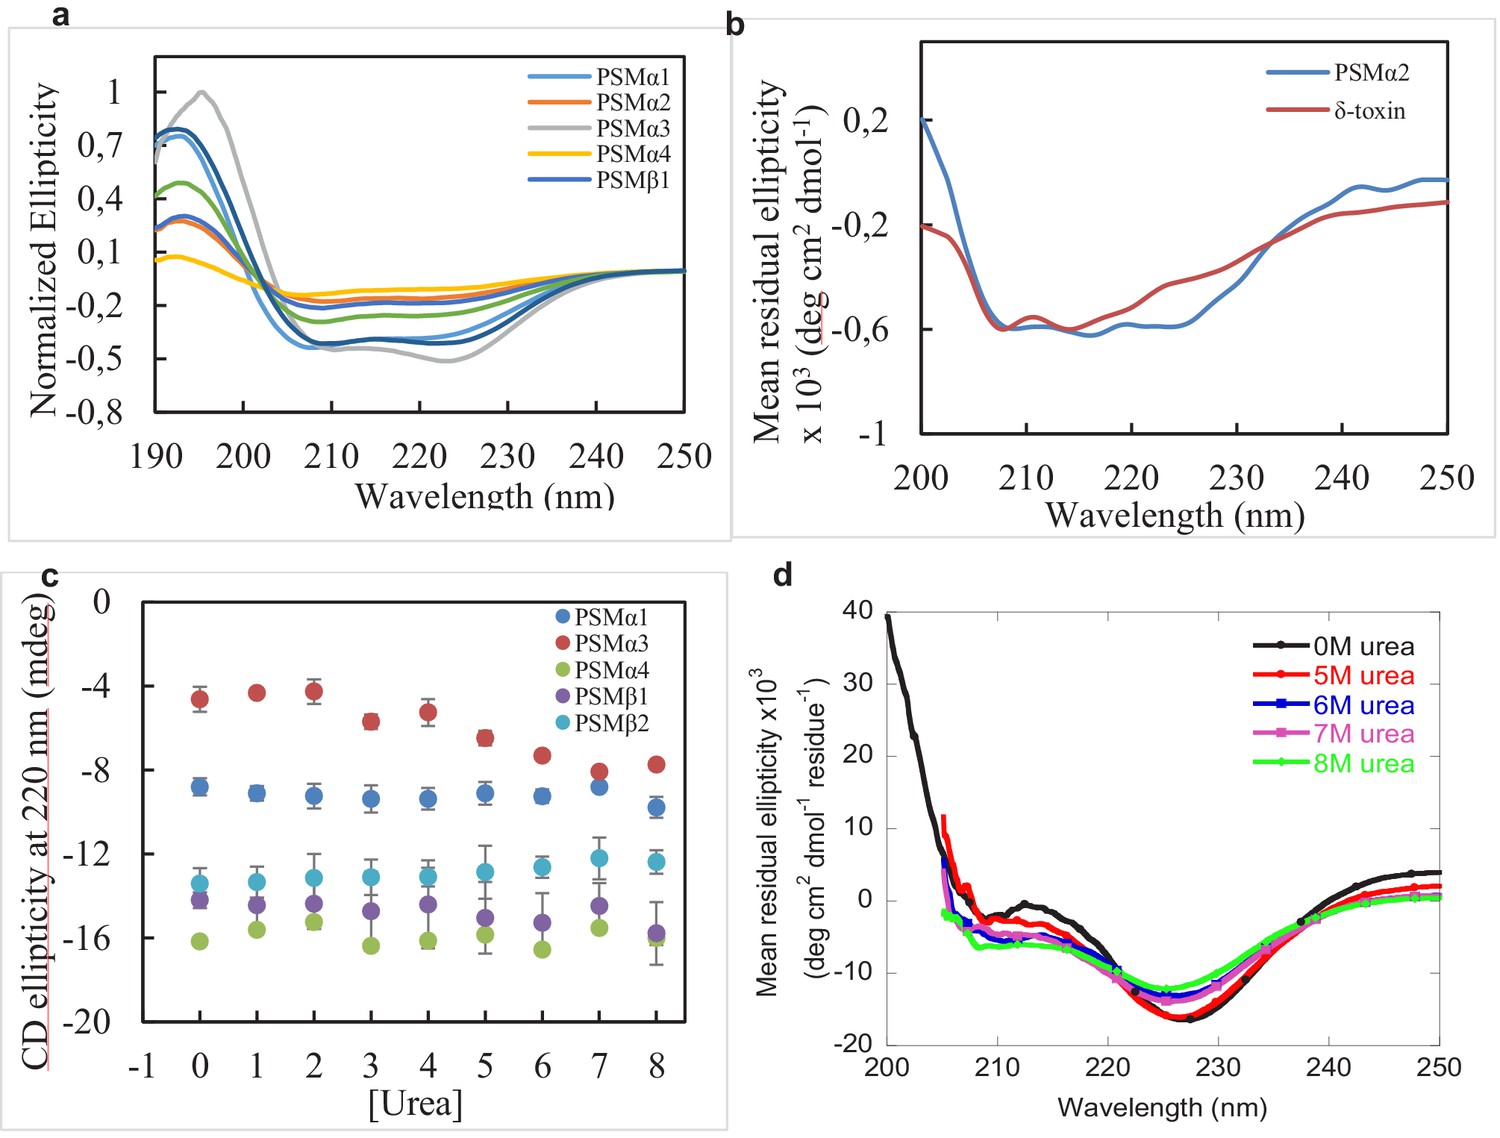
CD spectra of monomeric phenol-soluble modulin (PSM) peptides and urea denaturation of PSM fibrils.
CD spectra (Jasco) of monomeric PSM peptides and of PSM peptides that do not aggregate. (a) CD spectra of monomeric PSMs peptides (0.25 mg/mL) measured at 25°C followed by 0 hr of incubation period. (b) Far UV-CD spectra of PSMα2 and δ-toxin after 7 days of incubation at 37°C display α-helical character consistent with the lack of aggregation. (c) Analysis of the dissociation of PSMs fibrils collected from plate reader experiments after incubation in the presence of various concentrations of urea (0–8M). (d) Far UV-CD (Jasco) spectra of PSMα3 fibrils (1 hr) after incubation in the absence and presence of high concentrations of urea (0 and 5–8 M urea).
-
Figure 2—figure supplement 1—source data 1
Source data for CD spectra of monomeric phenol-soluble modulin (PSM) peptides and urea denaturation of PSM fibrils.
- https://cdn.elifesciences.org/articles/59776/elife-59776-fig2-figsupp1-data1-v2.xlsx
Figure 2—figure supplement 2

Deconvolution of Fourier transform infrared (FTIR) spectra.
FTIR analysis of the secondary structure of phenol-soluble modulin (PSM) peptides. The data were processed by baseline correction and interfering signals from H2O and CO2 were removed using the atmospheric compensation filter. Further, peak positions were assigned where the second order derivative had local minima and the intensity was modeled by Gaussian curve fitting using the OPUS 5.5 software. (a) FTIR spectra and second order derivative of the spectra of PSMα1 at 0.5 mg/mL. (b) FTIR spectra and second order derivative of the spectra of PSMα3 at 0.5 mg/mL. (c) FTIR spectra and second order derivative of the spectra of PSMα4 at 0.5 mg/mL. (d) FTIR spectra and second order derivative of the spectra of PSMβ1 at 0.025 mg/mL. (e) FTIR spectra and second order derivative of the spectra of PSMβ2 at 0.25 mg/mL.
-
Figure 2—figure supplement 2—source data 1
Source data for the deconvolution of FTIR spectra.
- https://cdn.elifesciences.org/articles/59776/elife-59776-fig2-figsupp2-data1-v2.xlsx
Figure 3 with 1 supplement
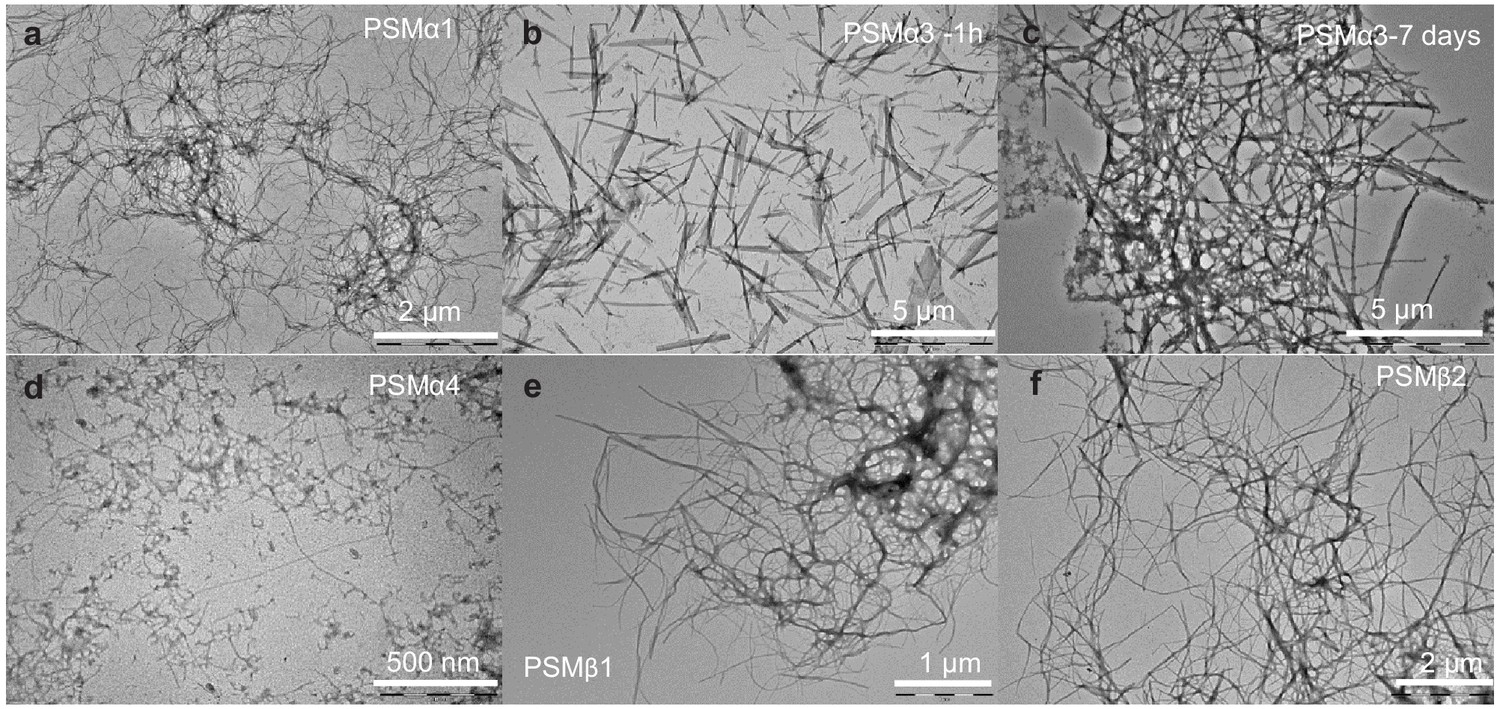
Morphology of aggregates of phenol-soluble modulin (PSMs) peptides.
Transmission electron microscopic image of the end state of reaction for samples initially composed of (a) PSMα1 fibrils, (b) PSMα3 fibrils after 1 hr of incubation, (c) PSMα3 fibrils after 7 days of incubation, (d) PSMα4 fibrils, (e) PSMβ1 fibrils, and (f) PSMβ2 fibrils. Please note that scale bar changes.
Figure 3—figure supplement 1
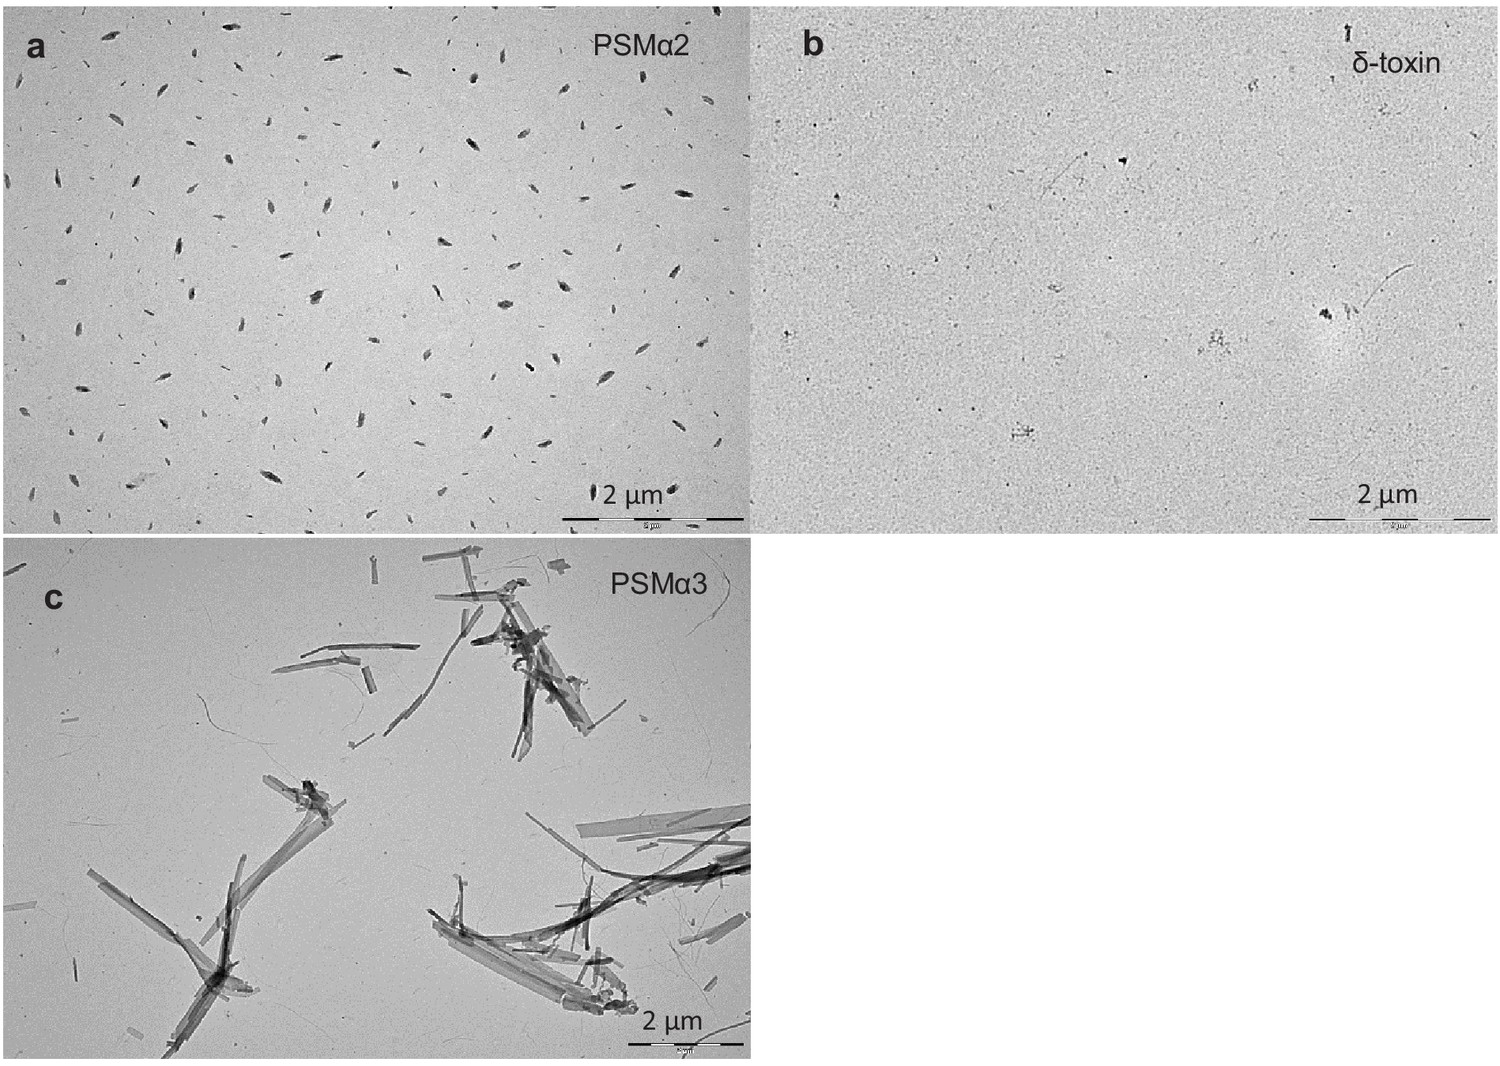
Morphology of phenol-soluble modulins (PSMs) peptides.
Transmission electron microscopic image of the end state of reaction for samples initially composed of (a) PSMα2 monomers, (b) δ-toxin monomers, and (c) PSMα3 after 2 days of incubation.
Figure 4 with 2 supplements
Cross-seeding phenol-soluble modulins (PSMs) variant.
(a) Aggregation of PSMα1 (0.25 mg/mL) in the absence of seeds and in the presence of 20% (20 µM) preformed PSMα3 seeds, PSMβ1 seeds, and PSMβ2 seeds. (b) Aggregation of PSMα2 (0.25 mg/mL) in the absence of seeds and in the presence of 20% (20 µM) preformed PSMα1 seeds, PSMα3 seeds, PSMβ1 seeds, and PSMβ2 seeds. (c) Aggregation of PSMα3 (0.25 mg/mL) in the absence of seeds and in the presence of 20% (20 µM) preformed PSMα1 seeds, PSMβ1 seeds, and PSMβ2 seeds. (d) Aggregation of PSMα4 (0.25 mg/mL) in the absence of seeds and in the presence of 20% (20 µM) preformed PSMα1 seeds, PSMα3 seeds, PSMβ1 seeds, and PSMβ2 seeds. (e) Aggregation of PSMβ1 (0.025 mg/mL) in the absence of seeds and in the presence of 20% (1 µM) preformed PSMα1 seeds, PSMα3 seeds, and PSMβ2 seeds. (f) Aggregation of PSMβ2 (0.25 mg/mL) in the absence of seeds and in the presence of 20% (10 µM) preformed PSMα1 seeds, PSMα3 seeds, and PSMβ1 seeds. (g) Aggregation of δ-toxin (0.25 mg/mL) in the absence of seeds and in the presence of 20% (20 µM) preformed PSMα1 seeds, PSMα3 seeds, PSMβ1 seeds, and PSMβ2 seeds. (h) Schematic representation of the cross-seeding interactions between the PSM variants during biofilm formation.
-
Figure 4—source data 1
Source data for the cross-seedding of phenol solube modulins.
- https://cdn.elifesciences.org/articles/59776/elife-59776-fig4-data1-v2.xlsx
Figure 4—figure supplement 1
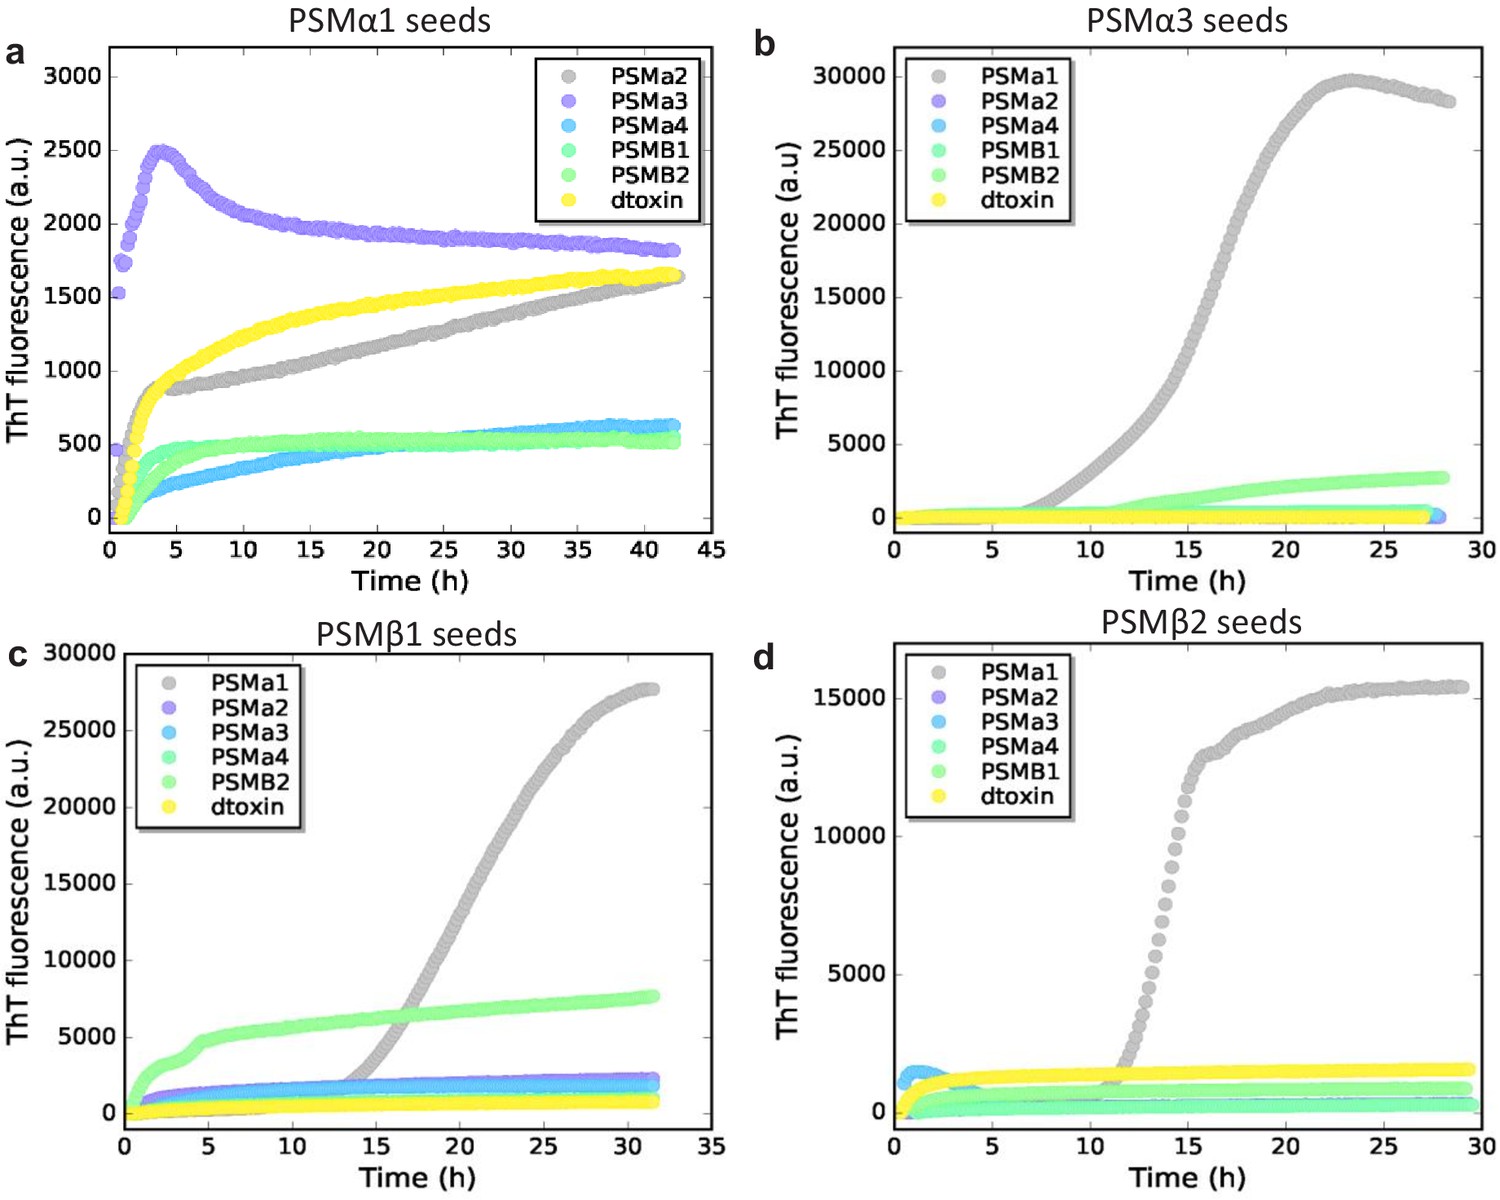
Cross-seeding of phenol-soluble modulin (PSM) peptides based on seed type.
(a) Aggregation of PSMα2, PSMα3, PSMα4, PSMβ1, PSMβ2, and δ-toxin (0.25 mg/mL) in the presence of 20% preformed PSMα1 seeds. (b) Aggregation of PSMα1, PSMα2, PSMα4, PSMβ1, PSMβ2, and δ-toxin (0.25 mg/mL) in the presence of 20% preformed PSMα3 seeds. (c) Aggregation of PSMα1, PSMα2, PSMα3, PSMα4, PSMβ2, and δ-toxin (0.25 mg/mL) in the presence of 20% preformed PSMβ1 seeds. (d) Aggregation of PSMα1, PSMα2, PSMα3, PSMα4, PSMβ1, and δ-toxin (0.25 mg/mL) in the presence of 20% preformed PSMβ2 seeds.
-
Figure 4—figure supplement 1—source data 1
Source data for cross-seeding of phenol soluble modulins.
- https://cdn.elifesciences.org/articles/59776/elife-59776-fig4-figsupp1-data1-v2.xlsx
Figure 4—figure supplement 2
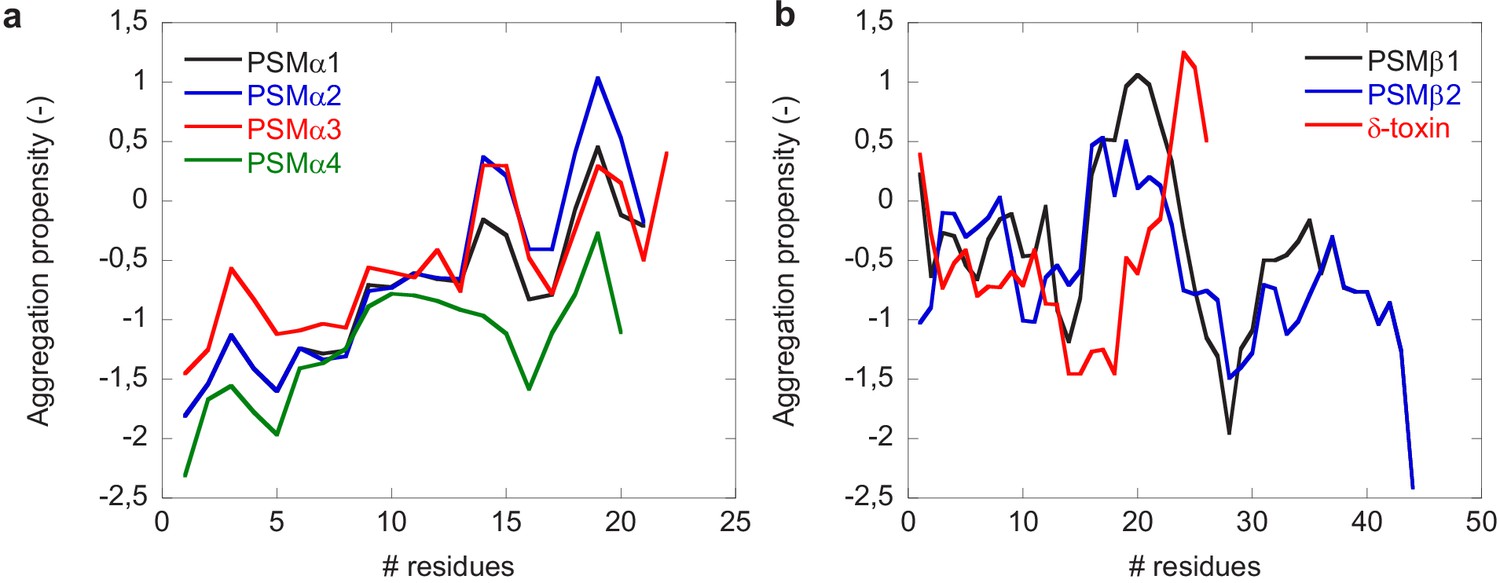
Aggregation propensity profiles of phenol-soluble modulin (PSM) peptides using CamSol.
(a) Aggregation propensities of PSMα group of peptides (PSMα1, PSMα2, PSMα3, and PSMα4). (b) Aggregation propensity of PSMβ group of peptides (PSMβ1 and PSMβ2) along with δ-toxin.
-
Figure 4—figure supplement 2—source data 1
Source data for aggregation propensities of phenol soluble modulins.
- https://cdn.elifesciences.org/articles/59776/elife-59776-fig4-figsupp2-data1-v2.xlsx
Tables
Table 1
Kinetic parameters obtained from fitting of data in Figure 1 using the web server AmyloFit.
nc and n2 are the reaction order of the primary and secondary nucleation process respectively, kn and k2 are rate constants for the primary and secondary nucleation process, and k+ is the rate constant for the elongation of existing fibrils.
| Parameters | PSMα1 | PSMα3 | PSMβ1 | PSMβ2 |
|---|---|---|---|---|
| Dominating mechanism | Secondary nucleation | Secondary nucleation | Secondary nucleation | Nucleation- elongation |
| Mean squared residual error (MRE) | 3.11 × 10⁻³ | 1.38 × 10⁻³ | 3.33 × 10⁻³ | 4.75 × 10⁻³ |
| k+kn (M−nch−2) | 6.98 × 10⁻⁵ | 275 | 1.86 × 10¹⁸ | 48.8 |
| nc (−) | 7.84 × 10⁻⁶ | 0.6 | 3.92 | 0.572 |
| k+k2 (M−nch−2) | 129 | 5.17 × 10⁶ | 4.23 × 10³ | – |
| n2 (−) | 1.66 × 10⁻³ | 0.123 | 0.2 | – |
Table 2
PSM peptide sequences.
The peptide sequence of the seven different PSMs from S. aureus.
| PSMα1 | MGIIAGIIKVIKSLIEQFTGK |
|---|---|
| PSMα2 | MGIIAGIIKFIKGLIEKFTGK |
| PSMα3 | MEFVAKLFKFFKDLLGKFLGNN |
| PSMα4 | MAIVGTIIKIIKAIIDIFAK |
| PSMβ1 | MEGLFNAIKDTVTAAINNDGAKLGTSIVSIVENGVGLLGKLFGF |
| PSMβ2 | MTGLAEAIANTVQAAQQHDSVKLGTSIVDIVANGVGLLGKLFGF |
| δ-toxin | MAQDIISTIG DLVKWIIDTVNKFTKK |
Table 3
Structural contribution to FTIR spectra.
Percentage contribution of various structural components for the fibrils of PSM variants based on deconvolution of FTIR spectra along with peak position.
| Peptide | Peak position | % β-sheet | % α-helix | % β turns |
|---|---|---|---|---|
| PSMα1 | 1626, 1653,1667 | 68.58 | 26.32 | 9.10 |
| PSMα3 | 1635, 1654 | 43.94 | 56.06 | - |
| PSMα4 | 1625, 1655 | 69.12 | 30.88 | - |
| PSMβ1 | 1625, 1656 | 66.80 | 33.2 | - |
| PSMβ2 | 1624,1644, 1664 | 66.22 | 20.05 | 13.73 |
Table 4
Structural contribution from deconvolution of CD spectra.
Percentage contribution of various structural components for the fibrils of PSMphenol-soluble modulin variants based on deconvolution of SRCD spectra using the DichroWeb server using the reference data setSP175 for the Selecon3, Contin, and CDSSTR analysis programs.
| Peptide | % α-helix | % β-sheet | % Turns | % Unordered |
|---|---|---|---|---|
| PSMα1 | 16.1 | 33.1 | 10.5 | 38.5 |
| PSMα3 | 69.3 | 11.3 | 6.1 | 13.2 |
| PSMα4 | 23.4 | 31.0 | 10.1 | 35.4 |
| PSMβ1 | 34.5 | 23.8 | 10.1 | 33.0 |
| PSMβ2 | 39.5 | 16.4 | 10.6 | 34.7 |
Table 5
Solubility score of phenol-soluble modulin peptides.
Solubility score of different peptides calculated using the Camsol web server (http://www-mvsoftware.ch.cam.ac.uk/index.php/login).
| Peptide Name | Solubility Score |
|---|---|
| PSMα1 | 0.826149 |
| PSMα2 | 0.883944 |
| PSMα3 | 1.282062 |
| PSMα4 | 0.022660 |
| PSMβ1 | 1.038055 |
| PSMβ2 | 0.907007 |
| δ-toxin | 1.242128 |
Key resources table
| Reagent type (species) or resource | Designation | Source or reference | Identifiers | Additional information |
|---|---|---|---|---|
| Peptide, recombinant protein | PSMα1 | GenScript Biotech, TheNetherlands | Formylation (N-terminal) | |
| Peptide, recombinant protein | PSMα2 | GenScript Biotech, TheNetherlands | Formylation (N-terminal) | |
| Peptide, recombinant protein | PSMα3 | GenScript Biotech, TheNetherlands | Formylation (N-terminal) | |
| Peptide, recombinant protein | PSMα4 | GenScript Biotech, TheNetherlands | Formylation (N-terminal) | |
| Peptide, recombinant protein | PSMβ1 | GenScript Biotech, TheNetherlands | Formylation (N-terminal) | |
| Peptide, recombinant protein | PSMβ1 | GenScript Biotech, TheNetherlands | Formylation (N-terminal) | |
| Peptide, recombinant protein | δ-toxin | GenScript Biotech, TheNetherlands | Formylation (N-terminal) | |
| Chemical compound, drug | 2,2,2-Trifluoro-acetic acid | Sigma Aldrich | Sigma T6508 | |
| Chemical compound, drug | Thioflavin T | Sigma Aldrich | Sigma T3516 | |
| Chemical compound, drug | 1,1,1,3,3,3-Hexafluoro-2-propanol | Sigma Aldrich | Aldrich-105228 | |
| Chemical compound, drug | DMSO | Merck | CAS# 67-68-5 | |
| Software, algorithm | Amylofit | https://www.amylofit.ch. cam.ac.uk/ | ||
| Software, algorithm | Dichroweb | http://dichroweb.cryst.bbk.ac.uk/html/home.shtml | RRID:SCR_018125 | |
| Software, algorithm | CamSol | http://www-vendruscolo.ch.cam.ac.uk/.uk/camsolmethod. | ||
| Software, algorithm | OPUS 5.5 | Bruker | ||
| Other | 96-well plate, half area, polystyrene, non-binding surface | Corning | Product number 3881 |
Additional files
Download links
A two-part list of links to download the article, or parts of the article, in various formats.
Downloads (link to download the article as PDF)
Open citations (links to open the citations from this article in various online reference manager services)
Cite this article (links to download the citations from this article in formats compatible with various reference manager tools)
Cross-talk between individual phenol-soluble modulins in Staphylococcus aureus biofilm enables rapid and efficient amyloid formation
eLife 9:e59776.
https://doi.org/10.7554/eLife.59776


