DMT alters cortical travelling waves
- Cerco, CNRS Université de Toulouse, France
- Computational, Cognitive and Clinical Neuroscience Laboratory (C3NL), Faculty of Medicine, Imperial College, United Kingdom
- Centre for Psychedelic Research, Division of Psychiatry, Department of Brain Sciences, Imperial College London, United Kingdom
- Artificial and Natural Intelligence Toulouse Institute (ANITI), France
Figures
Figure 1
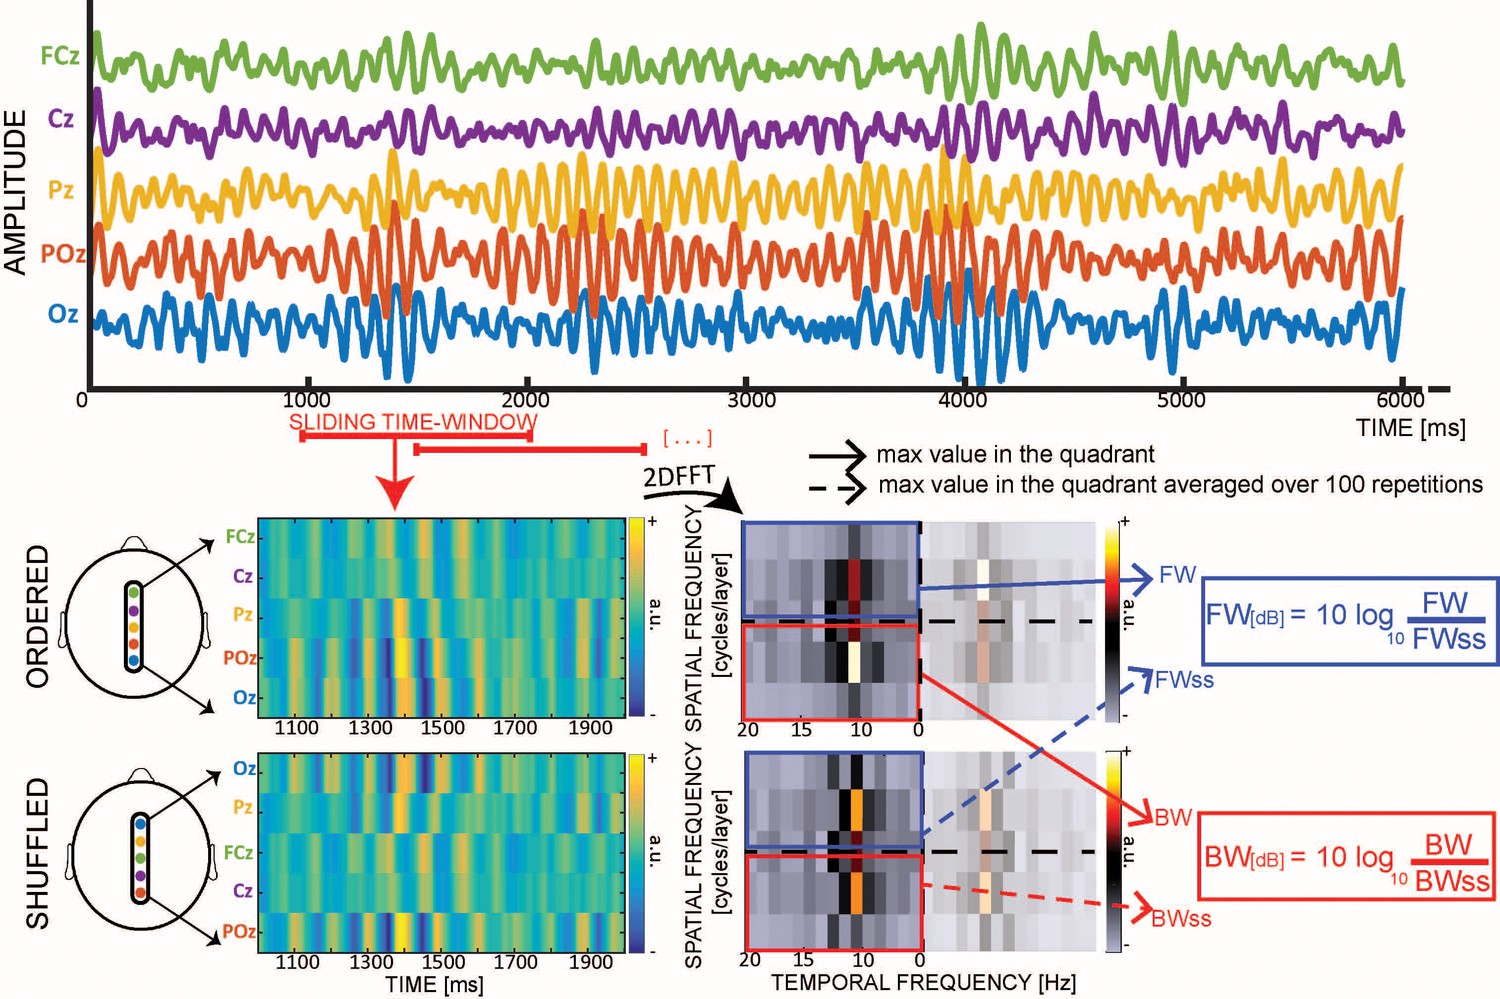
Quantifying cortical waves.
From each 1 s EEG epoch we extract a 2D-map, obtained by stacking signals from five midline electrodes. For each map we compute a 2D-FFT in which the maximum values in the upper- and lower-left quadrants represent respectively the amount of forward (FW – in blue) and backward (BW – in red) waves. For each map, we also compute surrogate values by shuffling the electrodes’ order 100 times, so as to retain temporal fluctuations while disrupting the spatial structure of the signals (including any travelling waves). Eventually, we compute the wave strength in decibel (dB) by combining the real and the surrogate values.
Figure 2 with 2 supplements

DMT influences cortical travelling waves.
(A) In the left panels the net amount of FW (blue, upper panel) and BW (red, lower panel) waves is represented pre- and post-DMT infusion. While BW waves are always present, FW waves only rise significantly above zero after DMT injection, despite participants having closed eyes. Asterisks denote values significantly different than zero, or between conditions. The panels to the right describe the minute-by-minute changes in the net amount of waves. Asterisks denote FDR-corrected p-values for amount of waves significantly different than zero. (B) Comparison between the waves’ temporal evolution after DMT injection (left panel) and with or without visual stimulation (right panel, from a different experiment in which participants, with open eyes, either watched a visual stimulus or a blank screen Pang et al., 2020). Remarkably, the waves’ temporal profiles are very similar in the two conditions, for both FW and BW. (C) Comparison between changes in absolute power (as extracted from the 2D-FFT, that is FW and BW in Figure 1) due to DMT, placebo and visual stimulation. Remarkably, true photic visual stimulation and eyes-closed DMT induce comparably large reductions in absolute power. In fact, the effect with DMT appears to be even more pronounced (formal contrast not appropriate). Note that in the previous panels the changes in the net amount of waves were reported in dB, and occurred irrespective of the global power changes measured in panel C.
Figure 2—figure supplement 1

Changes in the amount of FW/BW waves as a function of dosage.
Each line represents a different subject, whereas mean ± standard deviations are represented for each dosage, pre/post infusion for BW (red) and FW (blue) waves. Irrespective of the dosage, the amount of BW waves decreased after DMT infusion, whereas FW waves increased consistently for each subject.
Figure 2—figure supplement 2

FW and BW waves’ direction along different axes.
The difference in the pre-post DMT infusion observed along the sagittal line of electrodes (i.e. the one chosen for the first analysis, as reported in Figure 2A of the manuscript) is replicated considering another series of electrodes running from occipital to frontal regions between hemisphere, specifically from electrode P4 to F3 in the FW direction (diag1, Bayesian t-test BF = 4.059, error = 0.002%), and from P3 to F4 (diag2, Bayesian t-test BF = 4.848, error = 0.0001%). Interestingly, DMT induces a similar increase in FW waves, but less of a decrease in the BW direction (diag1 BW: BF = 1.948, error = 0.006%; diag1 BW: BF = 1.567, error = 0.002%). We also investigated a coronal line of electrodes, revealing waves travelling in a leftward and rightward direction above chance level (i.e. larger than 0 dB), but in-line with our hypothesis this pattern was not altered by DMT infusion (for both leftward and rightward waves BF <0.4, error ~0.02%). The bottom panel shows changes in absolute power (as extracted from the 2D-FFT, i.e. FW and BW in Figure 1) in each lines of electrodes. Due to DMT, we observed overall a large reduction in absolute power, in-line with previous results.
Figure 3
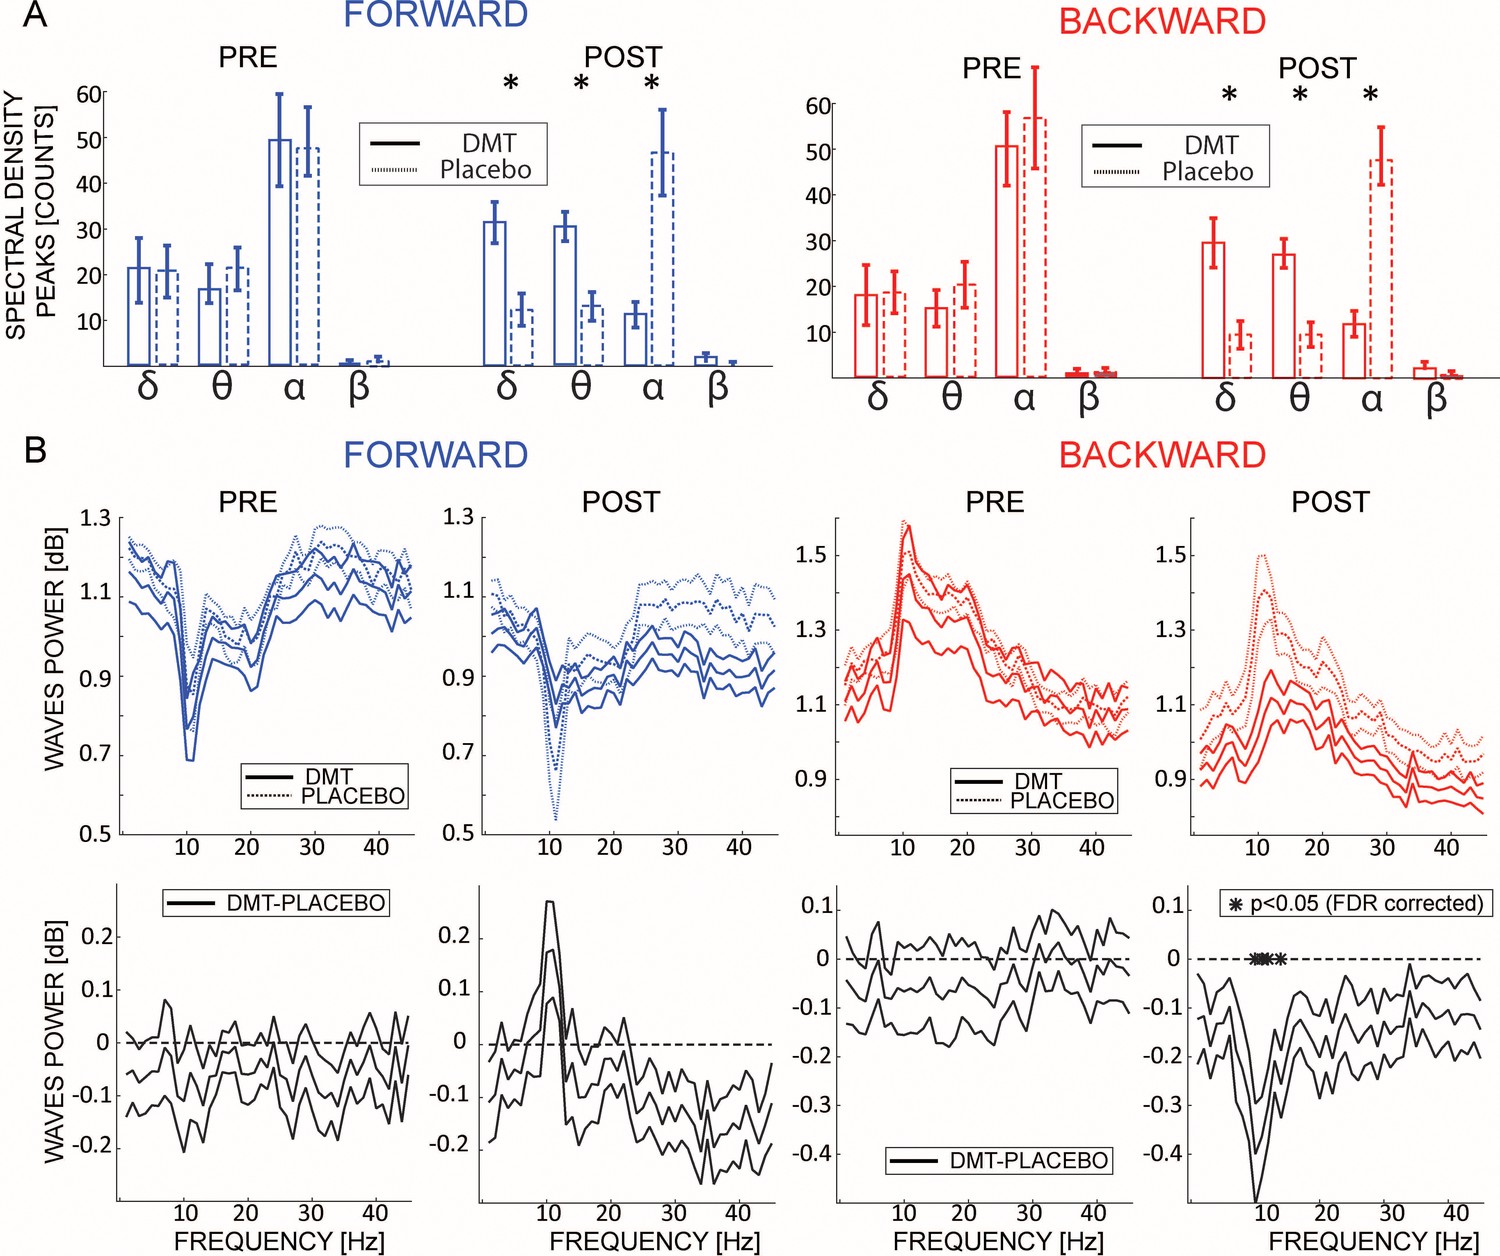
DMT influences the frequency of the travelling waves.
(A) Left and right panels show the waves’ frequencies computed from the maximum value from each quadrant in the 2D-FFT map for FW and BW waves, pre- and post-infusion. The histogram reflects the average between participants of the number of 1 s time-windows having a wave peak at the corresponding frequency. Notably, DMT significantly reduces α and β band oscillations, while enhancing δ and θ. Asterisks denote significant differences between DMT and Placebo conditions. (B) The upper panels show the amount of waves computed at each frequency of the 2D-FFT (i.e. not considering the maximum power per quadrant as in (A), but considering it for each frequency), for FW and BW waves, pre- and post-infusion. As shown in previous analysis, DMT induces an overall decrease of spectral power, especially in the alpha band BW waves, with the notable exception of an increase in FW waves in the alpha range.
Figure 4
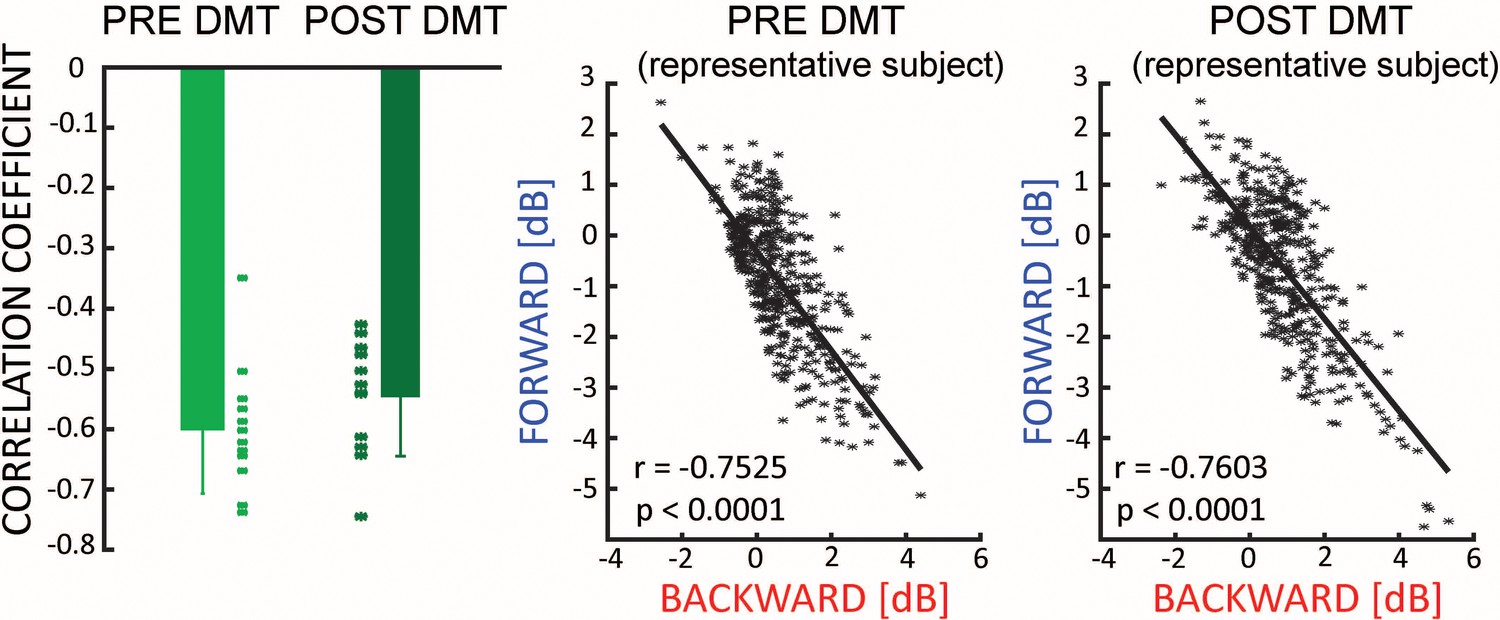
Travelling waves directions.
There is a negative correlation between the net amount of FW and BW waves, which is not influenced by the ingestion of DMT (left panel). The middle and the right panel show the relationship for a typical subject pre- and post-DMT injection.
Figure 5

Travelling waves vs subjective ratings.
The first panel shows the correlation between intensity rate and waves amplitude across time-points. Each dot represents a one-minute time-bin from DMT injection, the x-axis reflects the average intensity rating across subjects, and the y-axis indicates the average strength of BW or FW waves across subjects (both correlations p<0.0001). The middle panel shows the correlation coefficients across participants, obtained by correlating the intensity ratings and the waves’ amount separately for each time point. Solid lines show when the amount of waves is significantly larger than zero (always for BW waves, few minutes after DMT injections for FW waves – see Figure 2A). However, given the limited statistical power (N = 12), and proper correction for multiple testing, correlations did not reach significance at any time point. The last panel shows the correlation coefficients between the visual imagery specific ratings provided at the end of the experiment (i.e. Visual Analogue Scale, see methods) and the net amount of waves (measured when both BW and FW were significantly different than zero, i.e. from minutes 2 to 5): for all 20 items in the questionnaire there was a positive trend between the amount of FW waves and the intensity of visual imagery, as confirmed by a Bayesian t-test against zero (BF for FW waves >> 100). We did not observe this effect in the BW waves (BF = 0.41).
Author response image 1
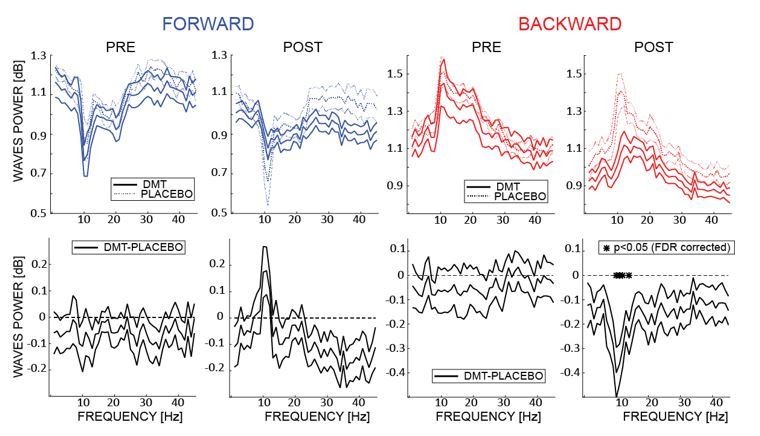
The upper panels show the amount of waves computed at each frequency of the 2D-FFT (i.e. not considering the maximum power per quadrant as in A, but considering it separately for each frequency), for FW and BW waves, pre- and post- infusion.
The lower panels show the difference between DMT- and placebo-induced waves for each condition. As shown in the previous analysis, DMT induces an overall decrease of the waves’ amplitude, especially pronounced (and significant) in the α band BW waves, with the notable exception of FW waves in the α range, where an DMT-induced increase is observed.
Author response image 2

Relative phase obtained by computing the difference between the phases of the α band-pass filtered signal of each channel and Cz.
Reassuringly, the pattern of results confirms the disruption of the top-down flow, counterbalanced by a bottom-up component, specifically after the infusion of DMT, in line with our original analysis.
Additional files
Download links
A two-part list of links to download the article, or parts of the article, in various formats.
Downloads (link to download the article as PDF)
Open citations (links to open the citations from this article in various online reference manager services)
Cite this article (links to download the citations from this article in formats compatible with various reference manager tools)
DMT alters cortical travelling waves
eLife 9:e59784.
https://doi.org/10.7554/eLife.59784


