Wnt- and glutamate-receptors orchestrate stem cell dynamics and asymmetric cell division
- Centre for Stem Cells and Regenerative Medicine, King's College London, United Kingdom
Figures
Figure 1 with 2 supplements
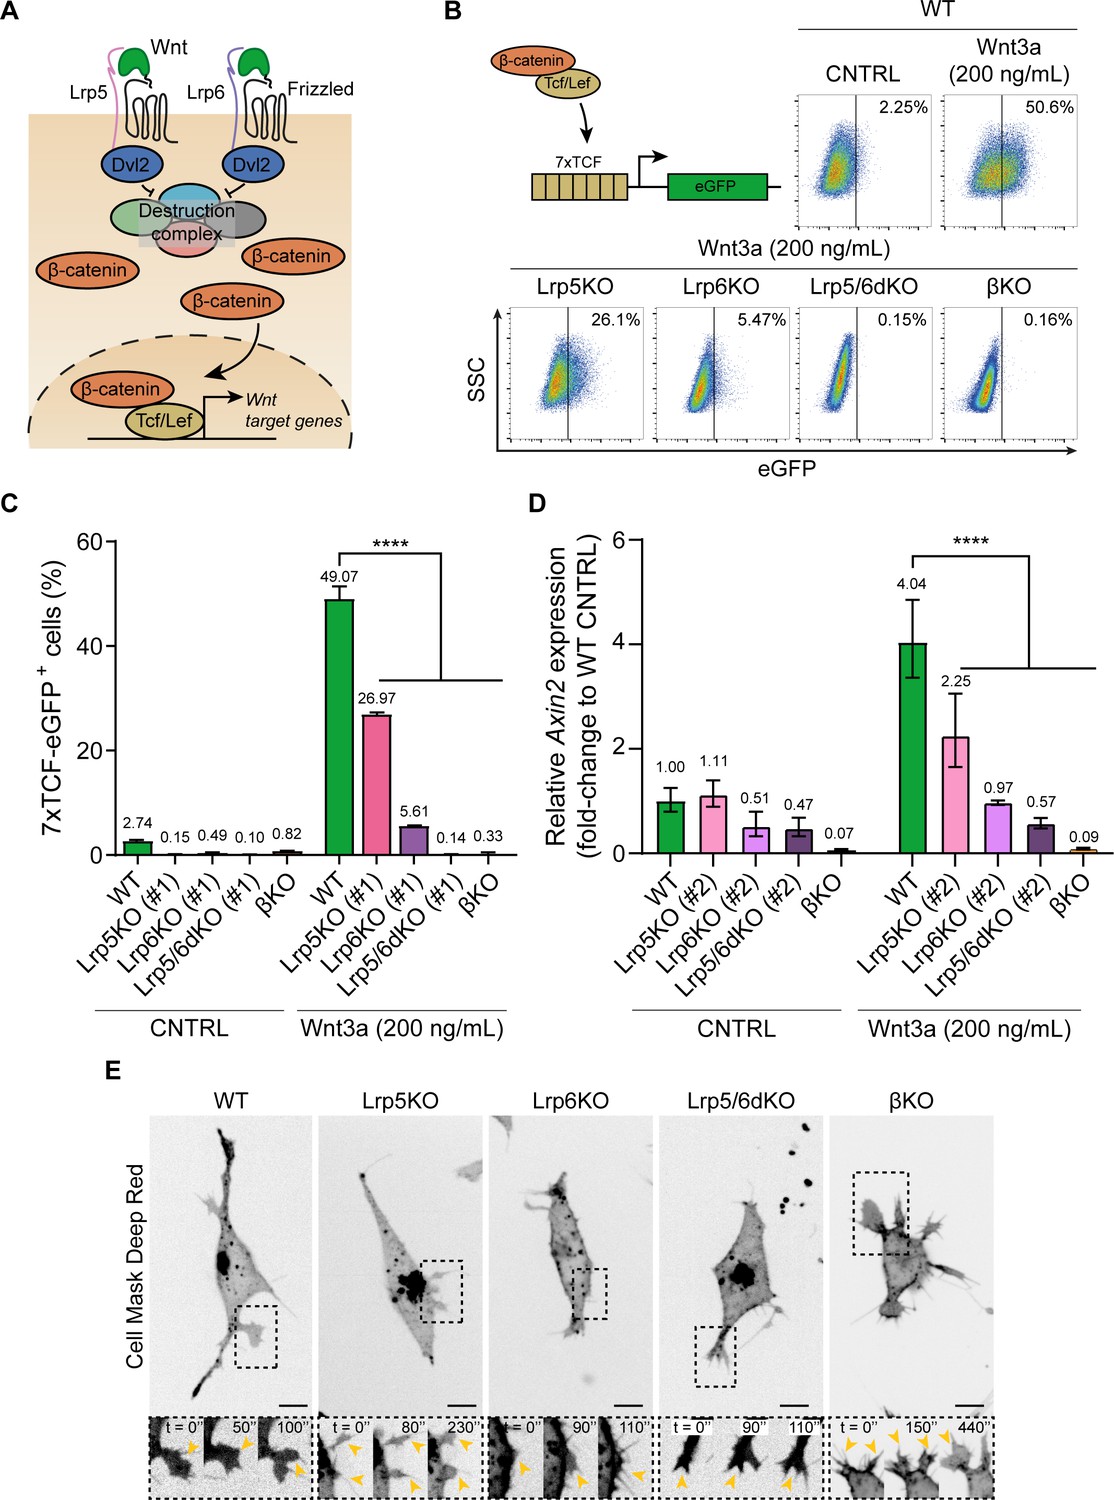
Wnt3a responsiveness and formation of dynamic cytonemes in Wnt/β-catenin pathway KO ESCs.
(A) Simplified schematic representation of the Wnt/β-catenin pathway. Wnt3a binding to the receptor Frizzled and the co-receptors Lrp5 and Lrp6 induces the inhibition of the β-catenin destruction complex (Axin2, Gsk3, Ck1, APC) through Dvl. β-catenin is stabilised and translocated to the nucleus, where it binds Tcf/Lef to initiate the transcription of Wnt3a target genes. (B) (Top-left) Schematic representation of the 7xTCF-eGFP Wnt/β-catenin reporter. (Top-right and Bottom) Representative dot-plots depicting the levels of eGFP expression in WT or Wnt pathway KO ESCs carrying the 7xTCF-eGFP reporter and treated with CNTRL solution or 200 ng/mL soluble Wnt3a for 24 hr. Y axis is SSC. Values in plots are percentage of GFP+ cells. (C) Percentage of 7xTCF-eGFP+ cells measured by FACS, as described in (B). n = 6 for WT, n = 3 for KO ESCs. Bars and numbers are mean, error bars indicate SEM. Stars indicate statistical significance calculated by two-way ANOVA with Dunnett’s multiple comparison test: ****p<0.0001. (D) Relative Axin2 expression in WT or Wnt pathway KO ESCs treated with CNTRL media or 200 ng/mL soluble Wnt3a for 24 hr, measured by qPCR. n = 3. Bars and numbers are geometric mean, error bars indicate geometric SD. Stars indicate statistical significance calculated by two-way ANOVA with Dunnett’s multiple comparison test: ****p<0.0001. (E) Representative images of the cytonemes in WT, Lrp5KO (#1), Lrp6KO (#1), Lrp5/6dKO (#1) and βKO ESCs. Cells were stained with CellMaskDeep Red and imaged for 10 min every 10 s on a spinning disk confocal, with a 40x/0.95 air objective (incubation at 37°C, 5% CO2). Insets (below) are magnifications of black dashed boxes, contrast-enhanced for clarity. Yellow arrowheads indicate thin protrusions. Time is in s. Scale bars are 10 μm. Numeric data used in the figure can be found in the Source Data file.
-
Figure 1—source data 1
Numeric data used in Figure 1.
- https://cdn.elifesciences.org/articles/59791/elife-59791-fig1-data1-v3.xlsx
Figure 1—figure supplement 1
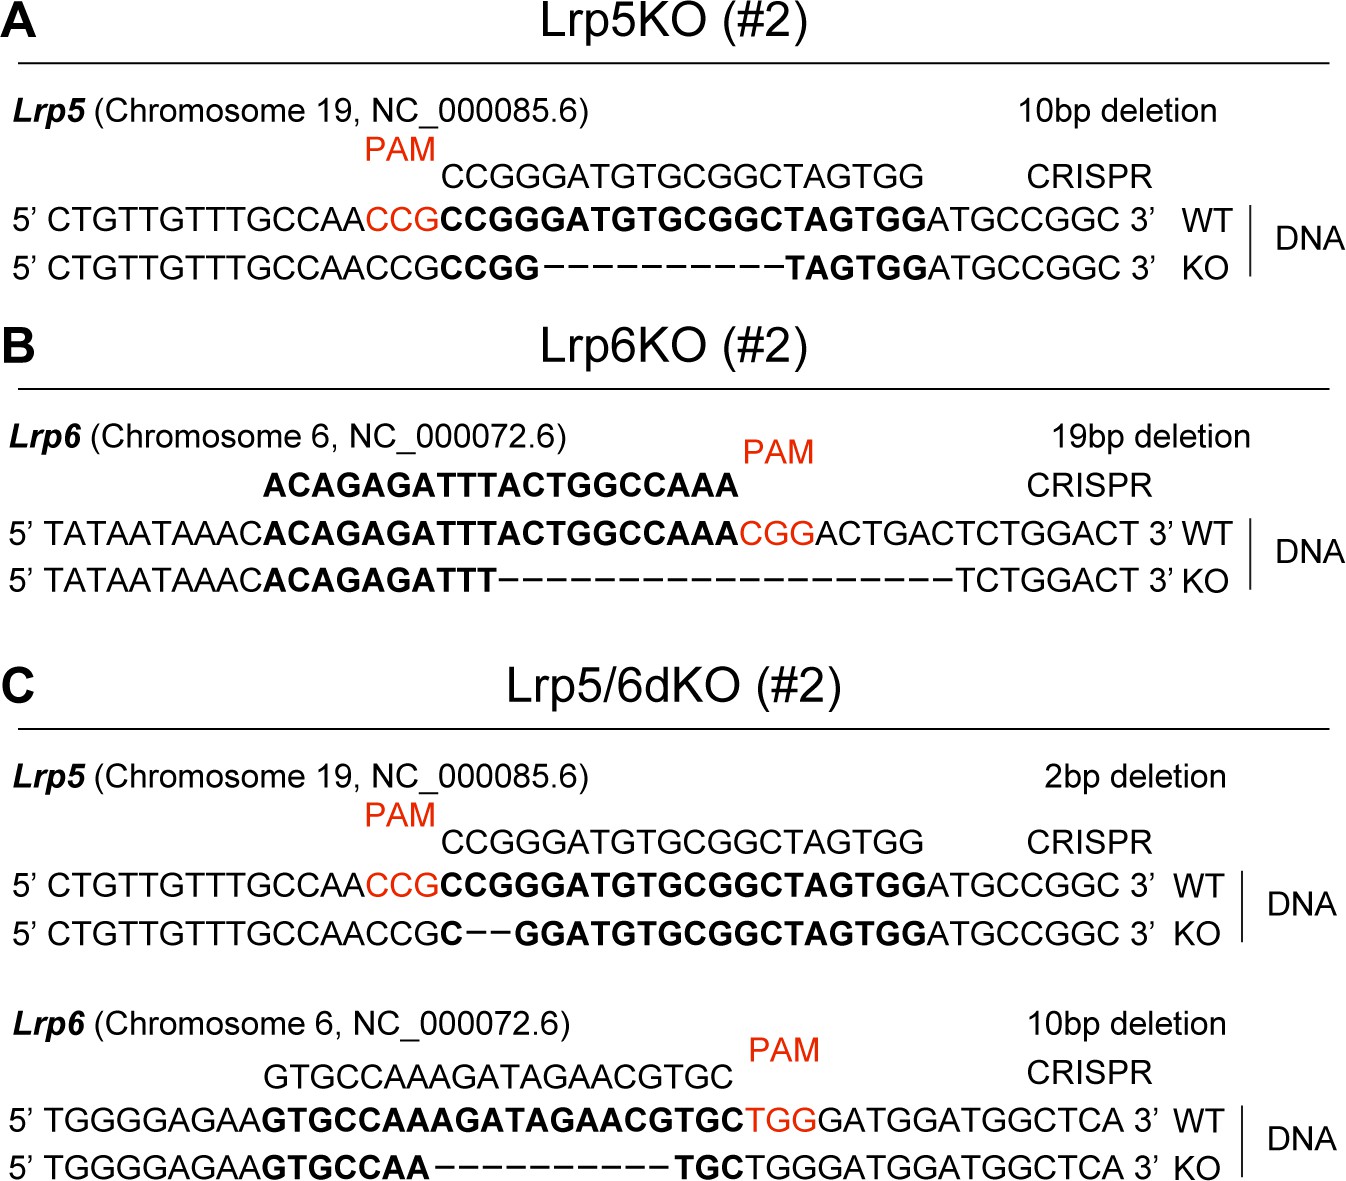
Genotype of Wnt co-receptor KO ESCs.
(A – C) Schematic representations of the genotype of Lrp5KO (#2) (A), Lrp6KO (#2) (B) and Lrp5/6dKO (#2) (C). ‘CRISPR’ sequence indicates the gRNA sequence used for the gene editing, red NGG sequences indicate adjacent PAM (or CCN for reverse complement). ‘WT’ sequences indicate wild-type gene and ‘KO’ sequences indicate modified gene sequences (homozygous). Dashes indicate deleted base-pairs.
Figure 1—figure supplement 2

Representative images of cytonemes in Wnt co-receptor KO ESCs.
Representative images of the cytonemes in Lrp5KO (#2), Lrp6KO (#2), Lrp5/6dKO (#2) ESCs. Cells were stained and imaged as described in Figure 1E. Insets (below) are magnifications of black dashed boxes, contrast-enhanced for clarity. Yellow arrowheads indicate thin protrusions. Time is in s. Scale bars are 10 μm.
Figure 2
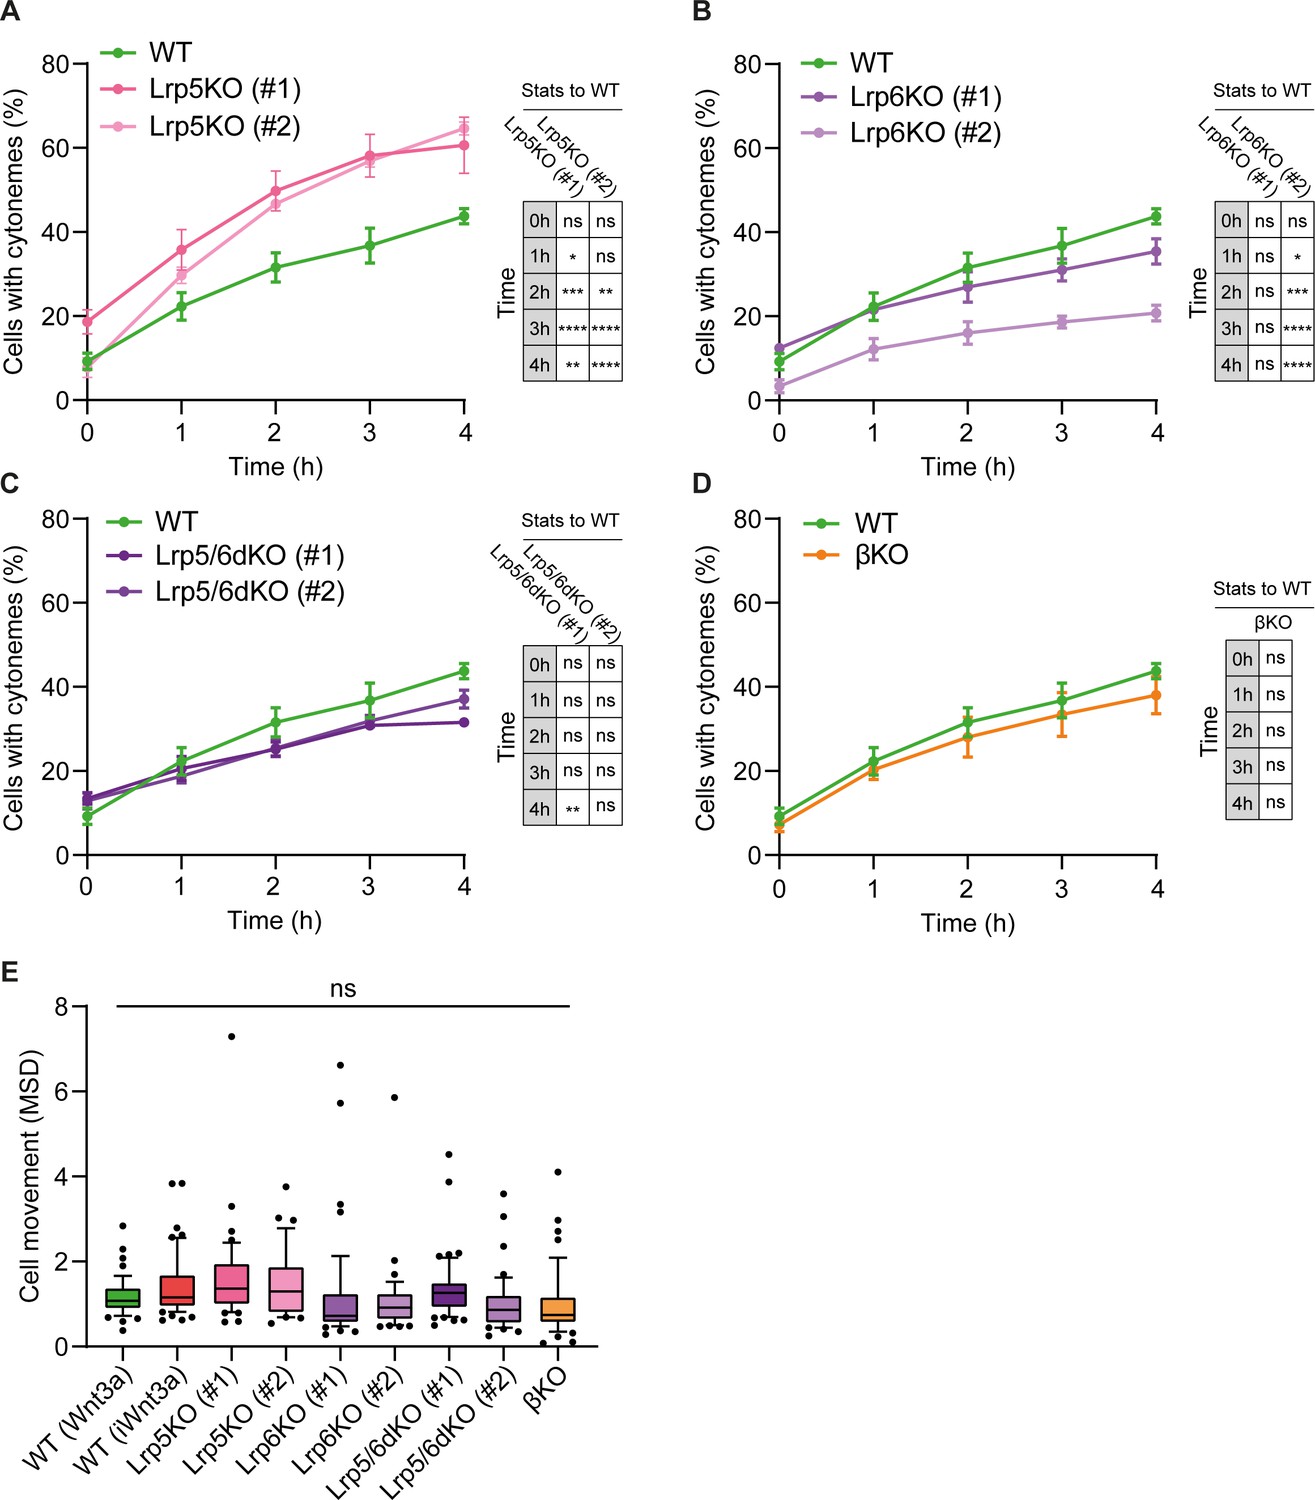
Lrp5 controls the generation of cytonemes by ESCs.
(A – D) Percentage of WT, Lrp5KO (clone #1 and #2) (A), Lrp6KO (#1 and #2) (B), Lrp5/6dKO (#1 and #2) (C) and βKO ESCs (D) with cytonemes at 0–4 hr after seeding. Line and dots are mean, error bars are SEM. N ≥ 33 cells, n ≥ 3 experiments. Stars and symbols in box (right of each plot) indicate statistical significance to WT ESCs, calculated by two-way ANOVA with Dunnett’s multiple comparison test (for A – C) or multiple unpaired t-tests (for D): ns (non-significant, p>0.05), *p<0.05, **p<0.01, ***p<0.001, ****p<0.0001. The same WT ESCs data is presented in A – D for comparison. (E) Cell movement, presented as mean squared displacement per minute (MSD) for WT ESCs co-cultured with Wnt3a- or iWnt3a-beads, or Wnt/β-catenin pathway KO ESCs co-cultured with Wnt3a-beads. n ≥ 36 cells, pooled from ≥ 3 independent experiments, were tracked for 3 hr after attachment. Box represents median and quartiles, error bars are 10–90 percentile, dots are data outside 10–90 range. ns indicates non-significant (p>0.05) differences calculated by one-way ANOVA with Dunnett’s multiple comparison test. Numeric data used in the figure can be found in the Source Data file.
-
Figure 2—source data 1
Numeric data used in Figure 2.
- https://cdn.elifesciences.org/articles/59791/elife-59791-fig2-data1-v3.xlsx
Figure 3
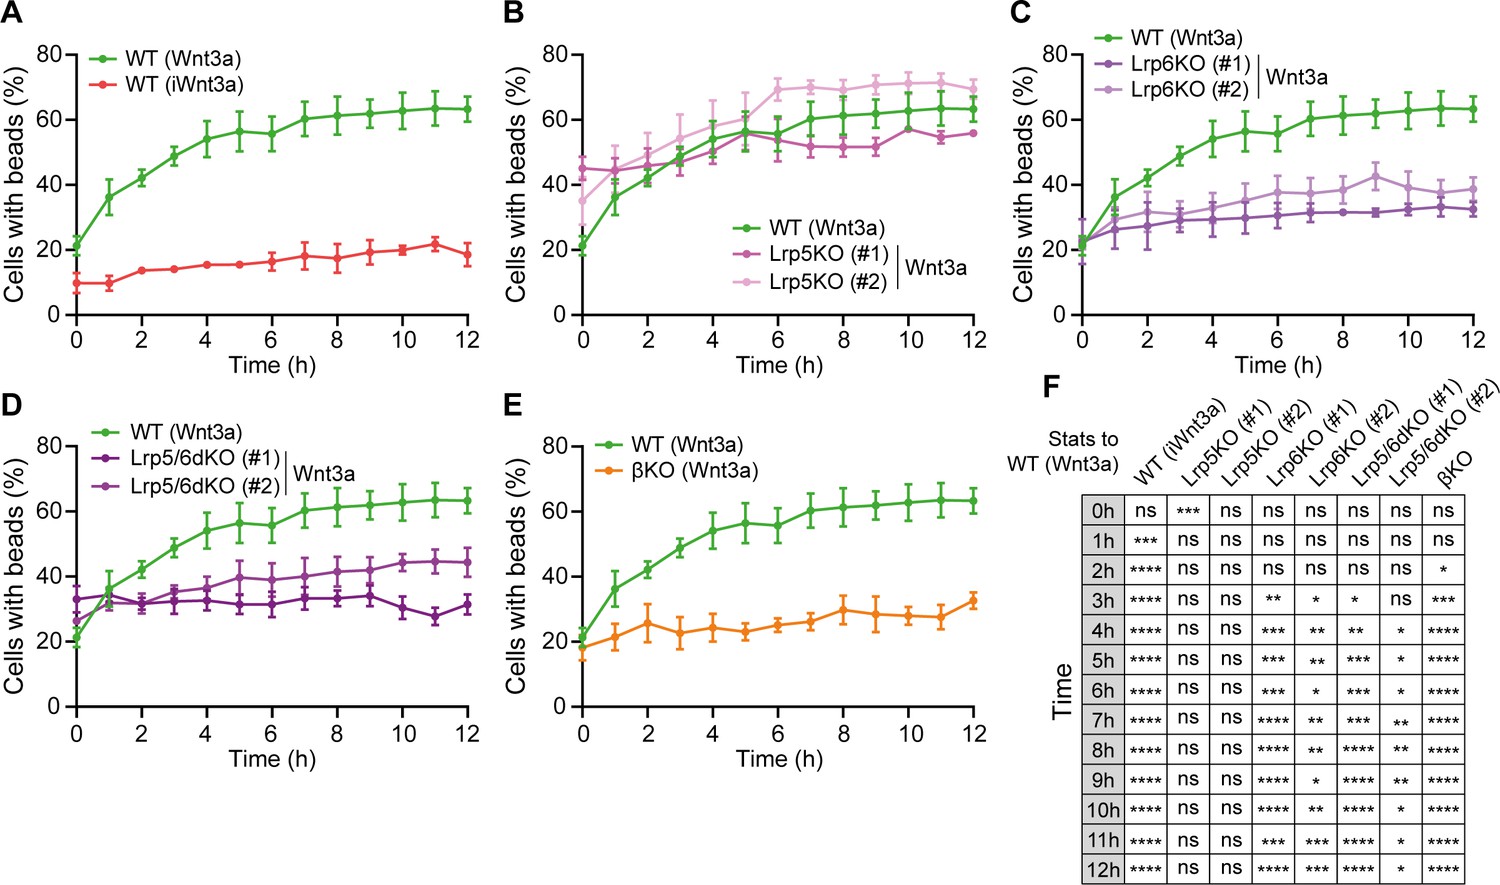
Lrp6 and β-catenin are required for Wnt3a-bead accumulation.
(A – E) Percentage of WT (A), Lrp5KO (#1 and #2) (B), Lrp6KO (#1 and #2) (C), Lrp5/6dKO (#1 and #2) (D) and βKO (E) ESCs contacting Wnt3a-beads or iWnt3a-beads (indicated in brackets) at 0–12 hr after seeding. Line and dots are mean, error bars are SEM. N ≥ 36 cells, n ≥ 3 experiments. The same WT ESCs + Wnt3a-beads data is presented in (A – E) for comparison. (F) Statistical analysis of (A – E), calculated for all conditions against WT ESCs + Wnt3 a-beads. Stars and symbols indicate statistical significance calculated by two-way ANOVA with Dunnett’s multiple comparison tests: ns (non-significant, p>0.05), *p<0.05, **p<0.01, ***p<0.001, ****p<0.0001. Numeric data used in the figure can be found in the Source Data file.
-
Figure 3—source data 1
Numeric data used in Figure 3.
- https://cdn.elifesciences.org/articles/59791/elife-59791-fig3-data1-v3.xlsx
Figure 4 with 1 supplement
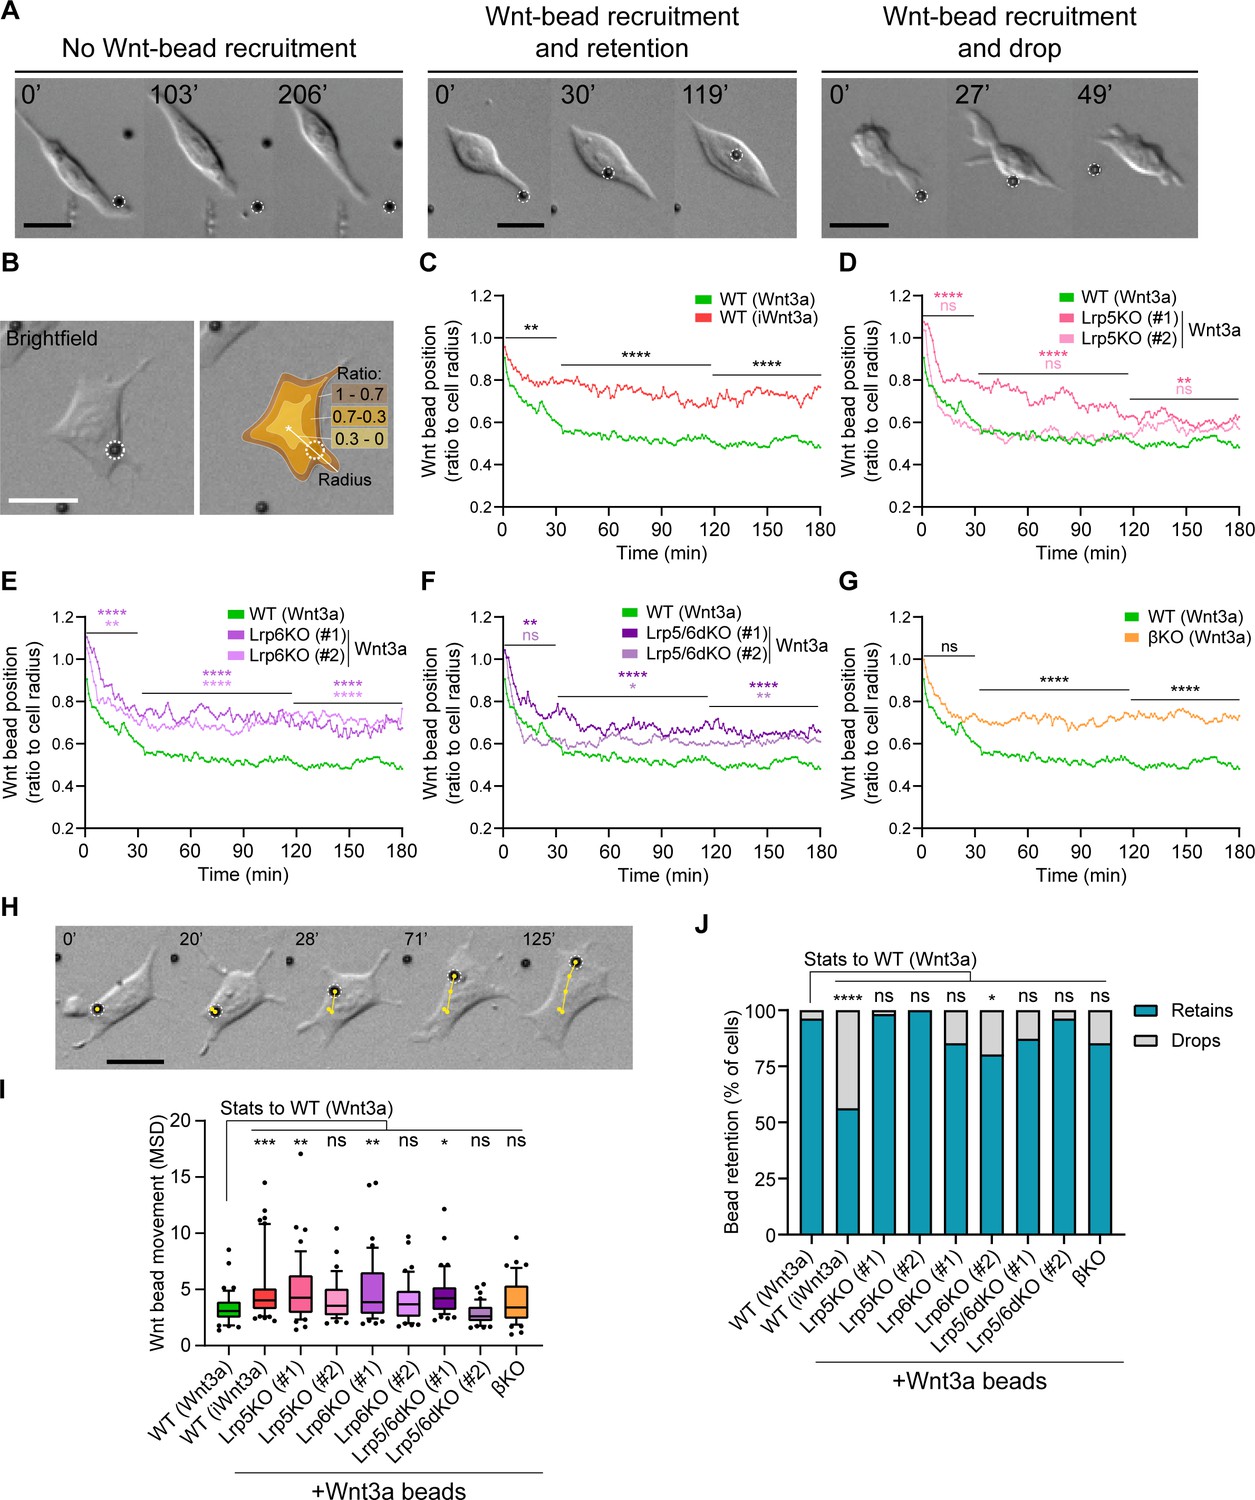
Wnt co-receptors and β-catenin orchestrate the interaction between ESCs and Wnt3a-beads at the membrane.
(A) Representative brightfield frames of time-course live imaging sequences displaying an ESC contacting a Wnt3a-bead without recruitment (left), contact with recruitment (middle) and a Wnt3a-bead recruitment with subsequent dropping (right). Scale bars are 20 μm. Wnt3a-beads are highlighted by white dashed circles. (B) Representative brightfield image of an ESC contacting a Wnt3a-bead (left). Schematic representation of the cell ‘periphery’ (1–0.7 proportion of radius, brown), 0.7–0.3 proportion of radius (orange) or ‘centre’ of the cell (0.3–0 proportion of radius, yellow), and of the radius used to calculate the bead position (white line) (right). Scale bars are 20 μm. Wnt3a-bead is highlighted by white dashed circles. (C – G) Wnt3a-bead position in the cell, measured every minute for 3 hr (180 min) after initial cytoneme-mediated recruitment, and presented as ratio to cell radius. Lines are mean of n ≥ 38 cells/condition, pooled approximately evenly from ≥ 3 independent experiments. Single-cell tracks are presented in Figure 4—figure supplement 1. Stars or symbols are statistical significance, calculated from the average Wnt3a-bead position per cell in three representative time windows (0–30 min, 31–120 min, and 121–180 min) against the position of Wnt3a-beads in WT ESCs, by two-way ANOVA with Dunnett’s (D – F) or Šídák's (C and G) multiple comparison test: ns (non-significant, p>0.05), *p<0.05, **p<0.01, ****p<0.0001. The same WT ESCs + Wnt3a-beads data is presented in C – G for comparison. (H) Representative brightfield frames of a time-course live imaging, showing an ESC contacting a Wnt3a-bead (highlighted with white dashed circle). Yellow track indicates Wnt3a-bead movement on the cell over time. Time is in min. Scale-bar is 20 μm. (I) Wnt3a-bead movement on the cell, presented as MSD. Bead movement was measured every minute for 3 hr (180 min) after cytoneme-mediated recruitment in WT ESCs contacting Wnt3a- or iWnt3a-beads, and in Wnt pathway KO ESCs contacting Wnt3a-beads. Box indicates median and quartiles, error bars indicate 10–90 percentile, dots are data outside 10–90 percentile range. n ≥ 38 cells pooled approximately evenly from ≥ 3 independent experiments. Stars indicate statistical significance against WT ESCs + Wnt3a-beads, calculated by one-way ANOVA with Dunnett’s multiple comparison test: ns (non-significant, p>0.05), *p<0.05, **p<0.01, ***p<0.001. (J) Percentage of cells that drop a Wnt3a-bead or iWnt3a-bead within 3 hr of initial recruitment with a cytoneme (grey) or retain it for longer than 3 hr (blue). n ≥ 43 cells/condition. Stars indicate statistical significance calculated by multiple Fisher’s exact tests: ns (non-significant, p>0.05), *p<0.05, ****p<0.0001. Numeric data used in the figure can be found in the Source Data file.
-
Figure 4—source data 1
Numeric data used in Figure 4.
- https://cdn.elifesciences.org/articles/59791/elife-59791-fig4-data1-v3.xlsx
Figure 4—figure supplement 1
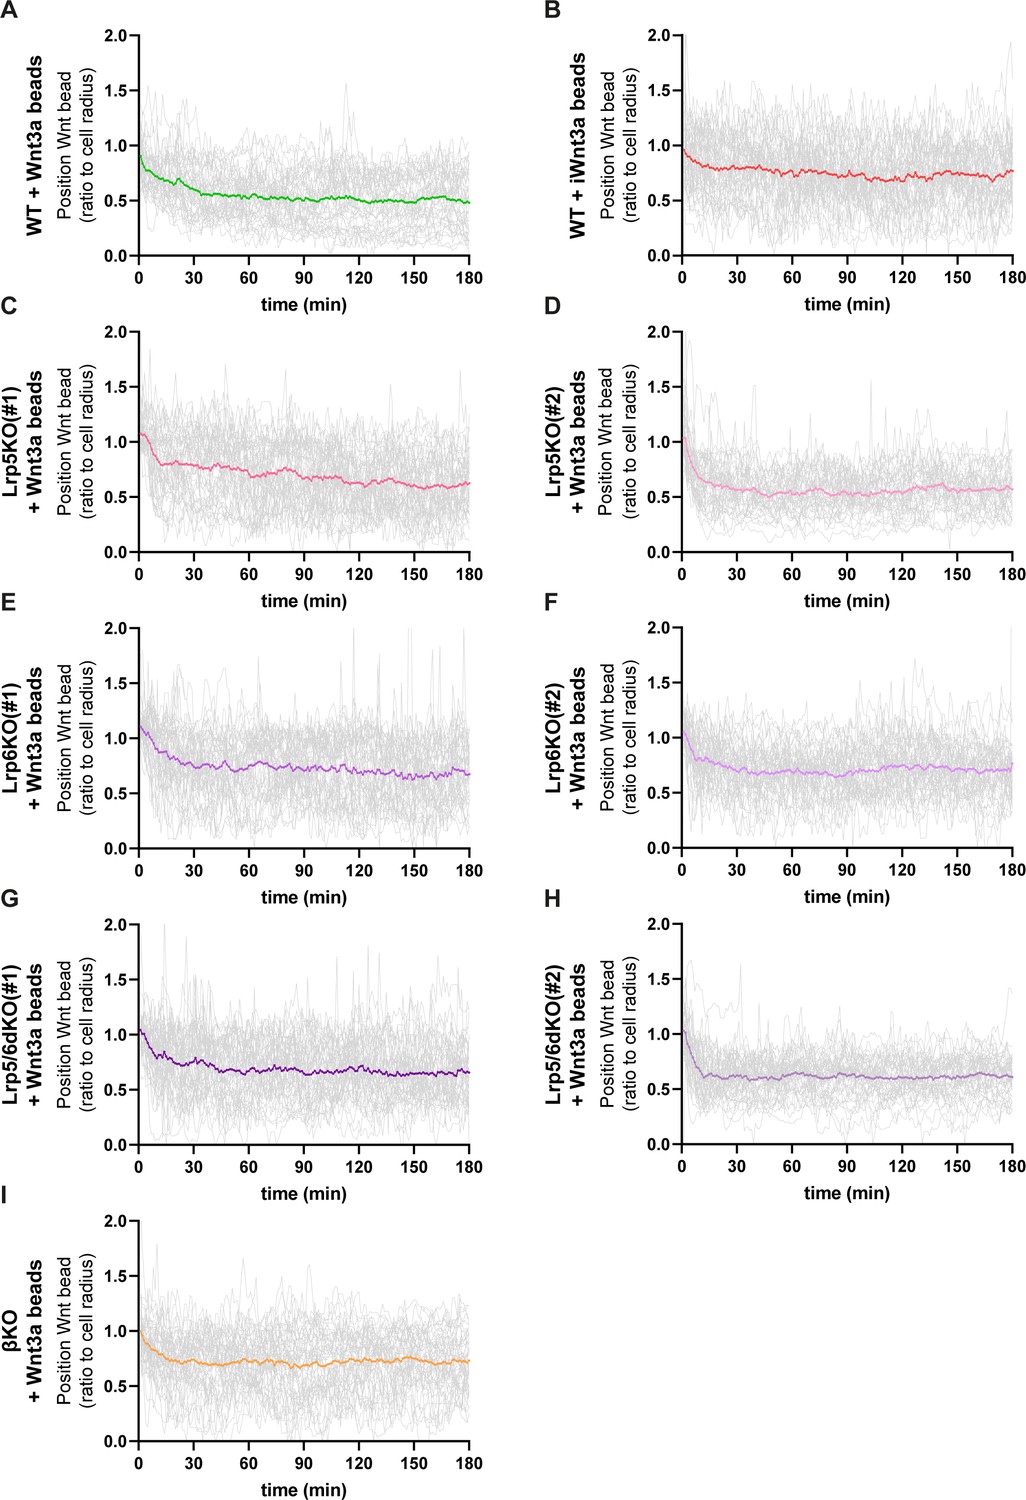
Details of Wnt3a-bead position in WT or Wnt/β-catenin pathway KO ESCs membrane.
(A – I) Detailed quantification of the Wnt3a-bead position on the membrane of WT or Wnt/β-catenin KO ESCs after initial cytoneme-mediated recruitment, including single-cell tracked positions (grey lines) and mean position per condition (coloured line). Numeric data used in the figure can be found in the Source Data file.
-
Figure 4—figure supplement 1—source data 1
Numeric data used in Figure 4—figure supplement 1.
- https://cdn.elifesciences.org/articles/59791/elife-59791-fig4-figsupp1-data1-v3.xlsx
Figure 5 with 1 supplement
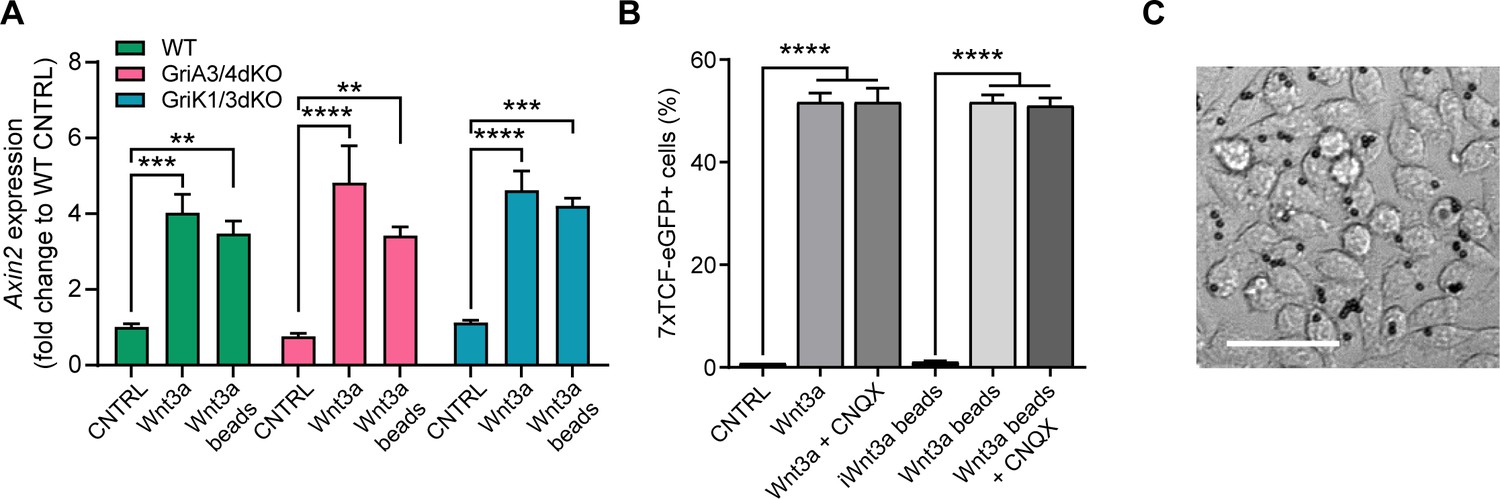
iGluR inhibition or KO does not affect cytoneme-independent Wnt3a responsiveness.
(A) Relative expression of Axin2 mRNA in a monolayer of WT, GriA3/4dKO or GriK1/3dKO ESCs treated with control media (CNTRL), solubilised Wnt3a (200 ng/mL) or a high density of Wnt3a-beads for 24 hr. Bars are mean of n = 3, error bars are SEM. Stars indicate statistical significance, calculated by two-way ANOVA with Tukey’s multiple comparison test: **p<0.01, ***p<0.001, ****p<0.0001. (B) Percentage of 7xTCF-eGFP+ cells in control- or CNQX-treated cells upon addition of control solution (CNTRL), solubilised Wnt3a (200 ng/mL), Wnt3a-beads or iWnt3a-beads at coating concentrations. Bars are mean of n = 3, error bars are SEM. Stars indicate statistical significance calculated by one-way ANOVA with Šídák's multiple comparison test: ****p<0.0001. (C) Representative brightfield image of a monolayer of cells treated with Wnt3a-beads. Scale bar is 50 μm. Numeric data used in the figure can be found in the Source Data file.
-
Figure 5—source data 1
Numeric data used in Figure 5.
- https://cdn.elifesciences.org/articles/59791/elife-59791-fig5-data1-v3.xlsx
Figure 5—figure supplement 1
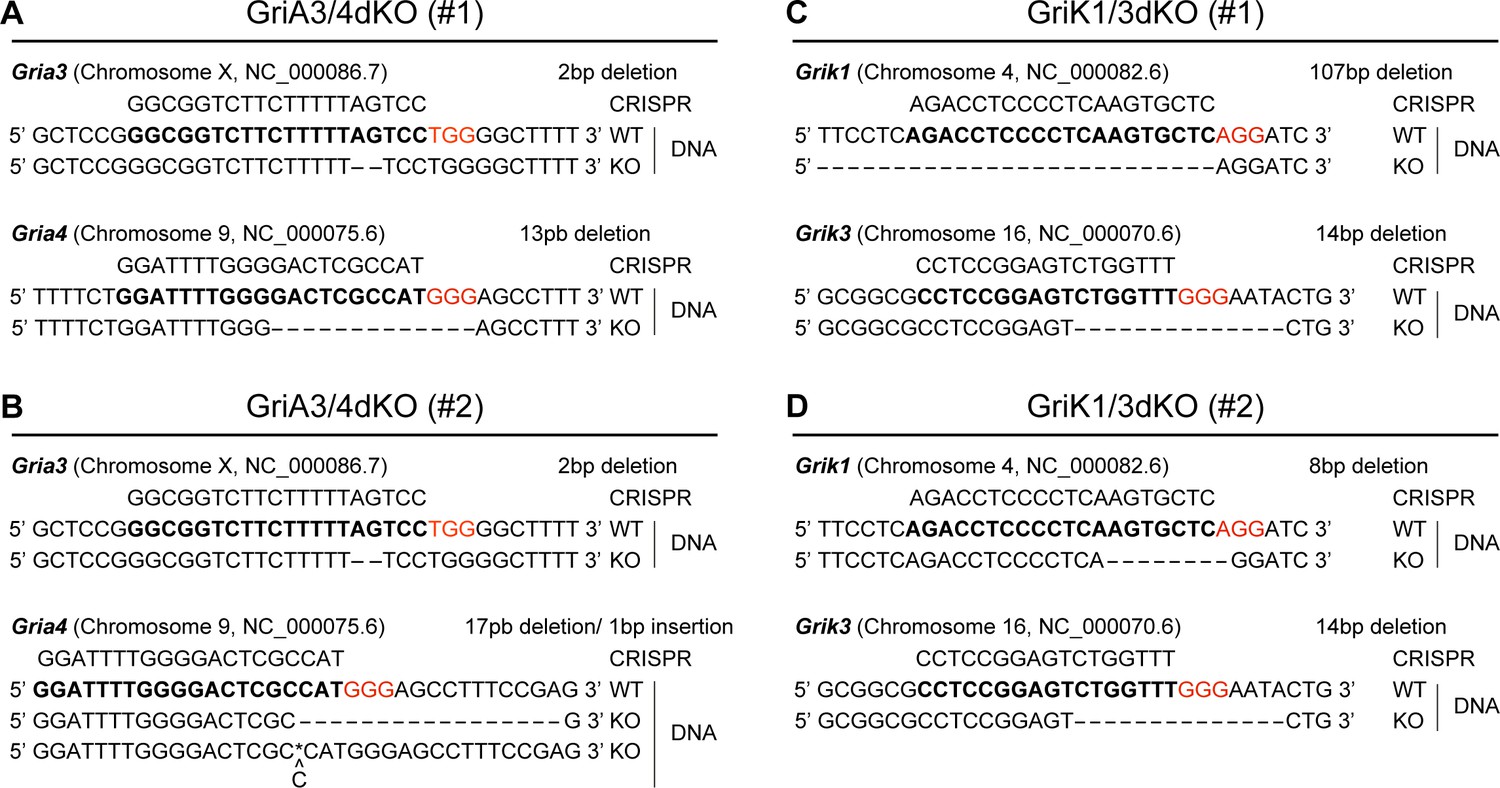
Genotype of GriA3/4dKO and GriK1/3dKO ESCs.
(A – D) Schematic representations of the genotype of GriA3/4dKO (clones #1 and #2) (A and B) and GriK1/3dKO (clones #1 and #2) ESCs (C and D). ‘CRISPR’ sequence indicates the gRNA sequence used for the gene editing, red NGG sequences indicate adjacent PAM. ‘WT’ sequences indicate wildtype gene and ‘KO’ sequences indicate modified gene sequences. For GriA3/4dKO (#2), two mutant sequences were detected at equal rates. Dashes indicate deleted base-pairs. Asterisk (*) indicates insertion.
Figure 6 with 1 supplement
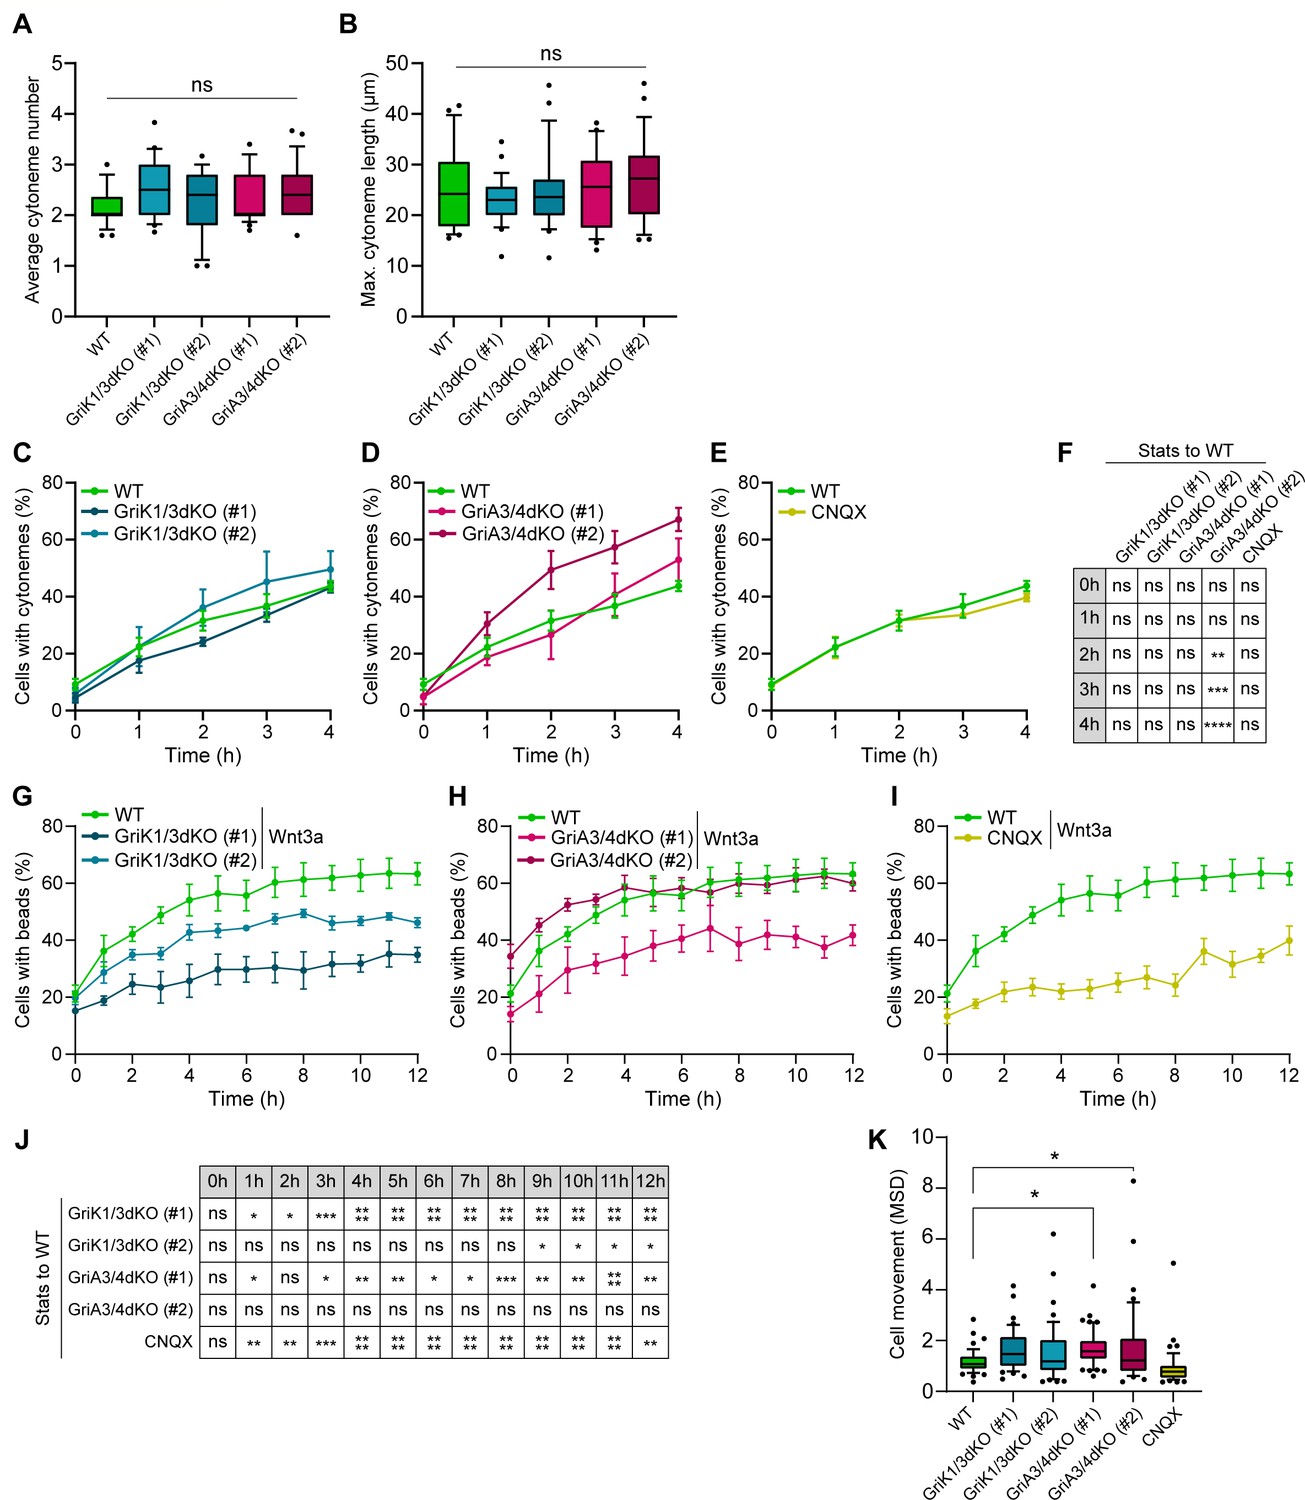
iGluRs control Wnt3a-bead recruitment without affecting the generation and characteristics of the cytonemes.
(A – B) Average number of cytonemes/cell (A) and maximum cytoneme length/cell (B) in WT, GriA3/4dKO, GriK1/3dKO and CNQX-treated ESCs. Boxes are median and quartiles, error-bars are 10–90 percentiles, dots are data outside range. n ≥ 25 cells/condition (A and B). ‘ns’ are non-significant differences calculated against WT ESCs by one-way ANOVA with Dunnett’s multiple comparison tests. (C – E) Percentage of WT, GriK1/3dKO (clone #1 and #2) (C), GriA3/4dKO (#1 and #2) (D) and CNQX-treated ESCs (E) with cytonemes at 0–4 hr after seeding. Line and dots are mean, error bars are SEM. N ≥ 38 cells, n ≥ 3 experiments. WT ESC data from Figure 2A-D presented for comparison. (F) Statistical analysis of (C – E). Stars and symbols in box indicate statistical significance of each condition to WT ESCs, calculated by two-way ANOVA with Dunnett’s multiple comparison test (for C and D) or multiple unpaired t-tests (for E): ns (non-significant, p>0.05), **p<0.01, ***p<0.001, ****p<0.0001. (G – I) Percentage of WT, GriK1/3dKO (#1 and #2) (G), GriA3/4dKO (#1 and #2) (H) and CNQX-treated ESCs (I) contacting Wnt3a-beads at 0 to 12 hr after seeding. Line and dots are mean, error bars are SEM. N ≥ 36 cells, n ≥ 3 experiments. WT ESCs + Wnt3a-beads data from Figure 3A-E presented for comparison. (J) Statistical analysis of (G – I). Stars and symbols indicate statistical significance of each condition to WT ESCs, calculated by two-way ANOVA with Dunnett’s multiple comparison tests: ns (non-significant, p>0.05), *p<0.05, **p<0.01, ***p<0.001, ****p<0.0001. (K) Cell movement, presented as MSD for WT, GriK1/3dKO, GriA3/4dKO and CNQX-treated ESCs. n ≥ 44 cells, pooled from ≥ 3 independent experiments, were tracked for 3 hr after attachment. Box represents median and quartiles, error bars are 10–90 percentile, dots are data outside 10–90 range. Stars indicate statistical differences calculated by one-way ANOVA with Dunnett’s multiple comparison test: *p<0.05. Numeric data used in the figure can be found in the Source Data file.
-
Figure 6—source data 1
Numeric data used in Figure 6.
- https://cdn.elifesciences.org/articles/59791/elife-59791-fig6-data1-v3.xlsx
Figure 6—figure supplement 1
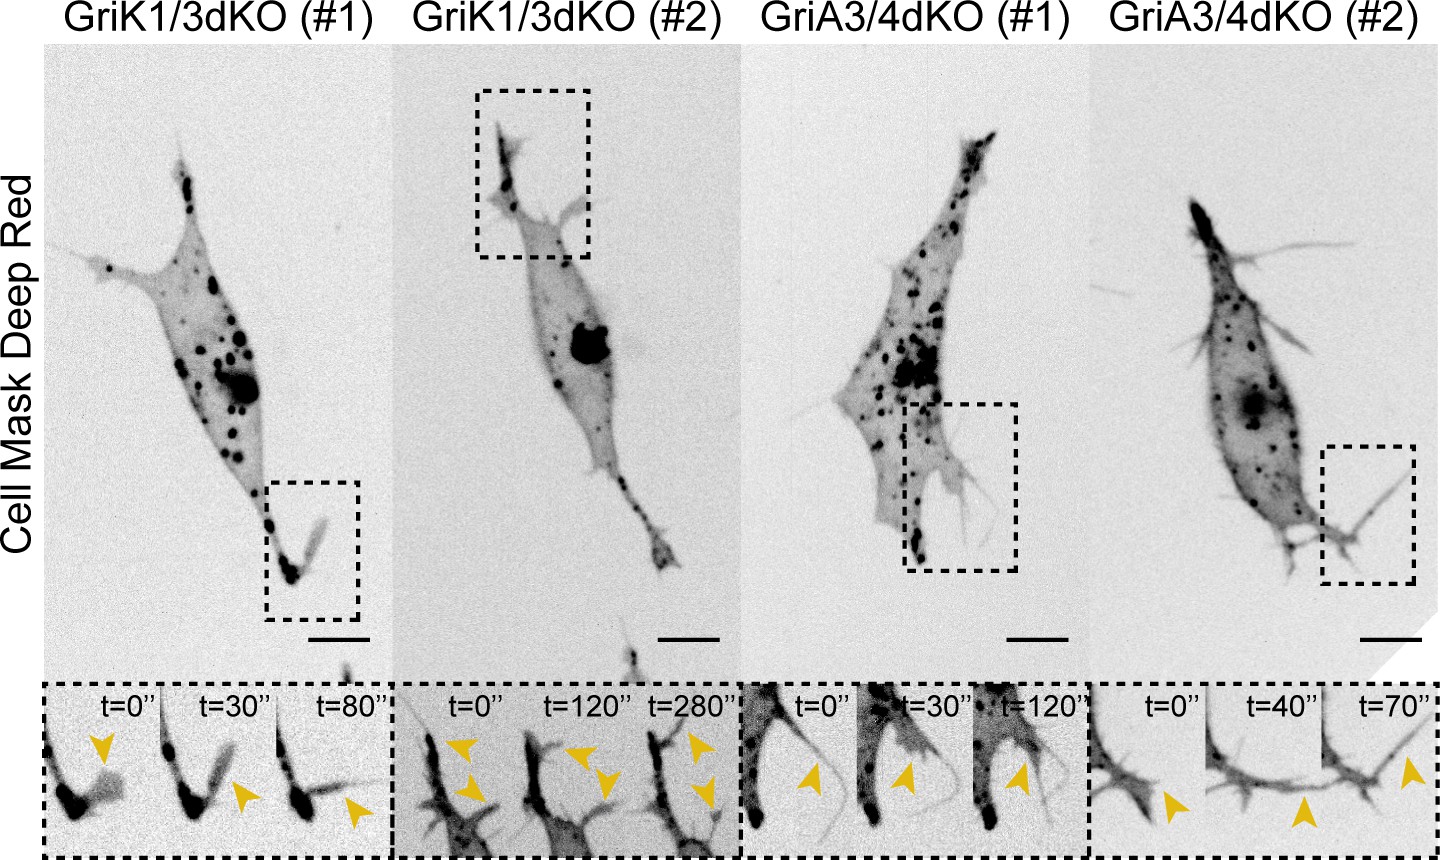
Representative images of cytonemes in GriK1/3dKO and GriA3/4dKO ESCs.
Representative images of the cytonemes in GriK1/3dKO (clones #1 and #2) and GriA3/4dKO (clones #1 and #2) ESCs. Cells were stained and imaged as described in Figure 1E. Insets (below) are magnifications of black dashed boxes, contrast-enhanced for clarity. Yellow arrowheads indicate thin protrusions. Time is in s. Scale bars are 10 μm.
Figure 7 with 1 supplement
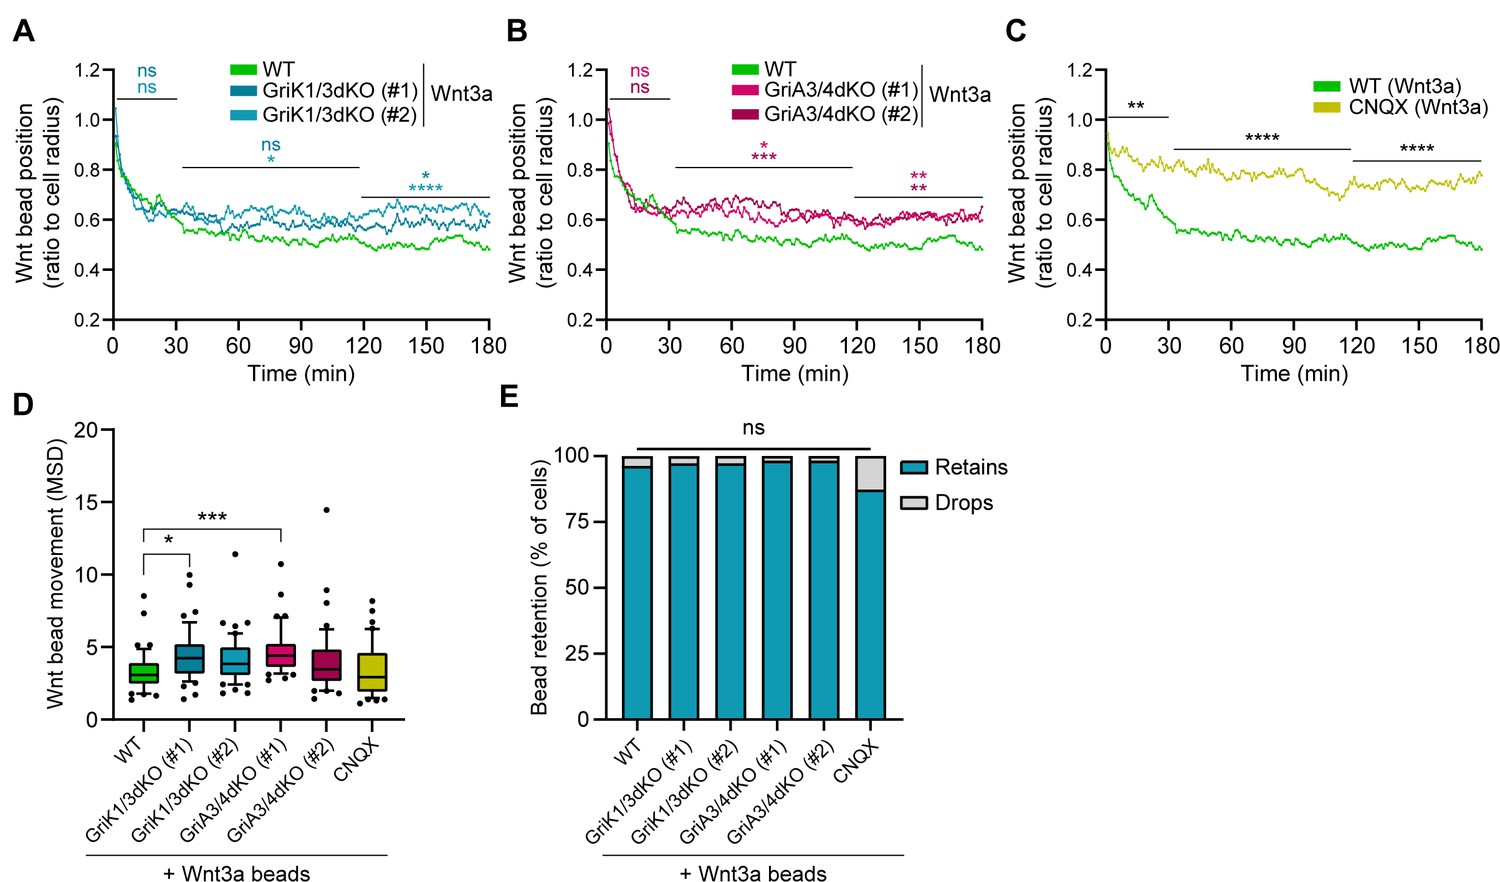
GriK1/3dKO, GriA3/4dKO or CNQX-treated cells retain the beads further from the cell centre.
(A – C) Wnt3a-bead position in the cell surface, measured every minute for 3 hr (180 min) after initial cytoneme-mediated recruitment, and presented as proportion of cell radius. Lines are mean of n ≥ 45 cells/condition, pooled approximately evenly from ≥3 independent experiments. Single-cell tracks are presented in Figure 7—figure supplement 1. Stars or symbols are statistical significance, calculated from the average Wnt3a-bead position per cell in three representative time windows (0–30 min, 31–120 min, and 121–180 min) against the position of Wnt3a-beads in WT ESCs, by two-way ANOVA with Dunnett’s multiple comparison test: ns (non-significant, p>0.05), *p<0.05, **p<0.01, ***p<0.001, ****p<0.0001. WT ESCs + Wnt3a-beads data from Figure 4C-G presented for comparison. (D) Wnt3a-bead movement on the cell, presented as MSD. Bead movement was measured every minute for 3 hr (180 min) after cytoneme-mediated recruitment in WT GriK1/3dKO, GriA3/4dKO and CNQX-treated ESCs contacting Wnt3a-beads. Box indicates median and quartiles, error bars indicate 10–90 percentile, dots are data outside 10–90 percentile range. n ≥ 45 cells pooled approximately evenly from ≥ 3 independent experiments. Stars indicate statistical significance against WT ESCs + Wnt3a-beads, calculated by one-way ANOVA with Dunnett’s multiple comparison test: ns (non-significant, p>0.05), *p<0.05, ***p<0.001. (E) Percentage of cells that drop a Wnt3a-bead within 3 hr of initial recruitment with a cytoneme (grey) or retain it for longer than 3 hr (blue). n ≥ 37 cells/condition. ns is non-significant differences calculated by multiple Fisher’s exact tests. Numeric data used in the figure can be found in the Source Data file.
-
Figure 7—source data 1
Numeric data used in Figure 7.
- https://cdn.elifesciences.org/articles/59791/elife-59791-fig7-data1-v3.xlsx
Figure 7—figure supplement 1
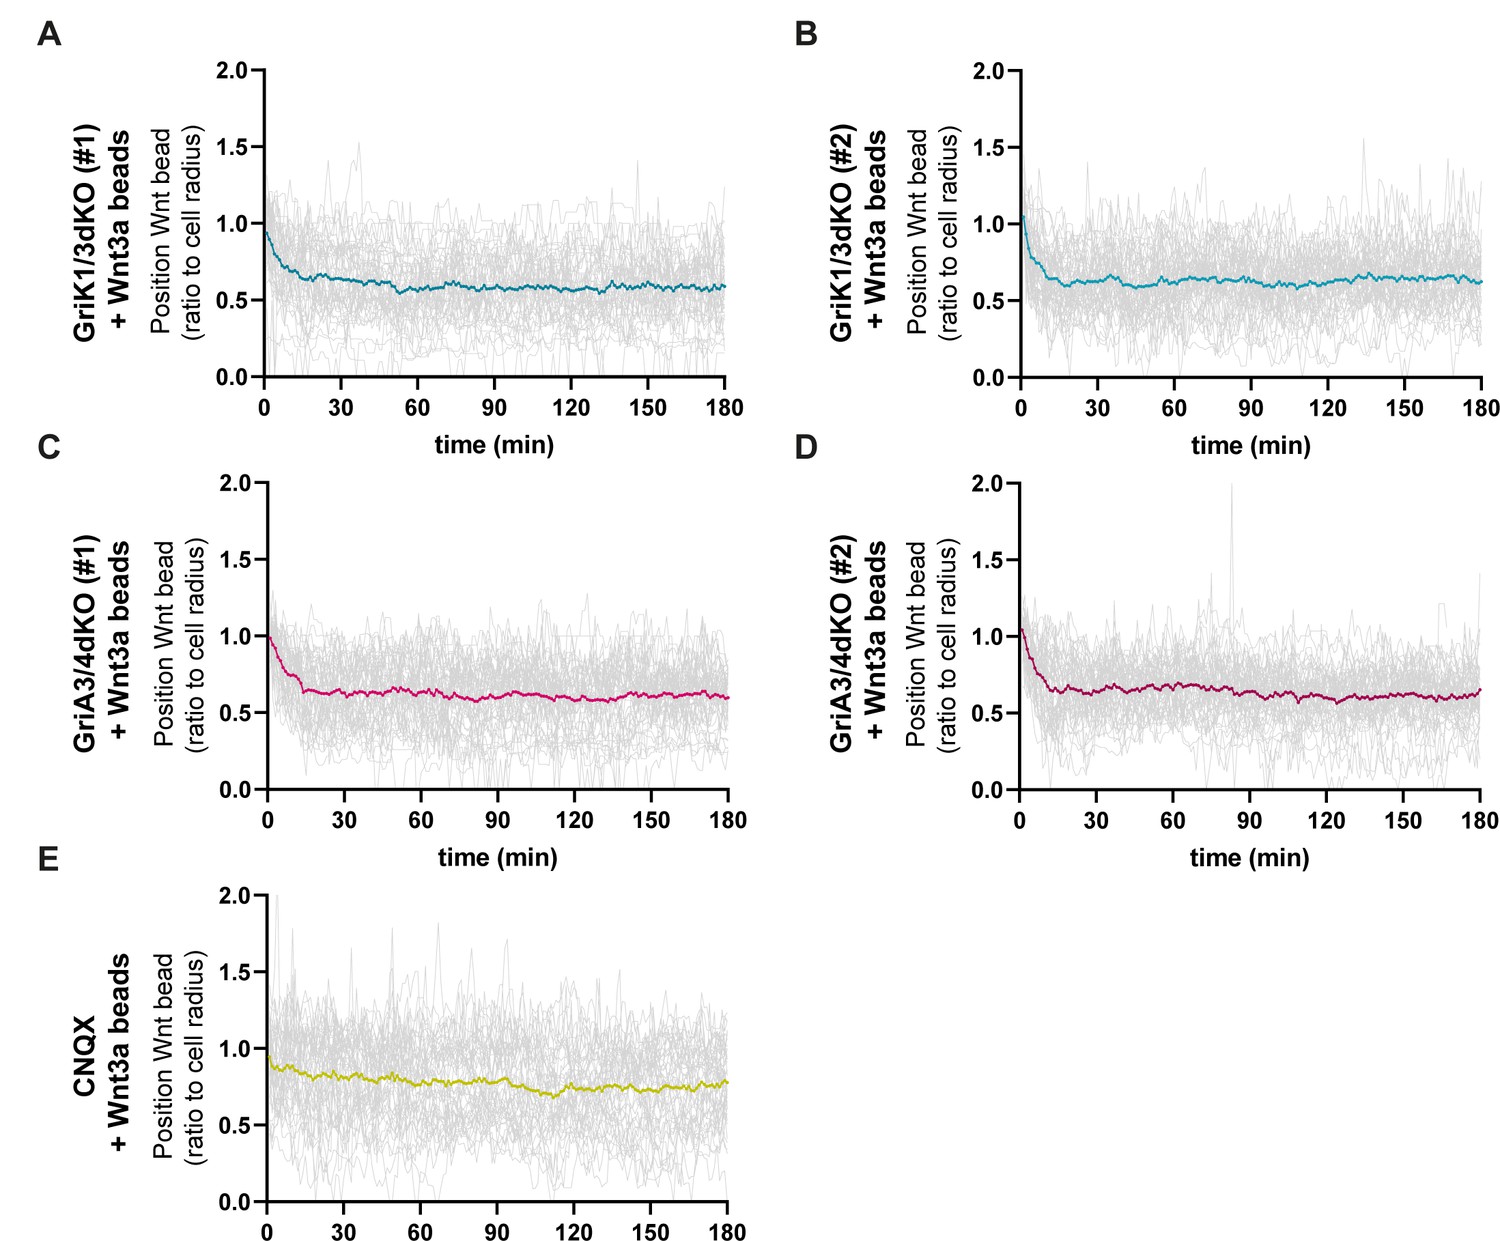
Details of Wnt3a-bead position in WT, GriK1/3dKO, GriA3/4dKO, and CNQX-treated ESCs membrane.
(A – E) Detailed quantification of the Wnt3a-bead position on the membrane of WT, GriK1/3dKO, GrA3/4dKO, and CNQX-treated ESCs after initial cytoneme-mediated recruitment, including single-cell tracked positions (grey lines) and mean position per condition (coloured line). Numeric data used in the figure can be found in the Source Data file.
-
Figure 7—figure supplement 1—source data 1
Numeric data used in Figure 7—figure supplement 1.
- https://cdn.elifesciences.org/articles/59791/elife-59791-fig7-figsupp1-data1-v3.xlsx
Figure 8

Components of the Wnt/β-catenin pathway regulate the orientation of the mitotic spindle of ESCs.
(A) Representative brightfield frames of a time course live-cell imaging, showing an ESC contacting a Wnt3a-bead and undergoing Wnt3a-oriented division. Wnt3a-bead is black sphere. Dashed black box indicates the ‘Anaphase’ timepoint used for spindle orientation analysis. Scale bar is 10 μm. (B) (Left) Representative image of the method used for spindle angle measurement relative to Wnt3a-bead position. Asterisks indicate cell poles used as reference for the measurement. Orthogonal white lines depict major and minor axis, yellow line points to Wnt3a-bead and shows the angle measured (α). Wnt3a-bead is highlighted with yellow dashed circle. (Right) Representative images of different ESCs dividing with Wnt3a-beads at angles between 0 and 90° (indicated in the figure). Scale bars are 10 μm. (C – K) Rose plots depicting the distribution of spindle angles in WT ESCs dividing with Wnt3a-beads (C), WT ESCs dividing with iWnt3a-beads (D) or Lrp5KO ESCs (E and F), Lrp6KO ESCs (G and H), Lrp5/6dKO ESCs (I and J), and βKO ESCs (K) dividing with Wnt3a-beads. n (number of cells analysed) is depicted in the figure for each condition. (L) Statistical comparison of the distribution of spindle angles in all conditions to the one observed in WT ESCs + Wnt3a beads. Stars indicate statistical significance calculated by multiple Kolmogorov-Smirnov tests: **p<0.01, ***p<0.001, ****p<0.0001. Numeric data used in the figure can be found in the Source Data file.
-
Figure 8—source data 1
Numeric data used in Figure 8.
- https://cdn.elifesciences.org/articles/59791/elife-59791-fig8-data1-v3.xlsx
Figure 9
β-catenin and Lrp6 are required for Wnt3a-mediated ACD.
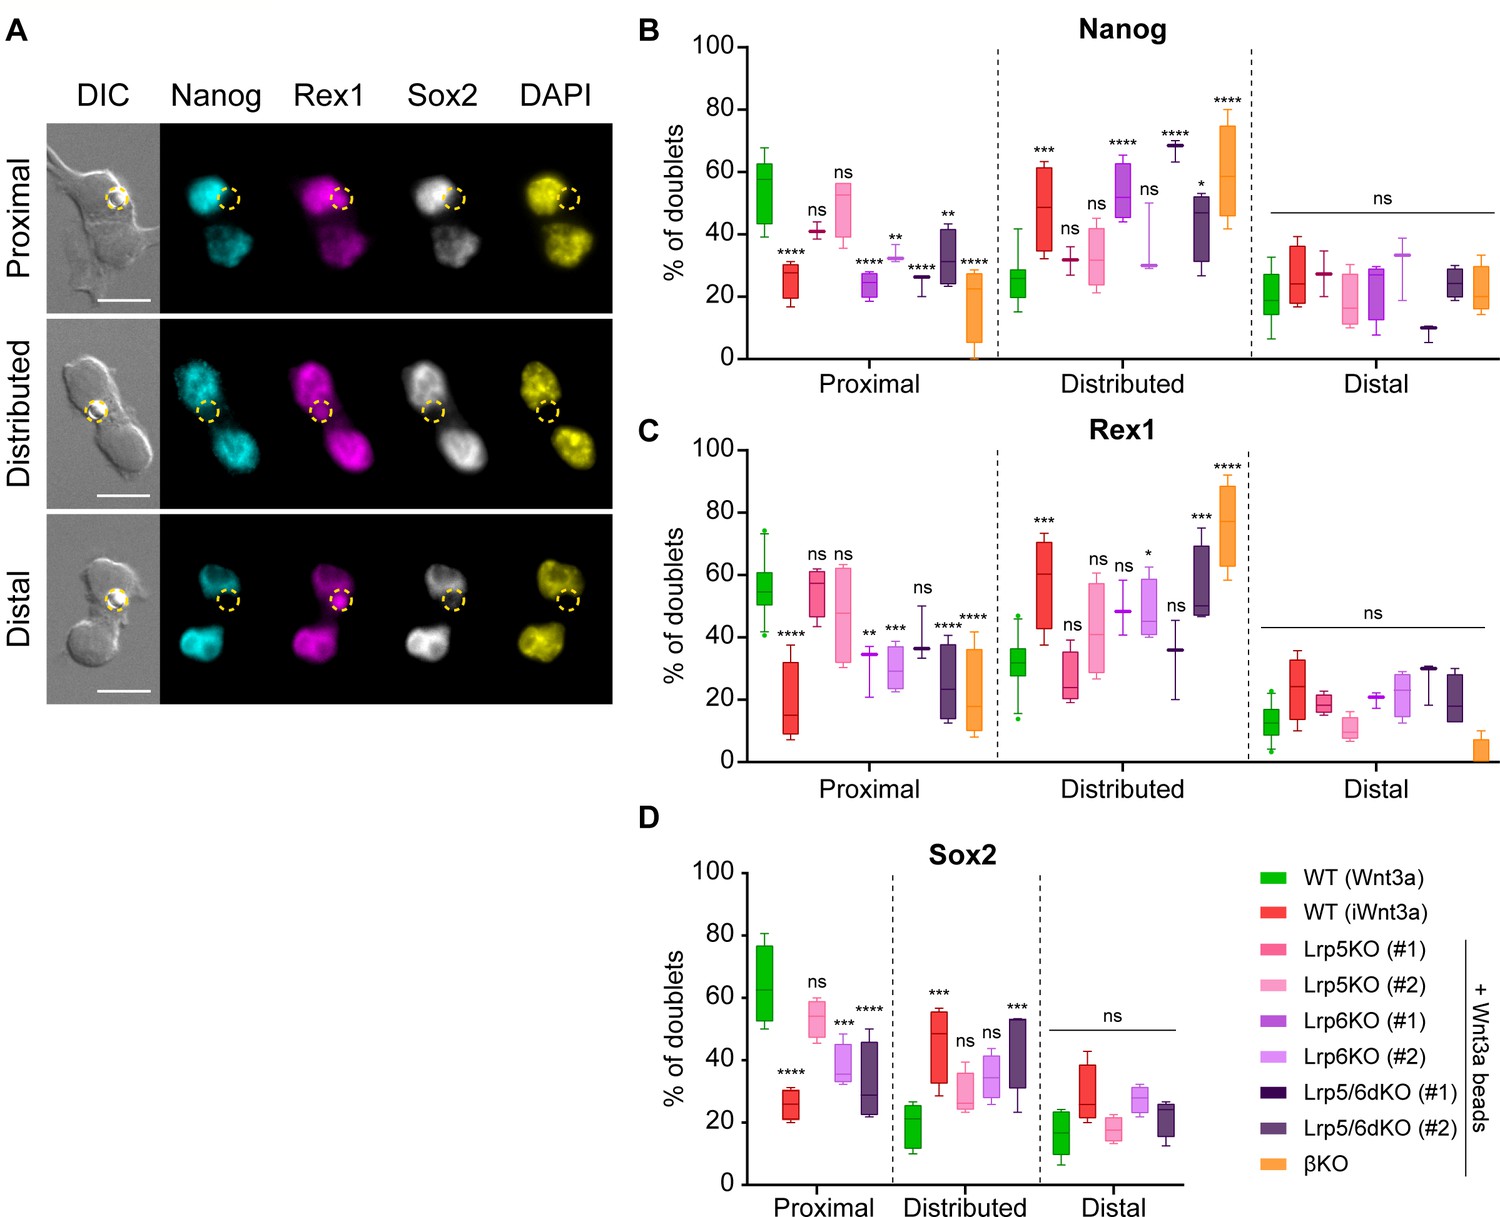
(A) Representative images of ESC doublets after dividing in contact with a Wnt3a-bead, labelled with antibodies against Nanog (cyan, AF488), Rex1 (magenta, AF555) and Sox2 (greyscale, AF647), or with 4′,6-diamidino-2-phenylindole (DAPI, yellow). Images are maximum intensity projections of a selected Z-stack. DIC is differential interference contrast. Panels display doublets with higher marker expression in the Wnt3a-bead contacting cell (top, ‘Proximal’), with equal levels of expression between both cells (middle, ‘Distributed’) or with higher marker expression in the cell not contacting the Wnt3a-bead (bottom, ‘Distal’). The Wnt3a-beads are highlighted by yellow dashed circles. Scale-bars are 20 μm. (B – C) Percentage of doublets of WT or Wnt/β-catenin KO ESCs contacting Wnt3a-beads or iWnt3a-beads in the ‘Proximal’, ‘Distributed’ or ‘Distal’ categories for Nanog (B), Rex1 (C) or Sox2 (D). n ≥ 3 experiments, with N ≥ 18 doublets/n (Nanog, Rex1) or N ≥ 28 doublets/n (Sox2). For D. only clone #2 of Lrp5KO, Lrp6KO, and Lrp5/6dKO ESCs were analysed. Box indicates median and quartiles, error bars indicate 10–90 percentile. Dots are data outside range. Stars and symbols indicate statistical significance for each condition against WT ESCs + Wnt3a beads, calculated by two-way ANOVA with Dunnett’s multiple comparison test: ns (non-significant, p>0.05), *p<0.05, **p<0.01, ***p<0.001, ****p<0.0001. Numeric data used in the figure can be found in the Source Data file.
-
Figure 9—source data 1
Numeric data used in Figure 9.
- https://cdn.elifesciences.org/articles/59791/elife-59791-fig9-data1-v3.xlsx
Figure 10
Lrp6 overexpression in Lrp5/6dKO ESCs rescues ACD.
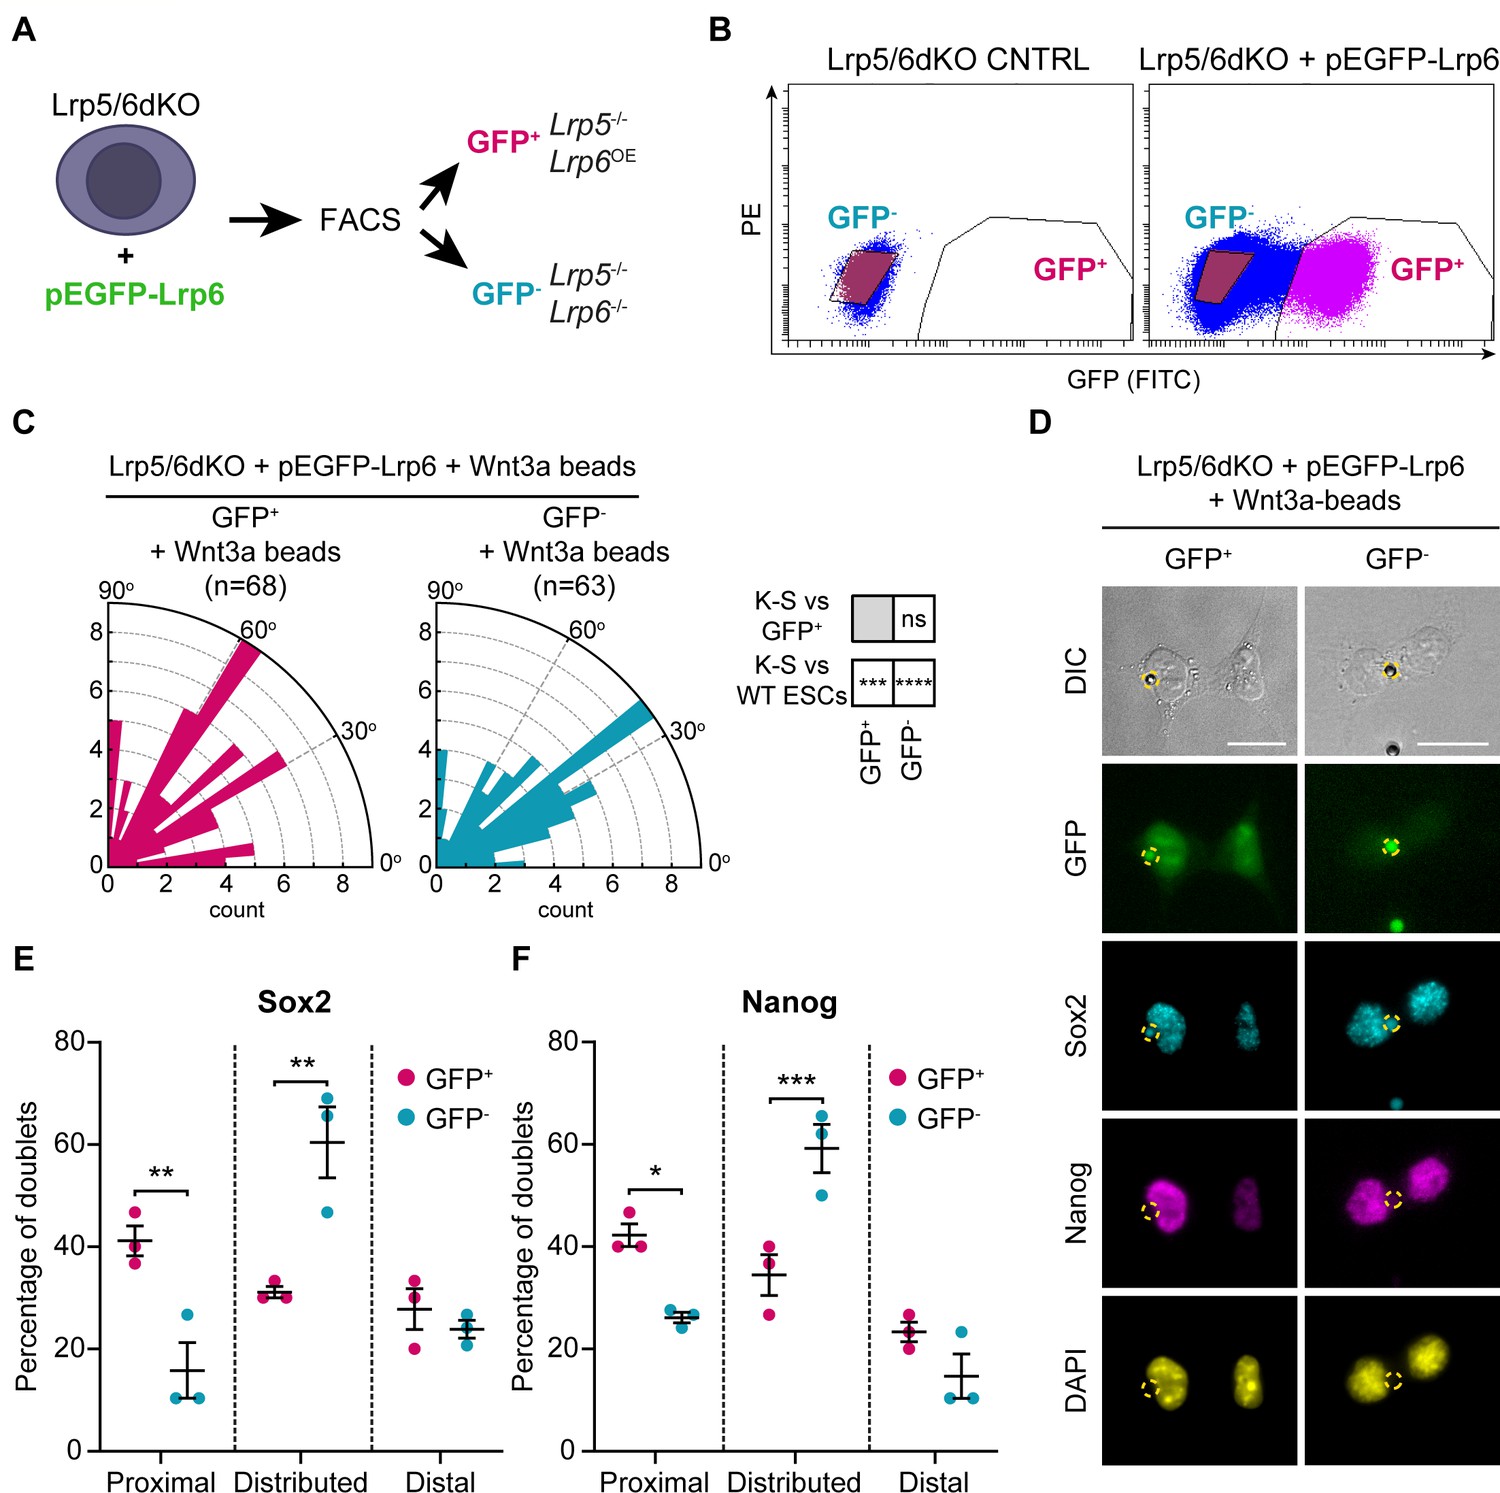
(A) Schematic of the experimental pipeline. Lrp5/6dKO (#2) ESCs were transfected with pEGFP-Lrp6 plasmids and sorted by FACS to Lrp6-expressing (GFP+) and Lrp6 non-expressing (GFP-) populations before experimentation. (B) Representative dot-plot of GFP expression levels in Lrp5/6dKO control (non-transfected) ESCs or Lrp5/6dKO ESCs transfected with pEGFP-Lrp6. GFP intensity was detected using a FITC filter. Y axis is PE. GFP- (blue) and GFP+ (magenta) cells were sorted only in the transfected condition. (C) Rose plots depicting the distribution of spindle angle orientations in GFP+ or GFP- ESCs dividing in contact with a Wnt3a-bead. Stars and symbols in boxes (right) indicate statistical significance calculated by multiple Kolmogorov-Smirnov tests against GFP+ ESCs (top) or WT ESCs dividing with a Wnt3a-bead (bottom): ns (non-significant, p>0.05), ***p<0.001, ****p<0.0001. n (number of cells) is depicted in the figure. (D) Representative images of GFP+ and GFP- ESCs after dividing with a Wnt3a-bead, stained with antibodies against Sox2 (cyan) and Nanog (magenta), or with DAPI (yellow). Wnt3a-beads are highlighted by yellow dashed circle. Scale bars are 20 μm. (E and F) Percentage of doublets in the ‘Proximal’, ‘Distributed’ or ‘Distal’ categories (described in Figure 9A) in GFP+ and GFP- ESCs stained for Sox2 (E) and Nanog (F). Mean of n = 3 independent experiments, N ≥ 29 doublets analysed per n, error bars are SEM. Stars indicate statistical significance calculated by two-way ANOVA with Šídák’s multiple comparison tests: *p<0.05, **p<0.01, ***p<0.001. Numeric data used in the figure can be found in the Source Data file.
-
Figure 10—source data 1
Numeric data used in Figure 10.
- https://cdn.elifesciences.org/articles/59791/elife-59791-fig10-data1-v3.xlsx
Figure 11
AMPA-type iGluR receptors are important for Wnt3a-oriented ACD.
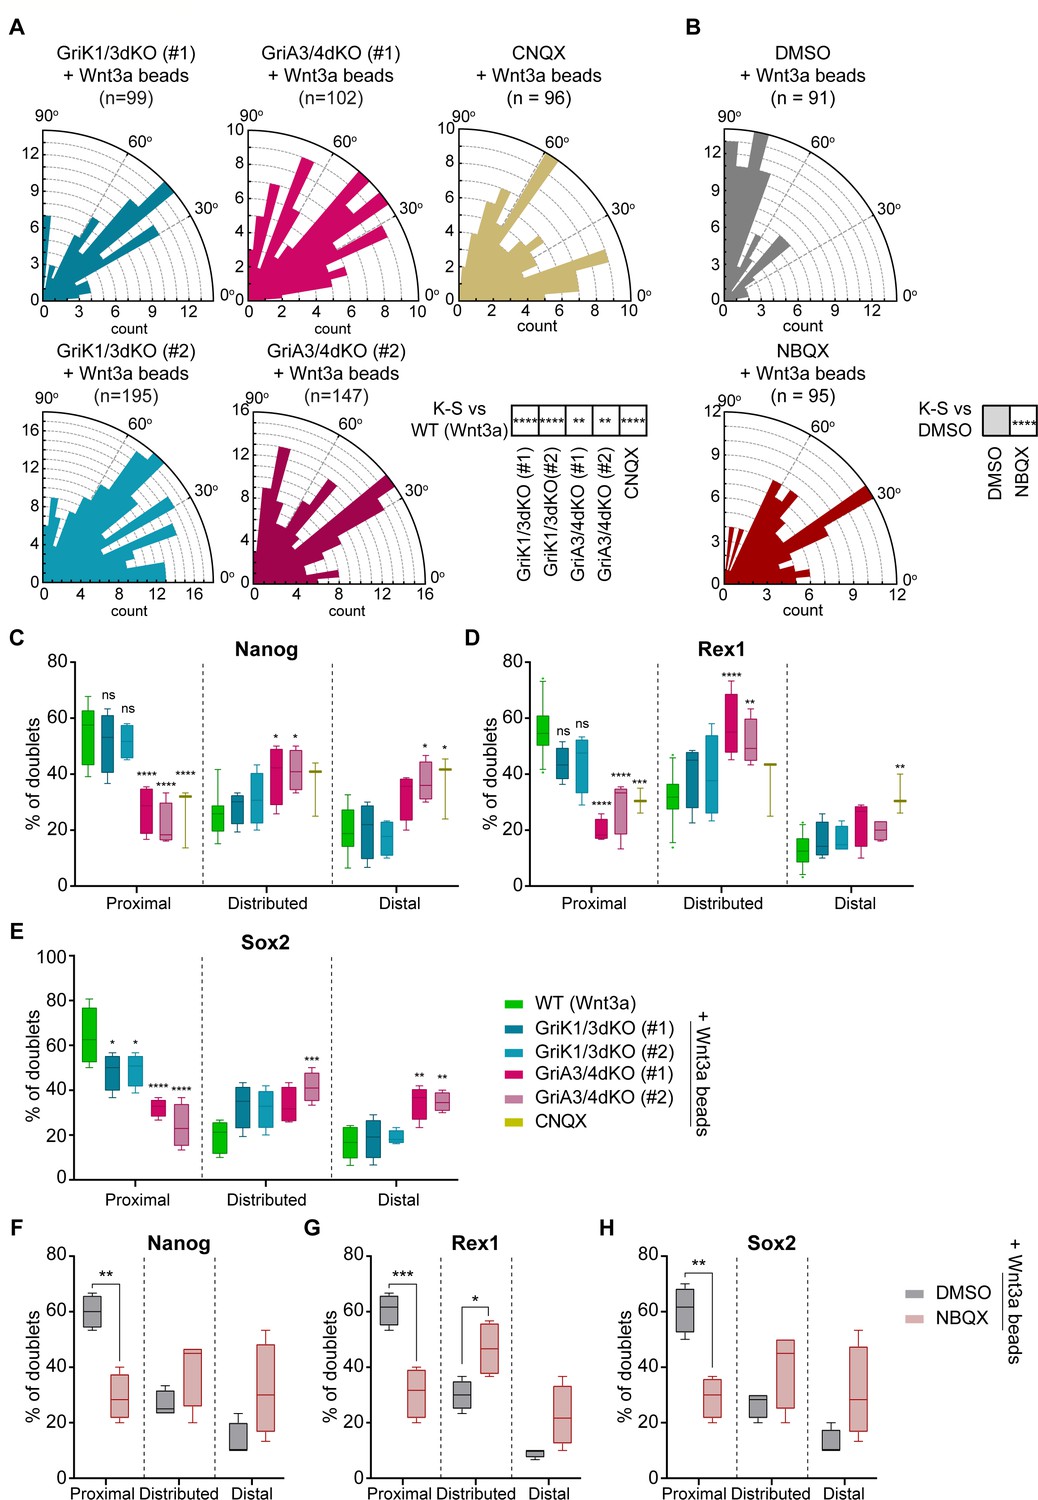
(A and B) Rose plots depicting the distribution of spindle orientations in GriK1/3dKO, GriA3/4dKO or CNQX-treated ESCs (A) or DMSO- or NBQX-treated ESCs (B) dividing with a Wnt3a-bead. n (number of cells analysed) is stated in the figures. Stars in boxes indicate statistical significance calculated by multiple Kolmogorov-Smirnov test against WT ESCs + Wnt3a-beads (in A) or DMSO-treated ESCs + Wnt3a-beads (in B): **p<0.01, ****p<0.0001. (C – E) Percentage of doublets in the ‘Proximal’, ‘Distributed’ or ‘Distal’ categories (described in Figure 9A) for WT, GriK1/3dKO, GriA3/4dKO, or CNQX-treated ESCs that have divided with Wnt3a-beads. Quantification for Nanog (C), Rex1 (D), or Sox2 (E). n ≥ 3 experiments, with N ≥ 18 doublets/n (Nanog, Rex1) or N ≥ 30 doublets/n (Sox2). Box indicates median and quartiles, error bars indicate 10–90 percentile. Dots are data outside range. Stars and symbols indicate statistical significance calculated by two-way ANOVA with Dunnett’s multiple comparison test: ns (non-significant, p>0.05), *p<0.05, **p<0.01, ***p<0.001, ****p<0.0001. WT ESC data from Figure 9B-D presented for comparison. (F – H) Percentage of doublets in the ‘Proximal’, ‘Distributed’ or ‘Distal’ categories (described in Figure 9A) for DMSO- or NBQX-treated ESCs that have divided with a Wnt3a-bead. Quantification for Nanog (F), Rex1 (G) or Sox2 (H). n = 4 experiments, with N = 30 doublets/n. Box indicates median and quartiles, error bars indicate 10–90 percentile. Stars indicate statistical significance calculated by two-way ANOVA with Šídák’s multiple comparison tests: *p<0.05, **p<0.01, ***p<0.001. Numeric data used in the figure can be found in the Source Data file.
-
Figure 11—source data 1
Numeric data used in Figure 11.
- https://cdn.elifesciences.org/articles/59791/elife-59791-fig11-data1-v3.xlsx
Videos
Video 1
WT ESC cytonemes.
High-quality images of the dynamic cytonemes of WT ESCs. Cells were stained with CellMask Deep Red and imaged in a spinning disk confocal microscope every 10 s, for 10 min. Images are presented as inverted greyscale. Yellow boxes are magnifications, contrast-enhanced for clarity. Time is min and s. Scale bar, 10 μm.
Video 2
Lrp5KO ESC cytonemes.
High-quality images of the dynamic cytonemes of Lrp5KO ESCs (clone #1 and #2). Cells were stained and imaged as described for Video 1. Images are presented as inverted greyscale. Yellow boxes are magnifications, contrast-enhanced for clarity. Time is min and s. Scale bar, 10 μm.
Video 3
Lrp6KO ESC cytonemes.
High-quality images of the dynamic cytonemes of Lrp6KO ESCs (clone #1 and #2). Cells were stained and imaged as described for Video 1. Images are presented as inverted greyscale. Yellow boxes are magnifications, contrast-enhanced for clarity. Time is min and s. Scale bar, 10 μm.
Video 4
Lrp5/6dKO ESC cytonemes.
High-quality images of the dynamic cytonemes of Lrp5/6dKO ESCs (clone #1 and #2). Cells were stained and imaged as described for Video 1. Images are presented as inverted greyscale. Yellow boxes are magnifications, contrast-enhanced for clarity. Time is min and s. Scale bar, 10 μm.
Video 5
βKO ESC cytonemes.
High-quality images of the dynamic cytonemes of βKO ESCs. Cells were stained and imaged as described for Video 1. Images are presented as inverted greyscale. Yellow boxes are magnifications, contrast-enhanced for clarity. Time is min and s. Scale bar, 10 μm.
Video 6
Tracking of ESCs and Wnt3a-beads.
Time-course live-cell brightfield images of a WT or Lrp6KO ESC interacting with a Wnt3a-bead. Cell centre and Wnt3a-bead were tracked for 180 min, and the tracks are displayed. Scale bars, 20 μm.
Video 7
GriA3/4dKO ESC cytonemes.
High-quality images of the dynamic cytonemes of GriA3/4dKO ESCs (clones #1 and #2). Cells were stained and imaged as described for Video 1. Images are presented as inverted greyscale. Yellow boxes are magnifications, contrast-enhanced for clarity. Time is min and s. Scale bar, 10 μm.
Video 8
GriK1/3dKO ESC cytonemes.
High-quality images of the dynamic cytonemes of GriK1/3dKO ESCs (clone #1 and #2). Cells were stained and imaged as described for Video 1. Images are presented as inverted greyscale. Yellow boxes are magnifications, contrast-enhanced for clarity. Time is min and s. Scale bar, 10 μm.
Video 9
Spindle orientation in dividing ESCs with Wnt3a-beads.
Time-course live-cell bright-field images of a WT ESC dividing with Wnt3a-beads at ~90o, ~45o or ~0o. Spindle orientation angle was always measured at anaphase. White lines in stills indicate minor and major axis of the cell. Yellow line indicates the position of the Wnt3a-bead relative to the minor axis. Scale bars, 20 μm.
Additional files
-
Source code 1
Custom Python script used to generate Rose-plots.
- https://cdn.elifesciences.org/articles/59791/elife-59791-code1-v3.zip
-
Transparent reporting form
- https://cdn.elifesciences.org/articles/59791/elife-59791-transrepform-v3.docx
Download links
A two-part list of links to download the article, or parts of the article, in various formats.
Downloads (link to download the article as PDF)
Open citations (links to open the citations from this article in various online reference manager services)
Cite this article (links to download the citations from this article in formats compatible with various reference manager tools)
Wnt- and glutamate-receptors orchestrate stem cell dynamics and asymmetric cell division
eLife 10:e59791.
https://doi.org/10.7554/eLife.59791


