Leptin suppresses development of GLP-1 inputs to the paraventricular nucleus of the hypothalamus
- Department of Molecular Physiology and Biophysics, Vanderbilt University School of Medicine, United States
- Department of Pharmacology, University of Virginia School of Medicine, United States
Figures
Figure 1
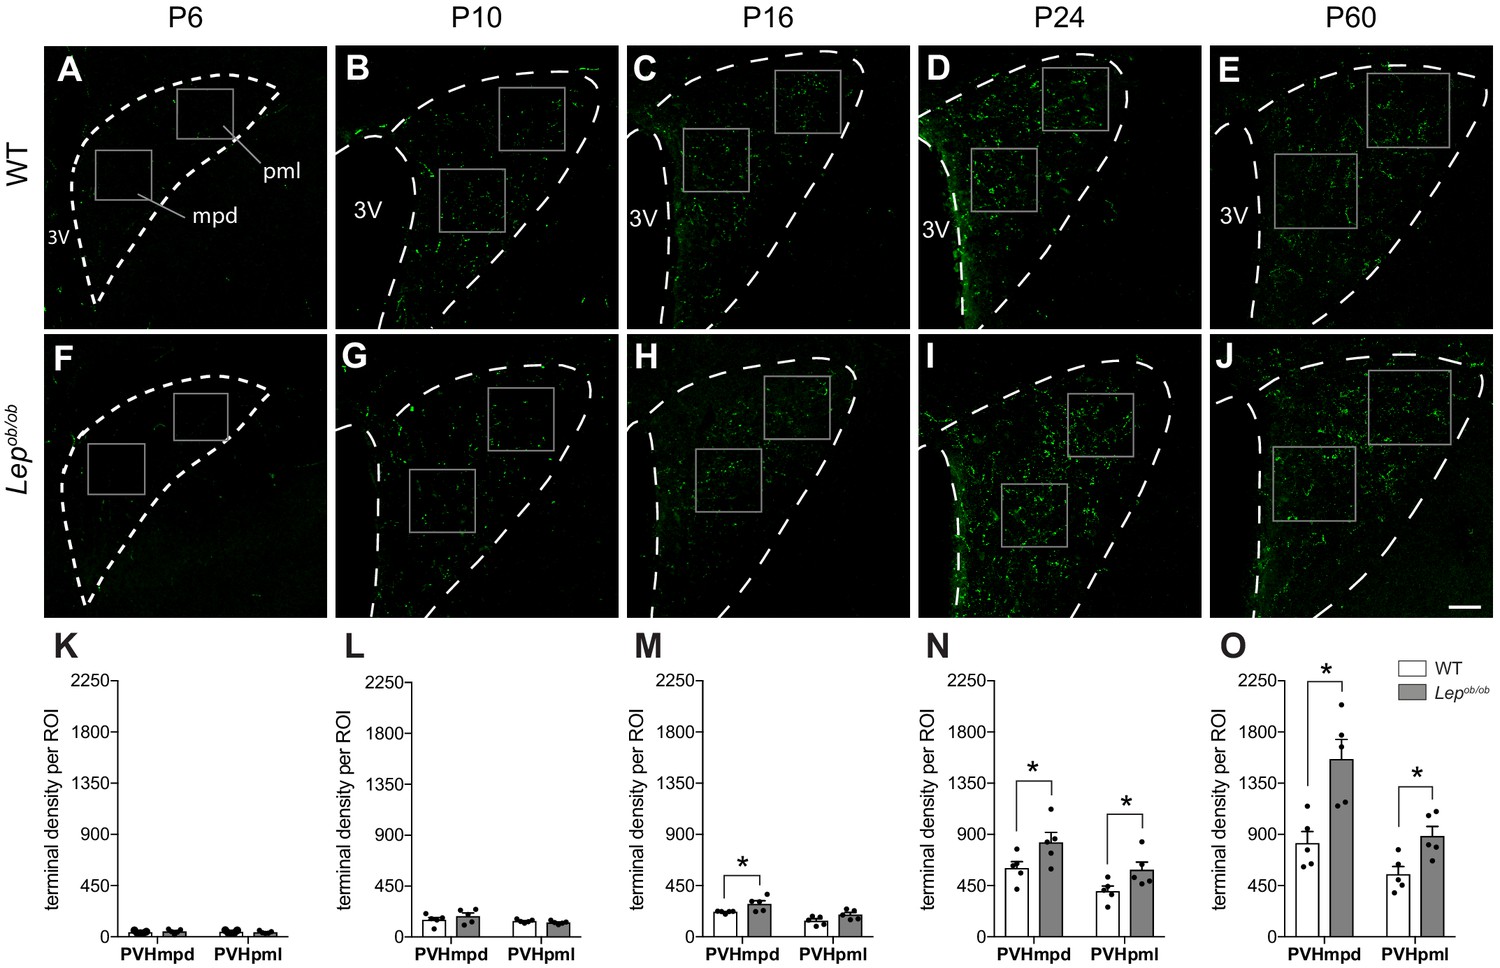
Ontogeny of GLP-1 projections into the PVH.
Maximum intensity projections of confocal images through the PVH of WT (A–E) and Lepob/ob (F–J) mice illustrate the density of GLP-1 immunoreactive fibers (green) present at postnatal ages P6, P10, P16, P24, and P60. In WT mice, GLP-1 fibers first reach the PVH at P6 and continue to increase in density over time, reaching maturity by 2 months of age. In Lepob/ob mice, a significant increase in GLP-1 fiber density emerged at P16 and was maintained into adulthood. Boxes indicate location of ROIs used for quantitative analysis. Student's t-test was used to test for significant differences between genotypes at each age examined. Asterisk denotes p-values<0.05. Abbreviations: 3V, third ventricle; mpd, dorsal zone of the medial parvicellular compartment of the PVH; pml, lateral zone of the posterior magnocellular compartment of the PVH. Error bars indicate mean ± SEM; circles represent individual values; N = 5 for each group. Scale bar is 50 μm.
Figure 2 with 1 supplement

Leptin receptor-expressing neurons in the NTS are responsive to leptin during early postnatal development and project to the PVH.
(A), (B) Representative images of pSTAT3 immunoreactivity (green) in LepRb-Cre::tdTom mice injected with leptin or saline control at P16. (C), (D) Representative images of pSTAT3 immunoreactivity in GCG-Cre::SynTom mice injected with leptin or saline control at P16. (E) Percentage of LepRb and PPG neurons in the NTS that are responsive to leptin. (F, G) LepRb-expressing neurons are visualized by injection of AAV-EGFP virus into the NTS of a LepRb-Cre mouse. (H) Densely labeled terminals in the PVH from LepRb-expressing neurons in the NTS. N = 3 for each group. Abbreviations: 3V, third ventricle; AP, area postrema; DMX, dorsal motor nucleus of the vagus; NTSco, commissural nucleus of the solitary tract; NTSm, medial nucleus of the solitary tract; NTSl, lateral nucleus of the solitary tract; cc, central canal.
Figure 2—figure supplement 1
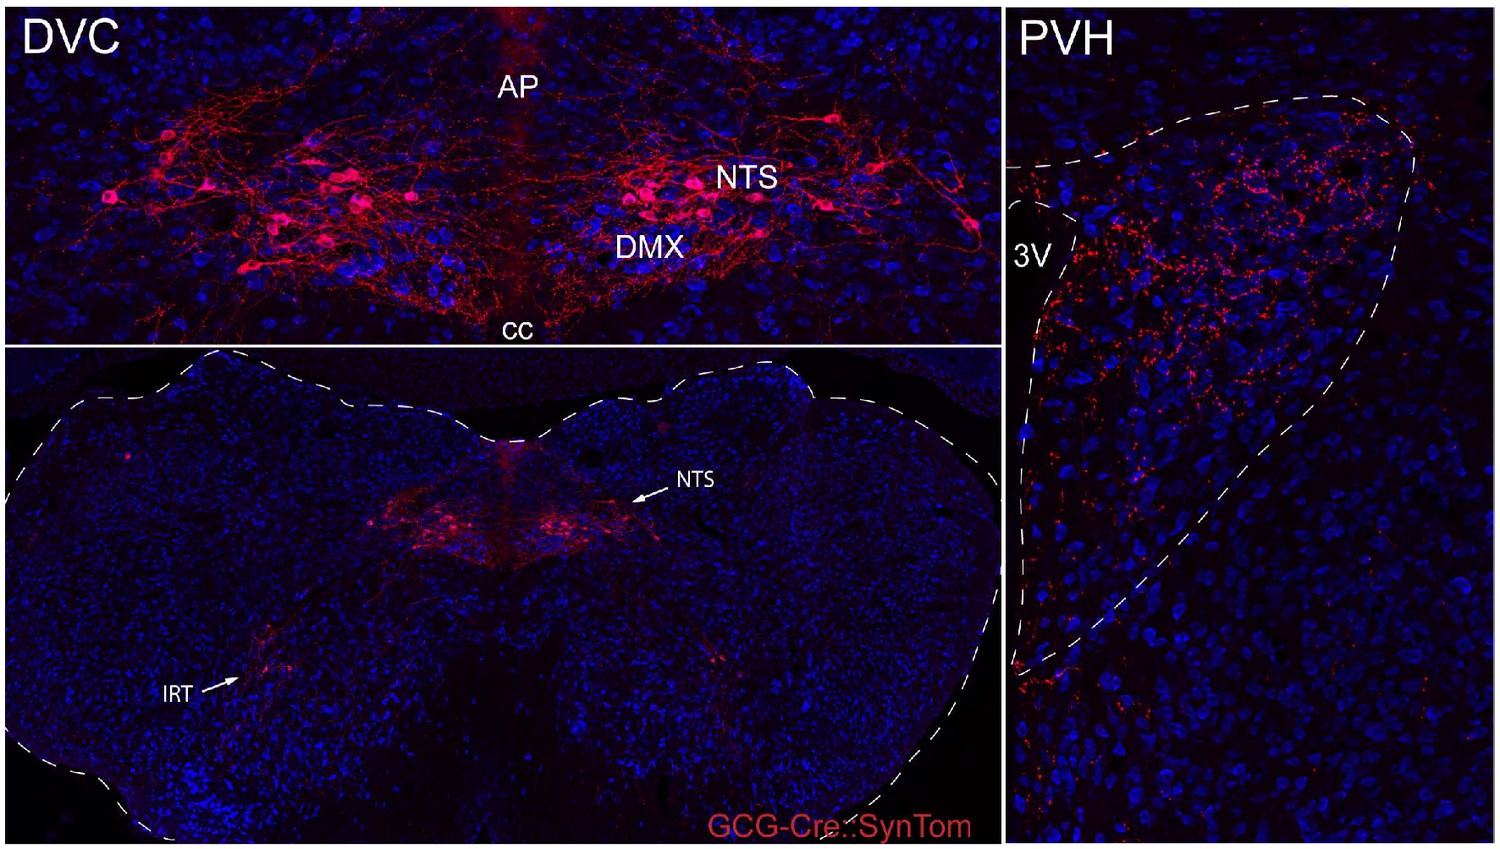
Distribution of GCG-Cre::SynTom expression in the hindbrain and hypothalamus.
GCG-Cre mice were crossed with mice carrying a fluorescent reporter synaptophysin-tdTomato fusion protein to visualize PPG neurons and their inputs. Neurons expressing GCG-Cre::SynTom (PPG neurons) were detected primarily in the NTS, and a second small population of neurons was identified in the IRT. Dense GCG-Cre::SynTom-labeled inputs were observed in the PVH.
Figure 3
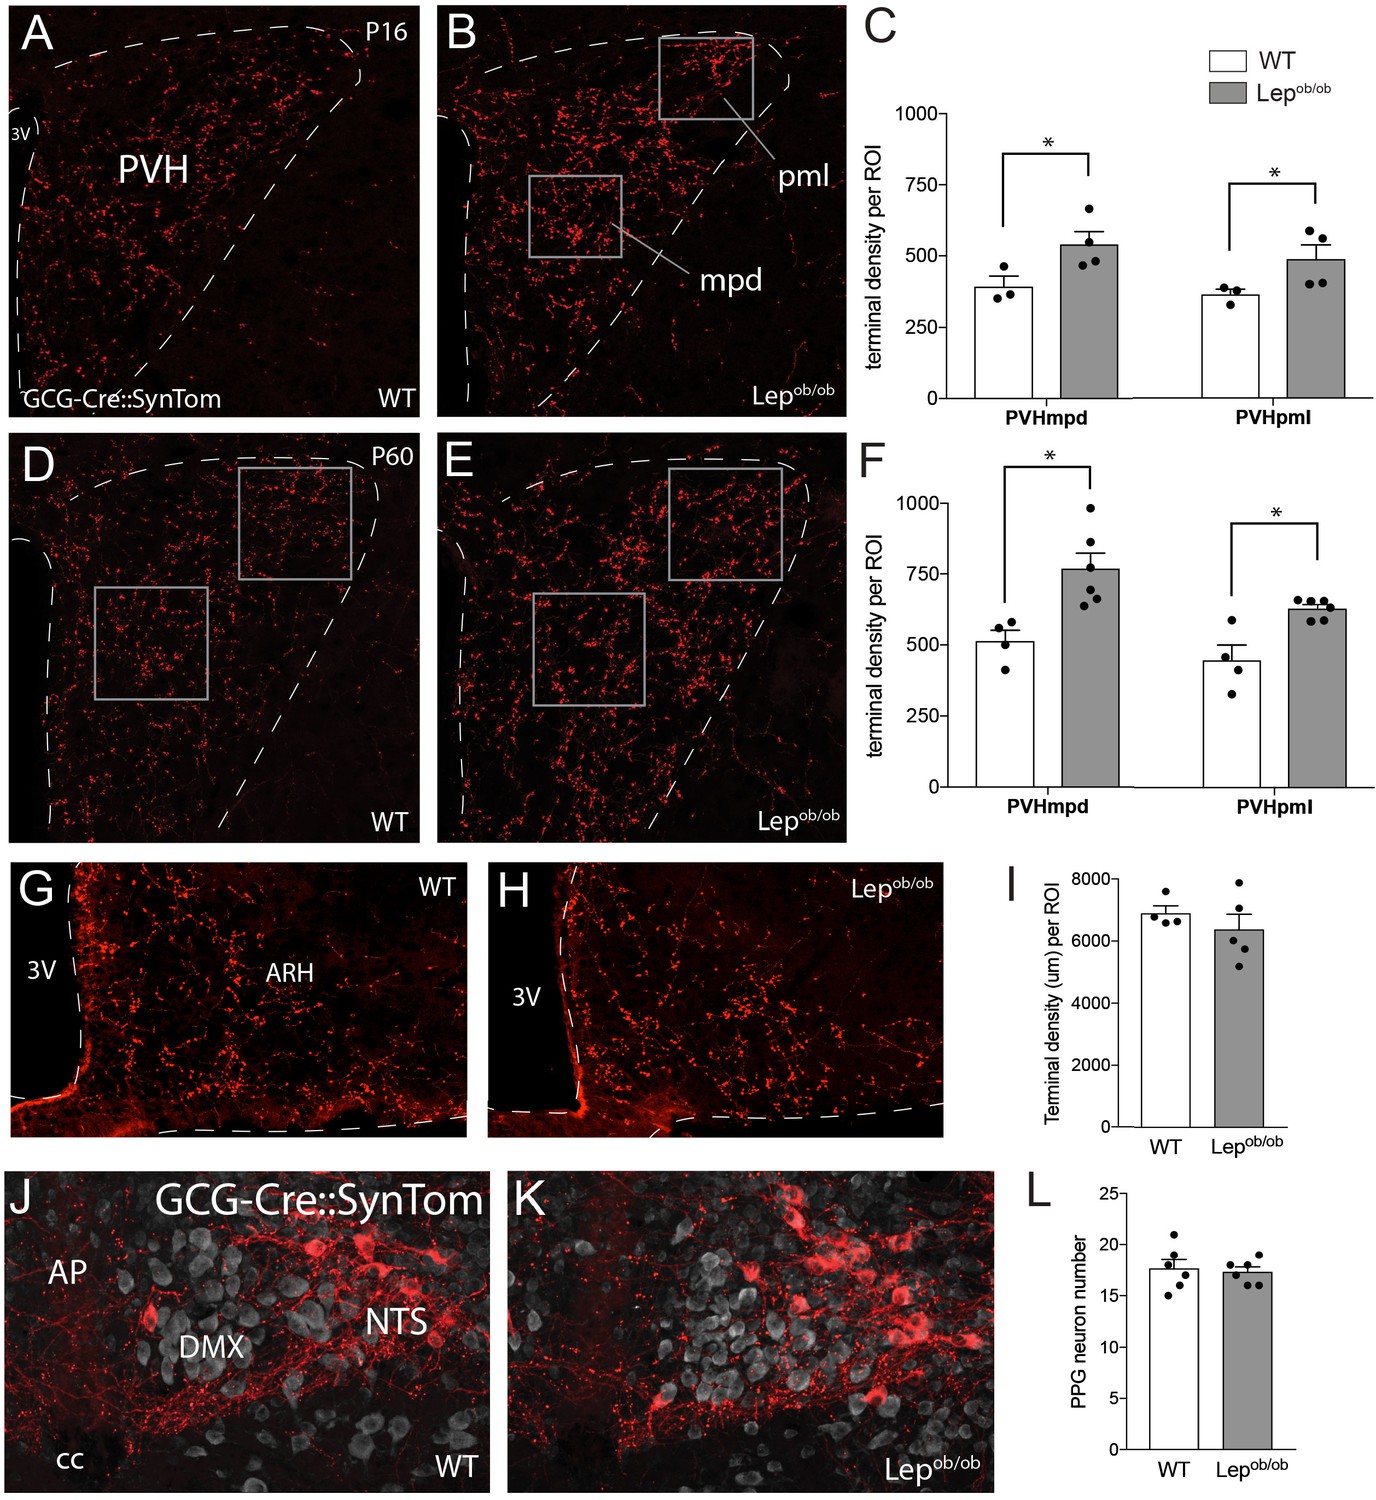
Axonal labeling of projections from PPG neurons to the PVH are increased in leptin-deficient mice.
Genetic targeting of SynTom fluorescence to axons derived from PPG neurons revealed a significant increase in the density of GLP-1 projections to the PVHmpd and PVHpml in Lepob/ob mice. Quantitative analysis confirmed that fiber densities in both the mpd and pml (ROI location denoted by boxes) were apparent by P16 (A–C), and were maintained into adulthood (D–F). Leptin does not impact the density of GLP-1 inputs to the ARH, as no changes in GCG-Cre::SynTom fluorescence were identified in WT or Lepob/ob mice (G–I). No difference in the number of PPG neurons was detected between groups of adult mice (J–L). Error bars indicate mean ± SEM; circles represent individual values. Student's t-test was used to test for significant differences between genotypes at each age examined. Asterisk denotes p-values<0.05. Images are maximum intensity projections from confocal image stacks taken through 30 μm-thick sections. P16 GCG-Cre::SynTom::WT N = 3; P16 GCG-Cre::SynTom::Lepob/obN = 4; P60 GCG-Cre::SynTom::WT N = 4; P60 GCG-Cre::SynTom::Lepob/obN = 6, PPG neurons: N = 6 for each group. Abbreviations: 3V, third ventricle; mpd, dorsal zone of the medial parvicellular compartment of the PVH; pml, lateral zone of the posterior magnocellular compartment of the PVH; ARH, arcuate nucleus of the hypothalamus; AP, area postrema; DMX, dorsal motor nucleus of the vagus; NTS, nucleus of the solitary tract; cc, central canal. Scale bar is 50 μm.
Figure 4
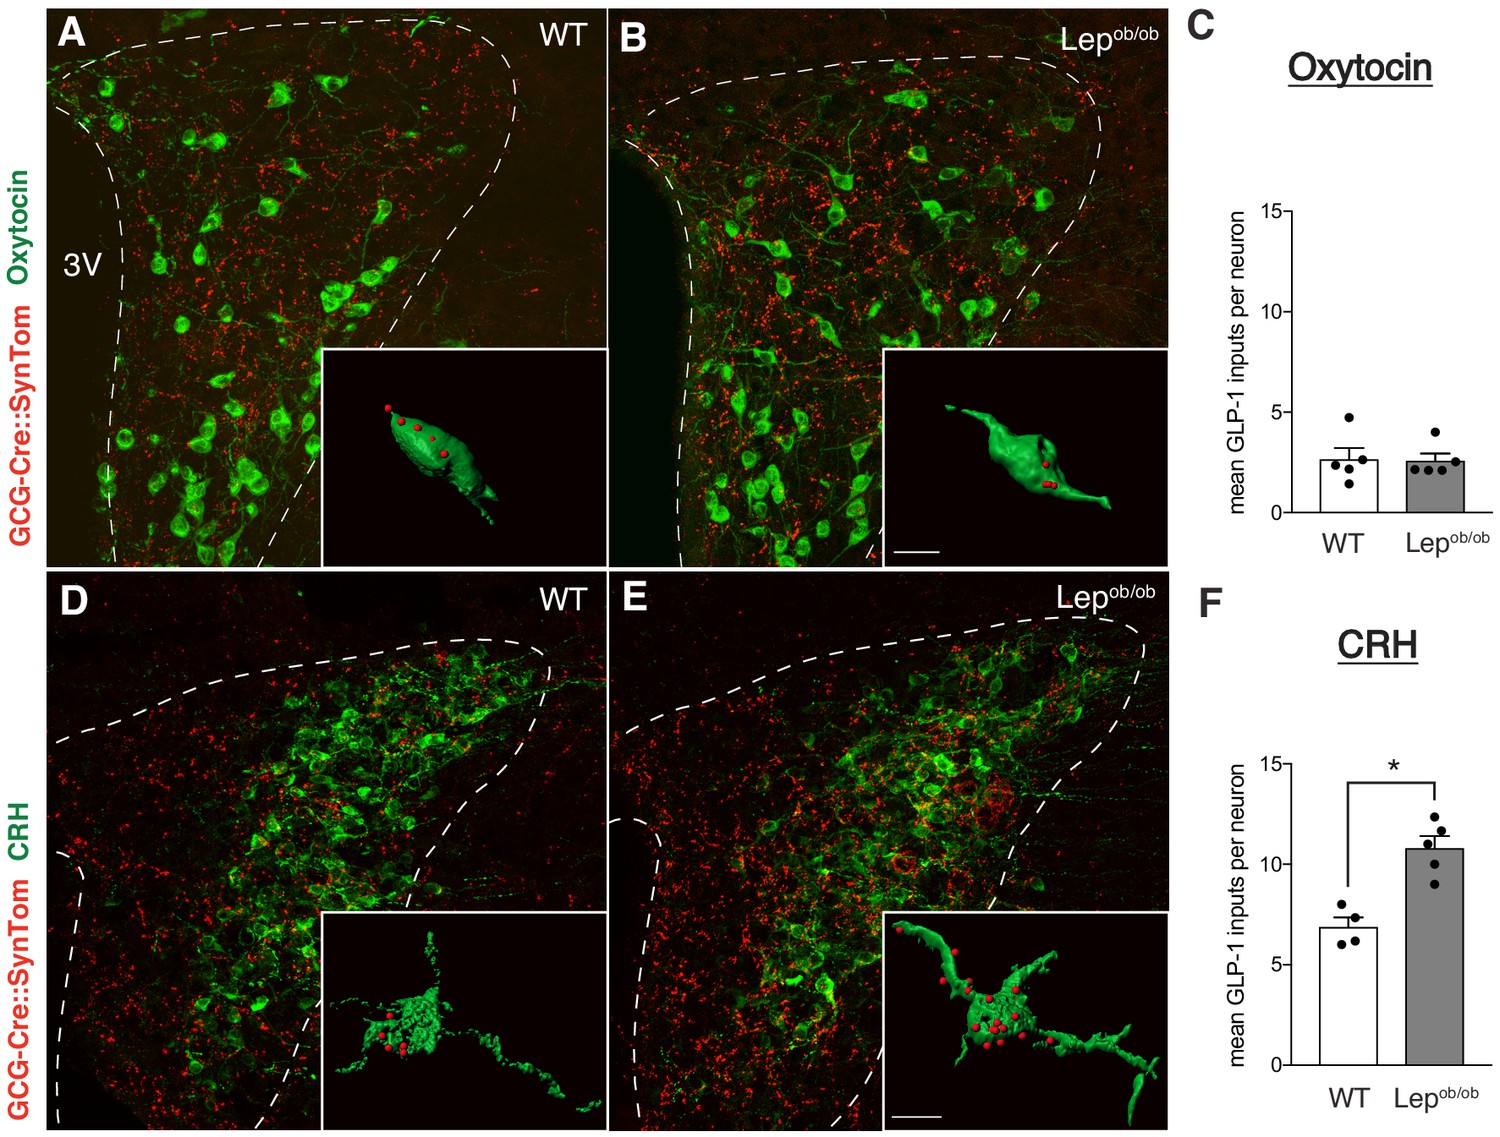
Target-specific enhancement of GLP-1 inputs to CRH neurons in leptin-deficient mice.
Images (maximum intensity projections of confocal images) showing GLP-1 axonal labeling (red) onto Oxytocin- (A,B), or CRH-immunoreactive (D,E) neurons (green) in the PVH of GCG-Cre::SynTom::WT and GCG-Cre::SynTom::Lepob/ob mice. Insets illustrate 3D reconstructions of GLP-1 inputs onto Oxytocin and CRH neurons in GCG-Cre::SynTom::WT and GCG-Cre::SynTom::Lepob/ob mice, respectively. Quantitative analysis of GLP-1 inputs onto PVH neurons revealed a significant increase onto CRH (F), but not Oxytocin (C) neurons in GCG-Cre::SynTom::Lepob/ob mice, compared with that of GCG-Cre::SynTom::WT mice. Error bars indicate mean ± SEM; circles represent individual values. Student's t-test was used to test for significant differences between genotypes for each cell type (CRH or Oxytocin) examined. Asterisk denotes p-values<0.05. Oxytocin: GCG-Cre::SynTom::WT N = 5; GCG-Cre::SynTom::Lepob/obN = 5; CRH: GCG-Cre::SynTom::WT N = 4 GCG-Cre::SynTom::Lepob/obN = 5. Scale bar is 50 μm, inset scale bar is 10 μm.
Figure 5
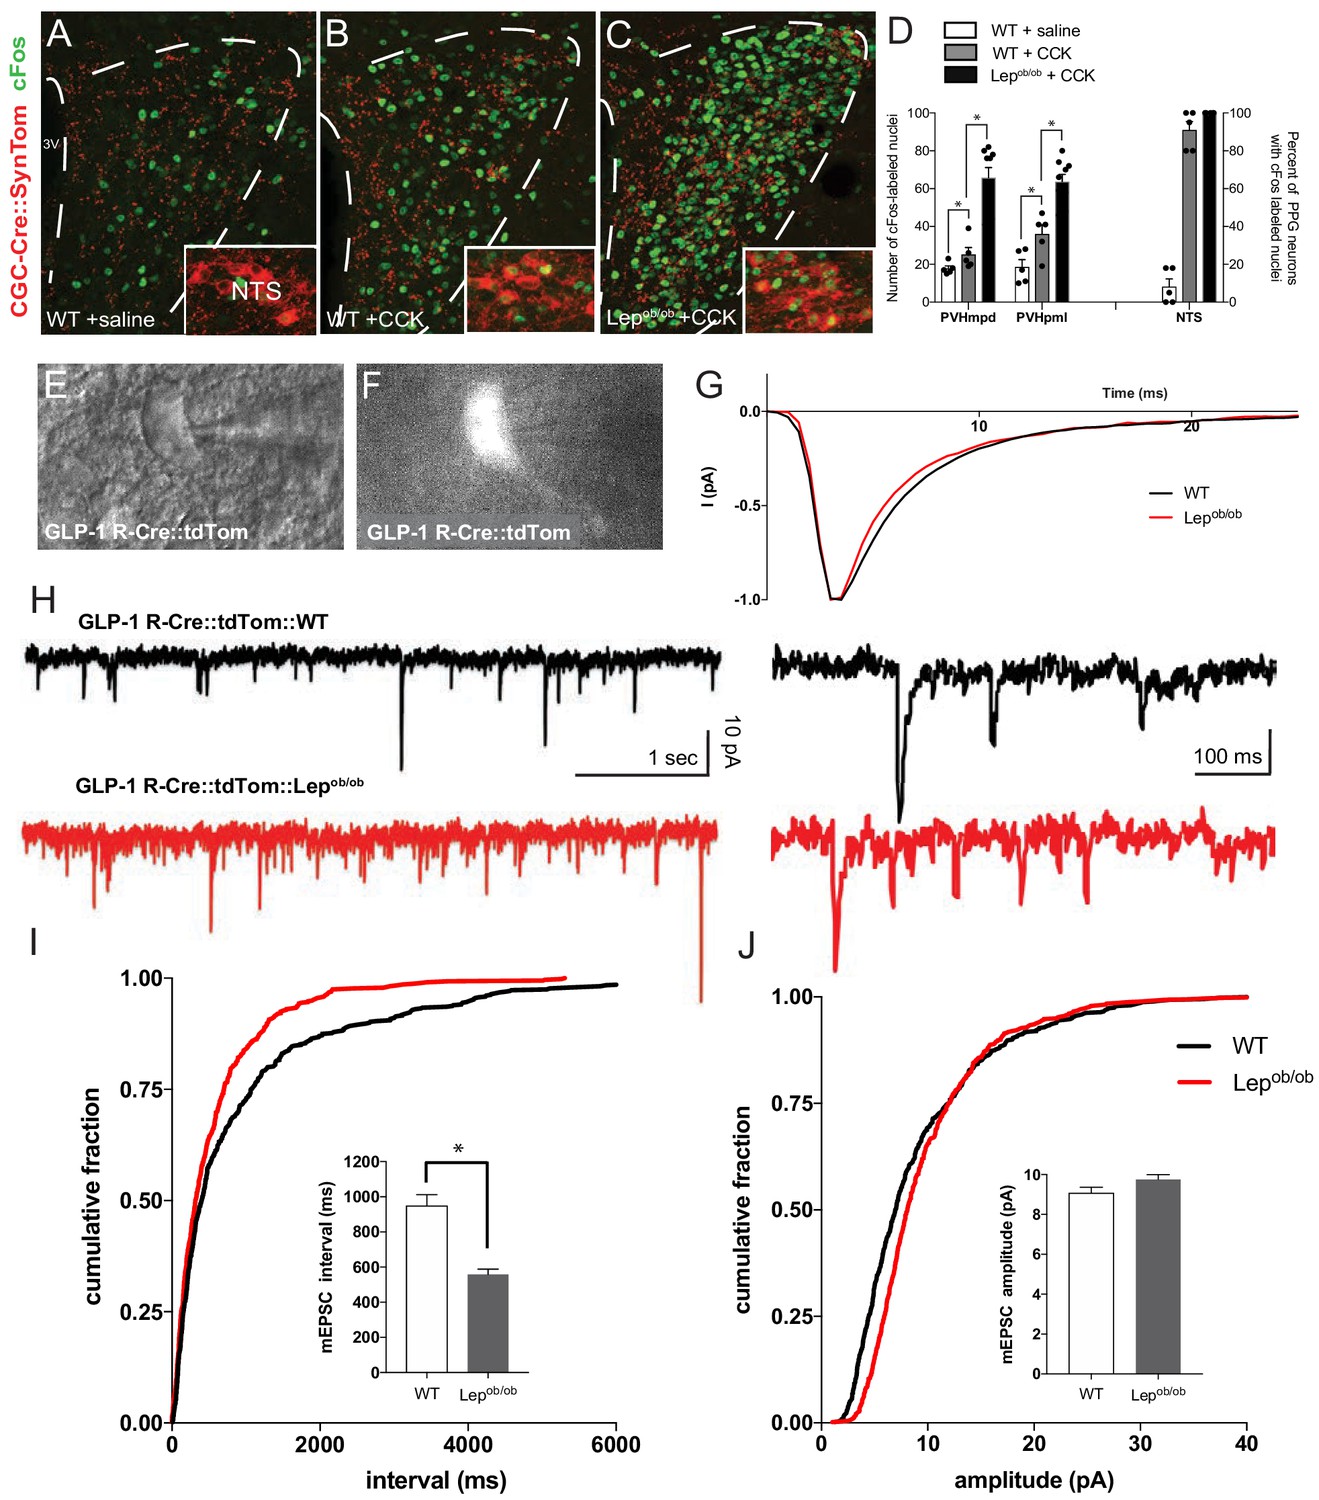
Viscerosensory transmission to the PVH is disrupted in leptin-deficient mice.
Compared with saline-injected controls (A), i.p. injection of CCK increased the number of Fos immunoreactive nuclei (green) in the PVH (B,C), and within PPG-labeled neurons (red) in the NTS (insets) of adult mice. GCG-Cre::SynTom::Lepob/ob mice showed a significant increase in the number of Fos-labeled nuclei in the PVH (C), compared with that observed in CCK injected WT mice (B), or saline-injected controls (A). Images are maximum intensity projections from confocal image stacks. Quantitative comparison between the density of Fos labeling in the PVH of WT mice treated with saline (white bars), WT mice treated with CCK (gray bars) or Lepob/ob mice treated with CCK (black bars) confirmed the apparent induction in Fos labeling in Lepob/ob mice (D). The percentage of PPG neurons in the NTS labeled with Fos in each group is shown at right. GCG-Cre::SynTom::WT + saline N = 5, GCG-Cre::SynTom::WT + CCK N = 5, GCG-Cre::SynTom::Lepob/ob + CCK N = 7. Representative DIC image of identified PVH neuron used for whole-cell patch recording from acute brain slice derived from adult GLP-1 R-Cre::tdTom mouse (E). Fluorescence image from the same field of view as in E, illustrating tdTomato-labeling (F). Average rise and decay times of mEPSC events normalized to peak current did not differ between WT and Lepob/ob mice (G). Representative traces of mEPSC recordings from a GLP1-R neuron in the PVH of WT (black traces) and Lepob/ob mice (red traces) mice (H). Cumulative mEPSC inter-event interval (I) and amplitude (J) with bar graphs showing the averaged data for 14 neurons. Mean mEPSC frequency was significantly increased in Lepob/ob mice. GLP-1 R-Cre::tdTom::WT N = 4 animals, 14 neurons; GLP-1 R-Cre::tdTom::Lepob/obN = 6 animals, 14 neurons. Student's t-test was used to test for significant differences between treatment group. Asterisk denotes p-values<0.05. Error bars indicate mean ± SEM; circles represent individual values.
Figure 6
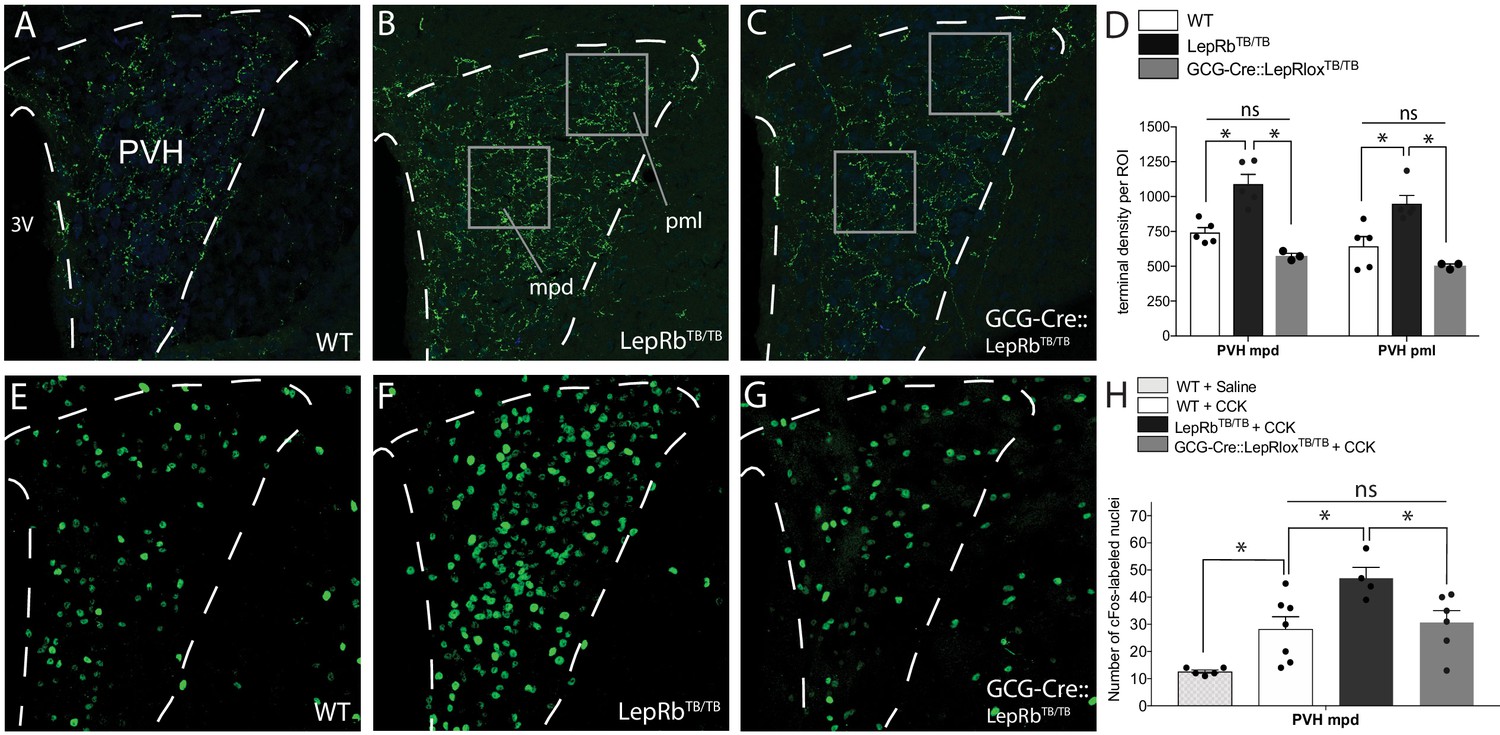
Cell-autonomous action of leptin in the NTS specifies the density and activity of GLP-1 inputs to PVH neurons.
Compared with WT mice (A), mice functionally null for LepRb (LepRbTB/TB mice) exhibited increased GLP-1-immunoreactive fiber density in both the mpd and pml compartments of the PVH (B), similar to that observed in Lepob/ob mice. Restoration of LepRb expression in PPG neurons (GCG-Cre::LepRbTB/TB mice) reduced the density of GLP-1-immunoreactive fibers in the PVHmpd and PVHpml (C). Boxes indicate locations of the ROIs used for quantitative comparisons between groups (D). Activation of vagal afferents by CCK injection resulted in an increased number of Fos-labeled nuclei in the PVHmpd of LepRbTB/TB mice (F) compared with WT mice that received either saline or CCK (E, H). Restoration of LepRb in PPG neurons (GCG-Cre::LepRbTB/TB mice) normalized the number of Fos immunoreactive nuclei similar to those observed in the PVHmpd of WT mice (G, H). Abbreviations, 3V, third ventricle; mpd, dorsal zone of the medial parvicellular compartment of the PVH; pml, lateral zone of the posterior magnocellular compartment of the PVH. Error bars indicate mean ± SEM; circles represent individual values. One-way ANOVA was used to test for significant differences between genotypes, followed by post-hoc comparisons. Asterisk denotes p-values<0.05. Sample sizes for GLP-1 immunolabeling: WT N = 6, LepRbTB/TBN = 5, GCG-Cre::LepRbTB/TBN = 3. Sample sizes for CCK-induced Fos immunoreactivity: WT+ Saline N = 5, WT+ CCK N = 7, LepRbTB/TB + CCK N = 4, GCG-Cre::LepRbTB/TB + CCK N = 6.
Figure 7
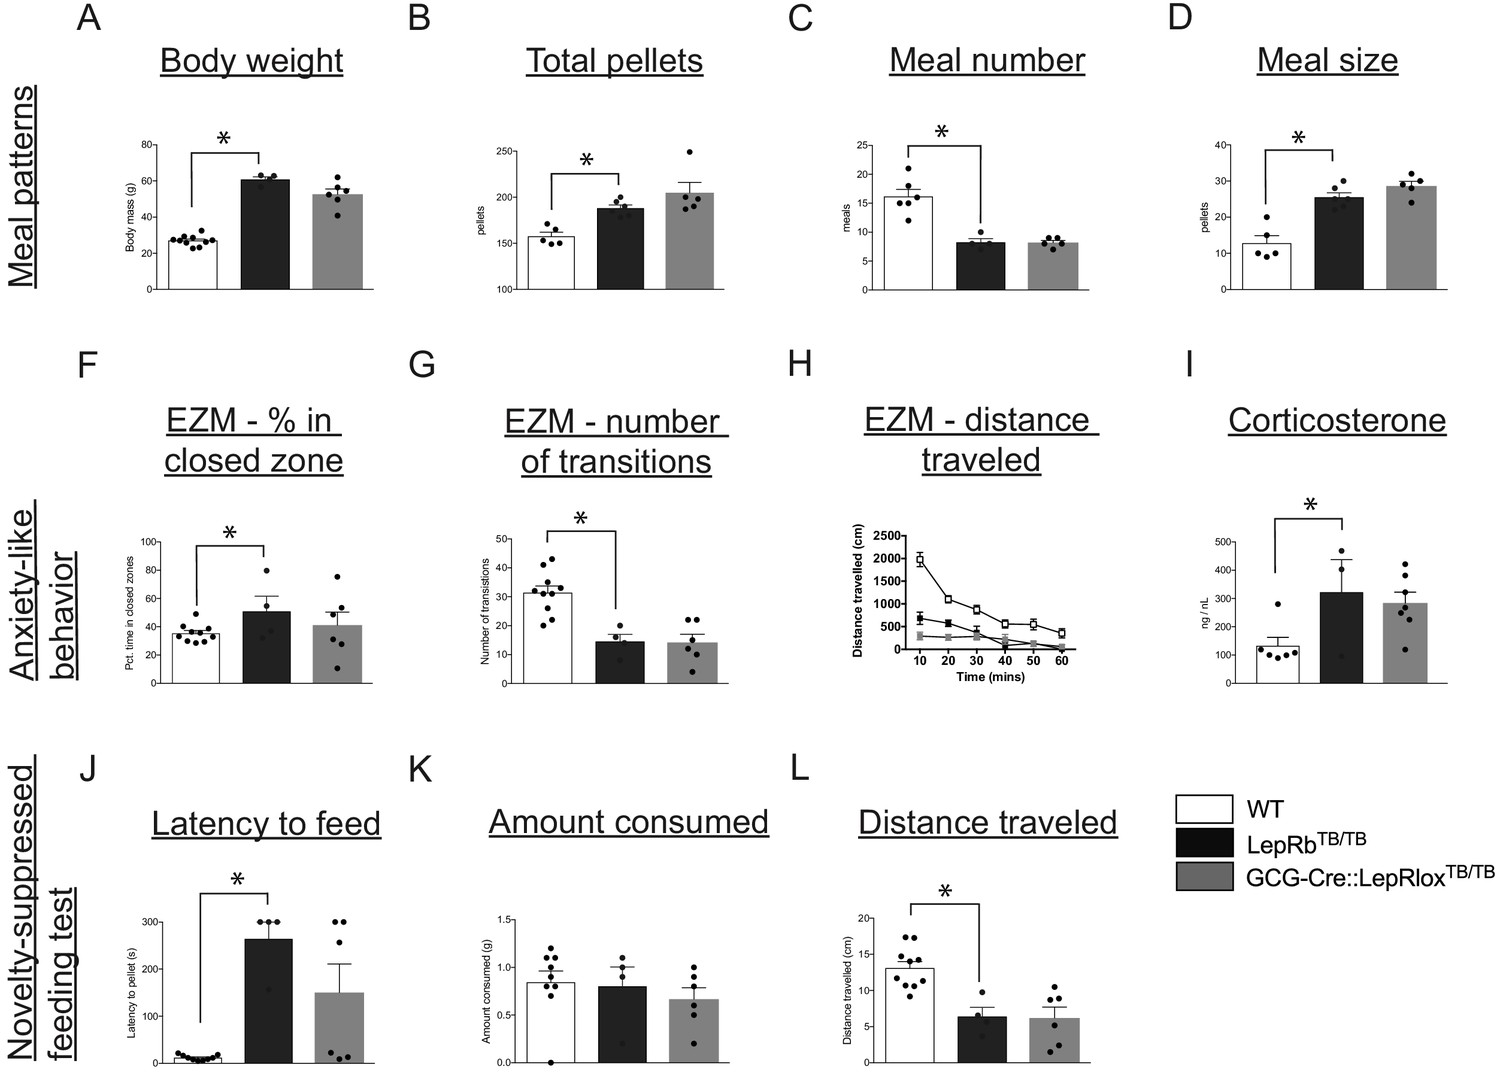
Leptin’s action on PPG neurons is not sufficient to restore food intake and anxiety-like behavior in leptin receptor-deficient mice.
Compared with WT controls, LepRbTB/TB mice displayed increased body weight (A), increased total pellets consumed (B), decreased meal number (C) and increased meal size (D). Restoration of LepRb expression in PPG neurons (GCG-Cre::LepRbTB/TB mice) did not lead to normalization of any meal pattern parameters measured (A–D). Compared with WT controls, LepRbTB/TB mice demonstrated increased percent of time spent in the closed zone of the elevated zero maze (F), decreased number of transitions (G), decreased total distance traveled (H), and increased corticosterone levels (I). Restoration of LepRb expression in PPG neurons (GCG-Cre::LepRbTB/TB mice) did not lead to normalization of any aspects of the elevated zero maze (F–H) or blood corticosterone levels (I). Compared with WT controls, LepRbTB/TB mice displayed increased latency to feed (J), while there were no changes in total amount consumed (K), and decreased total distance traveled (L) in the novelty-suppressed feeding test. Restoration of LepRb expression in PPG neurons (GCG-Cre::LepRbTB/TB mice) did not lead to normalization of any parameters assessed in the novelty-suppressed feeding test (J–L). Error bars indicate mean ± SEM; circles represent individual values. One-way ANOVA was used to test for significant differences between genotypes, followed by post-hoc comparisons. Asterisk denotes p-values<0.05. Meal patterns: WT N = 6, LepRbTB/TBN = 5, GCG-Cre::LepRbTB/TBN = 5; Anxiety-like behavior: WT N = 10, LepRbTB/TBN = 5, GCG-Cre::LepRbTB/TBN = 6; Novelty-suppressed feeding test: WT N = 10, LepRbTB/TBN = 5, GCG-Cre::LepRbTB/TBN = 6.
Figure 8
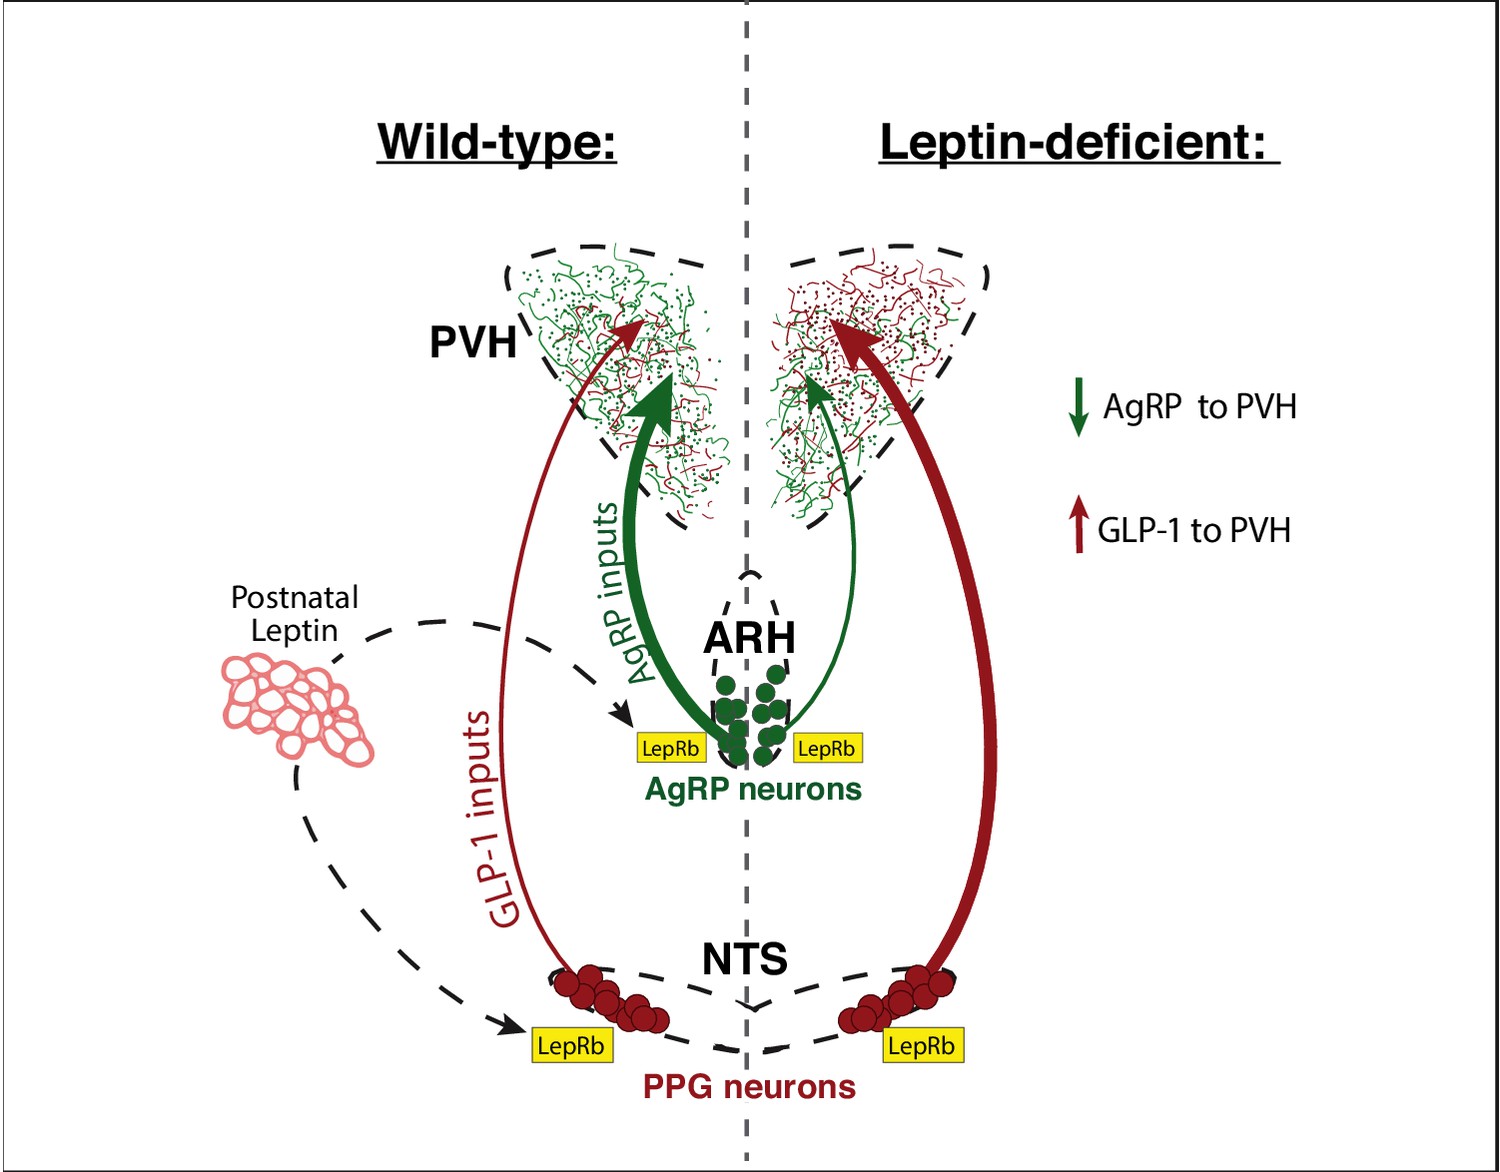
Leptin is required to specify the normal balance of hormonal and viscerosensory information conveyed by AgRP and GLP-1 inputs that converge onto the PVH.
During development, the adipocyte-derived hormone leptin is secreted by adipose tissue and binds to leptin receptors (LepRb) located on AgRP neurons in the ARH, and on PPG neurons in the NTS. In animals with normal leptin signaling, the PVH contains a greater density of AgRP inputs compared with that of GLP-1. In the absence of leptin signaling, the density of AgRP inputs to the PVH decreases and those derived from PPG neurons in the NTS increase. Thus, in contrast to the growth-promoting actions of leptin on AgRP neurons, leptin appears to suppress innervation by PPG neurons to the PVH, through a receptor dependent and cell-autonomous mechanism. Leptin’s developmental actions may function to balance excitatory and inhibitory inputs that converge onto multiple populations of PVH neurons and regulate their responsiveness to environmental signals.
Tables
Key resources table
| Reagent type (species) or resource | Designation | Source or reference | Identifiers | Additional information |
|---|---|---|---|---|
| Genetic reagent (M. musculus) | tdTomato | Jackson Laboratory | Stock #:007914 RRID:IMSR_JAX:007914 | PMID:20023653 |
| Genetic reagent (M. musculus) | Gcg-Cre | PMID:28218622 | RRID:MMRRC_051056 | Dr. Michael Scott (University of Virginia) |
| Genetic reagent (M. musculus) | LepRb-Cre | Jackson Laboratory | Stock #:032457 RRID:IMSR_JAX:032457 | Dr. Martin Myers, Jr. (University of Michigan) PMID:17021368 |
| Genetic reagent (M. musculus) | Lepob/ob | Jackson Laboratory | Stock #:000632 RRID:IMSR_JAX:000632 | Lepob/+ heterozygotes were bred to generate homozygous, leptin-deficient mice |
| Genetic reagent (M. musculus) | LepRTB/TB | Jackson Laboratory | Stock #:018989 RRID:IMSR_JAX:018989 | PMID:22326958 |
| Genetic reagent (M. musculus) | Glp1r-Cre | Jackson Laboratory | Stock #:029283 RRID:IMSR_JAX:029283 | PMID:27238020 |
| Genetic reagent (M. musculus) | Synaptophysin-tdTomato | Jackson Laboratory | Stock #:012570 RRID:IMSR_JAX:012570 | MGI ID: J:170755 |
| Antibody | Rabbit monoclonal anti-cFos | Cell Signaling | Cat. #: 2250S RRID:AB_2247211 | IHC (1:1000) |
| Antibody | Rabbit polyclonal anti-CRF | Dr. Paul Sawchenko; Dr. Wylie Vale (Salk Institute) | PBL#rC68 | IHC (1:1000) |
| Antibody | Mouse monoclonal anti-HuC/D | Molecular Probes | Cat. #: A21271 RRID:AB_221448 | IHC (1:500) |
| Antibody | Rabbit polyclonal anti-dsRed | Clontech | Cat. #: 632496 RRID:AB_10013483 | IHC (1:1000) |
| Antibody | Rabbit anti-Oxytocin | Peninsula | Cat. #: T-4084 RRID:AB_518524 | IHC (1:2500) |
| Antibody | Rabbit polyclonal anti-GLP-1 | Peninsula | Cat. #: T-4363 RRID:AB_518978 | IHC (1:5000) |
| Antibody | Rabbit polyclonal anti-pSTAT3 (Y705) | Cell Signaling | Cat. #: 9131S RRID:AB_331586 | IHC (1:1000) |
| Antibody | Goat polyclonal anti-rabbit Alexa Fluor 568 | ThermoFisher Scientific | Cat. #: A-11036 RRID:AB_10563566 | IHC (1:500) |
| Antibody | Goat polyclonal anti-rabbit Alexa Fluor 488 | ThermoFisher Scientific | Cat. #: A-11034 RRID:AB_2576217 | IHC (1:500) |
| Antibody | Goat polyclonal anti-mouse Alexa Fluor 647 | ThermoFisher Scientific | Cat. #: A-21236 RRID:AB_2535805 | IHC (1:500) |
| Recombinant DNA reagent | AAV pCAG-FLEX-EGFP-WPRE | Addgene | Cat. #: 51502 RRID:Addgene_51502 | PMID:24695228 |
| Peptide, recombinant protein | Leptin | Peprotech | Cat. #: 450–31 | 10 mg/kg i.p. |
| Peptide, recombinant protein | CCK | Bachem | Cat. #: H-2080 | 10 μg/kg i.p. |
| Commercial assay or kit | Corticosterone RIA | MP Biomedicals | Cat. #: 07–120102 | |
| Chemical compound, drug | Colchicine | Sigma | Cat. #: C9754 | 4 mg/mL |
| Software, algorithm | Imaris | Bitplane | V9.2 | |
| Software, algorithm | Volocity | PerkinElmer | V6.1.1 | |
| Software, algorithm | GraphPad Prism | Prism | Prism 7 |
Additional files
Download links
A two-part list of links to download the article, or parts of the article, in various formats.
Downloads (link to download the article as PDF)
Open citations (links to open the citations from this article in various online reference manager services)
Cite this article (links to download the citations from this article in formats compatible with various reference manager tools)
Leptin suppresses development of GLP-1 inputs to the paraventricular nucleus of the hypothalamus
eLife 9:e59857.
https://doi.org/10.7554/eLife.59857


