Human complex exploration strategies are enriched by noradrenaline-modulated heuristics
- Max Planck UCL Centre for Computational Psychiatry and Ageing Research, United Kingdom
- Wellcome Trust Centre for Neuroimaging, University College London, United Kingdom
- Department of Psychiatry and Psychotherapy, Charité – Universitätsmedizin Berlin, Germany
Figures
Figure 1 with 5 supplements
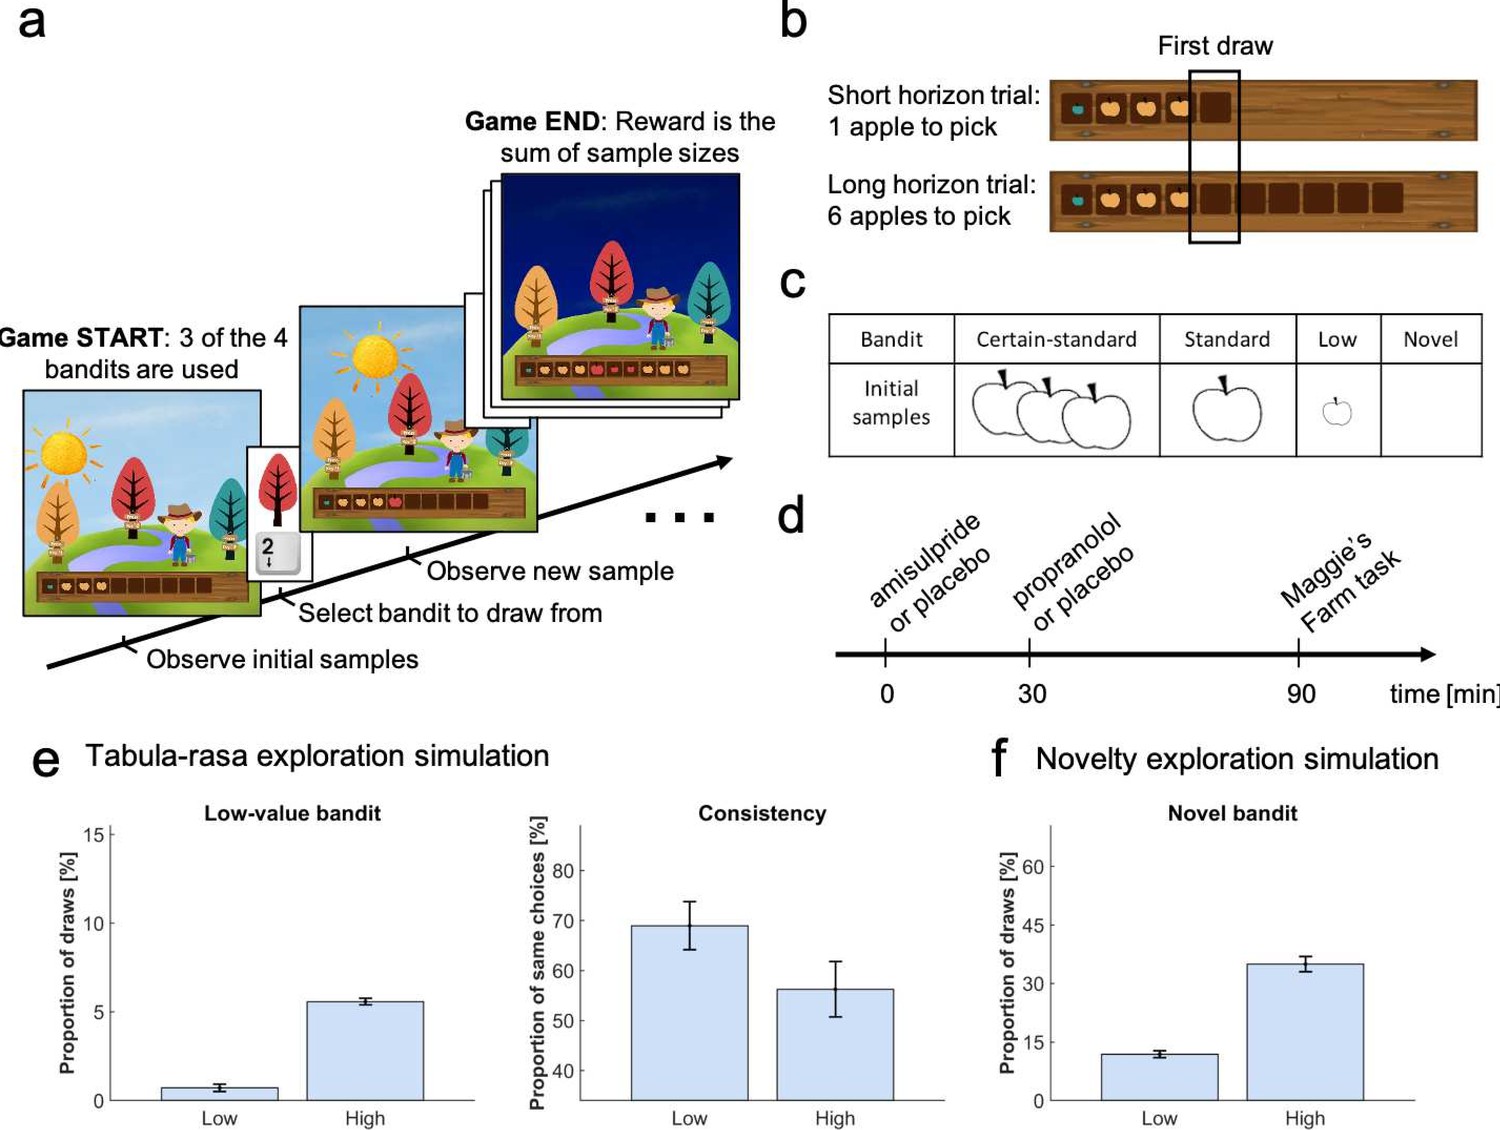
Study design.
In the Maggie’s farm task, subjects had to choose from three bandits (depicted as trees) to maximise an outcome (sum of reward). The rewards (apple size) of each bandit followed a normal distribution with a fixed sampling variance. (a) At the beginning of each trial, subjects were provided with some initial samples on the wooden crate at the bottom of the screen and had to select which bandit they wanted to sample from next. (b) Depending the condition, they could either perform one draw (short horizon) or six draws (long horizon). The empty spaces on the wooden crate (and the sun's position) indicated how many draws they had left. The first draw in both conditions was the main focus of the analysis. (c) In each trial, three bandits were displayed, selected from four possible bandits, with different generative processes that varied in terms of their sample mean and number of initial samples (i.e. samples shown at the beginning of a trial). The ‘certain-standard bandit’ and the ‘standard bandit’ had comparable means but different levels of uncertainty about their expected mean: they provided three and one initial sample, respectively; the ‘low-value bandit’ had a low mean and displayed one initial sample; the ‘novel bandit’ did not show any initial sample and its mean was comparable with that of the standard bandits. (d) Prior to the task, subjects were administered different drugs: 400 mg amisulpride that blocks dopaminergic D2/D3 receptors, 40 mg propranolol to block noradrenergic β-receptors, and inert substances for the placebo group. Different administration times were chosen to comply with the different drug pharmacokinetics (placebo matching the other groups’ administration schedule). (e) Simulating value-free random behaviour with a low vs high model parameter () in this task shows that in a high regime, agents choose the low-value bandit more often (left panel; mean ± 1 SD) and are less consistent in their choices when facing identical choice options (right panel). (f) Novelty exploration exclusively promotes choosing choice options for which subjects have no prior information, captured by the ‘novel bandit’ in our task. For details about simulations cf. Materials and methods. For details about the task display Figure 1—figure supplement 1. For simulations of different exploration strategies and their impact of different bandits Figure 1—figure supplement 2–5.
Figure 1—figure supplement 1

Visualisation of the nine different sizes that the apples could take.
The associated rewards went from 2 (small apple on the left) to 10 (big apple on the right).
Figure 1—figure supplement 2
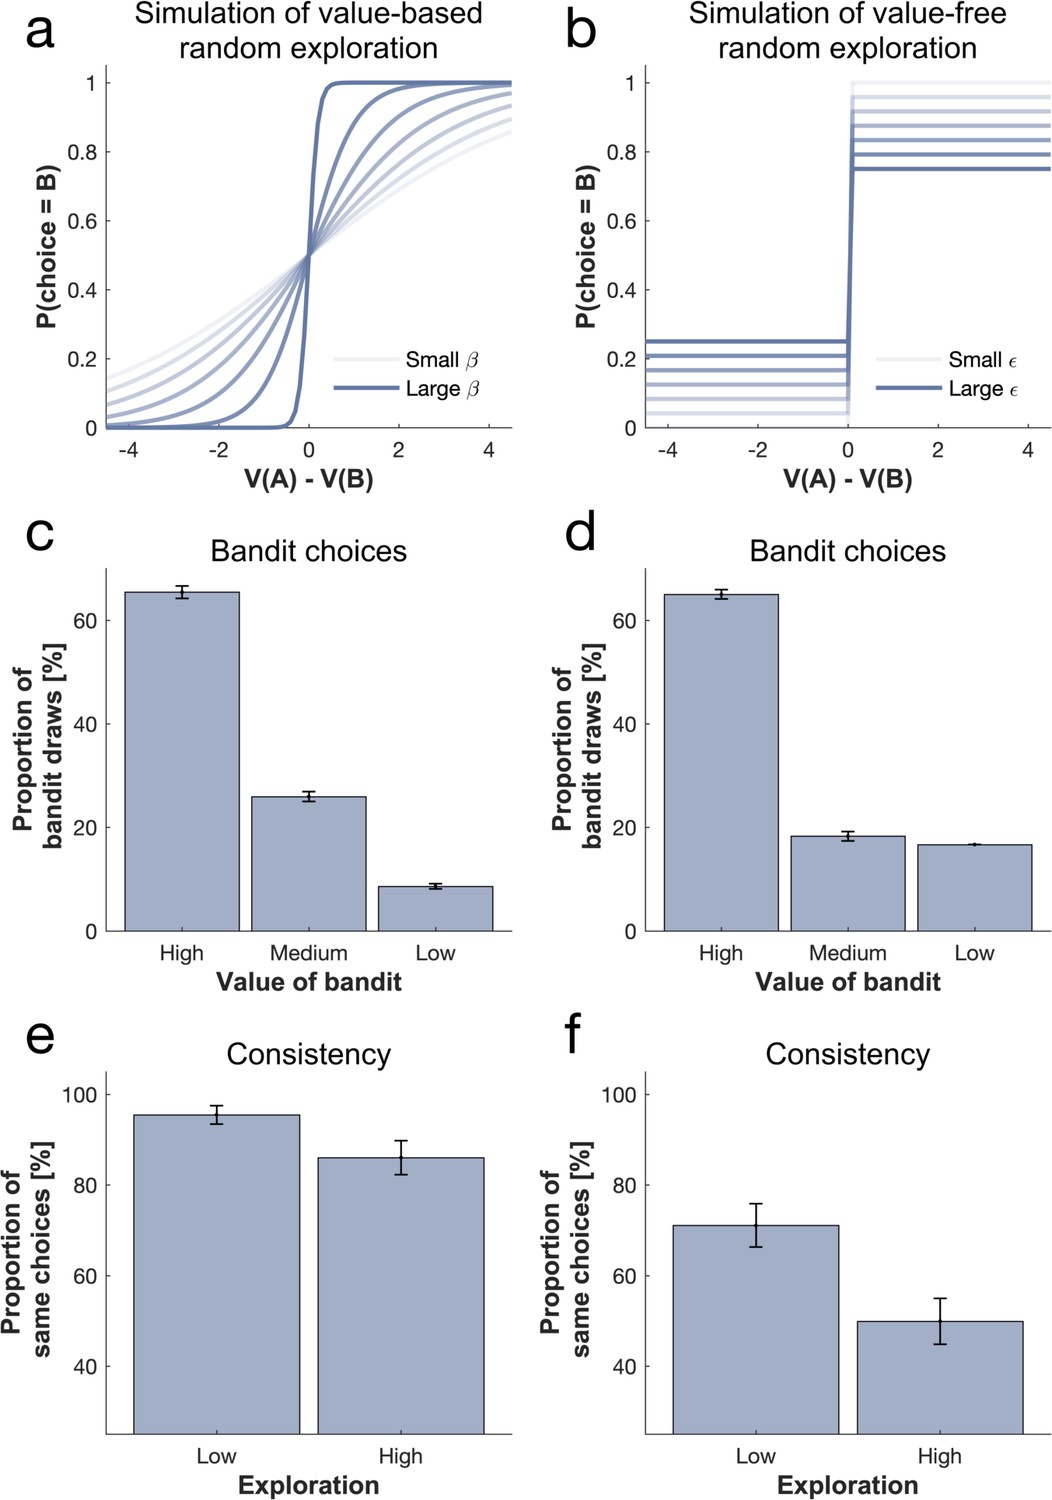
Comparison of value-based (softmax) and value-free (-greedy) random exploration.
(a) Changing the softmax inverse temperature affects the slope of the sigmoid while changing the -greedy parameter (b) affects the compression of the sigmoid. Conceptually, in a softmax exploration mode, as each bandit's expected value is taken into account, (c) the second best bandit (medium-value bandit) is favoured over one with a lower value (low-value bandit) when injecting noise. In contrast, in an -greedy exploration mode, (d) bandits are explored equally often irrespective of their expected value. Both simulations were performed on trials without novel bandit. When simulating on all trials, we observe that this also has a consequence for choice consistency. (e) Choices are more consistent in a low (versus high) softmax exploration mode (i.e. high and low values of , respectively), and similarly (f) choices are more consistent in a low (versus high) -greedy exploration mode (i.e. low and high values of , respectively). When comparing the overall consistency of the two random exploration strategies, consistency is higher in the value-based mode, reflecting a higher probability of (consistently) exploring the second best option, compared to an equal probability of exploring any non-optimal option (inconsistently) in the value-free mode.
Figure 1—figure supplement 3
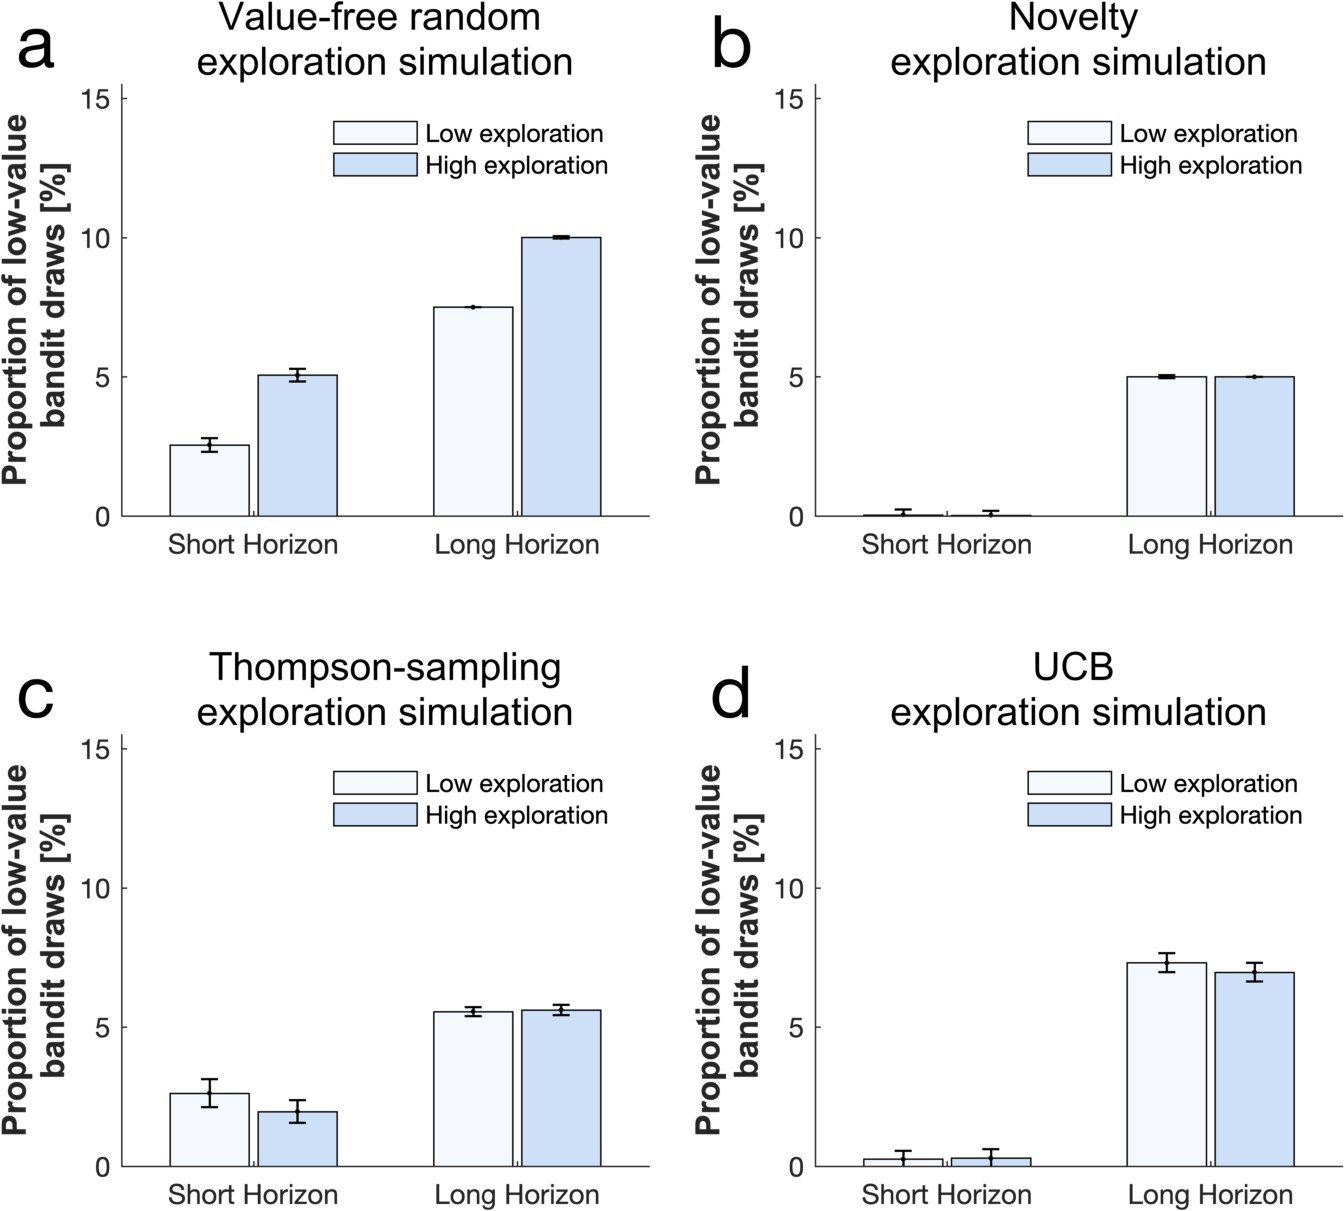
Simulation illustrations of high and low exploration on the frequency of picking the low-value bandit using different exploration strategies (a) a high (versus low) value-free random exploration increases the selection of the low-value bandit, whereas neither (b) a high (versus low) novelty exploration, (c) a high (versus low) Thompson-sampling exploration nor (d) a high (versus low) UCB exploration affected this frequency.
To illustrate the long (versus short) horizon condition, we accommodated the fact that not only key values but also other exploration strategies were enhanced by increasing multiple exploration strategies, as found in our experimental data (Appendix 2—table 7 for parameter values). Please note that the difference between low and high exploration is critical here, rather than a comparison of the absolute height of the bars between strategies (which is influences in the models by multiple different exploration strategies). For simulations fitting participants’ data, please see Figure 5—figure supplements 1 and 3.
Figure 1—figure supplement 4

Simulation illustrations of high and low exploration choice consistency using different exploration strategies shows that (a) a high (versus low) value-free random exploration decreases the proportion of same choices, whereas neither (b) a high (versus low) novelty exploration, (c) a high (versus low) Thompson-sampling exploration nor (d) a high (versus low) UCB exploration affected this measure.
To illustrate the long (versus short) horizon condition, accommodated the fact that not only the key value but also other exploration strategies were enhanced by increasing multiple exploration strategies, as found in our experimental data (Appendix 2—table 7 for parameter values). Please note that the difference between low and high exploration is critical here, rather than a comparison of the absolute height of the bars between strategies (which is influences in the models by multiple different exploration strategies). For simulations fitting participants’ data, please see Figure 5—figure supplements 1 and 3.
Figure 1—figure supplement 5
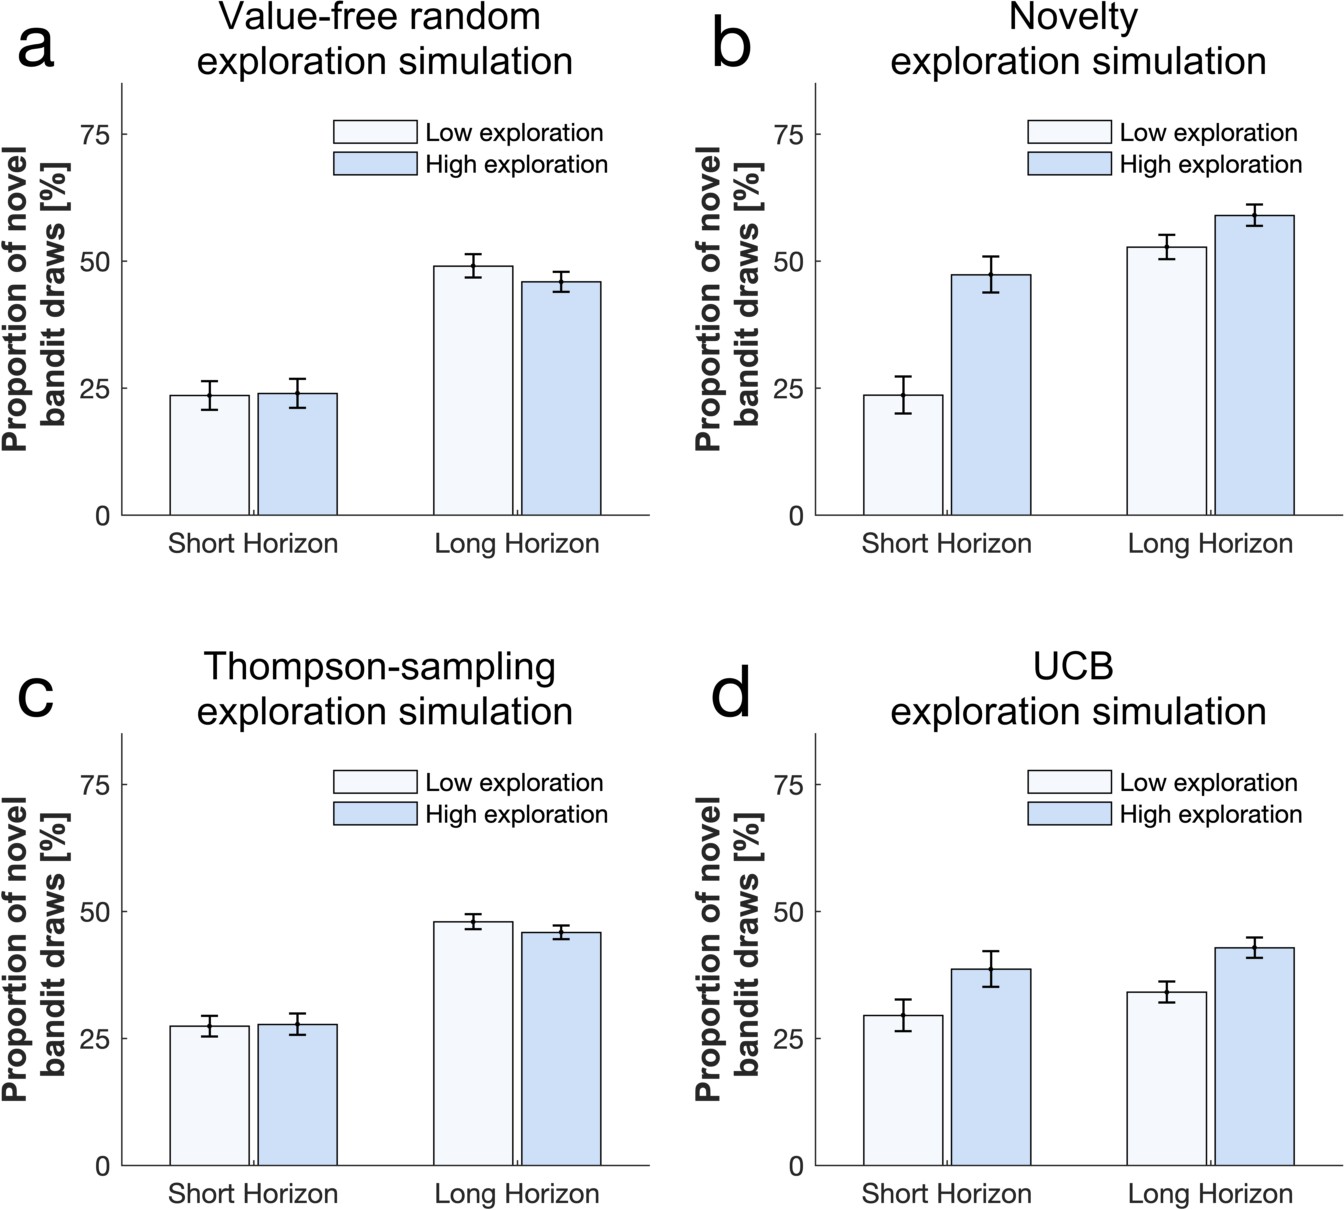
Simulation illustrations of high and low exploration on the frequency of picking the novel bandit using different exploration strategies shows that (a) a high (versus low) value-free random exploration has little effect on the selection of the novel bandit, whereas (b) a high (versus low) novelty exploration increases this frequency.
(c) A high (versus low) Thompson-sampling exploration had little effect and (d) a high (versus low) UCB exploration affected this frequency but to a lower extend than novelty exploration. To illustrate the long (versus short) horizon condition, we accommodated the fact that not only the key value but also other exploration strategies were enhanced by increasing multiple exploration strategies, as found in our experimental data (Appendix 2—table 7 for parameter values). Please note that the difference between low and high exploration is critical here, rather than a comparison of the absolute height of the bars between strategies (which is influences in the models by multiple different exploration strategies). For simulations fitting participants’ data, please see Figure 5—figure supplements 1 and 3.
Figure 2 with 1 supplement

Benefits of exploration.
To investigate the effect of information on performance we collapsed subjects over all three treatment groups. (a) The expected value (average of its initial samples) of the first chosen bandit as a function of horizon. Subjects chose bandits with a lower expected value (i.e. they explored more) in the long horizon compared to the short horizon. (b) The mean number of samples for the first chosen bandit as a function of horizon. Subjects chose less known (i.e. more informative) bandits more in the long compared to the short horizon. (c) The first draw in the long horizon led to a lower reward than the first draw in the short horizon, indicating that subjects sacrificed larger initial outcomes for the benefit of more information. This additional information helped making better decisions in the long run, leading to a higher earning over all draws in the long horizon. For values and statistics Appendix 2—table 3. For response times and details about all long horizons’ samples Figure 2—figure supplement 1. *** = p<0.001. Data are shown as mean ± 1 SEM and each dot/line represent a subject.
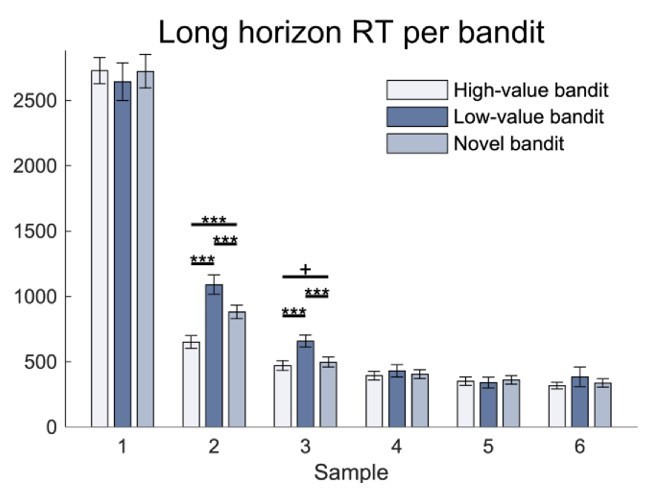
Figure 2—figure supplement 1

Further analysis of long horizon draws.
(a) The first draw in the long horizon led to a lower reward than the short horizon, indicating more exploration, while the subsequent draws led to a higher reward indicating that this additional information helped making better decisions in the long run. (b) The first draws’ response time was the highest and then decreased for each draw. Long horizon trials in which subjects started with (c) an exploitation draw (choose the bandit with the highest expected value) led to little increase in reward (y-axis: difference between obtained reward and highest reward of initial samples; linear regression slope coefficient: mean = 0.118, sd = 0.038), whereas trials in which they started with (d) an exploration draw led to an large increase in reward (linear regression slope coefficient: mean = 0.028, sd = 0.041). This larger increase in reward when starting by exploring (slope is higher: t(58) = -12.161, p<0.001, d = −1.583) indicates that the information that was gained through exploration led to higher long-term outcomes. Data are shown as mean ± 1 SEM and each dot represent one subject.
Figure 3 with 2 supplements
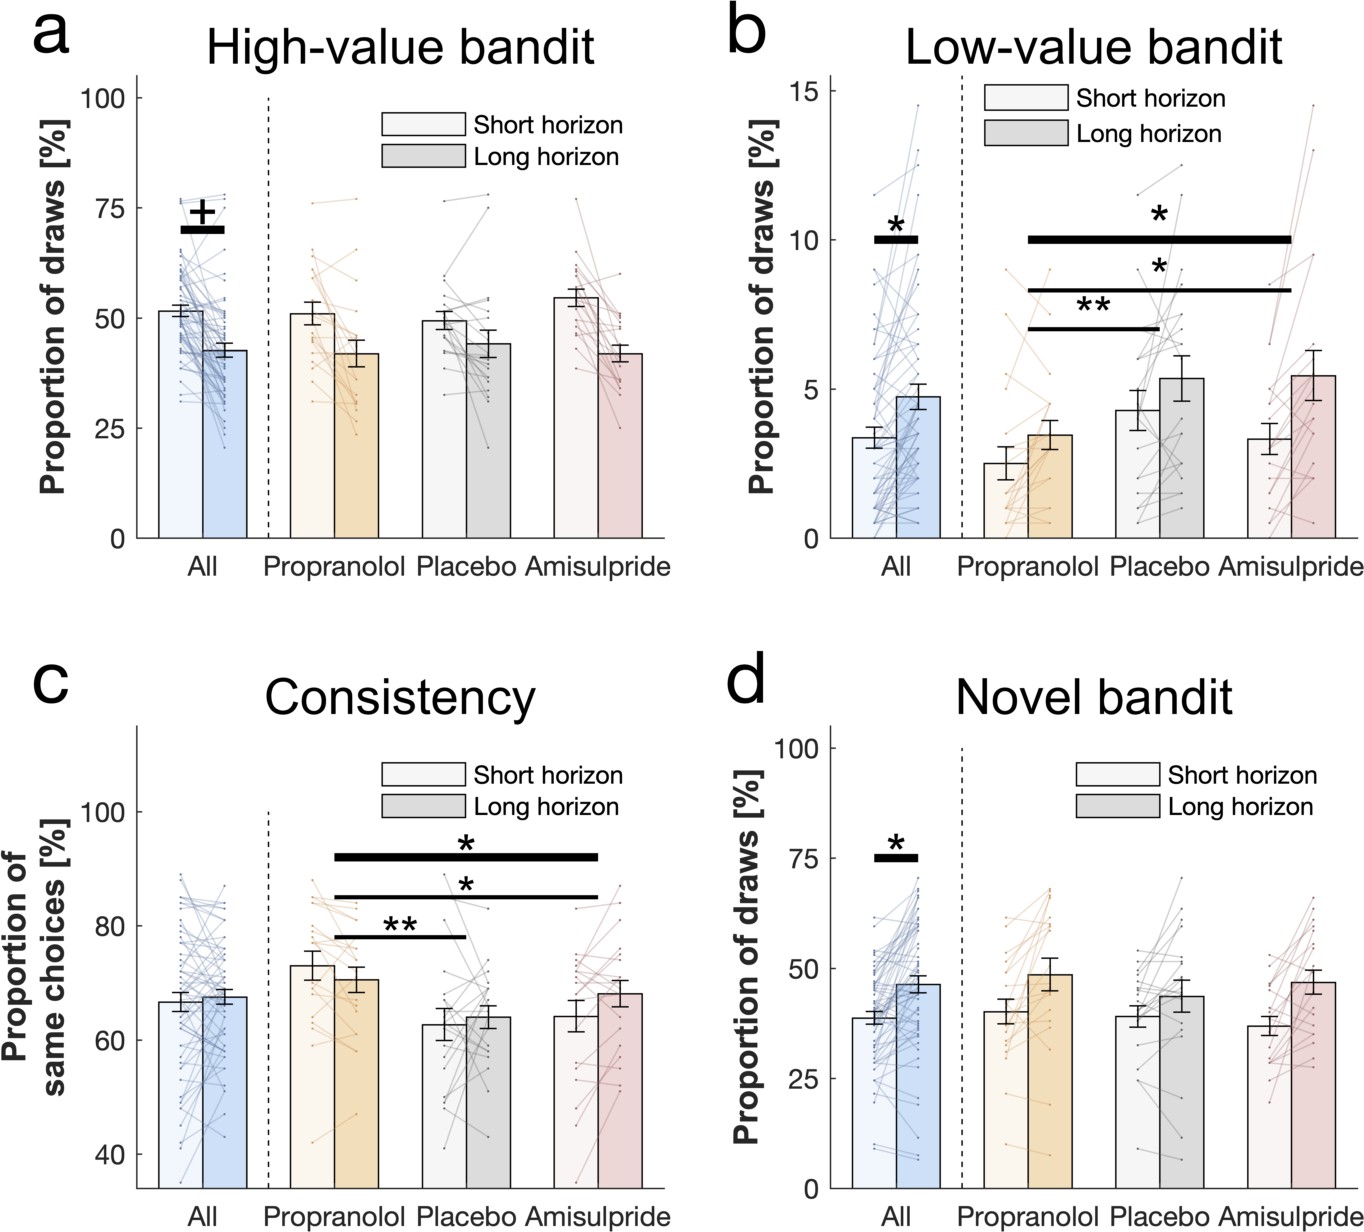
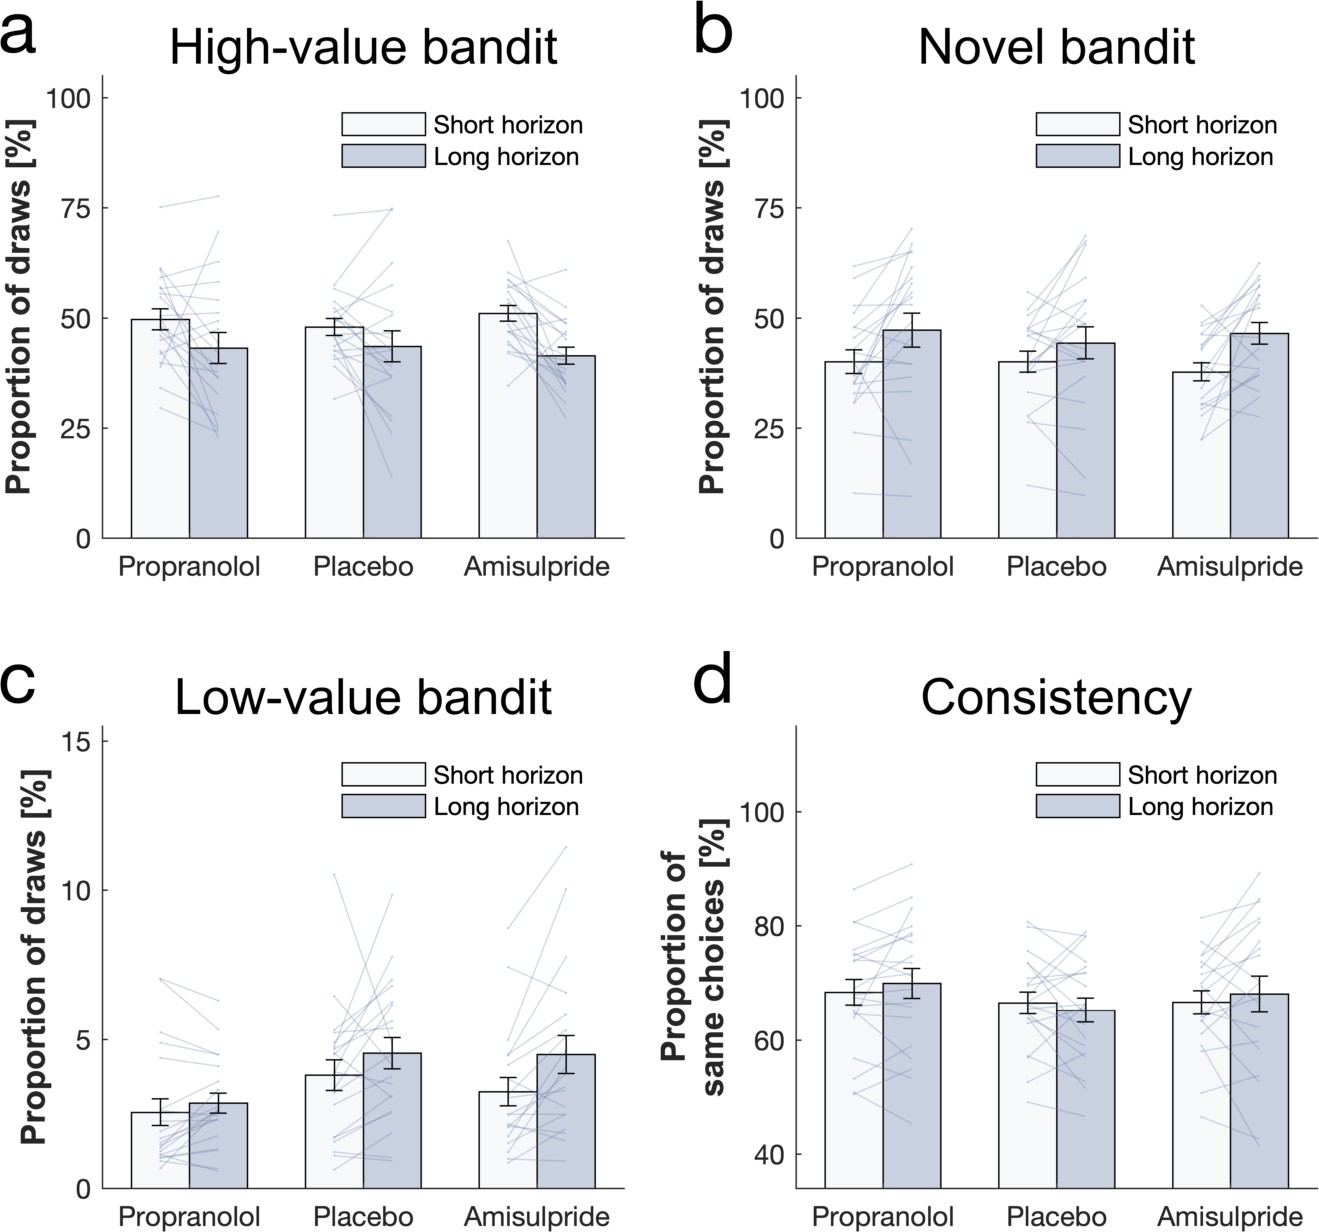
Behavioural horizon and drug effects.
Choice patterns in the first draw for each horizon and drug group (propranolol, placebo and amisulpride). (a) Subjects sampled from the high-value bandit (i.e. bandit with the highest average reward of initial samples) more in the short horizon compared to the long horizon indicating reduced exploitation. (b) Subjects sampled from the low-value bandit more in the long horizon compared to the short horizon indicating value-free random exploration, but subjects in the propranolol group sampled less from it overall, and (c) were more consistent in their choices overall, indicating that noradrenaline blockade reduces value-free random exploration. (d) Subjects sampled from the novel bandit more in the long horizon compared to the short horizon indicating novelty exploration. Please note that some horizon effects were modulated by subjects’ intellectual abilities when additionally controlling for them (Appendix 2—table 4). Horizontal bars represent rm-ANOVA (thick) and pairwise comparisons (thin). † = p<0.07, * = p<0.05, ** = p<0.01. Data are shown as mean ± 1 SEM and each line represent one subject. For values and statistics Appendix 2—table 4. For response times and frequencies specific to the displayed bandits Figure 3—figure supplements 1–2.
Figure 3—figure supplement 1
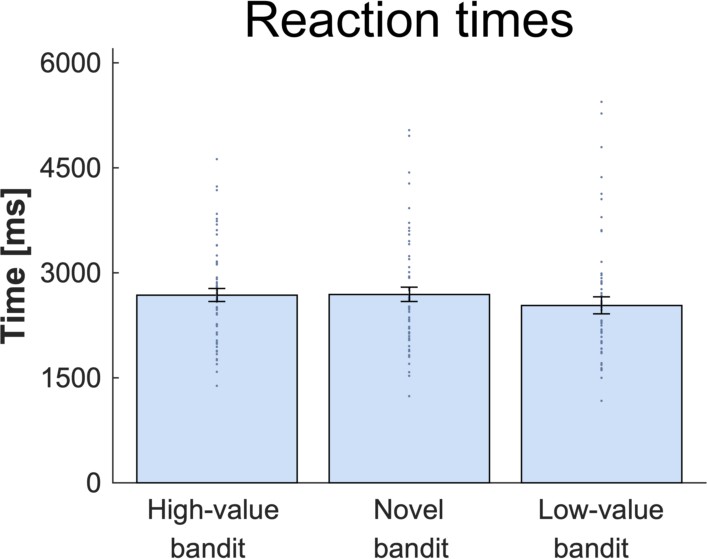
Response time (RT) analysis per bandit.
There was no difference in RT depending which bandit was chosen. For details and statistics cf. Appendix 1.
Figure 3—figure supplement 2
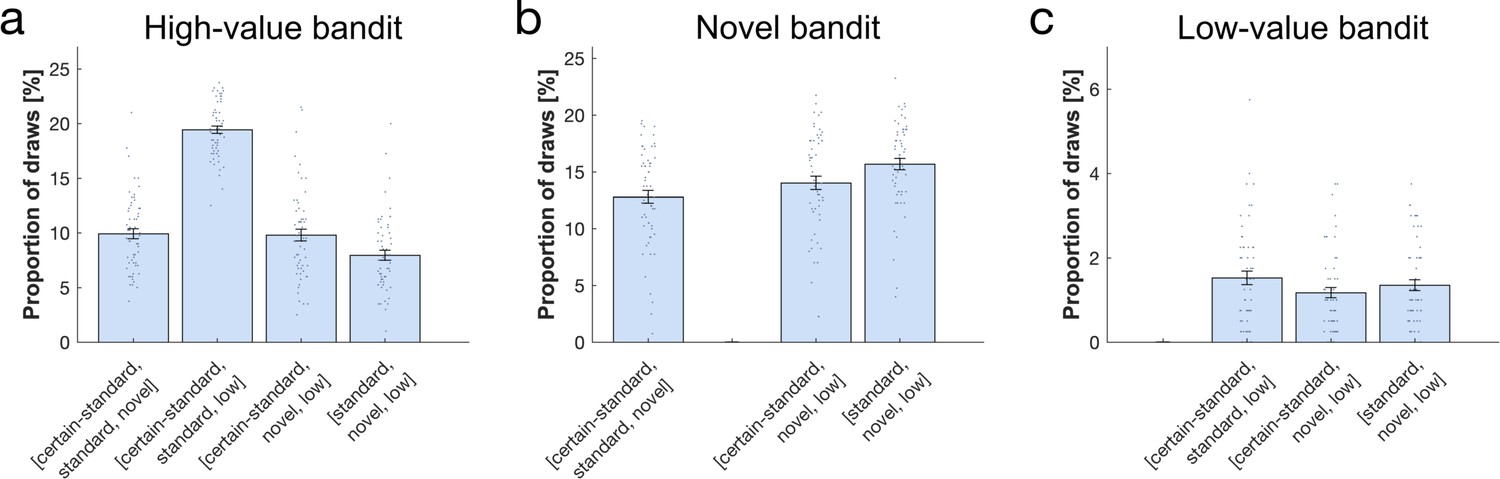
Proportion of draws per bandit combination (x-axis).
(a) The high-value bandit was picked more when there was no novel bandit, and less when the high-value bandit was less certain. (b) The novel bandit was picked the most when the high-value bandit was less certain, then when the high-value bandit was more certain, and it was picked the least when both certain and certain standard bandits were present. (c) The low-value bandit was picked less when the high-value bandit was more certain. For statistics see Appendix 1.
Figure 4 with 3 supplements
Subjects use a mixture of exploration strategies.
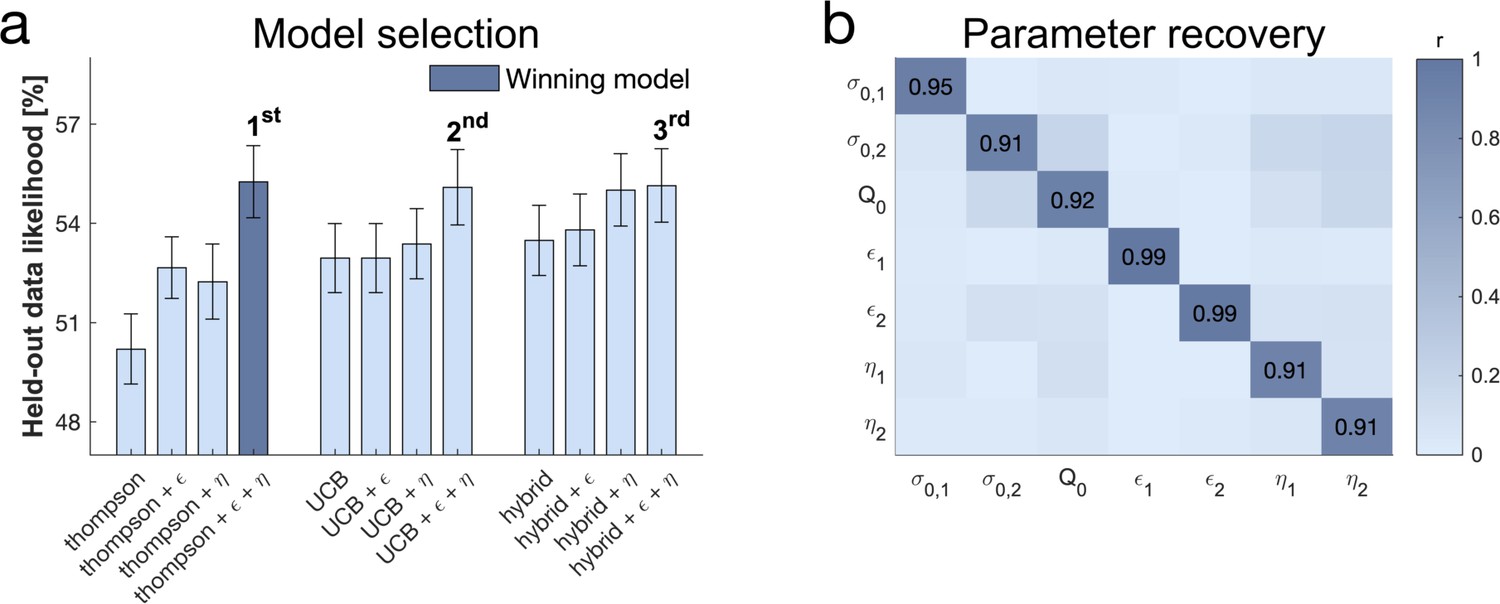
(a) A 10-fold cross-validation of the likelihood of held-out data was used for model selection (chance level = 33.3%; for model selection at the individual level Figure 4—figure supplement 1). The Thompson model with both the -greedy parameter and the novelty bonus best predicted held-out data (b) Model simulation with 47 simulations predicted good recoverability of model parameters (for correlations between behaviour and model parameters Figure 4—figure supplement 2); is the prior variance and is the prior mean (for parameter recovery correlation plots Figure 4—figure supplement 3). 1 stands for short horizon- and 2 for long horizon-specific parameters. For values and parameter details Appendix 2—table 5.
Figure 4—figure supplement 1

Model comparison: further evaluations.
(a) The winning model at the group level (the Thompson model with both and ) was also the one that accounted best for the largest number of subjects. (b) The Thompson++ model and the UCB++ are equally first in subject count when comparing all models, the Thompson++ model is therefore still the winning model as it has the highest average likelihood of held-out data.
Figure 4—figure supplement 2

Correlations between model parameters and behaviour.
The behavioural indicators of (a) value-free random exploration (left panel: draws from the low-value bandit; right panel: consistency) correlated with the -greedy parameter values, and of (b) novelty exploration (draws from the novel bandit) correlated with the novelty bonus .
Figure 4—figure supplement 3
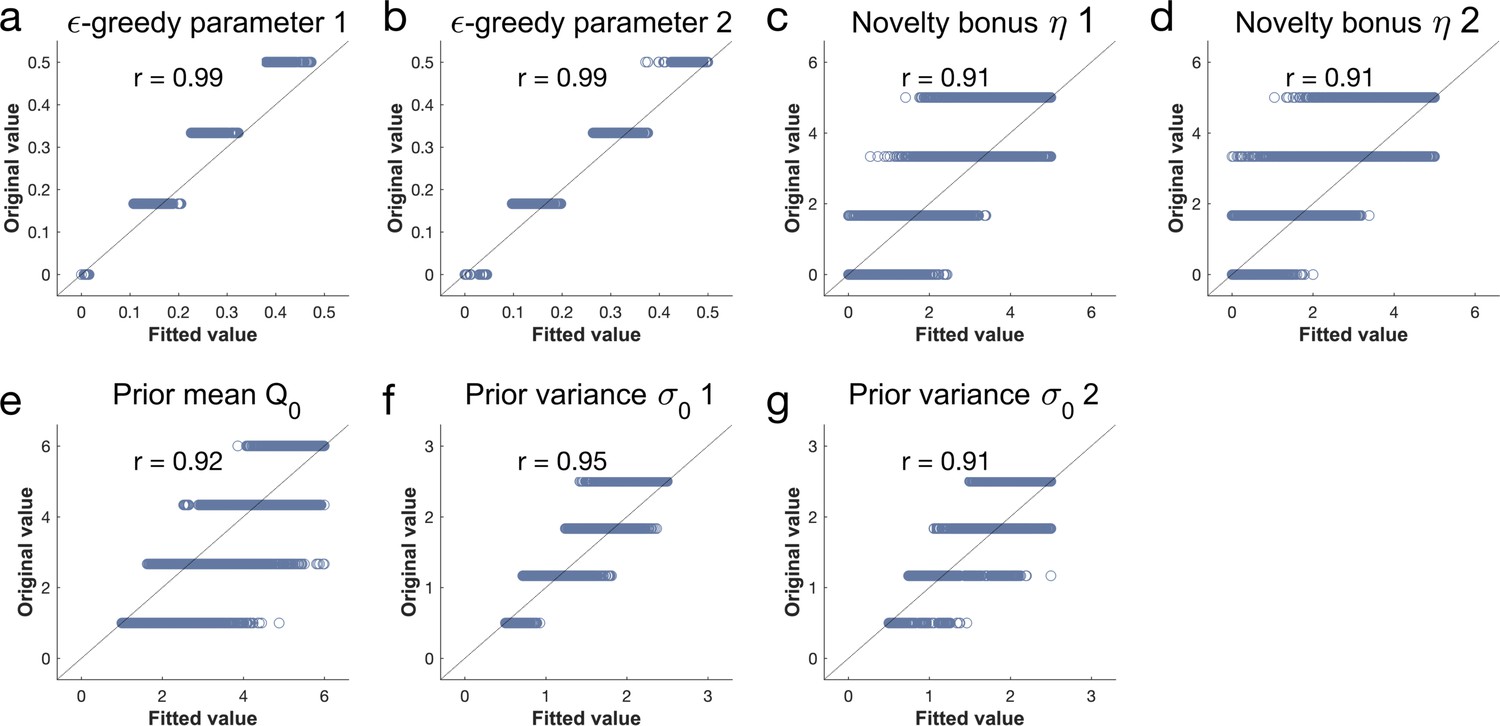
Parameter recovery analysis details.
For each of the seven parameters of the winning model, we took four values, equally spread within the parameter range. We simulated behaviour using every combination (), fitted the model and analysed how well the generative parameters (original values) correlated with the recovered ones (fitted parameters). Pearson correlation coefficient = r. Each dot represents one simulation.
Figure 5 with 3 supplements
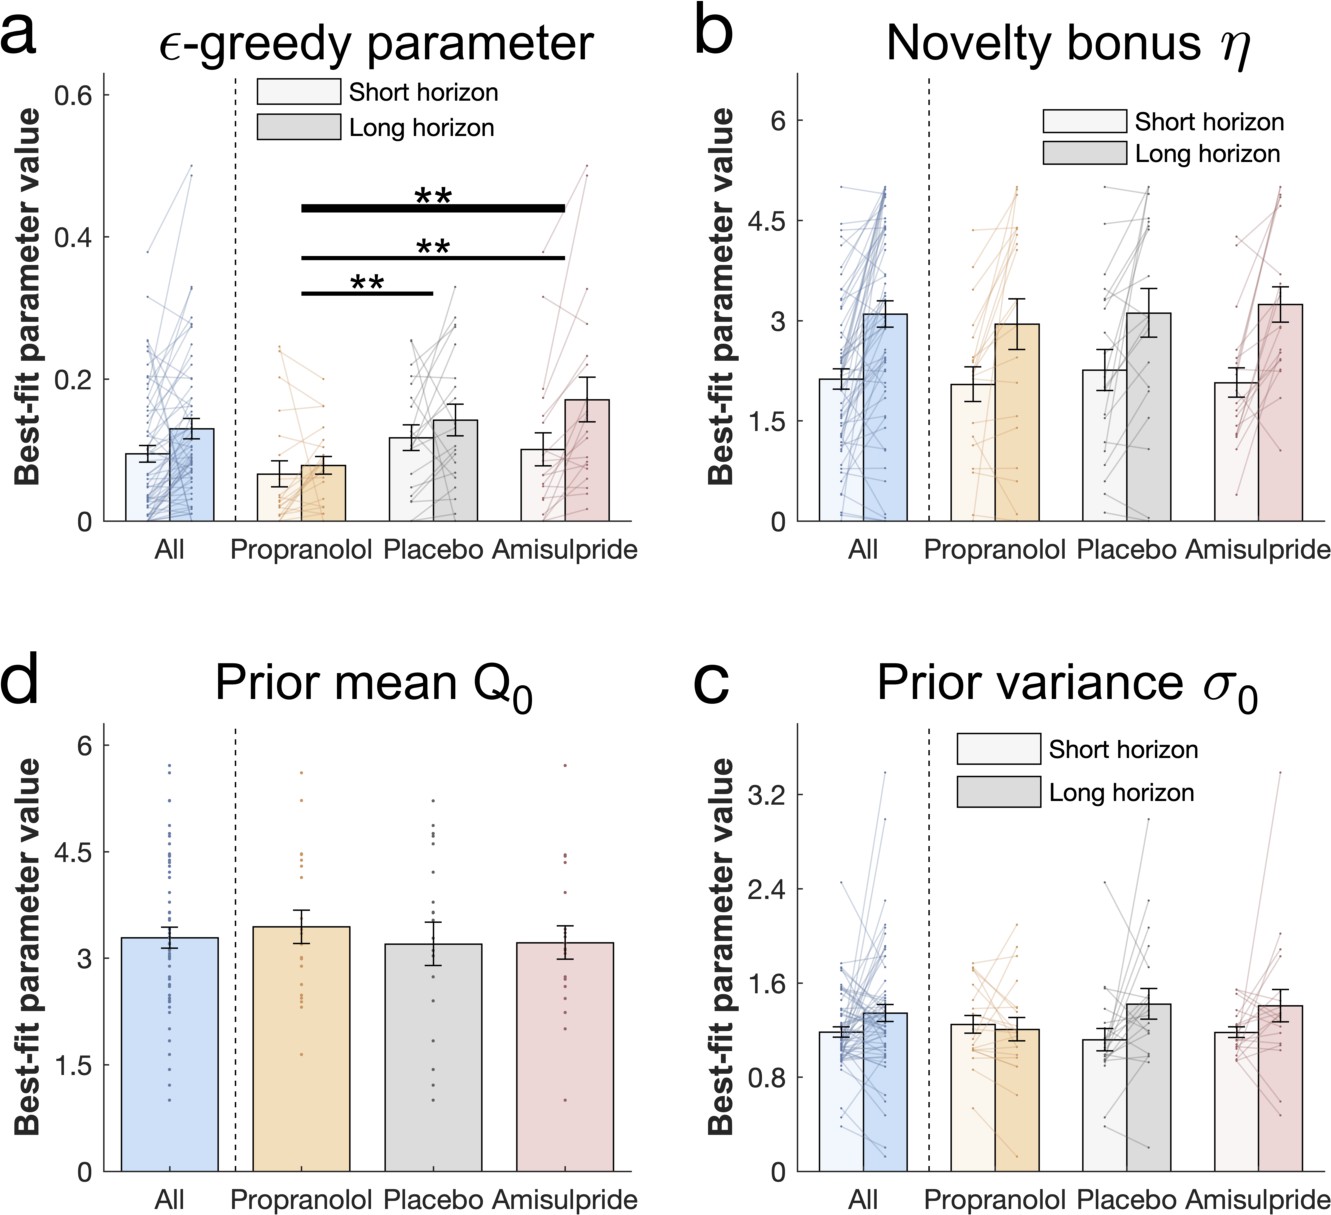
Drug effects on model parameters.
The winning model’s parameters were fitted to each subject’s first draw (for model simulations Figure 5—figure supplement 1). (a) Subjects had higher values of (value-free random exploration) in the long compared to the short horizon. Notably, subjects in the propranolol group had lower values of overall, indicating that attenuation of noradrenaline functioning reduces value-free random exploration. Subjects from all groups (b) assigned a similar value to novelty, captured by the novelty bonus , which was higher (more novelty exploration) in the long compared to the short horizon. (c) The groups had similar beliefs about a bandit's mean before seeing any initial samples and (d) were similarly uncertain about it (for gender effects Figure 5—figure supplement 2). Please note that some horizon effects were modulated by subjects’ intellectual abilities when additionally controlling for them (Appendix 2—table 6). ** = p<0.01. Data are shown as mean ± 1 SEM and each dot/line represent one subject. For parameter values and statistics Appendix 2—table 6.
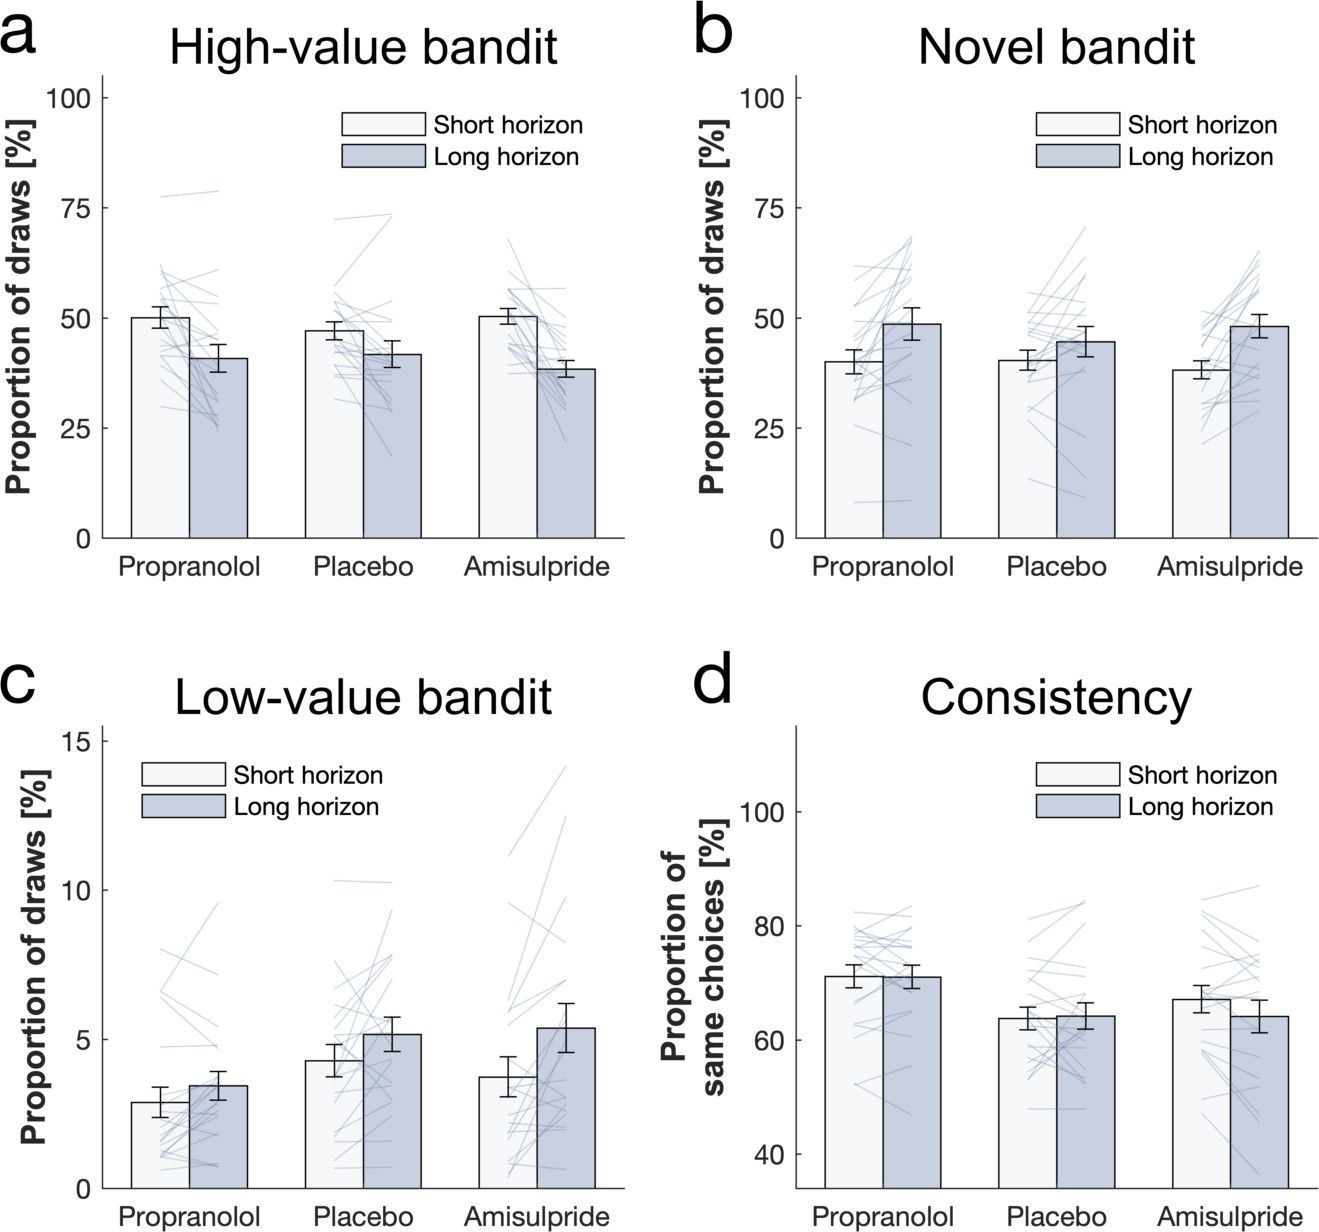
Figure 5—figure supplement 1
Simulated behaviour for Thompson++ model.
We used each subjects’ fitted parameters to simulate behaviour (=4000). Data are shown as mean ± 1 SEM and each dot/line represent one agent.
Figure 5—figure supplement 2

Gender effect on prior variance parameter.
Mean values (across horizon conditions) of were larger for female subjects, whereas in the amisulpride group, they were larger for male subjects. Data are shown as mean ± 1 SEM and each dot represent one subject.
Figure 5—figure supplement 3
Simulated behaviour for UCB++ model.
We used each subjects’ fitted parameters to simulate behaviour (=4000). Data are shown as mean ± 1 SEM and each dot/line represent one agent.
Author response image 1
Tables
Appendix 2—table 1
Characteristics of drug groups.
The drug groups did not differ in gender, age, nor in intellectual abilities (adapted WASI matrix test).
Groups differed in negative affect (PANAS), driven by a higher score in the placebo group (pairwise comparisons: placebo vs propranolol: t(56) = 2.801, p = 0.007, d = 0.799; amisulpride vs placebo: t(56) = -2.096, p = 0.041, d = 0.557; amisulpride vs propranolol: t(56) = 0.669, p = 0.506, d = 0.383). For more details cf. Appendix 1. Mean (SD).
| Propranolol | Placebo | Amisulpride | ||
|---|---|---|---|---|
| Gender (M/F) | 10/10 | 10/10 | 10/9 | |
| Age | 22.80 (3.59) | 23.80 (4.23) | 23.05 (3.01) | F(2,56) = 0.404, p = 0.669, = 0.014 |
| Intellectual abilities | 22.8 (1.85) | 22.6 (3.70) | 24.37 (2.45) | F(2,56) = 2.337, p = 0.106, = 0.077 |
| Positive affect | 24.55 (8.99) | 28.90 (7.56) | 29.58 (10.21) | F(2,56) = 1.832, p = 0.170, = 0.061 |
| Negative affect | 10.65 (.81) | 12.75 (3.63) | 11.16 (1.71) | F(2,56) = 4.259, p = 0.019, = 0.132 |
Appendix 2—table 2
Physiological effects on drug groups.
The drug groups also differed in post-experiment heart rate, driven by lower values in the propranolol group (pairwise comparisons: placebo vs propranolol: t(55)=3.5, p = 0.001, d = 1.293; amisulpride vs placebo: t(55) = −0.394, p = 0.695, d = 0.119; amisulpride vs propranolol: t(55)=3.013, p = 0.004, d = 0.921). For detailed statistics and analysis accounting for this cf. Appendix 1. Mean (SD).
| Propranolol | Placebo | Amisulpride | |||
|---|---|---|---|---|---|
| Heart rate (BPM) | At arrival | 74.9 (10.8) | 77,2 (12,6) | 77.7 (13.8) | F(2, 55) = 0.290, p = 0.749, = 0.010 |
| Pre-task | 62,6 (8,5) | 65,8 (8,3) | 64,6 (9,8) | F(2, 55) = 0.667, p = 0.517, =0.024 | |
| Post-task | 55,7 (6,7) | 64,4 (6,9) | 63,4 (10,0) | F(2, 55) = 7.249, p = 0.002, = 0.209 | |
| Systolic blood pressure | At arrival | 117,2 (10,4) | 115,0 (9,7) | 117,9 (9,7) | F(2, 55) = 0.438, p = 0.648, = 0.016 |
| Pre-task | 109,4 (9,2) | 111,8 (8,6) | 114,9 (8,6) | F(2, 55) = 1.841, p = 0.168, = 0.063 | |
| Post-task | 109,5 (8,2) | 113,9 (11,3) | 114,6 (9,3) | F(2, 55) = 1.584, p = 0.214, = 0.054 | |
| Diastolic blood pressure | At arrival | 71,5 (7,8) | 71,2 (6,7) | 72,3 (6,7) | F(2, 55) = 0.115, p = 0.891, = 0.004 |
| Pre-task | 68,3 (7,0) | 71,1 (10,6) | 72,0 (5,9) | F(2, 55) = 1.111, p = 0.337, = 0.039 | |
| Post-task | 70,8 (7,3) | 70,9 (8,0) | 70,3 (6,6) | F(2, 55) = 0.037, p = 0.964, = 0.001 | |
Appendix 2—table 3
Table of statistics and behavioural values of Figure 2.
All of those measures were modulated by the horizon condition.
| Horizon | Mean (sd) | Two-way repeated-measures ANOVA | |
|---|---|---|---|
| Main effect of horizon | |||
| Expected value | Short | 6.368 (0.335) | F(1, 56) = 19.457, p<0.001, = 0.258 |
| Long | 6.221 (0.379) | ||
| Initial samples | Short | 1.282 (0.247) | F(1, 56) = 58.78, p<0.001, = 0.512 |
| Long | 1.084 (0.329) | ||
| Score (first sample) | Short | 5.904 (0.192) | F(1, 56) = 58.78, p<0.001, = 0.512 |
| Long | 5.82 (0.182) | ||
| Score (average) | Short | 5.904 (0.192) | F(1, 56) = 103.759, p<0.001, = 0.649 |
| Long | 6.098 (0.222) |
Appendix 2—table 4
Table of statistics and behavioural measure values of Figure 3.
The drug groups differed in low-value bandit picking frequency (pairwise comparisons: placebo vs propranolol: t(40) = 2.923, p = 0.005, d = 0.654; amisulpride vs placebo: t(38) = -0.587, p = 0.559, d = 0.133; amisulpride vs propranolol: t(38)=2.171, p = 0.034, d = 0.496) and choice consistency (placebo vs propranolol: t(40) = -3.525, p = 0.01, d = 0.788; amisulpride vs placebo: t(38) = 1.107, p = 0.272, d = 0.251; amisulpride vs propranolol: t(38) = -2.267, p = 0.026, d = 0.514). The main effect is either of drug group (D) or of horizon (H). The interaction is either drug-by-horizon (DH) or horizon-by-WASI (measure of IQ; HW).
| Mean (sd) | Two-way repeated-measures ANOVA | |||||||
|---|---|---|---|---|---|---|---|---|
| Horizon | Amisulpride | Placebo | Propranolol | Main effect | Interaction | |||
| High-value bandit | Short | 54.55 (8.87) | 49.38 (9.10) | 50.98 (11.4) | D | F(2, 54) = 1.388, p = 0.258, = 0.049 | DH | F(2, 54) = 0.834, p = 0.440, = 0.030 |
| Long | 41.90 (8.47) | 44.10 (13.88) | 41.90 (13.57) | H | F(1, 54) = 3.909, p = 0.053, = 0.068 | HW | F(1, 54) = 13.304, p = 0.001, = 0.198 | |
| Low-value bandit | Short | 3.32 (2.33) | 4.28 (2.98) | 2.50 (2.48) | D | F(2, 54) = 7.003, p = 0.002, = 0.206 | DH | F(2, 54) = 2.154, p = 0.126, = 0.074 |
| Long | 5.45 (3.76) | 5.35 (3.40) | 3.45 (2.18) | H | F(1, 54) = 4.069, p = 0.049, = 0.070 | HW | F(1, 54) = 1.199, p = 0.278, = 0.022 | |
| Novel bandit | Short | 36.87 (9.49) | 39.02 (10.94) | 40.15 (12.43) | D | F(2, 54) = 1.498, p = 0.233, = 0.053 | DH | F(2, 54) = 0.542, p = 0.584, = 0.020 |
| Long | 46.82 (12.1) | 43.62 (16.27) | 48.55 (16.59) | H | F(1, 54) = 5.593, p = 0.022, = 0.094 | HW | F(1, 54) = 13.897, p<0.001, = 0.205 | |
| Consistency | Short | 64.16 (12.27) | 62.70 (12.59) | 73.00 (11.33) | D | F(2, 54) = 7.154, p = 0.002, = 0.209 | DH | F(2, 54) = 3.352, p = 0.042, = 0.110 |
| Long | 68.11 (10.34) | 64.00 (8.93) | 70.55 (9.91) | H | F(1, 54) = 1.333, p = 0.253, = 0.024 | HW | F(1, 54) = 0.409, p = 0.525, = 0.008 | |
Appendix 2—table 5
Table of parameters used for each model compared during model selection (Figure 4).
Each of the 12 columns indicate a model. The three ‘main models’ studied were the Thompson model, the UCB model and a hybrid of both. Variants were then created by adding the -greedy parameter, the novelty bonus and a combination of both. All the parameters besides and w were fitted to each horizon separately. Parameters: = prior mean (initial estimate of a bandits mean); = prior variance (uncertainty about = contribution of UCB vs Thompson; = information bonus; = softmax inverse temperature; = -greedy parameter (stochasticity); = novelty bonus. Model selection measures include the cross-validation held-out data likelihood averaged over subjects, mean (SD), as well as the subject count for which this model performed better over either 12 models or over the 3 best models.
| Model | Thompson | UCB | Hybrid | ||||||||||
|---|---|---|---|---|---|---|---|---|---|---|---|---|---|
| +ϵ | +η | +ϵ+η | +ϵ | +η | +ϵ+η | +ϵ | +η | +ϵ+η | |||||
| Parameters | Horizon independent | ||||||||||||
| Horizon dependent | ϵ | ϵ,η | ϵ | η | ϵ,η | | ϵ | | ϵ,η | ||||
| Model selection | Mean held-out data likelihood | 550.2 (8.1) | 552.7 (7.1) | 552,2 (8.7) | 555.3 (8.4) | 552.9 (8.0) | 552.9 (8.0) | 553.4 (8.1) | 555.1 (8.8) | 553.5 (8.1) | 553.8 (8.4) | 555.0 (8.4) | 555.1 (8.5) |
| Subjects for which model fits best (out of 12) | 0 | 3 | 2 | 20 | 0 | 0 | 1 | 20 | 0 | 0 | 7 | 6 | |
| Subjects for which model fits best (out of 3 best) | - | - | - | 27 | - | - | - | 22 | - | - | - | 10 | |
Appendix 2—table 6
Table of statistics and fitted model parameters of Figure 5.
The drug groups differed in -greedy parameter value (pairwise comparisons: placebo vs propranolol: t(40) = 3.177, p = 0.002, d =0 .71; amisulpride vs placebo: t(38) = 0.251, p = 0.802, d = 0.057; amisulpride vs propranolol: t(38) = 2.723, p = 0.009, d = 0.626). The main effect is either of drug group (D) or of horizon (H). The interaction is either drug-by-horizon (DH) or horizon-by-WASI (measure of IQ; HW).
| Mean (sd) | Two-way repeated-measures ANOVA | |||||||
|---|---|---|---|---|---|---|---|---|
| Horizon | Amisulpride | Placebo | Propranolol | Main effect | Interaction | |||
| -greedy parameter | Short | 0.10 (0.10) | 0.12 (0.08) | 0.07 (0.08) | D | F(2, 54) = 6.722, p = 0.002, = 0.199 | DH | F(2, 54) = 1.305, p = 0.280, = 0.046 |
| Long | 0.17 (0.14) | 0.14 (0.10) | 0.08 (0.06) | H | F(1, 54) = 1.968, p = 0.166, = 0.035 | HW | F(1, 54) = 6.08, p = 0.017, = 0.101 | |
| Novelty bonus | Short | 2.07 (0.98) | 2.26 (1.37) | 2.05 (1.16) | D | F(2, 54) = 0.249, p = 0.780, = 0.009 | DH | F(2, 54) = 0.03, p = 0.971, = 0.001 |
| Long | 3.24 (1.19) | 3.12 (1.63) | 2.95 (1.70) | H | F(1, 54) = 1.839, p = 0.181, = 0.033 | HW | F(1, 54) = 8.416, p = 0.005, = 0.135 | |
| Prior variance | Short | 1.18 (0.20) | 1.12 (0.43) | 1.25 (0.34) | D | F(2, 54) = 0.060, p = 0.942, = 0.002 | DH | F(2, 54) = 2.162, p = 0.125, =0.074 |
| Long | 1.41 (0.61) | 1.42 (0.59) | 1.21 (0.44) | H | F(1, 54) = 0.129, p = 0.721, = 0.002 | HW | F(1, 54) = 0.022, p = 0.882, < 0.001 | |
| Prior mean | 3.22 (1.05) | 3.20 (1.36) | 3.44 (1.05) | D | F(2, 54) = 0.118, p = 0.889, = 0.004 | |||
Appendix 2—table 7
Parameter values used for simulations on Figure 1—figure supplement 3–5.
Parameter values for high and low exploration were selected empirically from pilot and task data. Value-free random exploration and novelty exploration were simulated with an argmax decision function, which always selects the value with the highest expected value. For simulating the long (versus short) horizon condition, we assumed that not only the key value but also the other exploration strategies increased, as found in our experimental data. For each simulation Q0 = 5 and unless otherwise stated,
| Horizon | Low exploration | High exploration | Additional parameters | |
|---|---|---|---|---|
| Value-free random exploration | Short | ϵ = 0.1 | ϵ = 0.2 | = 0 |
| Long | ϵ = 0.3 | ϵ = 0.4 | = 2 | |
| Novelty exploration | Short | = 0 | = 1 | ϵ = 0 |
| Long | = 2 | = 3 | ϵ = 0.2 | |
| Thompson-sampling exploration | Short | = 0.8 | = 1.2 | = 0, ϵ = 0 |
| Long | = 1.6 | = 2 | = 2, ϵ = 0.2 | |
| UCB exploration | Short | = 0.1 | = 0.3 | = 5, ϵ = 0 |
| Long | = 0.7 | = 1.5 | = 1.5, ϵ = 0.2 |
Additional files
Download links
A two-part list of links to download the article, or parts of the article, in various formats.
Downloads (link to download the article as PDF)
Open citations (links to open the citations from this article in various online reference manager services)
Cite this article (links to download the citations from this article in formats compatible with various reference manager tools)
Human complex exploration strategies are enriched by noradrenaline-modulated heuristics
eLife 10:e59907.
https://doi.org/10.7554/eLife.59907


