Gene expression variability in human and chimpanzee populations share common determinants
- Department of Medicine, University of Chicago, United States
- Department of Human Genetics, University of Chicago, United States
- Department of Neurology, University of California, San Francisco (UCSF), United States
Figures
Figure 1 with 3 supplements
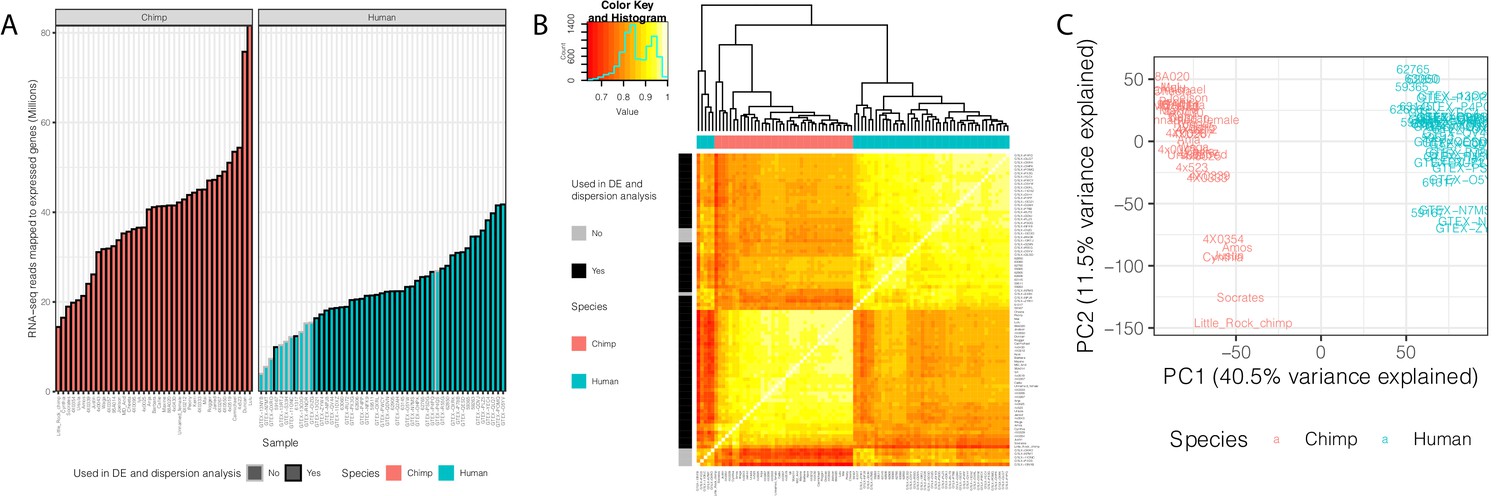
Summary of RNA-seq datasets.
(A) Number of reads mapped to expressed genes for each sample. To obtain a balanced set of 39 samples per species, the 10 samples outlined in gray were excluded from differential expression and variability analysis. Nine of these samples are among the lowest read count samples sourced from GTEx. The remaining sample was excluded on the basis of inspection of (B) unsupervised hierarchal clustering of RNA-seq samples by Pearson correlation matrix of expression log(CPM). (C) Principal component analysis shows samples separating by species along the first principal component. Only samples used in DE and variability analyses are shown in (C). Source data for (A) and other metadata for RNA-seq datasets used in this study are in Figure 1—source data 1.
-
Figure 1—source data 1
RNA-seq datasets used in this study.
- https://cdn.elifesciences.org/articles/59929/elife-59929-fig1-data1-v2.txt
Figure 1—figure supplement 1
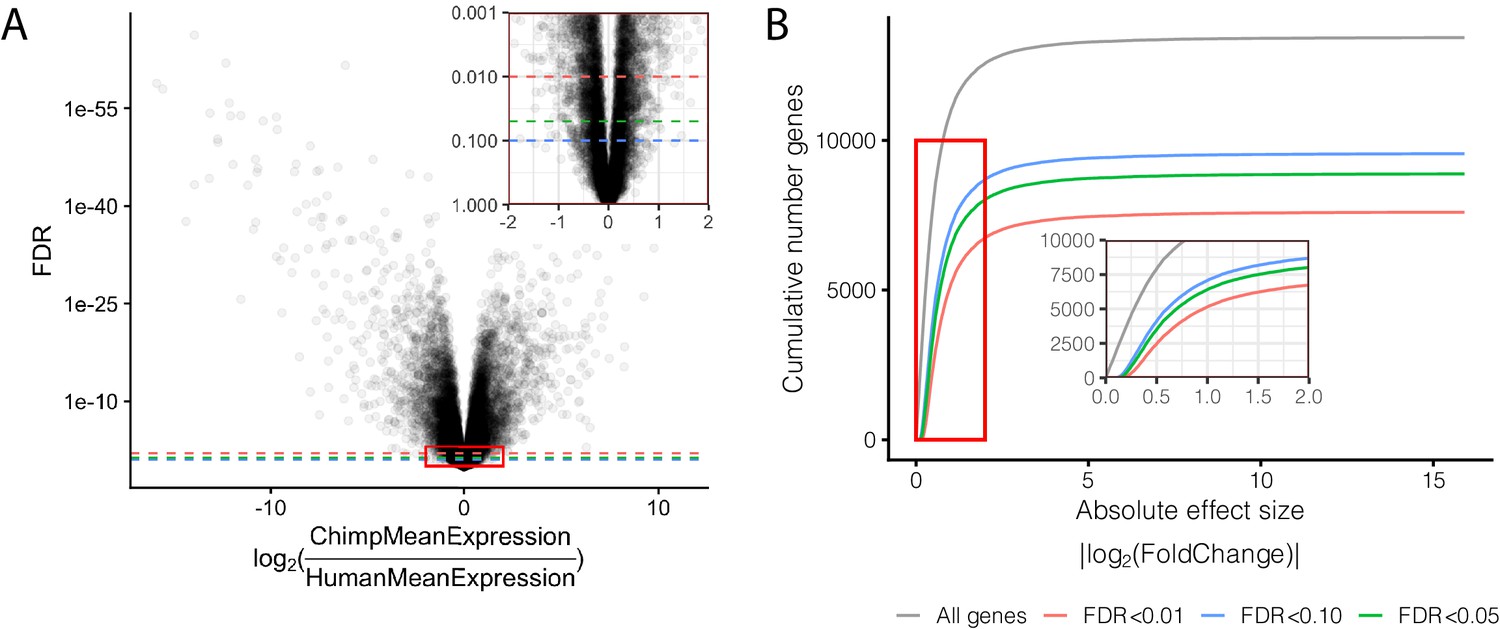
Effect size and significance of differential expression (DE) analysis.
(A) Volcano plot of DE genes between human and chimpanzee heart tissue. Inset focuses on the red boxed area to highlight the relationship between expression fold change and DE gene classification at various FDR thresholds. (B) The number of DE genes identified under any given fold change threshold at various FDR thresholds. Full DE results are available in Figure 1—figure supplement 1—source data 1.
-
Figure 1—figure supplement 1—source data 1
Full DE results.
- https://cdn.elifesciences.org/articles/59929/elife-59929-fig1-figsupp1-data1-v2.txt
Figure 1—figure supplement 2
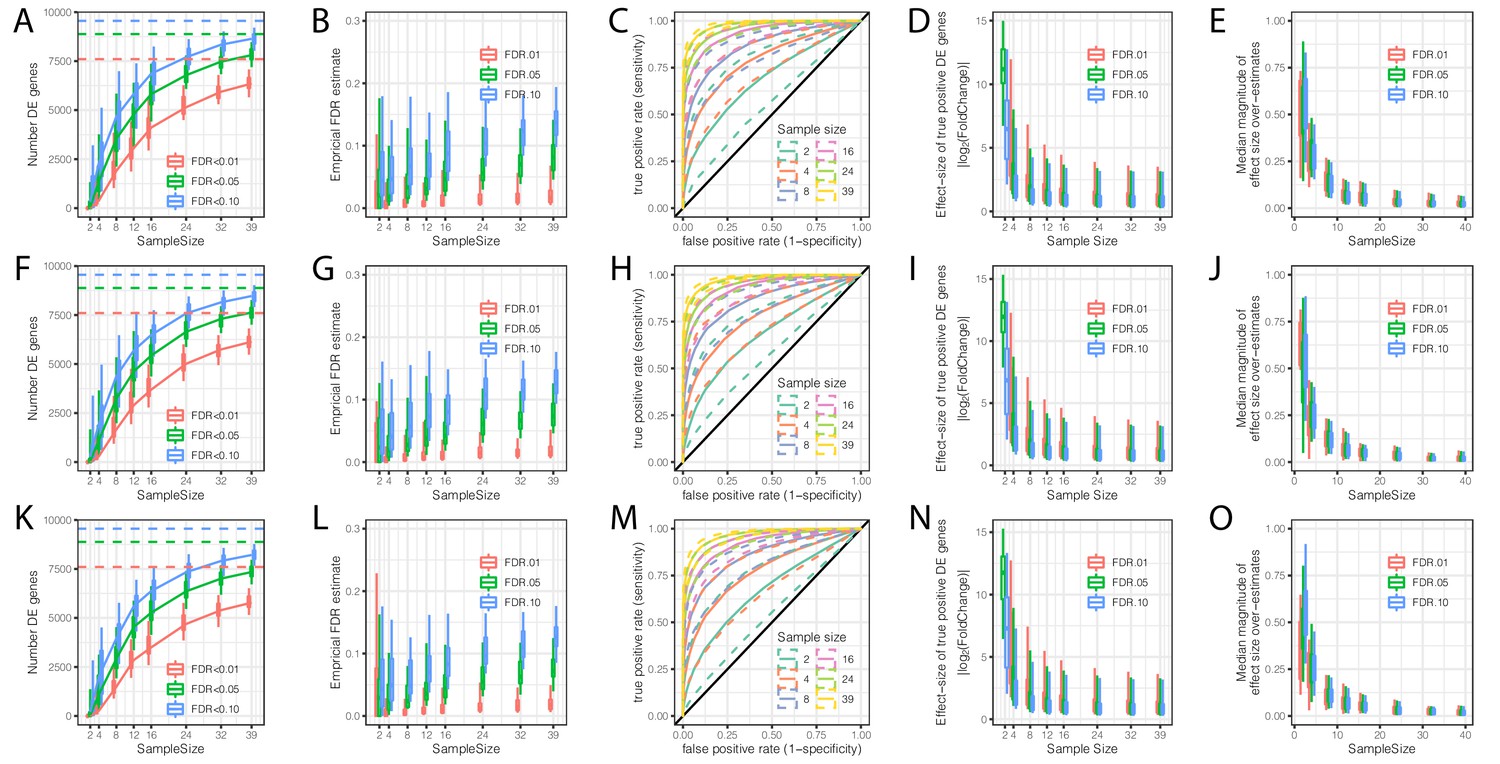
Evaluation of the contribution of sample size and read depth to differential expression analysis between chimpanzee and human.
(A) The number of DE genes identified at varying thresholds after randomly subsampling (with replacement) the number of individuals in each species at the indicated sample size per species (hereafter referred to as a single bootstrap replicate). Dashed lines indicate the number of DE genes identified from the full dataset of 39 human and 39 chimpanzee individuals. Box-whisker plots depict quantiles among 100 bootstrap replicates. (B) An empirical estimate of FDR was obtained by calculating the fraction of DE genes in each subsample which were not identified at FDR < 0.01 in the full dataset. (C) Receiver operator characteristic (ROC) curves indicate the sensitivity and specificity of DE gene classification at varying significance thresholds. For each sample size, the filled line represents the median ROC sensitivity amongst 100 bootstrap replicates, while the dashed lines represent the 0.05 and 0.95 quantiles. (D) The ability to significantly detect small effect size DE genes increases as sample size increases. At each indicated subsample size, box-whisker plot indicates effect size of true significant DE genes (The effect size and true classifications of significant DE genes are defined as those at FDR < 0.01 with the full dataset). (E) Winner’s curse effects decrease with increasing sample size. The distribution of median differences between the estimated effect size of DE genes and the true effect sizes estimated from the full dataset among 100 bootstrap replicates. (F–L) Same as (A–E) but each sample was subsampled at the level of RNA-seq reads to a depth of 25 million mapped reads. (K–O) Same as (A–E) but each sample was subsampled to 10 million mapped reads. All box-whisker plots depict 0.05, 0.25, 0.5, 0.75, and 0.95 quantiles among 100 bootstrap replicates.
Figure 1—figure supplement 3

Contribution of genetic relatedness to differential expression analysis between chimpanzee and human.
(A) A mean-centered genetic relatedness matrix of the chimpanzee individuals used in DE analysis. Samples are hierarchically clustered and further grouped into k = 7 kinship clusters (row colors). The colors used to represent each cluster is consistent throughout the figure. These clusters were further manually filtered into three clusters of size n = 4 individuals with relatively high inter-relatedness and one cluster of size n = 13 individuals with relatively low inter relatedness (column colors). (B) The distribution of pairwise intra-cluster relatedness coefficients. The contribution of these cluster annotations as factors which explain gene expression and DE power is explored in C-F. (C) A clustered gene expression (log(RPKM)) Pearson correlation matrix. Row colors represent RNA extraction batch for RNA-seq. Column colors represent kinship cluster. (D) Variance partitioning analysis using a linear mixed model with each term as a mixed effect was used to quantify the contribution of various explanatory factors to expression of each gene. Boxplots indicate the fraction of variance explained by each factor for 0.05, 0.25, 0.5 0.75, and 0.95 percentiles across all expressed genes. As there is only one replicate per individual, a model term for individual was not appropriate, and individual effects are captured in the residual. (E) DE analysis was performed using n = 4 individuals each of chimpanzee and human. The effect of inter-related chimpanzee samples was assessed by all four chimpanzee individuals from one of the three highly inter-related clusters, or by drawing a combination of four individuals (without replacement) from the lowly inter-related cluster. The distribution of number of DE genes (E) across the resampled DE analyses is shown, as well as an empirical estimate of FDR based on the full n = 39 dataset (F). DE analyses containing outlier samples Little_R or 537, originating from the same technical batch, have a much larger effect on results than drawing from inter-related samples. Kinship matrix plotted in (A) is available as Figure 1—figure supplement 3—source data 1.
-
Figure 1—figure supplement 3—source data 1
Kinship matrix of chimpanzees in this study.
- https://cdn.elifesciences.org/articles/59929/elife-59929-fig1-figsupp3-data1-v2.txt
Figure 2 with 1 supplement
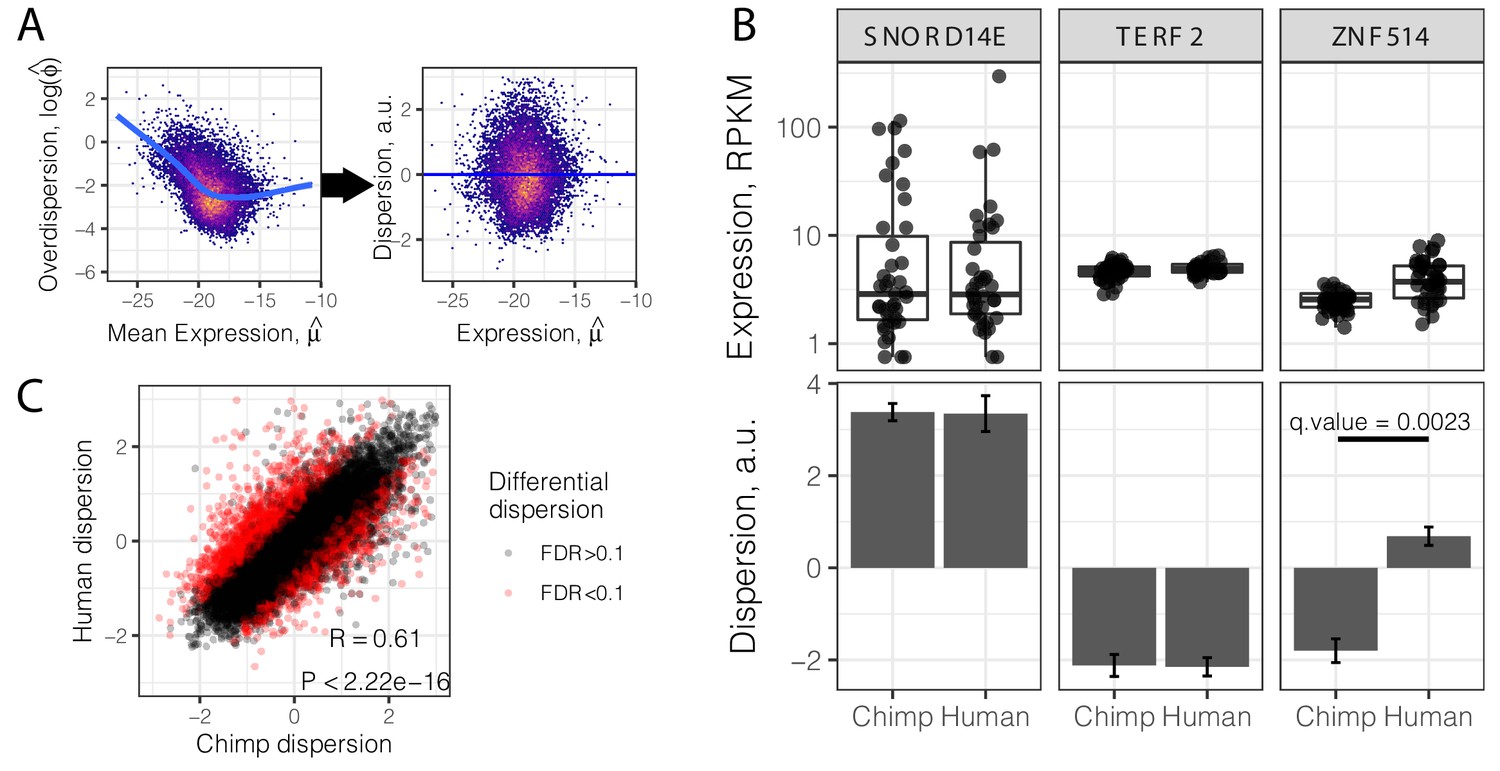
Gene variance independent of expression is correlated across species.
(A) To estimate dispersion, RNA-seq counts for 39 human heart tissue samples were used to estimate gene-wise mean (μ) and overdispersion (ϕ) parameters. Across all genes, overdispersion is correlated with mean expression (left) in the hexbin scatter plot. We regressed out this correlation, using the residual of a LOESS fitted line (blue) as a metric (dispersion) of the variability of a gene’s expression across a population relative to similarly expressed genes (a.u., arbitrary units). (B) Dispersion estimates and the underlying expression in each sample for three similarly expressed genes in human and chimpanzee. Error bars represent bootstrapped standard error. Q-value for ZNF514 represents an estimate of FDR after genome-wide multiple hypothesis testing correction. (C) Dispersion estimates across all genes are correlated across human and chimpanzee, despite identification of thousands of differentially dispersed genes in red. R and p-value correspond to Pearson’s correlation. Full dispersion estimates and differential dispersion results available as Figure 2—source data 1.
-
Figure 2—source data 1
Gene-wise dispersion estimates and differential testing.
- https://cdn.elifesciences.org/articles/59929/elife-59929-fig2-data1-v2.txt
Figure 2—figure supplement 1

Interspecies dispersion estimates are largely independent from interspecies mean expression changes.
Across all genes, the interspecies difference in dispersion, colored by significance, is plotted versus difference in mean expression.
Figure 3 with 2 supplements
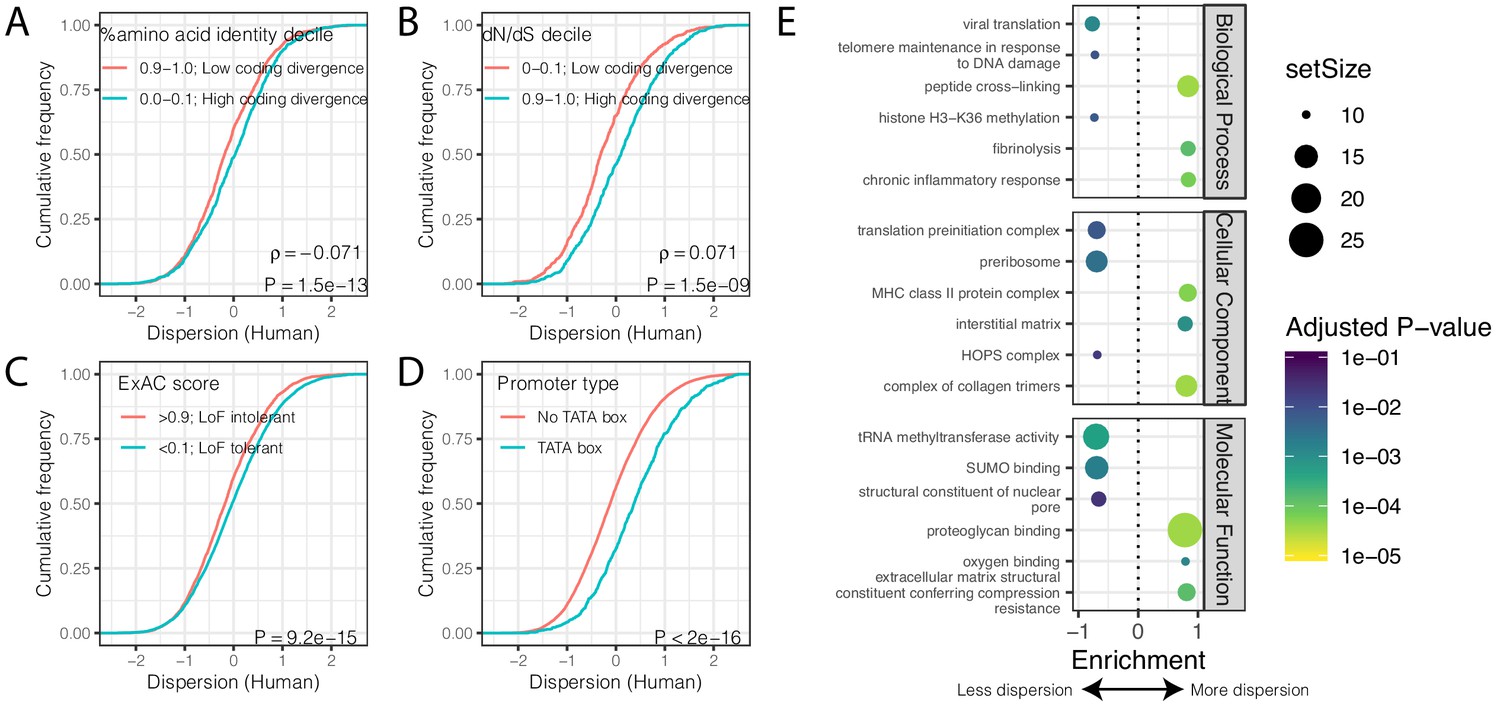
Gene features correlated with expression variability.
(A) Protein coding genes with high coding divergence (defined by amino acid identity between chimpanzee and human) generally have higher variability than genes with low coding divergence. The distribution of dispersion estimates is plotted as the empirical cumulative distribution function (ECDF) for the top and bottom decile genes by percent identity. (B) Same as (A) but defining coding divergence based on ratio of non-synonymous to synonymous substitution rates (dN/dS) across mammals. (C) Loss-of-function tolerant (LoF tolerant) genes, defined by pLI score (Lek et al., 2016), generally have higher variability than loss-of-function intolerant (LoF intolerant) genes. (D) TATA box genes generally show higher variability. P-values and ρ correlation coefficient provided for (A) and (B) represent Spearman correlation across all quantiles, rather than just the upper and lower decile, which are plotted for similar visual interpretation as (C) and (D), where the P-values provided represent a two-sided Mann-Whitney U-test. (E) Gene set enrichment analysis (GSEA) of genes ordered by human dispersion estimates. Only the top and bottom three most enriched significant categories (Adjusted p-value<0.05) are shown for each ontology set for space. Full GSEA results available as Figure 3—source data 1.
-
Figure 3—source data 1
Full GSEA results based on human dispersion levels.
- https://cdn.elifesciences.org/articles/59929/elife-59929-fig3-data1-v2.txt
Figure 3—figure supplement 1
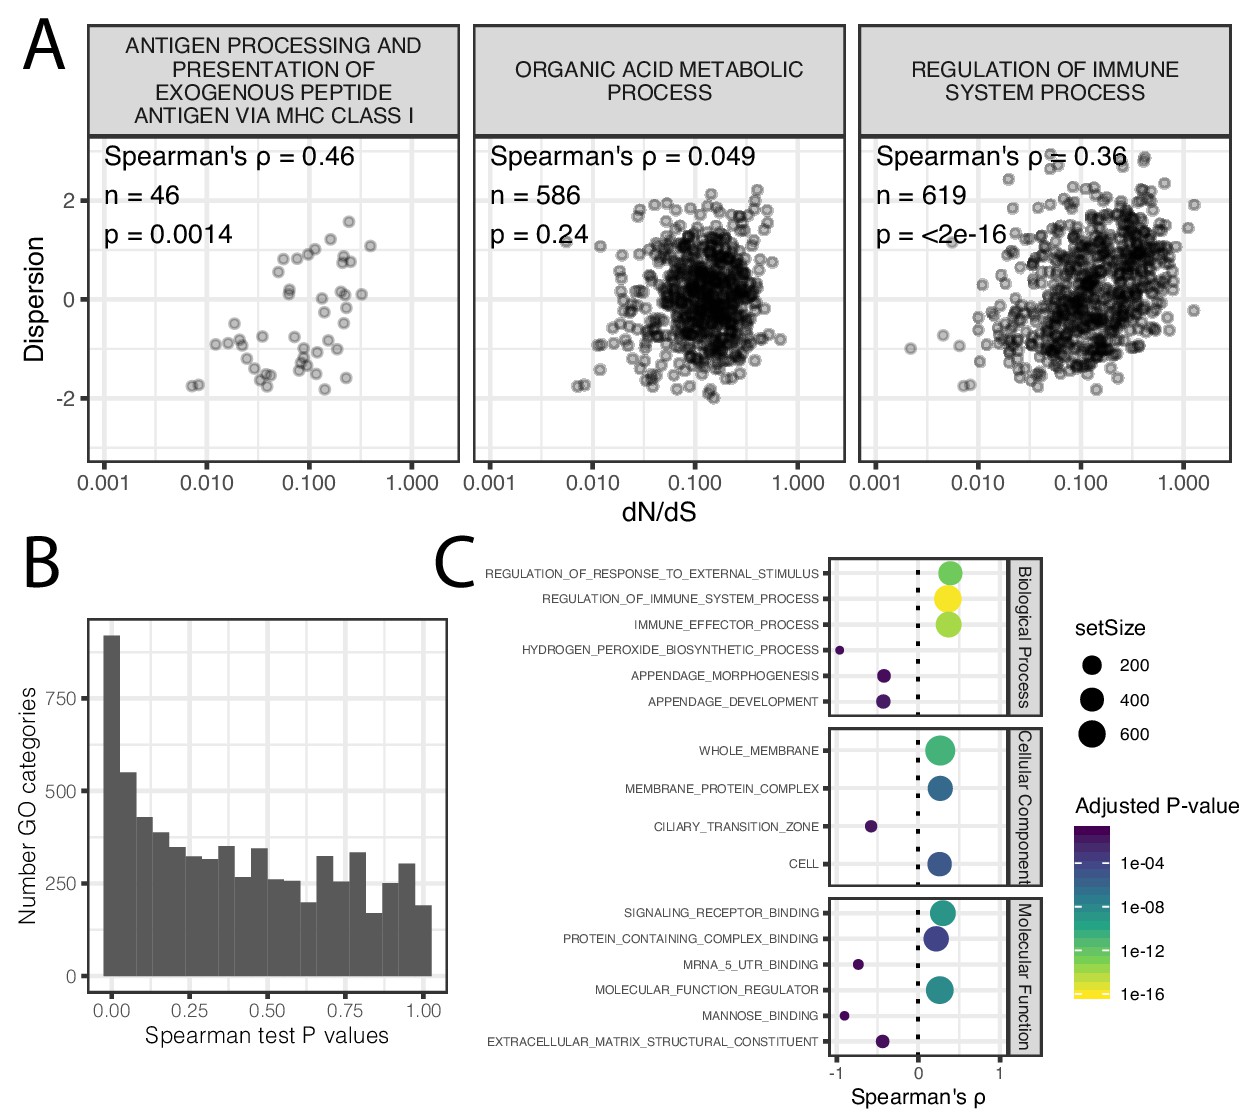
Correlation of coding conservation and dispersion across gene categories.
(A) The correlation between dN/dS across mammals and dispersion (human-chimpanzee dispersion estimate mean) when only considering genes in three example GO categories (B) Histogram of distribution of spearman correlation test p-values across GO categories. (C) The most three most significant (Adjusted p-value<0.05) gene categories for each effect direction for each ontology group. Spearman test results for all GO categories available as Figure 3—figure supplement 1—source data 1.
-
Figure 3—figure supplement 1—source data 1
dN/dS correlation with dispersion by GO category.
- https://cdn.elifesciences.org/articles/59929/elife-59929-fig3-figsupp1-data1-v2.txt
Figure 3—figure supplement 2
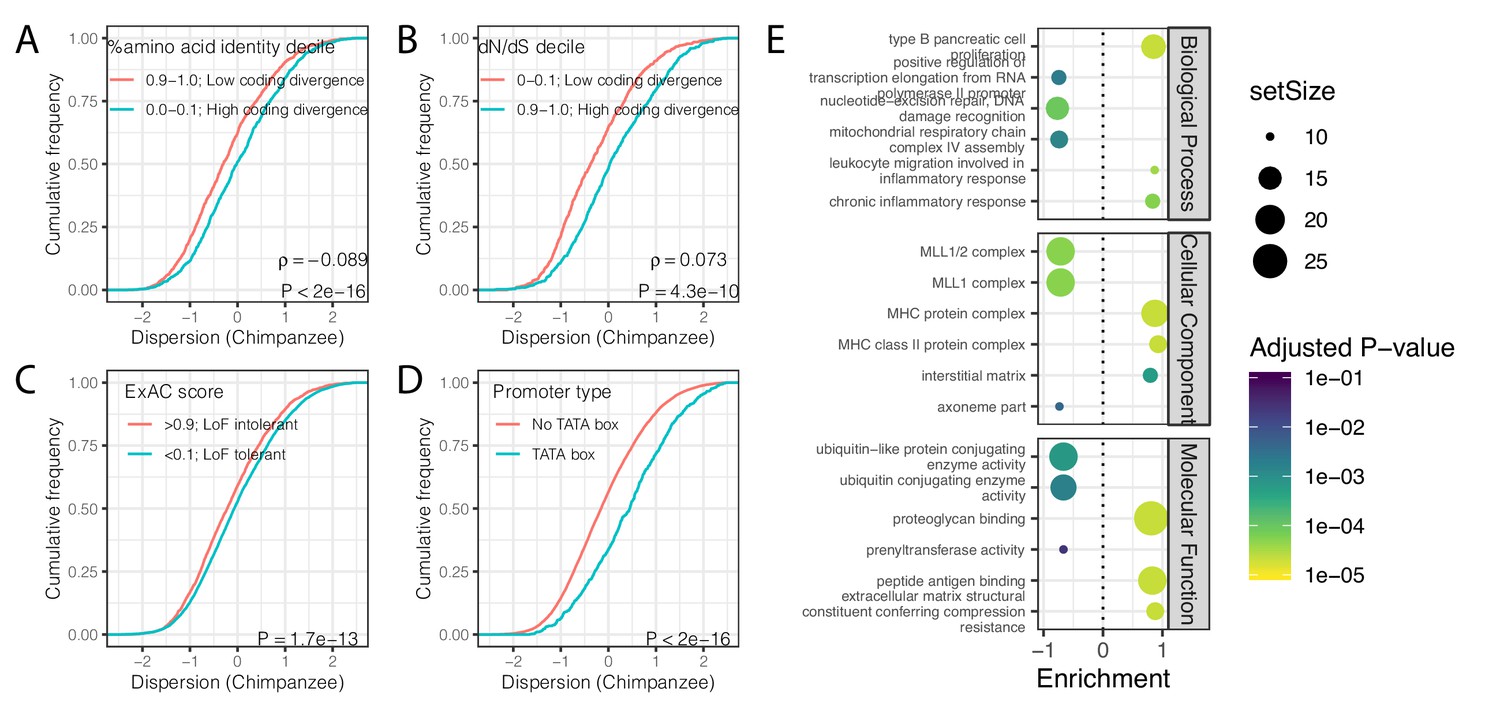
Gene features correlated with expression variability (chimpanzee).
(A) Protein coding genes with high coding divergence (defined by amino acid identity between chimpanzee and human) generally have higher variability than genes with low coding divergence. The distribution of chimpanzee dispersion estimates is plotted as the empirical cumulative distribution function (ECDF) for the top and bottom decile genes by percent identity. (B) Same as (A) but defining coding divergence based on ratio of non-synonymous to synonymous substitution rates (dN/dS) across mammals. (C) Loss-of-function tolerant (LoF tolerant) genes, defined by pLI score (Lek et al., 2016), generally have higher variability than loss-of-function intolerant (LoF intolerant) genes. (D) TATA box genes generally show higher variability. p-Values and ρ correlation coefficient provided for (A) and (B) represent Spearman correlation across all quantiles, rather than just the upper and lower decile, which are plotted for similar visual interpretation as (C) and (D), where the P-values provided represent a two-sided Mann-Whitney U-test. (E) Gene set enrichment analysis of genes ordered by chimpanzee dispersion estimates. Only the top and bottom three most enriched significant categories (Adjusted p-value<0.05) are shown for each ontology set for space.
Figure 4 with 3 supplements
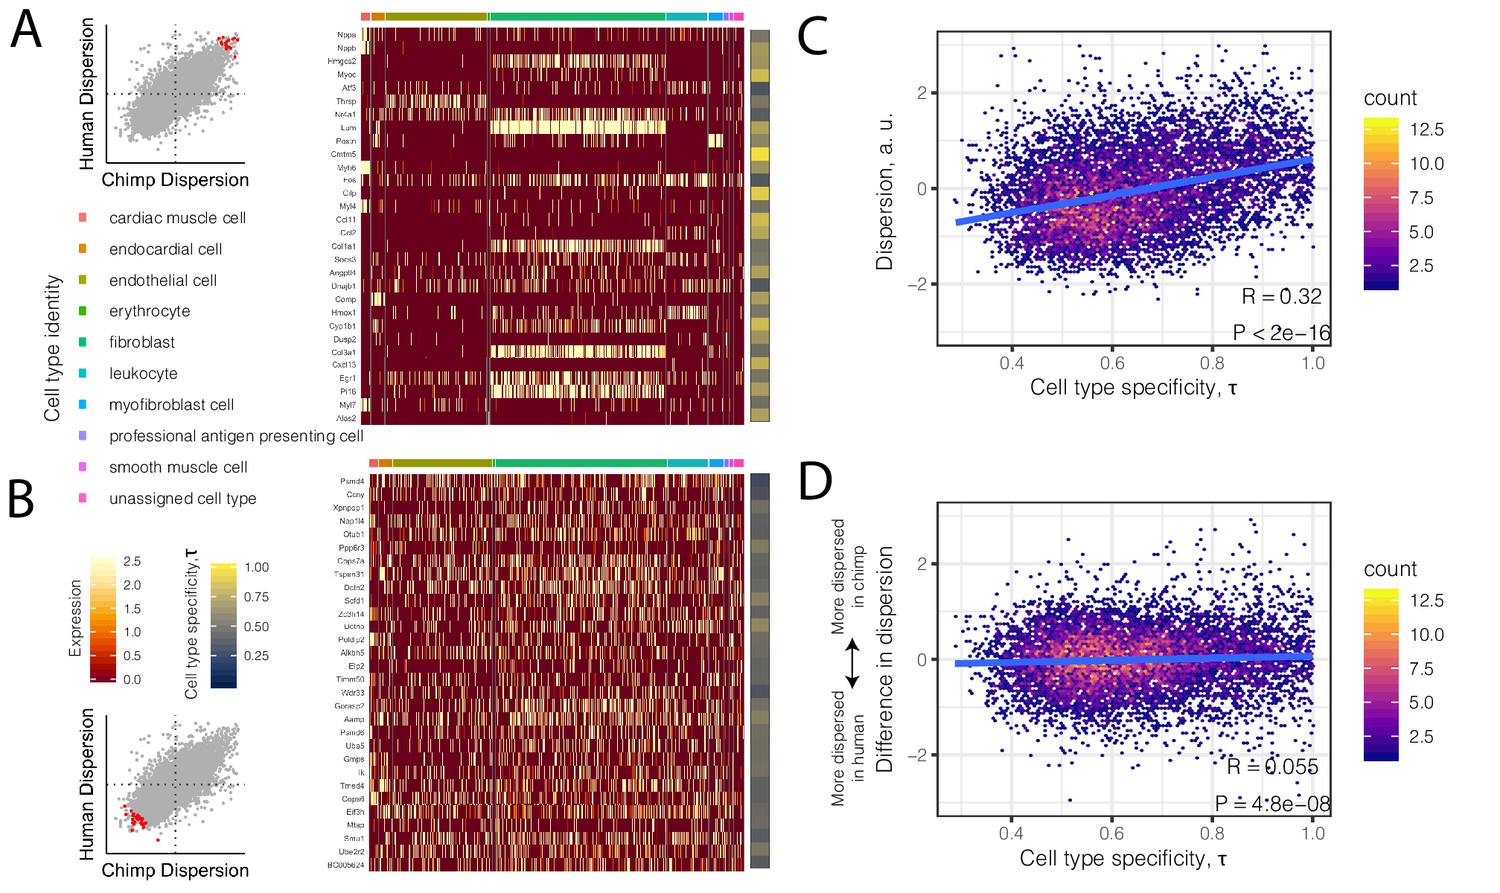
High dispersion genes are expressed in a cell-type-specific manner.
(A) The top 30 most dispersed genes (the mean of the dispersion estimates between human and chimpanzee) are shown in a mouse heart single cell RNA-seq dataset (Tabula Muris Consortium et al., 2018). Scatterplot inset on the left shows the dispersion estimate of the 30 genes in chimpanzee and human (red points) compared to all other genes (gray). Each row in the heatmap is a gene. Each column is a single cell, grouped by cell type (colors at top of columns). Normalized expression is colored in the body of the heatmap. The τ statistic, colored on the right of the heatmap, summarizes for each gene how cell-type-specific the gene is, ranging from 0 (equally expressed among all cell types) to 1 (expressed exclusively in a single cell type). (B) The same as (A) but for the bottom 30 most dispersed genes. (C) Across all genes, a hexbin scatterplot shows the correlation between cell-type-specificity (τ) estimated from mouse single-cell RNA-seq data, and dispersion (mean of human and chimpanzee dispersion for each gene) estimated from the bulk RNA-seq data. (D) The difference in dispersion between chimpanzee and human is only weakly correlated with cell-type-specificity. R and p-value for (C) and (D) represent Pearson’s correlation.
Figure 4—figure supplement 1
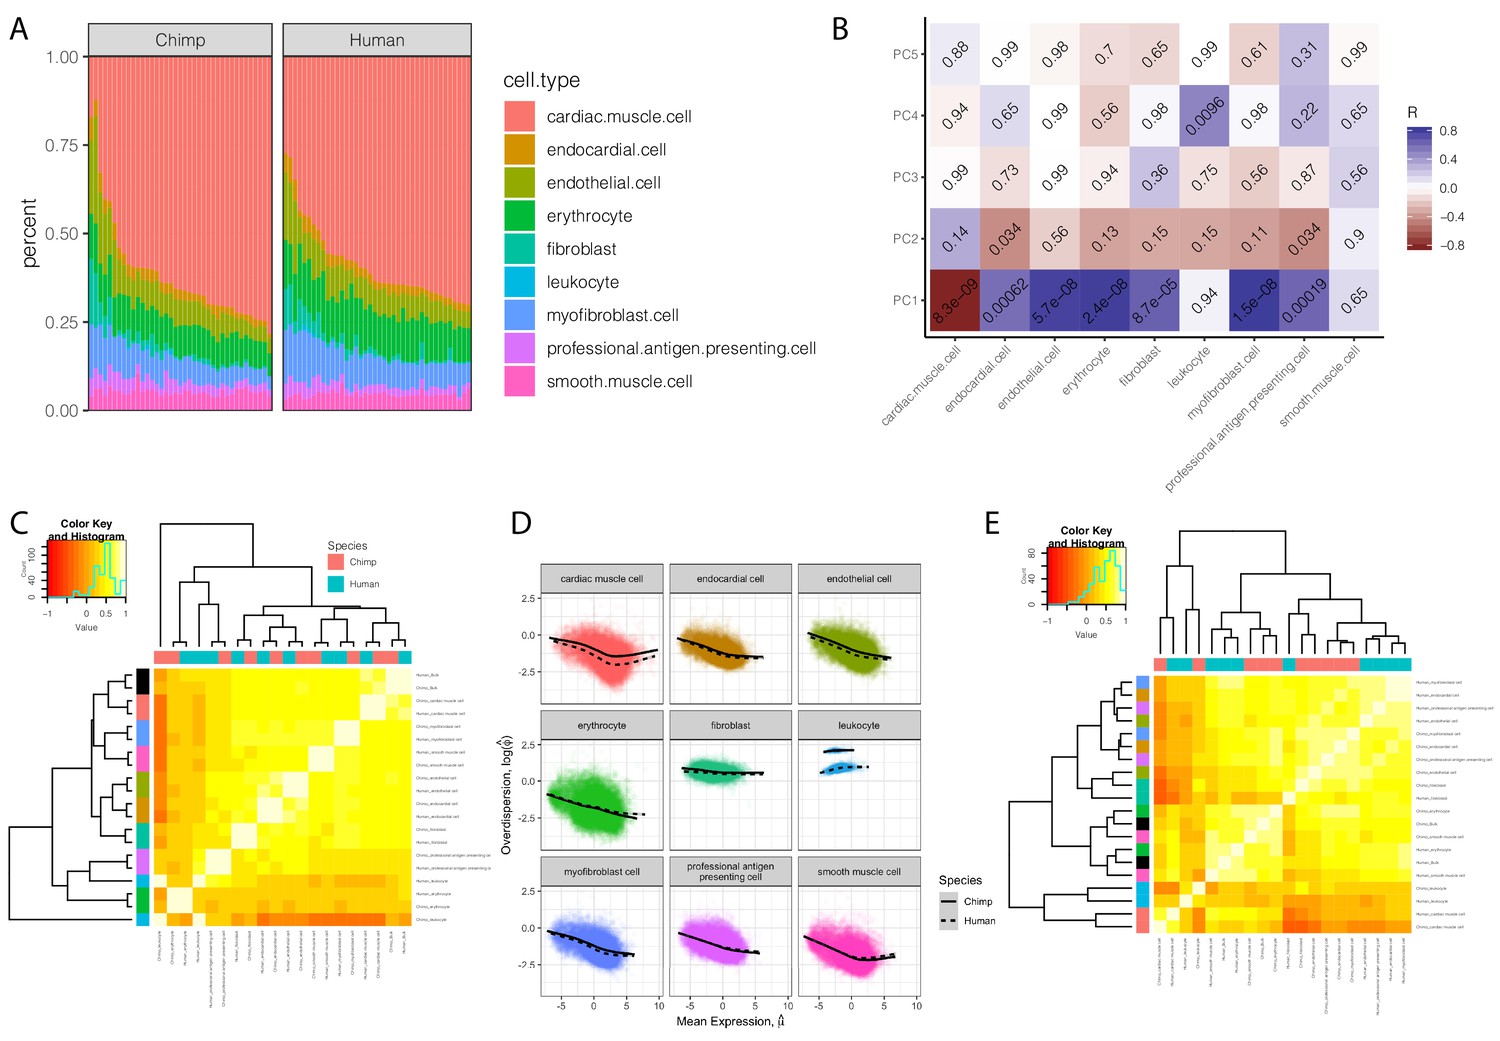
Expression and dispersion estimates that correct for cell type composition.
(A) The cell type composition estimates of chimpanzee and human bulk RNA-seq samples used in dispersion. Height of colored bars represents estimates of the proportion of each heart cell type. (B) A heatmap of the Pearson correlation between the principle components of the chimpanzee samples used in eQTL mapping, to their cell composition estimates. Benjamini-Hochberg corrected P-values for the correlation shown as text in each cell. (C) Correlation matrix of cell-type-specific population mean expression estimates estimated from deconvoluted bulk data. Hierarchal clustering reveals a clear clustering of cell types (row colors, same color key as in (A), with bulk expression profiles colored as black) over species (column colors). (D) Individual cell-type expression estimates were used to estimate dispersion with the same approach as used in bulk data: Cell-type-specific dispersion is defined as the residual of the depicted LOESS fit over the mean-overdispersion trend in each cell type in each species. (E) Correlation matrix of cell-type-specific dispersion estimates reveals a mixed hierarchal clustering pattern with respect to cell-type and species (rows and columns colored same as C). Full cell-type-specific expression and dispersion estimates used to create Pearson correlation matrices in (C) and (E) available as Figure 4—figure supplement 1—source data 1.
-
Figure 4—figure supplement 1—source data 1
Cell-type-specific expression and dispersion estimates.
- https://cdn.elifesciences.org/articles/59929/elife-59929-fig4-figsupp1-data1-v2.txt
Figure 4—figure supplement 2

Cell type heterogeneity has a strong non-technical, individual-specific component.
(A) Cell type proportion deconvolution (Donovan et al., 2020) for left ventricle and atrial appendage tissue sections from matched individuals. Height of colored bars represents estimates of the proportion of each heart cell type. Individuals are ordered identically in the left ventricle and atrial appendage sub-plots as indicated by the x-axis colorbar. (B) Variance partitioning analysis using a linear mixed model with each term as a mixed effect was used to quantify the contribution of anatomic tissue section and individual to proportion of each cell type.
Figure 4—figure supplement 3
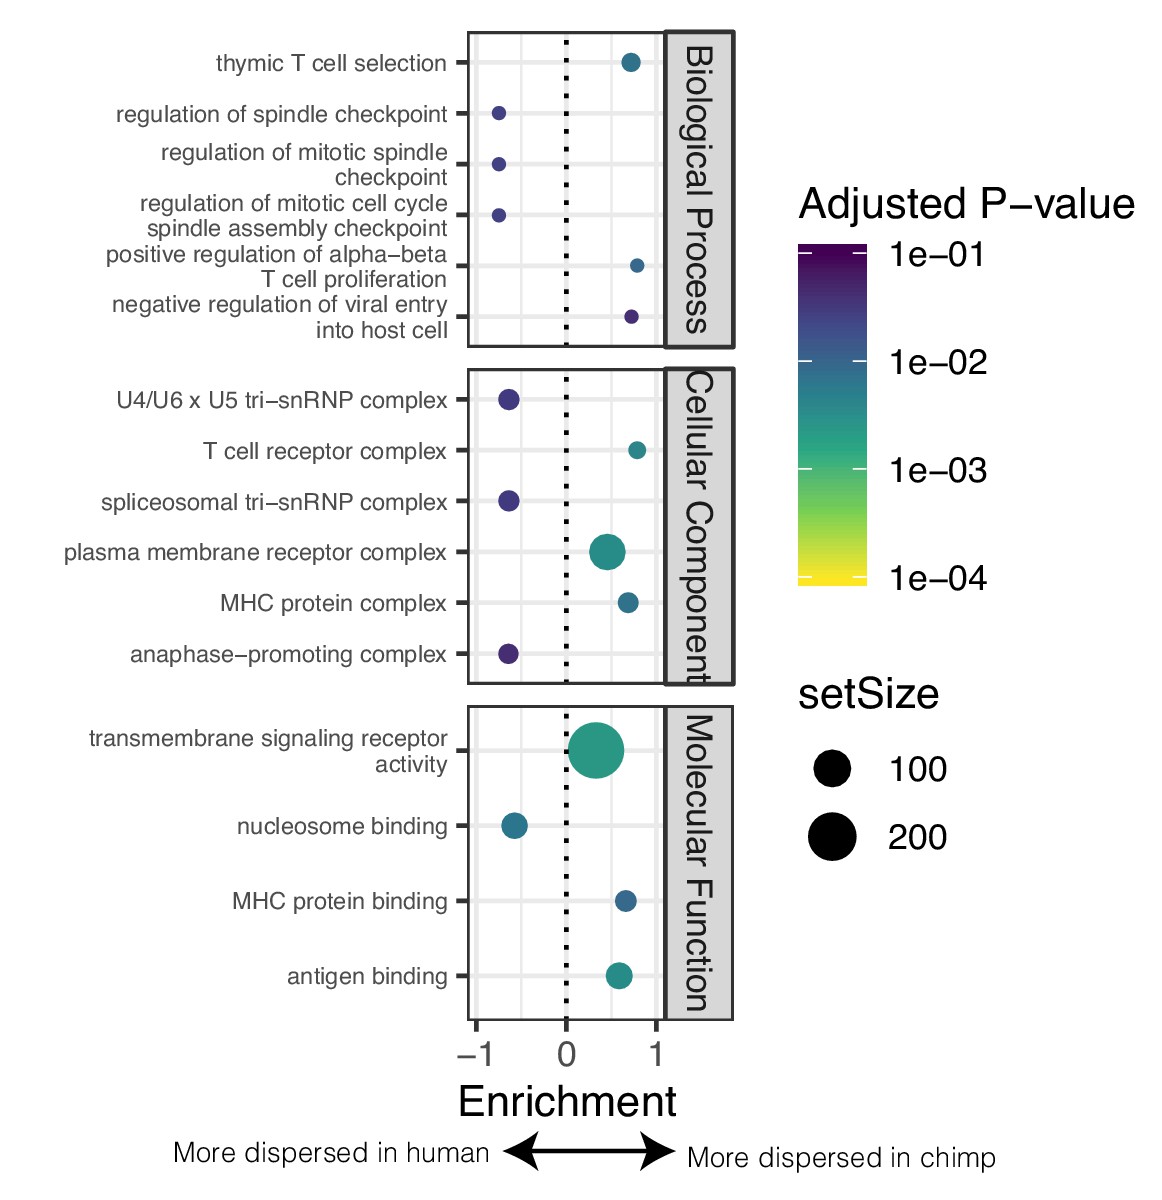
GSEA of genes with different levels of dispersion between species.
(A) GSEA of genes ordered by difference in dispersion estimates. Genes with more variable expression in chimpanzee often relate to immune response ontology terms. Genes with more variable expression in human often relate to heart function related ontology terms. Only the top three and bottom three most enriched significant terms for each sub-ontology category are shown for space. Full GSEA results available as Figure 4—figure supplement 3—source data 1.
-
Figure 4—figure supplement 3—source data 1
Full GSEA results based on interspecies dispersion differences.
- https://cdn.elifesciences.org/articles/59929/elife-59929-fig4-figsupp3-data1-v2.txt
Figure 5
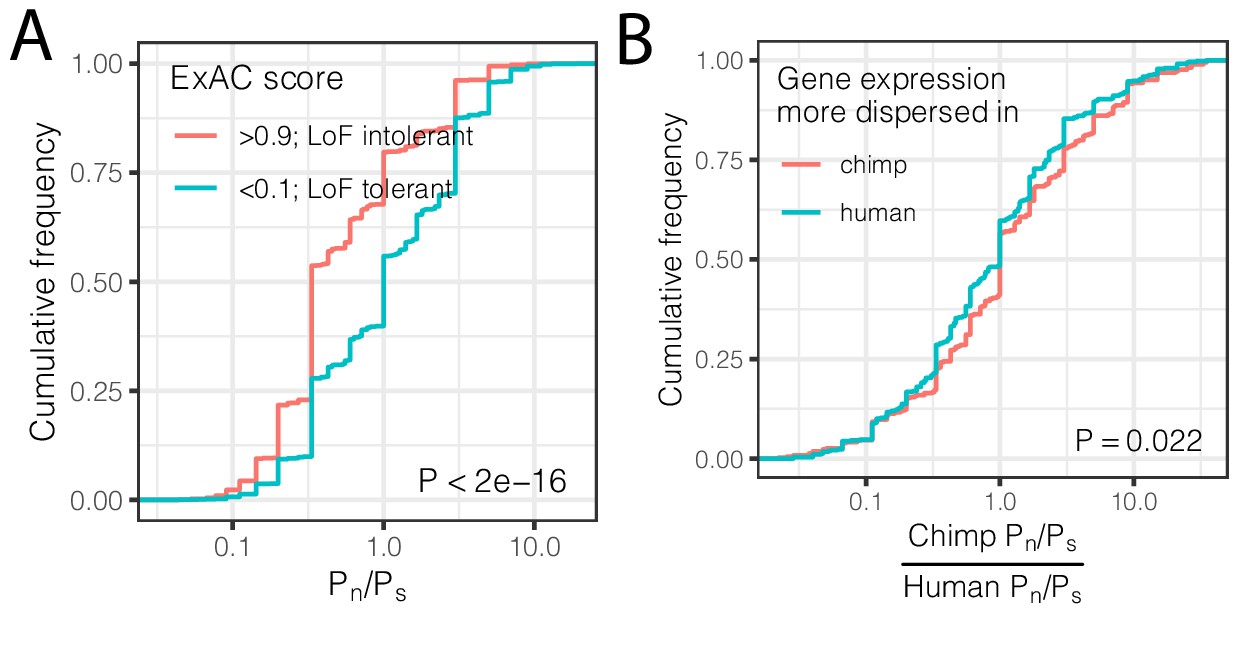
Interspecies differences in dispersion correlate to interspecies differences in coding constraint.
(A) The number of nonsynonymous polymorphisms scaled to synonymous polymorphisms (Pn/Ps) for each gene was calculated in GTEx human population. Loss-of-function tolerant (LoF intolerant) genes, defined by pLI score (Lek et al., 2016), generally have higher Pn/Ps than loss of function tolerant (LoF tolerant) genes, as shown in ECDF plot. (B) Pn/Ps was calculated for both human and chimpanzee. The distribution of the chimpanzee Pn/Ps to human Pn/Ps ratio is plotted as an ECDF, grouped by whether the gene has higher dispersion estimate in chimpanzee than in human. p-Value indicates a Mann Whitney U-test. Gene-wise Pn/Ps statistics available in Figure 5—source data 1.
-
Figure 5—source data 1
Gene-wise Pn/Ps statistics for chimpanzee and human.
- https://cdn.elifesciences.org/articles/59929/elife-59929-fig5-data1-v2.txt
Figure 6 with 4 supplements
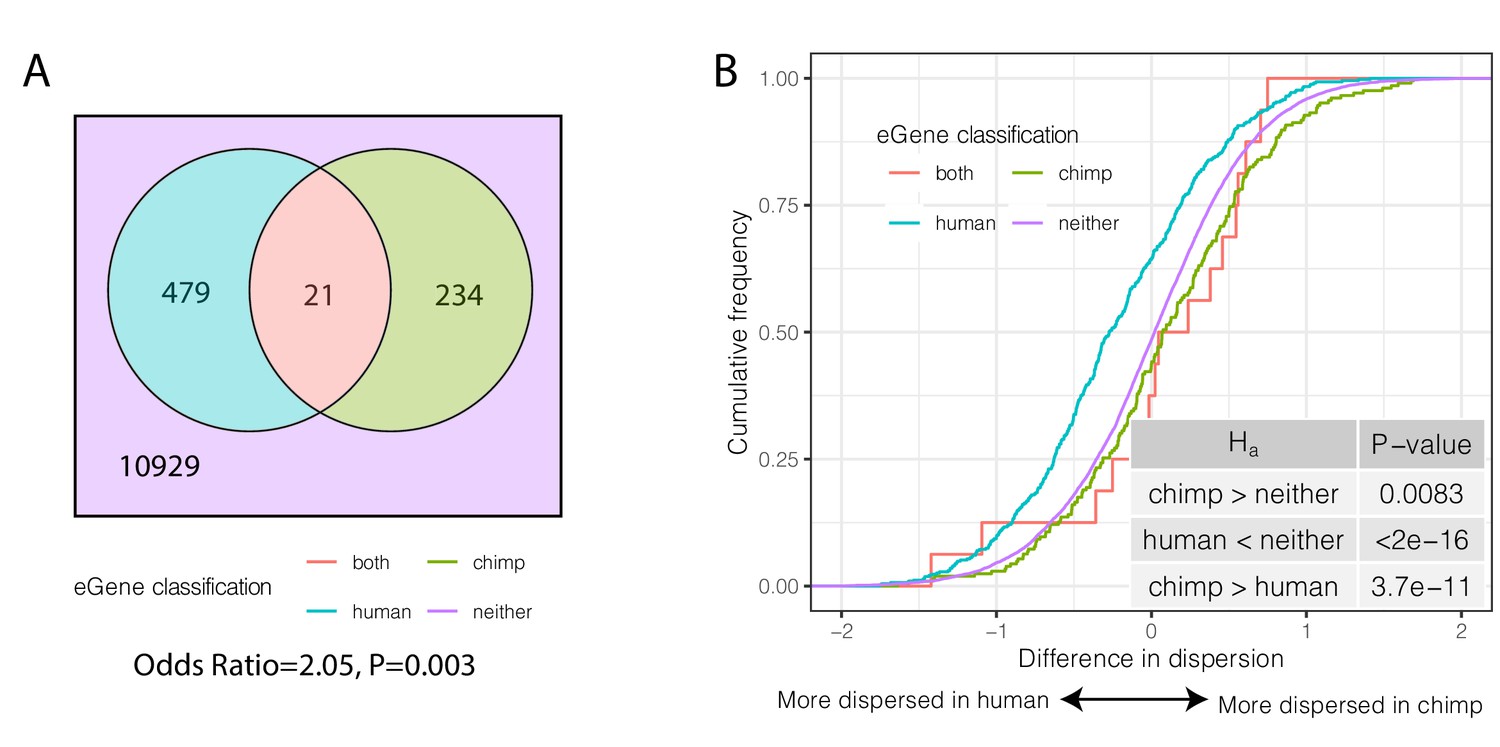
Species-sharing and dispersion of eGenes.
(A) eGenes were classified by a 10% FDR threshold in chimpanzee and considering only the top 500 eGenes by FDR in human (GTEx). (B) ECDF of the difference in dispersion of genes between chimpanzee and human. Chimpanzee-specific eGenes are more dispersed in chimpanzee; human-specific eGenes are more dispersed in human. p-Values provided for one-sided Mann-Whitney U-test with the noted alternative hypothesis.
Figure 6—figure supplement 1
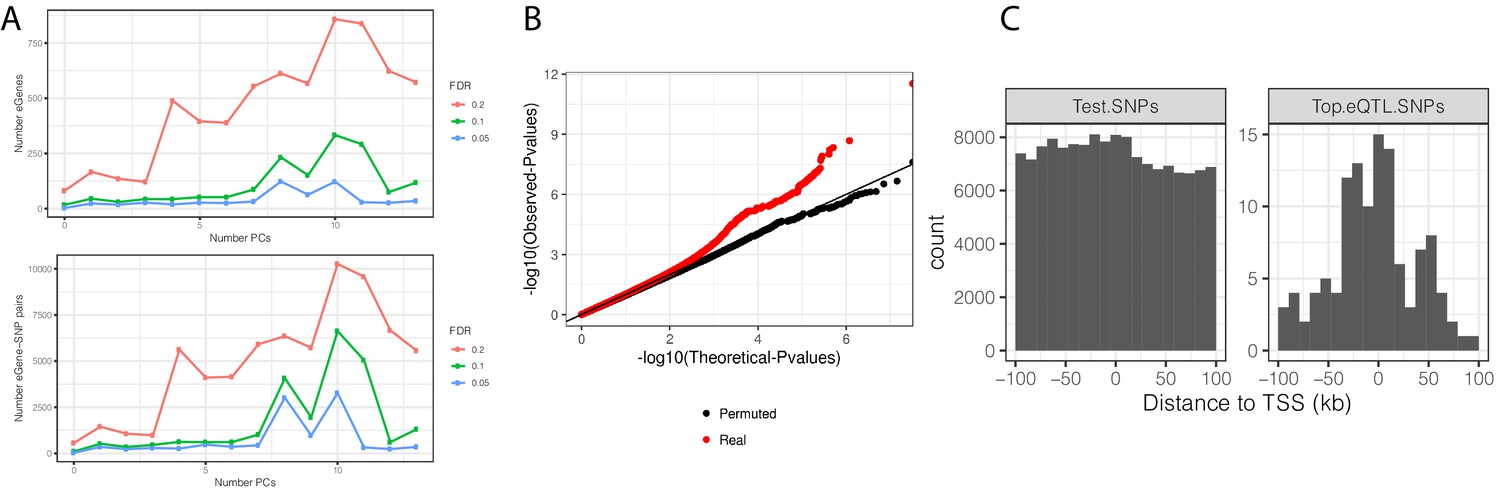
eQTL mapping in chimpanzee samples.
(A) The number of significant variant:gene pairs and eGenes is plotted when varying numbers of principle components included as covariates. (B) QQ-plot of p-values for all variant:gene pairs tested shows inflation compared to sample permutation control. (C) For eGenes (FDR < 0.1), the distribution of distances of the top eQTL variant to the transcription start site, compared to the distribution of all test variants in eGenes.
Figure 6—figure supplement 2
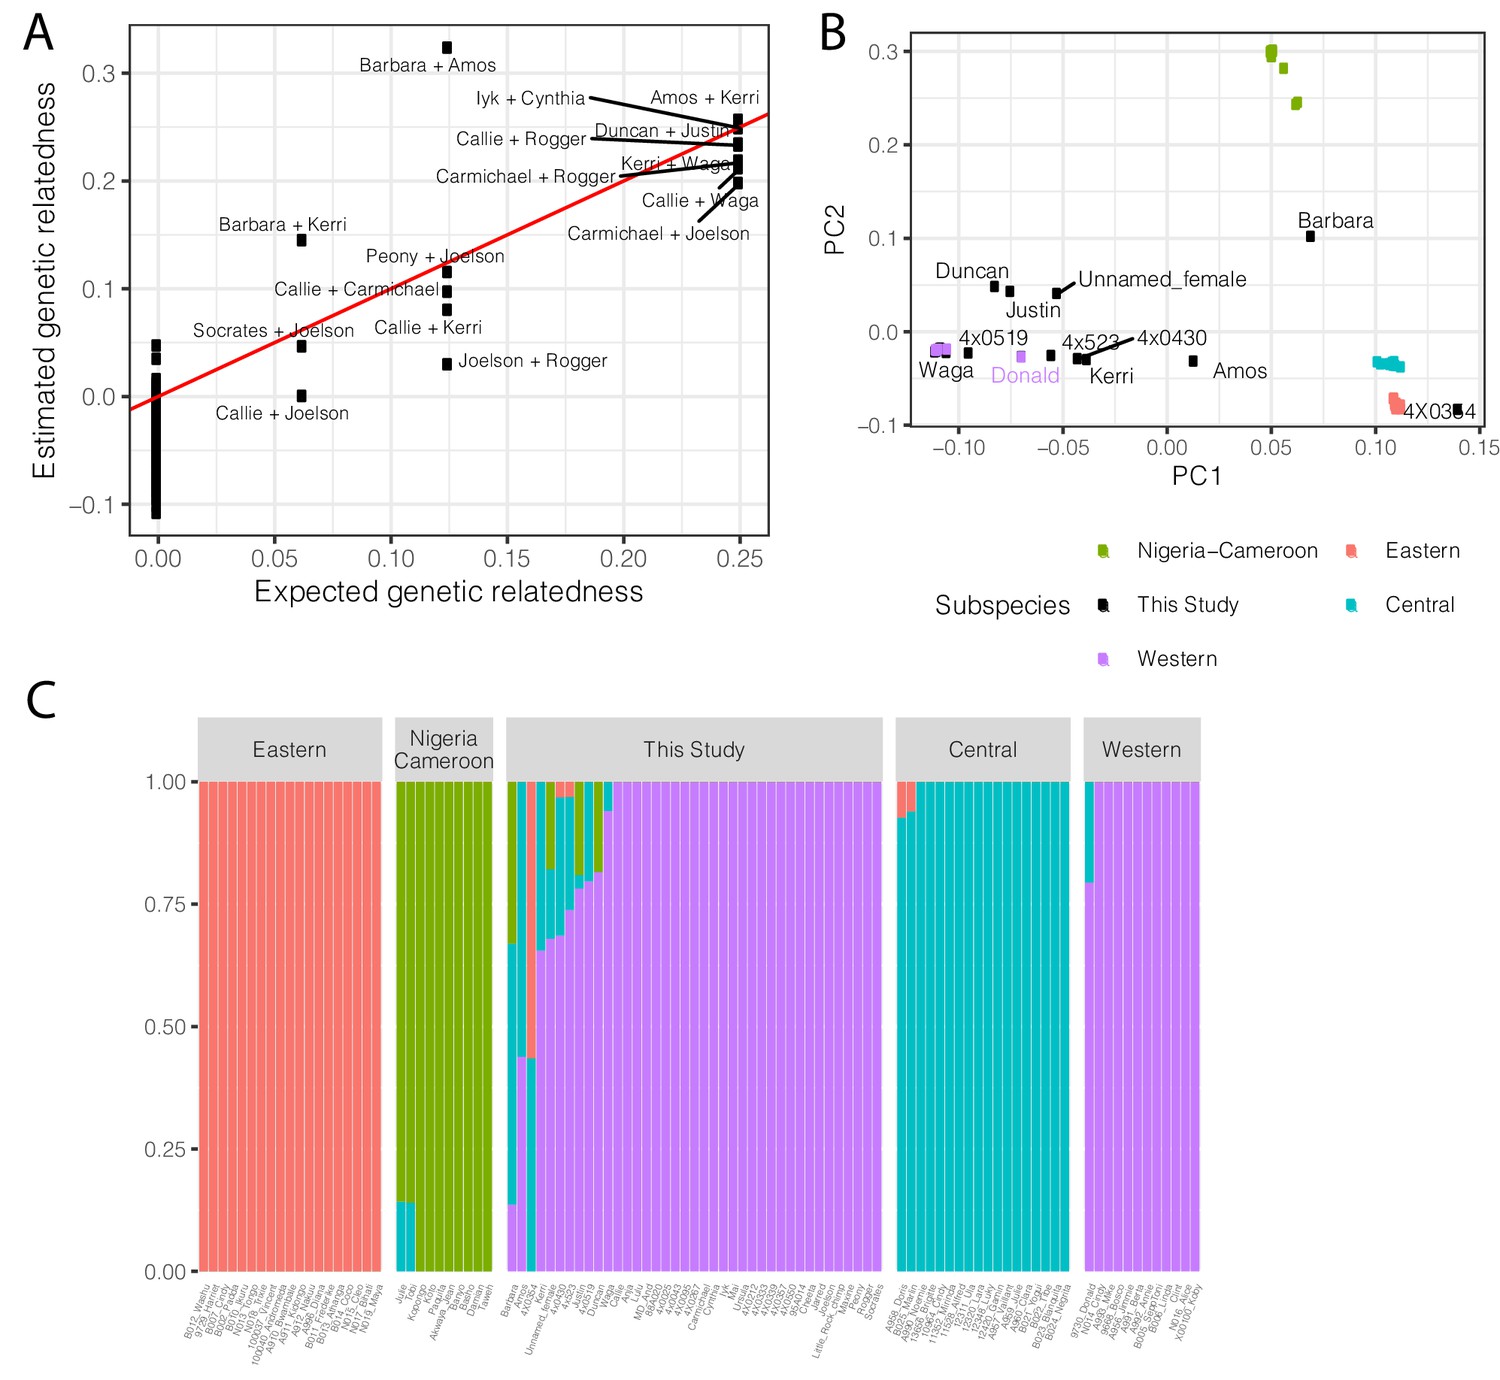
Population structure and relatedness of chimpanzee cohort based on whole genome sequencing genotyping.
(A) Scatter plot of the expected and observed genetic relatedness of each pair of chimpanzees for which we have pedigree information. We expected eight first-degree relationships (relatedness = 0.25), five second-degree relationships, and three third-degree relationships. (B) The chimpanzees sequenced in this study are generally Western chimpanzees, although recent admixture with other subspecies is prevalent for many of these captive-born chimpanzees. Principle component analysis of genotypes of newly sequenced and previously sequenced (de Manuel et al., 2016) chimpanzees. Individuals colored by subspecies for previously sequenced chimpanzees (Eastern, Pan troglodytes schweinfurthii; Western, Pan troglodytes verus; Central, Pan troglodytes troglodytes; Nigeria-Cameroon, Pan troglodytes ellioti). Donald is a previously sequenced captive born chimpanzee with known Western-Central admixture (de Manuel et al., 2016). Only newly sequenced chimpanzees with signs of admixture are labelled. (C) Admixture analysis (K = 4) of newly sequenced and previously sequenced chimpanzees. Height of bars indicates group membership. Admixture source data available as Figure 6—figure supplement 2—source data 1.
-
Figure 6—figure supplement 2—source data 1
Admixture group membership of chimpanzees in this study.
- https://cdn.elifesciences.org/articles/59929/elife-59929-fig6-figsupp2-data1-v2.txt
Figure 6—figure supplement 3
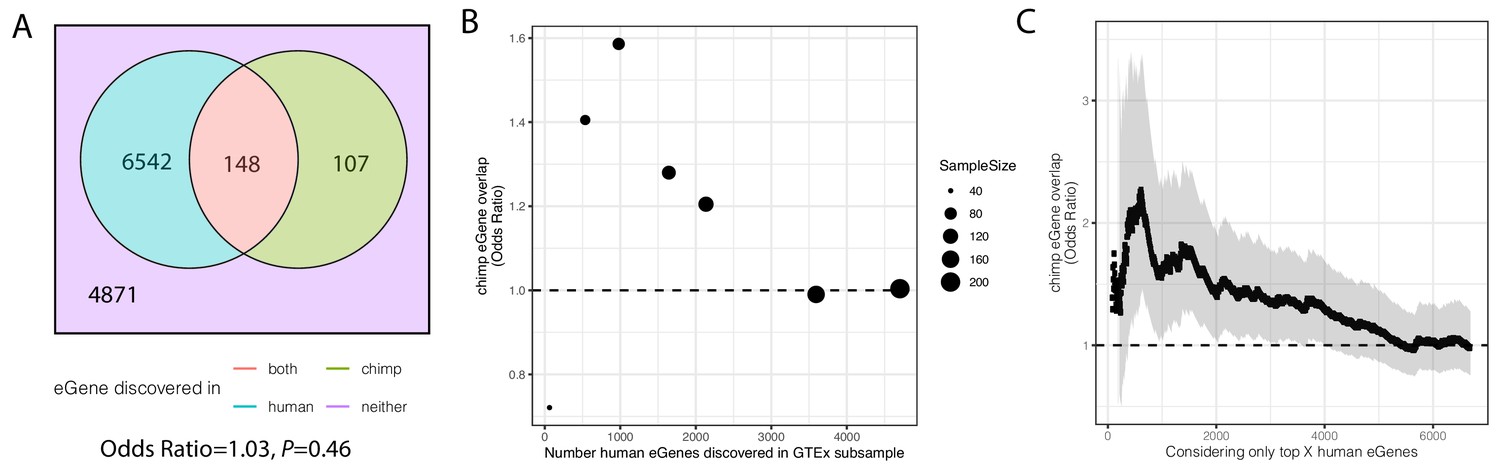
Significant overlap of eGenes between chimpanzee and human is observed when studies are similarly powered.
(A). Overlap of eGenes identified in chimpanzee (FDR < 0.1, n = 38) and human (FDR < 0.1, sourced from GTEx; n = 386). Only genes that are one-to-one orthologs and passed expression filters for testing were considered. (B) The overlap of eGenes is more than expected by chance (assessed by odds ratio >1) when the overpowered GTEx dataset is randomly subsampled to sizes more comparable to the chimpanzee dataset and genes are retested for eGene activity in the subsample. (C) Similar to (B) when only the top X genes (ranked by FDR using the full GTEx dataset) are considered human eGenes, the overlap becomes significant as eGene classification becomes more stringent. Shaded region represents 95% confidence interval of odds ratio.
Figure 6—figure supplement 4
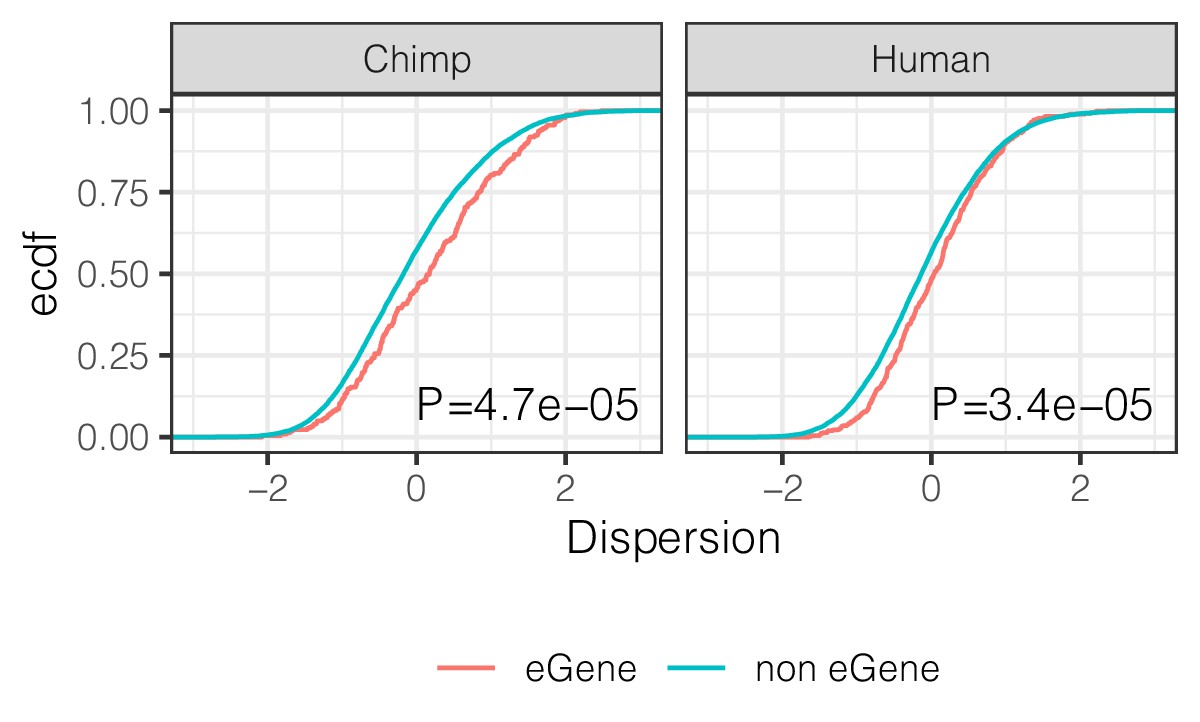
eGenes have higher dispersion than non-eGenes.
ECDF of the dispersion estimates of eGenes versus non-eGenes in chimpanzee and human. Genes are classified as eGene or non-eGene separately for chimpanzee and humans. To make cross species comparisons roughly comparable, only the top 500 eGenes by FDR in human (GTEx) are considered eGenes in the human case. p-Values provided for two-sided Mann Whitney U-test.
Figure 7 with 1 supplement
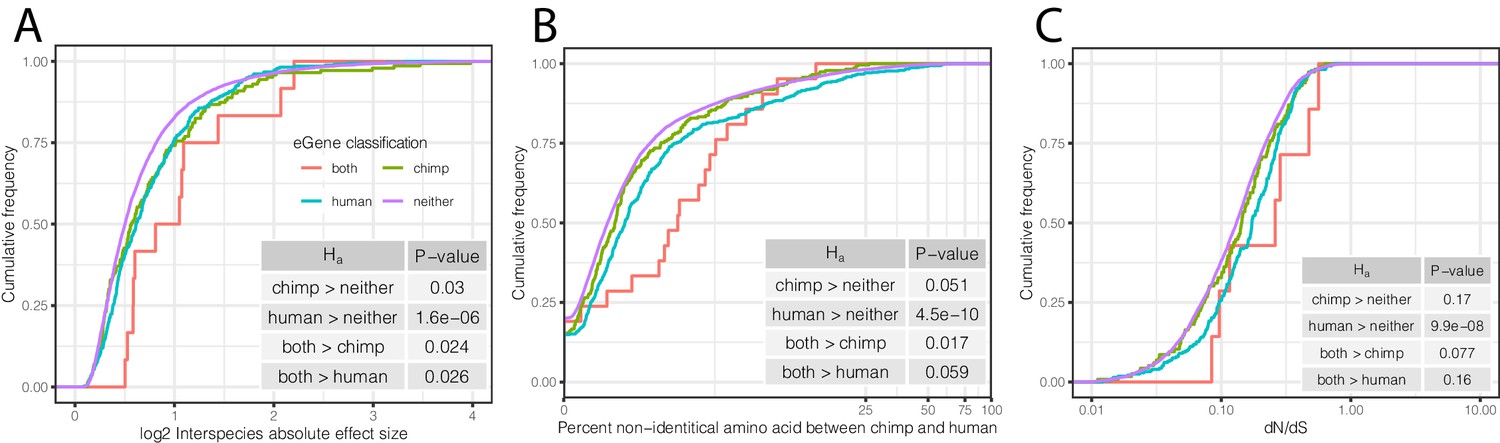
Characteristics of eGenes are consistent with less constraint on eGene expression.
(A) eGenes are more differentially expressed between species than non-eGenes, with eGenes detected in both species being even more differentially expressed. The distribution of the inter-species differential expression effect size is plotted for each eGene group as an ECDF. (B) eGenes are more diverged at amino acid level than non-eGenes. (C) Human-specific eGenes and shared eGenes are more divergent than expected under neutrality. The analogous test for chimpanzee-specific eGenes displayed a shift that was not statistically significant, although our classification of eGenes in chimpanzee may be underpowered. p-Values provided for one-sided Mann-Whitney U-tests with the noted alternative hypothesis.
Figure 7—figure supplement 1
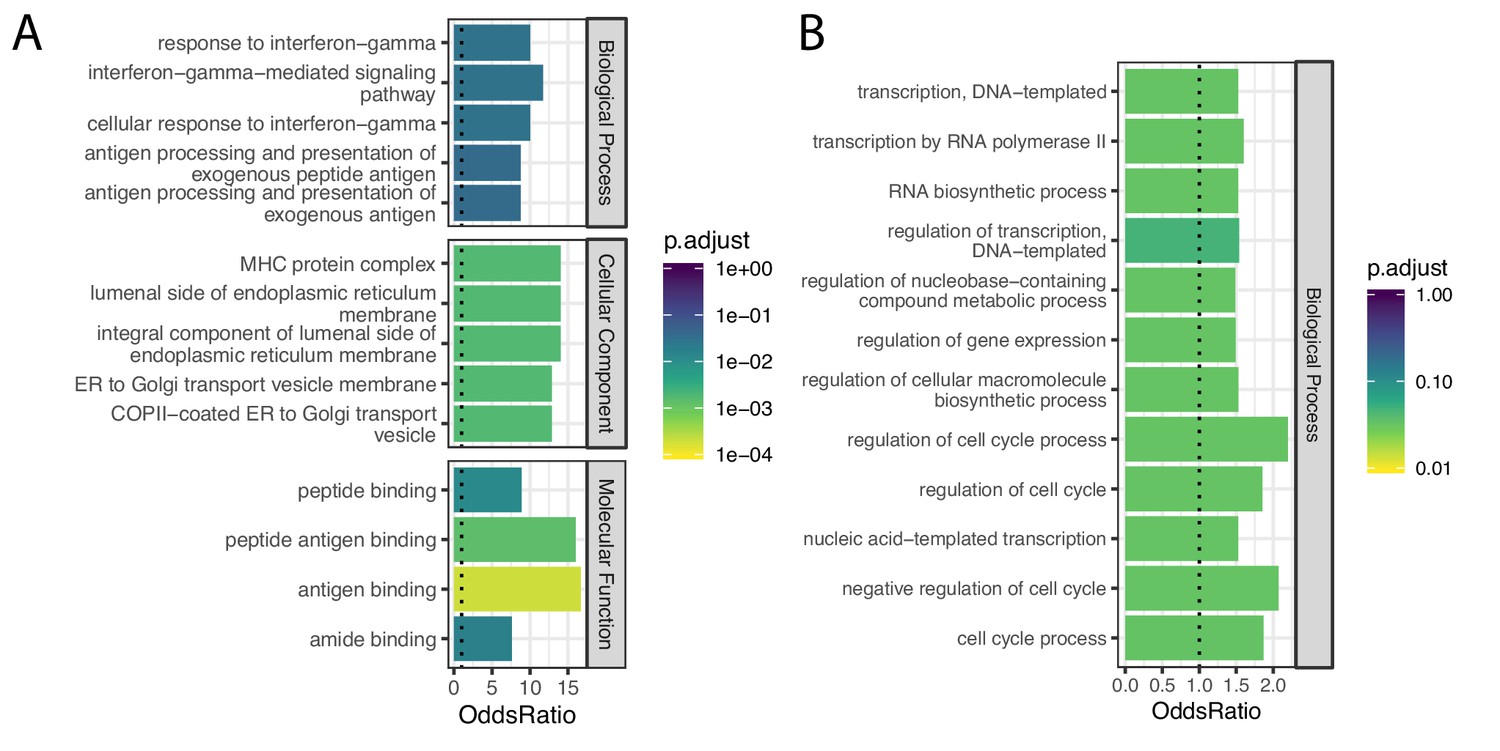
Gene categories of human-chimpanzee shared and chimpanzee-specific eGenes.
(A) Gene ontology categories enriched amongst the 21 eGenes identified in both species (foreground), compared to the 734 eGenes identified in only chimpanzee or only human (universe/background). Among the significant categories (Adjusted p-value<0.05), only the top five most enriched gene categories for each ontology set are shown for space. (B) Gene ontology categories enriched amongst the 148 eGenes identified only in chimpanzee, compared all 6797 eGenes identified in either species using the full GTEx dataset (universe/background). All significant categories are shown. Full GO enrichment results for (A) available as Figure 7—figure supplement 1—source data 1 and for (B) as Figure 7—figure supplement 1—source data 2.
-
Figure 7—figure supplement 1—source data 1
Full GO enrichment results of species-shared eGenes.
- https://cdn.elifesciences.org/articles/59929/elife-59929-fig7-figsupp1-data1-v2.txt
-
Figure 7—figure supplement 1—source data 2
Full GO enrichment results of chimpanzee-specific eGenes.
- https://cdn.elifesciences.org/articles/59929/elife-59929-fig7-figsupp1-data2-v2.txt
Figure 8 with 2 supplements
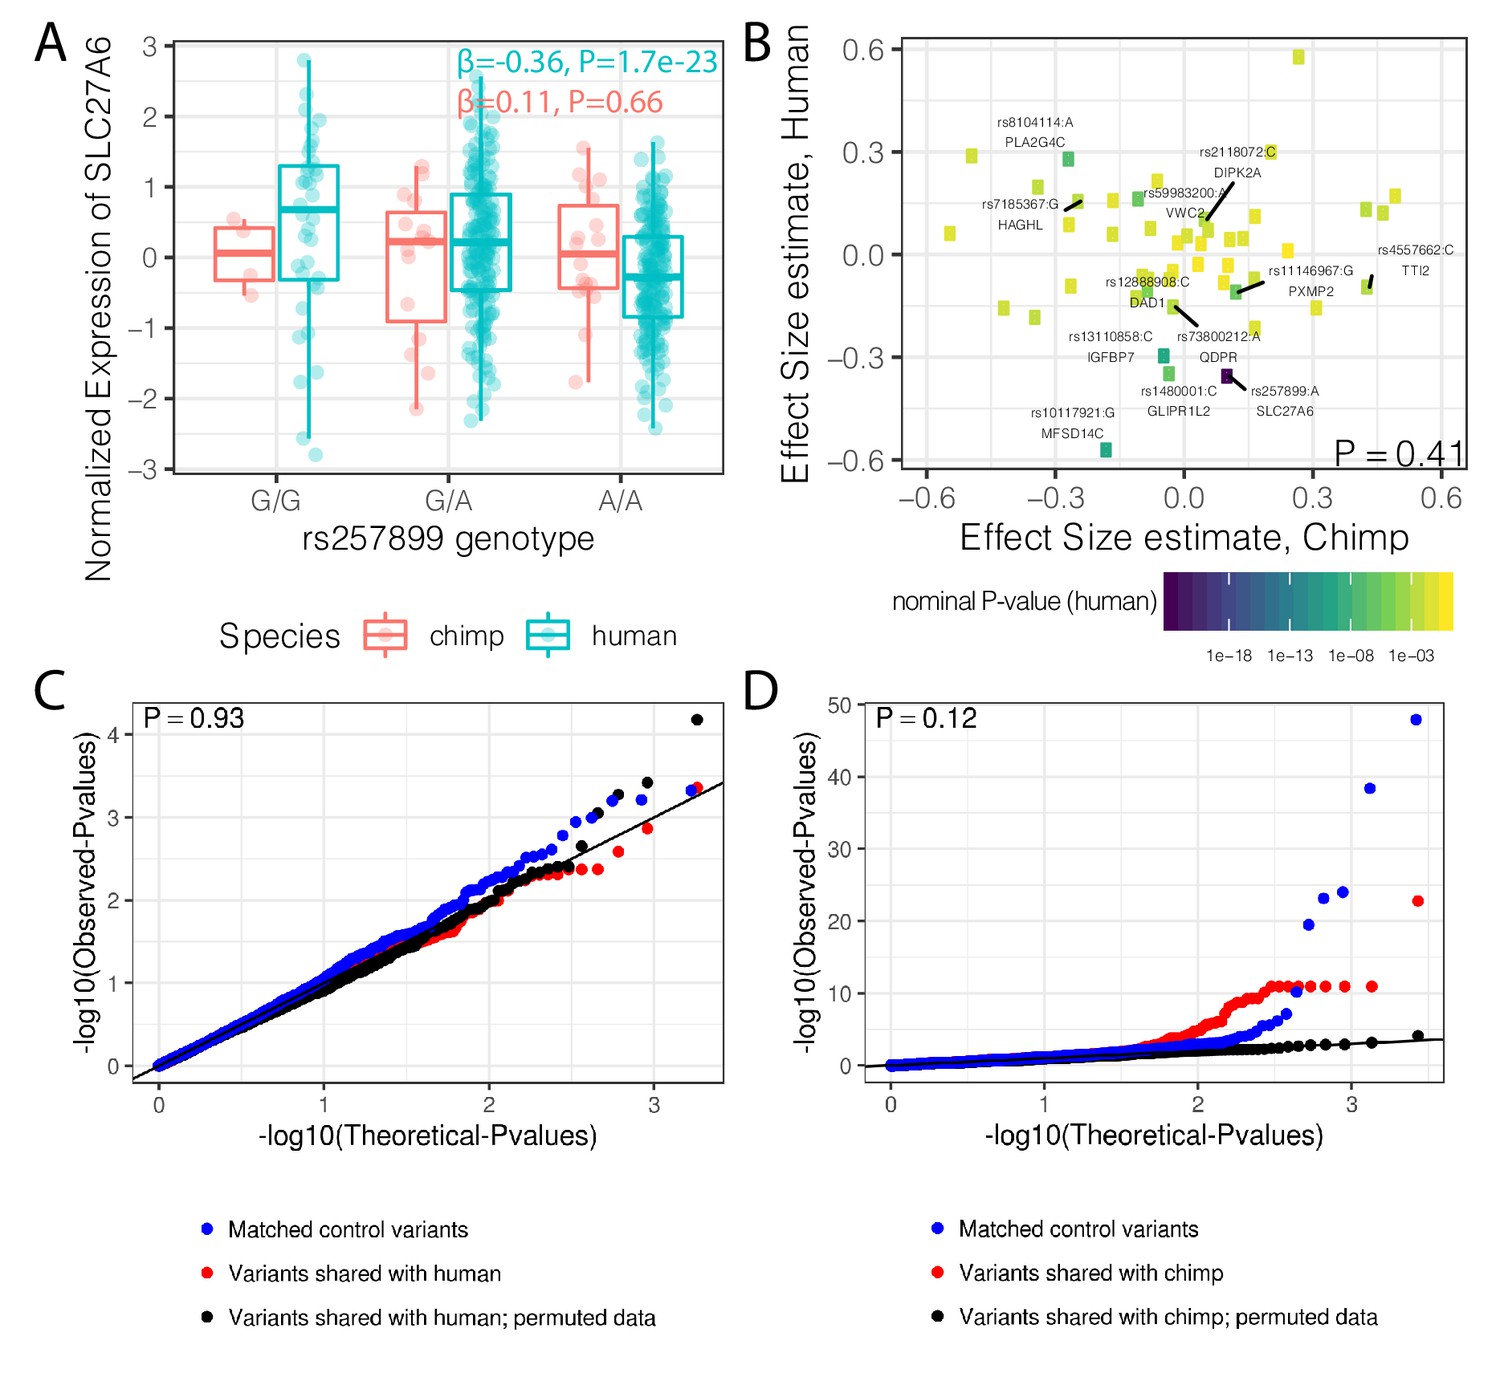
Trans-species polymorphisms do not detectably regulate gene expression.
(A) Boxplot of SLC27A6 expression stratified by species and genotype of the trans-species SNP rs257899, the most significant eQTL of the trans-species polymorphisms tested in human heart (left ventricle) in GTEx. eQTL effect size estimates (β) and nominal p-values are provided. (B) There is not a general correlation of gene regulation effects of trans-species SNPs between chimpanzee and human. For each trans-species polymorphic region previously identified (Leffler et al., 2013), the most significant SNP:gene pair in human is shown with the effect size estimate in both human and chimpanzee. Only the 48 regions where the strongest human SNP:gene association was also a one-to-one ortholog and the same SNP:gene pair was also tested in chimpanzee were plotted. Labeled SNP:gene pairs indicate FDR < 0.1 in human. One sided P-value provided for Pearson correlation, under the alternative hypothesis that effect sizes should be positively correlated between species. Only SNP:gene pairs FDR < 0.1 in human were considered for this test. (C) The trans-species polymorphisms do not have detectable cis eQTL activity in chimpanzee. QQ-plot of p-values of cis eQTL activity of the trans-species polymorphisms, compared to a sample permutation control, and to a control set of SNPs. (D) Same as (C) but testing cis eQTL activity in human. p-Values provided for (C) and (D) represent one-sided Mann-Whitney U-test with the alternative hypothesis that trans-species polymorphisms have smaller cis eQTL p-values than the control SNPs.
Figure 8—figure supplement 1
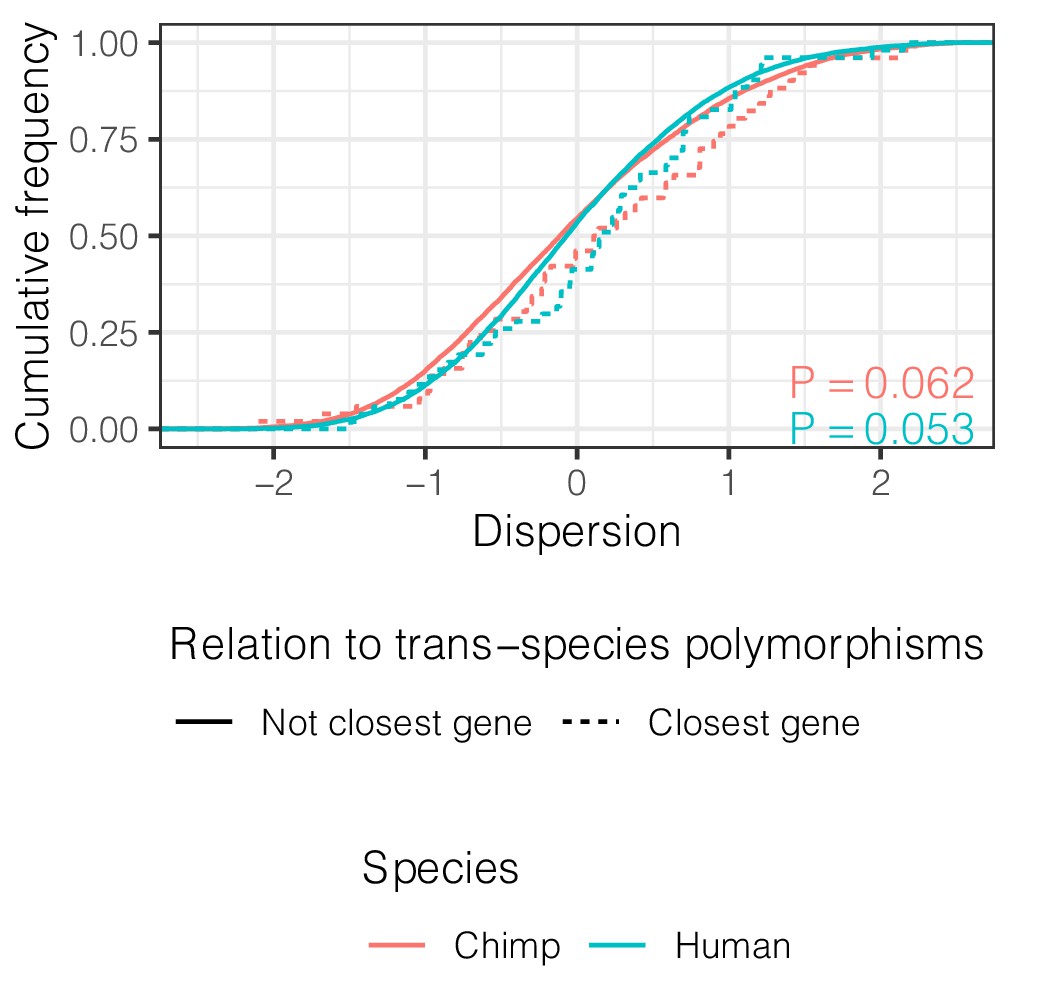
Genes closest to trans-species polymorphisms exhibit similar dispersion.
ECDF of dispersion estimates in chimpanzee and human of these genes (defined as closest protein coding gene to trans-species SNP and <100 kb away). p-Values represent a two-sided Mann-Whitney U-test for each species.
Figure 8—figure supplement 2

Trans-species polymorphisms do not regulate gene expression differently than control SNPs across all GTEx tissues.
(A) The distribution of the smallest eQTL P-value in GTEx tissues for each trans-species polymorphism, compared to the matched control set of SNPs (<100 kb from trans-species polymorphism but unlinked and matched for allele frequency; see Materials and methods). p-Value represents one-sided Mann-Whitney test, with the alternative hypothesis that trans-species polymorphisms have smaller cross-tissue minimum p-values (B) The distribution of GTEx tissues of the smallest eQTL p-value for each trans-species polymorphism, compared to matched control set of SNPs.
Author response image 1
Author response image 2
Author response image 3
Additional files
-
Supplementary file 1
Full GSEA results based on interspecies dispersion differences after excluding virally challenged chimpanzees.
- https://cdn.elifesciences.org/articles/59929/elife-59929-supp1-v2.txt
-
Supplementary file 2
Whole genome sequencing sample summary statistics.
- https://cdn.elifesciences.org/articles/59929/elife-59929-supp2-v2.txt
-
Supplementary file 3
Chimpanzee eGene summary statistics.
- https://cdn.elifesciences.org/articles/59929/elife-59929-supp3-v2.txt
-
Transparent reporting form
- https://cdn.elifesciences.org/articles/59929/elife-59929-transrepform-v2.docx
Download links
A two-part list of links to download the article, or parts of the article, in various formats.
Downloads (link to download the article as PDF)
Open citations (links to open the citations from this article in various online reference manager services)
Cite this article (links to download the citations from this article in formats compatible with various reference manager tools)
Gene expression variability in human and chimpanzee populations share common determinants
eLife 9:e59929.
https://doi.org/10.7554/eLife.59929


