Mutations primarily alter the inclusion of alternatively spliced exons
- Centre for Genomic Regulation (CRG), The Barcelona Institute of Science and Technology (BIST), Spain
- Institució Catalana de Recerca i Estudis Avançats (ICREA), Spain
- Universitat Pompeu Fabra (UPF), Spain
Figures
Figure 1 with 1 supplement
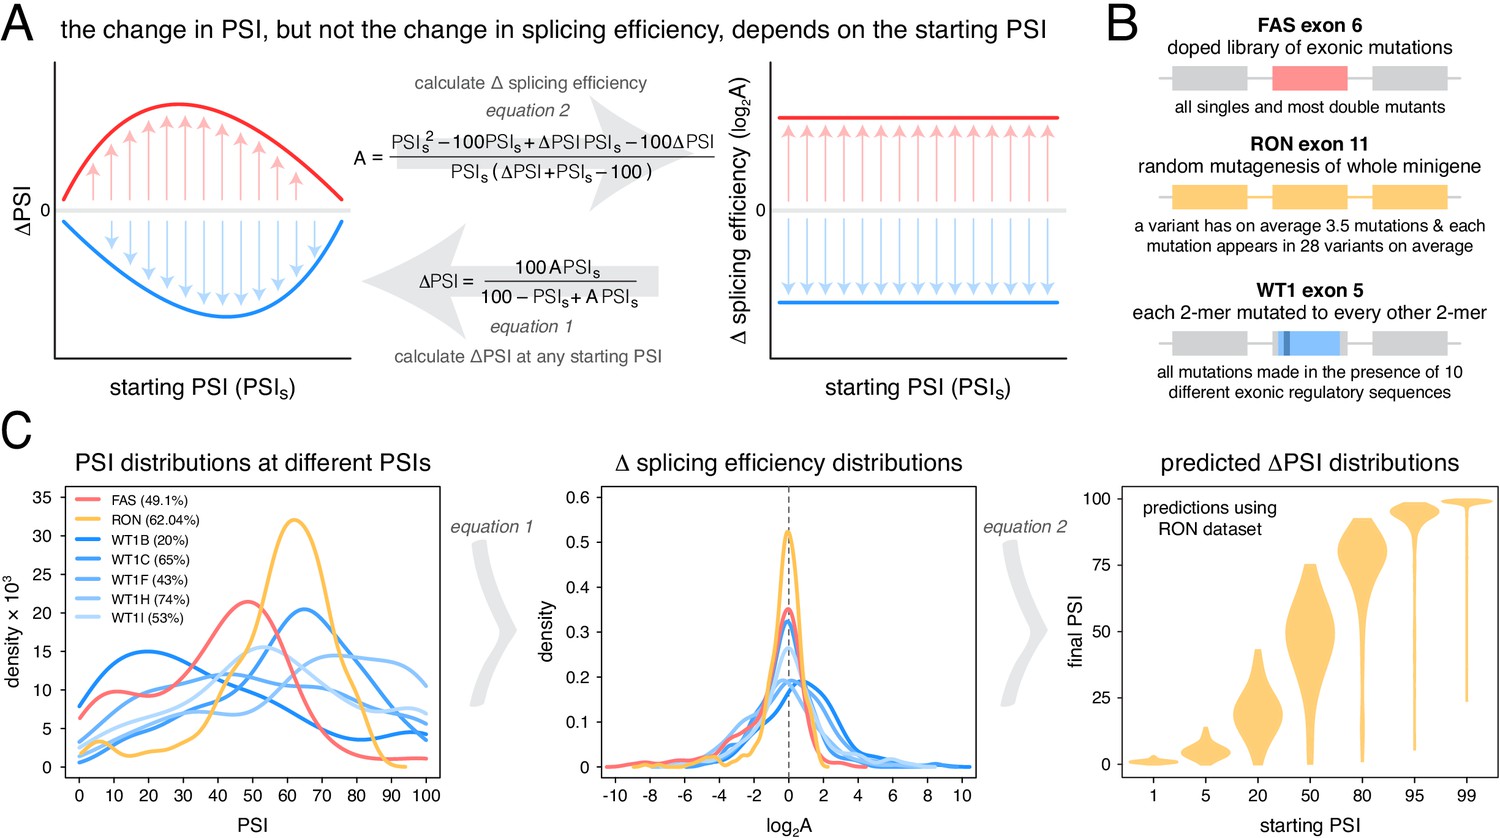
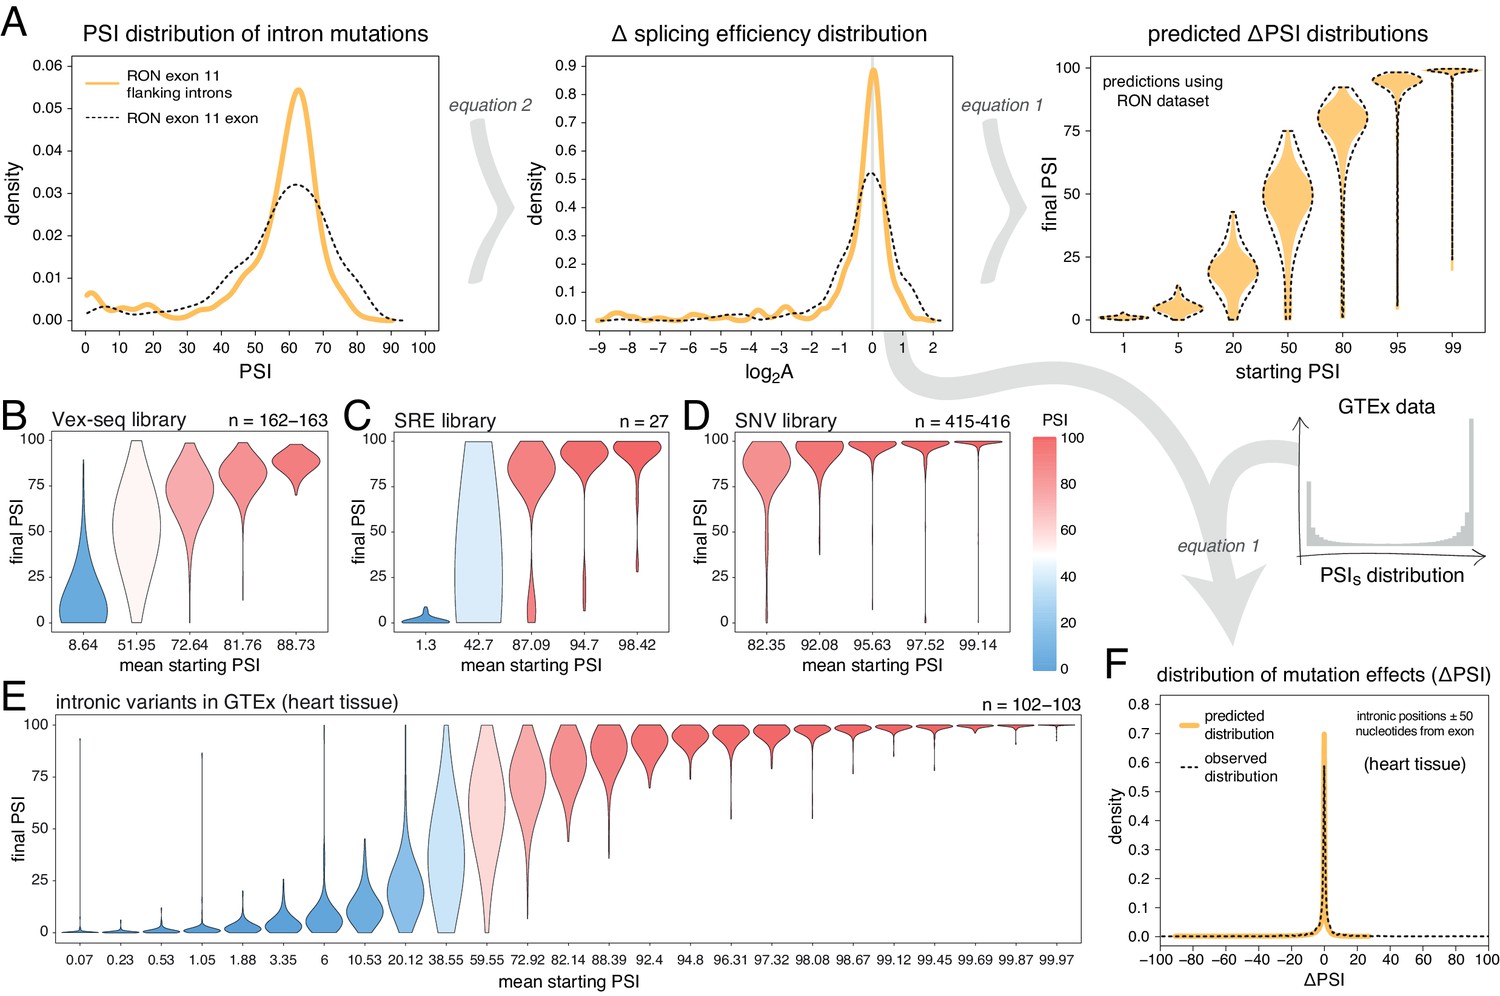
Scaling of mutation effects.
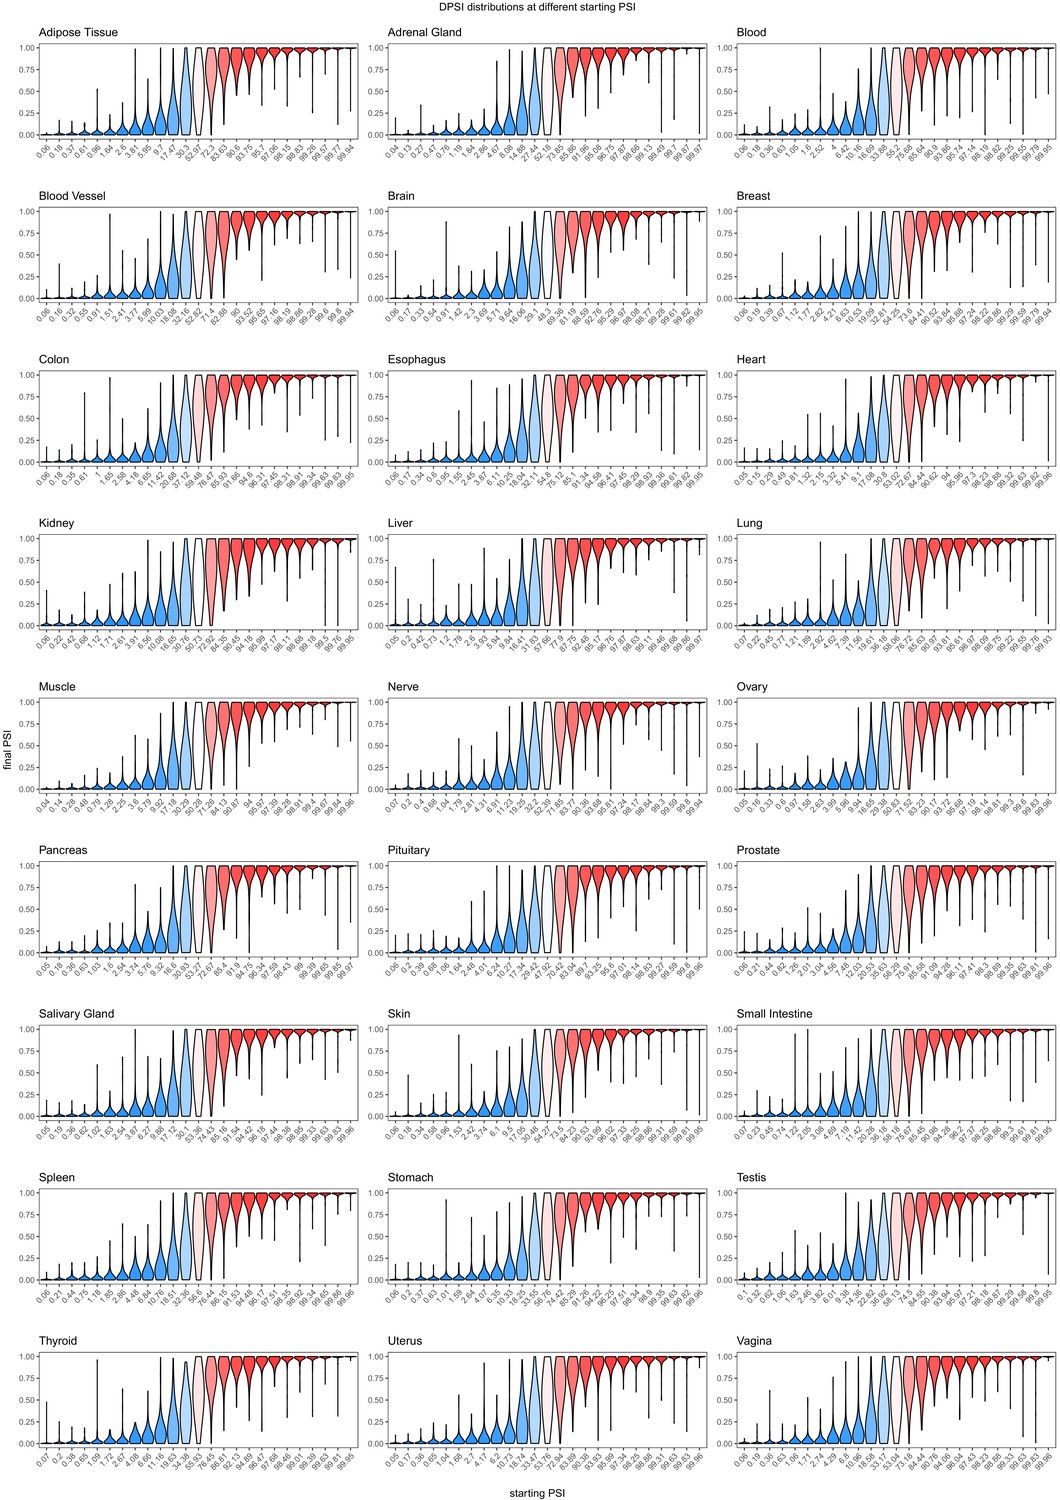
(A) Mutation-induced changes in exon inclusion (ΔPSI) depend on the initial inclusion levels (starting PSI or PSIs), but the underlying additive effect (A, which can also be interpreted as the change in splicing efficiency) of a mutation is independent of the starting PSI. The relationship between ΔPSI and A is given by precise mathematical equations and if the additive effect A of a mutation is known, its ΔPSI at any starting PSI can be calculated. (B) Previous deep mutagenesis experiments in three alternative exons. The FAS exon six experiment (Julien et al., 2016) involved systematically mutating all positions in the cassette exon. The RON exon 11 experiment (Braun et al., 2018) involved the mutagenesis of the entire minigene. The WT1 exon five experiment (Ke et al., 2018) involved systematic mutagenesis of exonic positions except for splice sites. (C) The ΔPSI distributions generated by mutations in the experiments described in B can be converted to distributions of the underlying additive effects (using Equation 1 shown in A). These distributions can be used to predict the distribution of ΔPSI values at any starting inclusion levels (using Equation 2 shown in A), allowing us to scale a distribution of ΔPSI mutation effects for any starting PSI. The violin plots in the right-most panel show the PSI distributions from the RON exon 11 dataset (Braun et al., 2018) as they would look if the exon was included at the levels shown in the x axis.
Figure 1—figure supplement 1
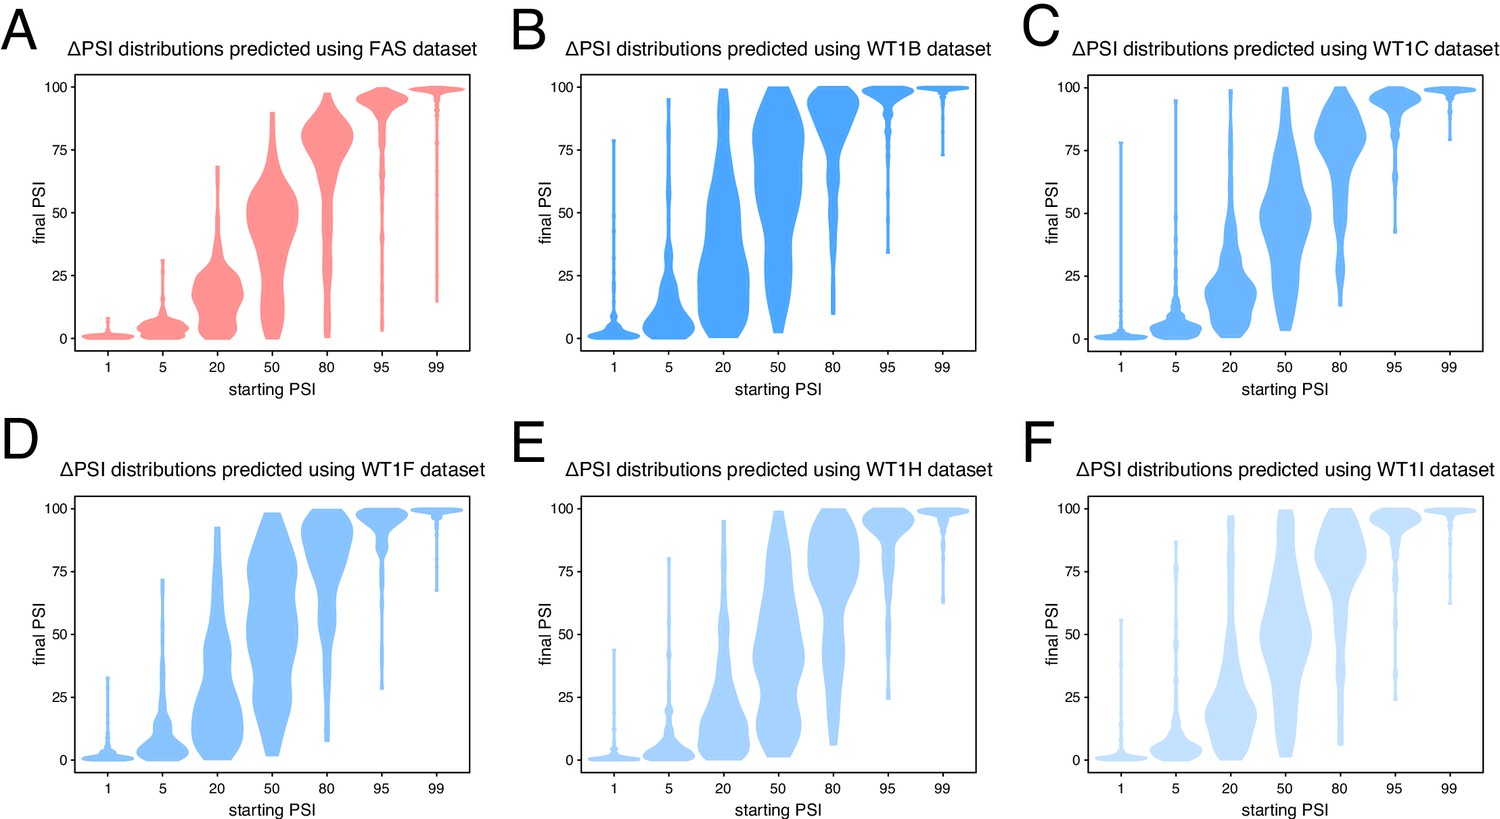
Predicted ΔPSI distributions using mutagenesis data from different alternative exons.
(A) Predictions based on the FAS exon six dataset. (B) Predictions based on the WT1 exon five dataset in the presence of hexamer B (see Materials and methods). (C) Predictions based on the WT1 exon five dataset in the presence of hexamer C (see Materials and methods). (D) Predictions based on the WT1 exon five dataset in the presence of hexamer F (see Materials and methods). (E) Predictions based on the WT1 exon five dataset in the presence of hexamer H (see Materials and methods). (F) Predictions based on the WT1 exon five dataset in the presence of hexamer I (see Materials and methods).
Figure 2 with 1 supplement
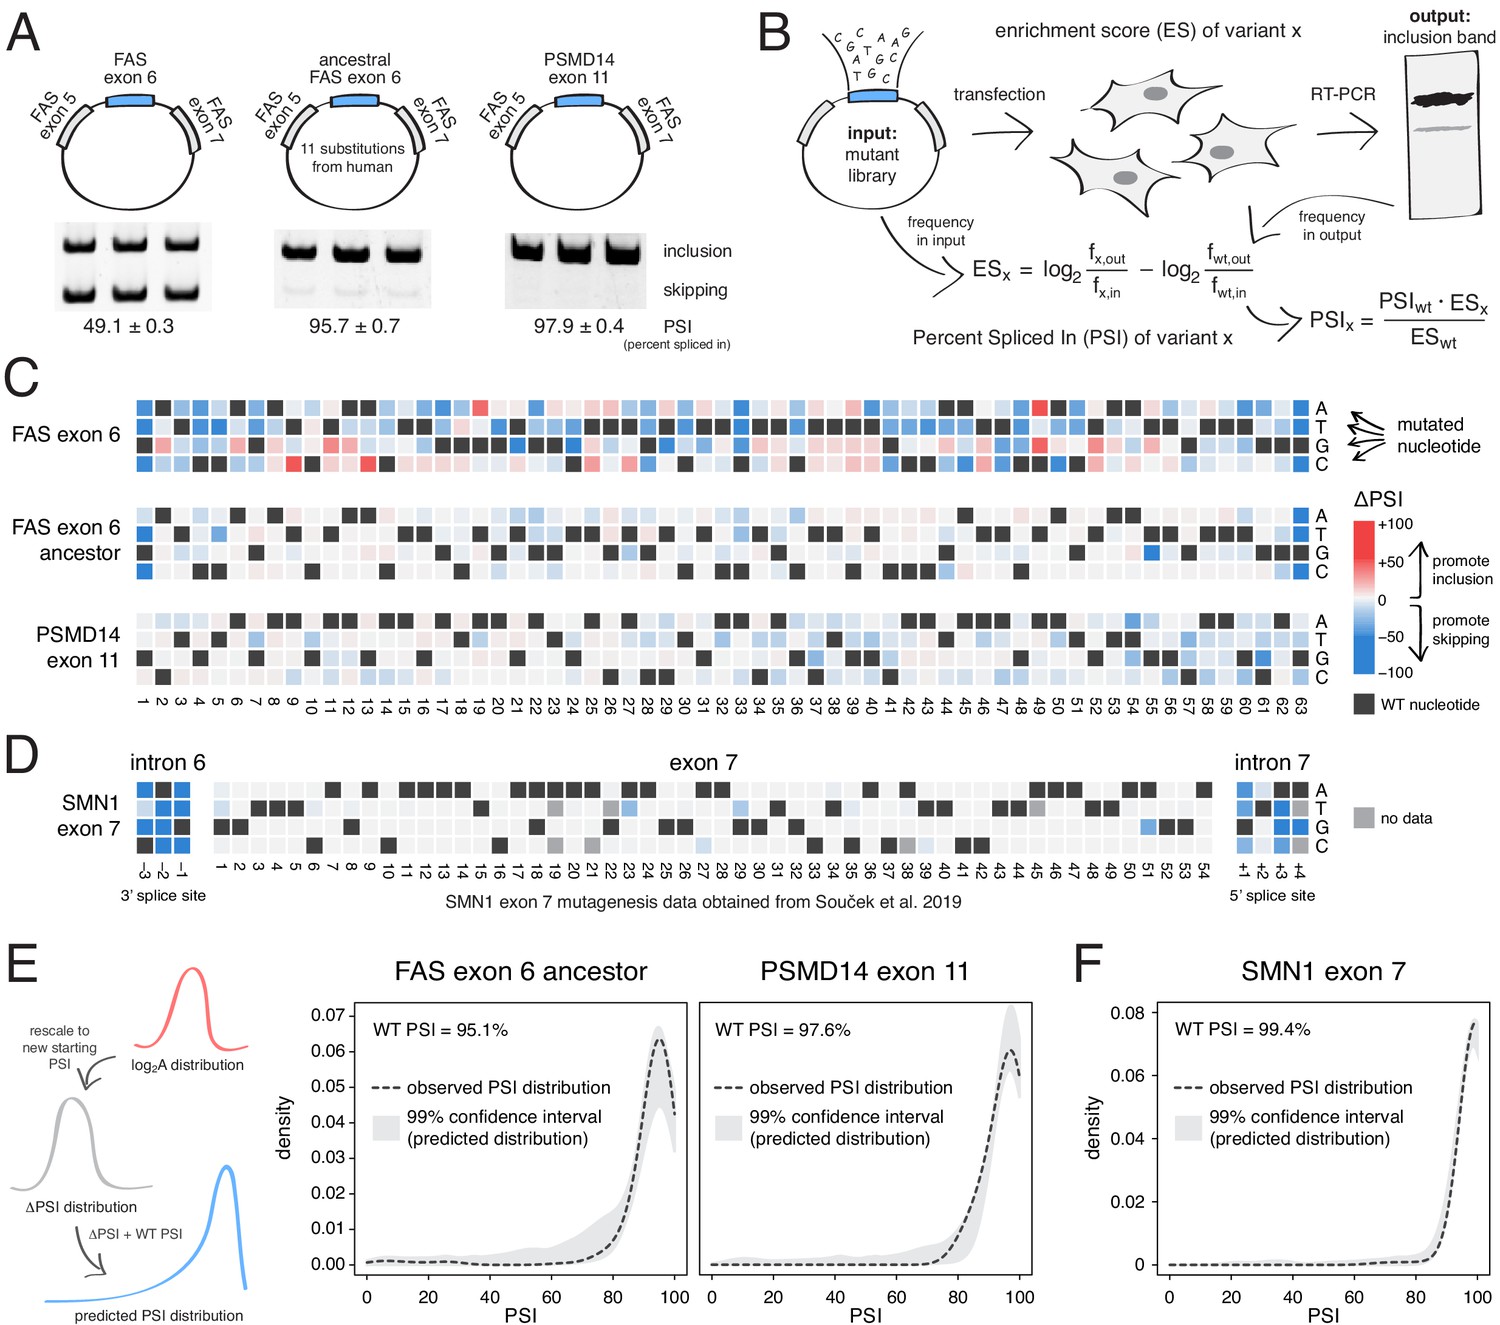
Deep mutagenesis of highly-included exons.
(A) The inclusion levels of FAS exon 6 (gel image adapted from Julien et al., 2016), the ancestral FAS exon 6, and PSMD14 exon 11. All inclusion levels were measured in HEK293 cells. (B) Experimental setup. (C) Heatmaps showing the inclusion levels of all single-nucleotide substitutions in FAS exon 6, the ancestral FAS exon six and PSMD14 exon 11. (D) Heatmap showing the effects of mutations in SMN1 exon 7 (Souček et al., 2019). (E) The PSI distribution of single-nucleotide substitutions in two exons included at 95.1% (the ancestral FAS exon 6) and 97.6% (PSMD14 exon 11) was predicted using the rescaled distribution of mutation effects in FAS exon 6, RON exon 11 and WT1 exon 5 (99% confidence band for the predicted distribution shown in grey). (F) The distribution of mutations in SMN1 exon 7, included at 99.4% (Souček et al., 2019). The 99% confidence band for the predicted distribution is shown in grey.
Figure 2—figure supplement 1
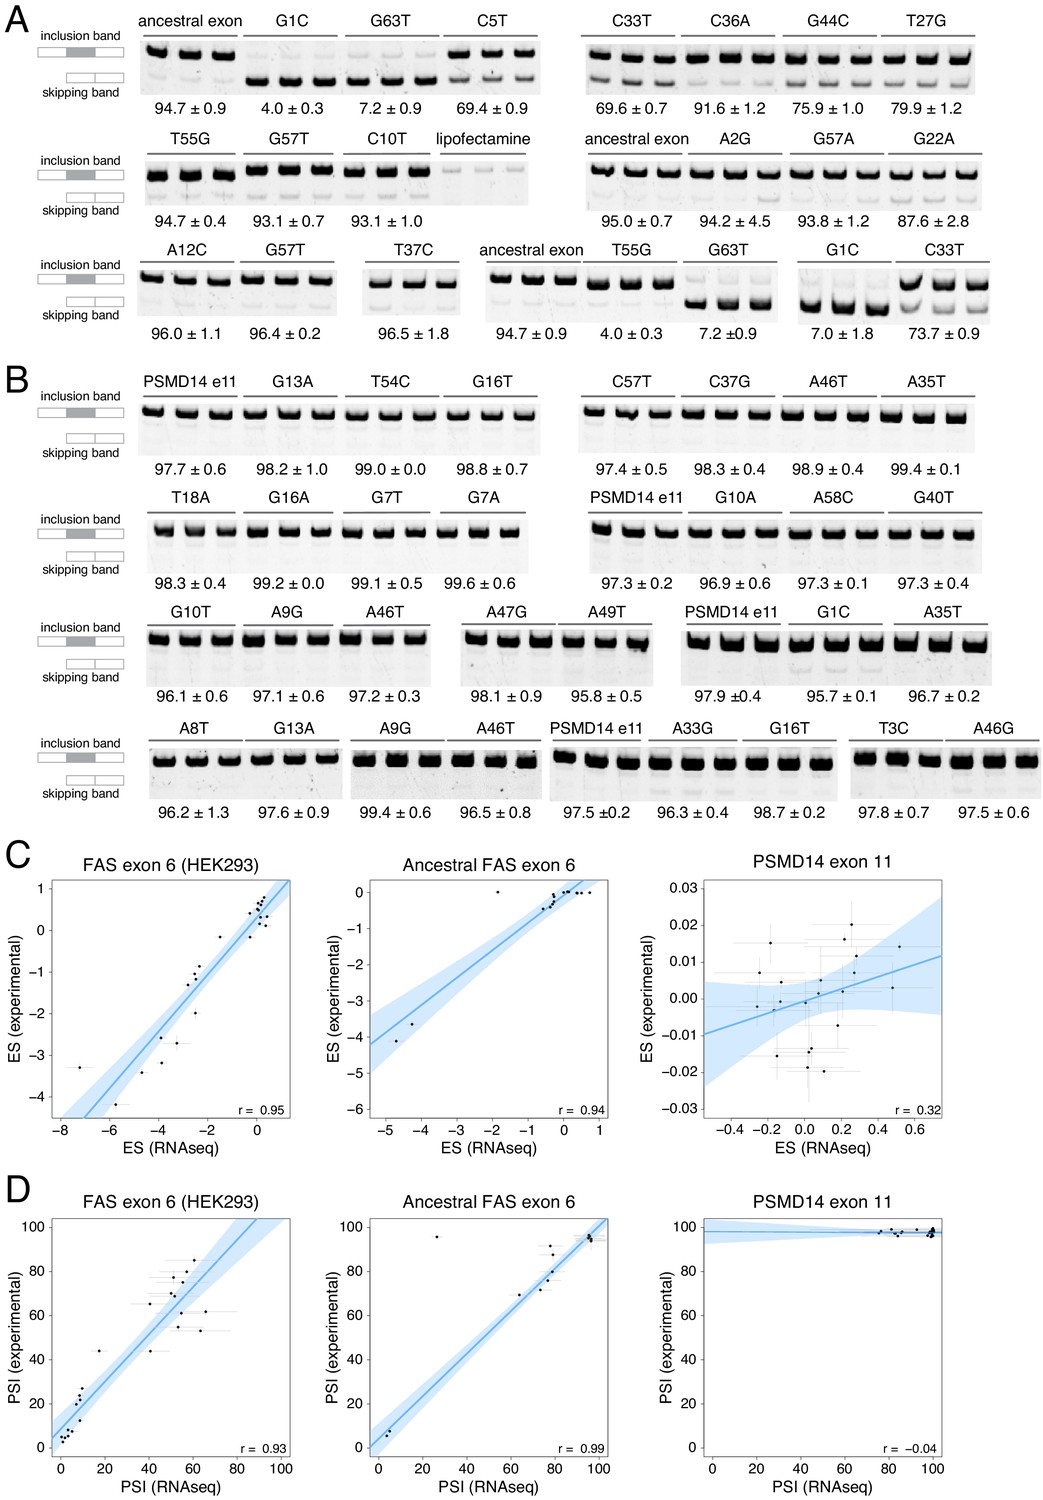
Experimental validation of PSI values determined in our DMS experiments.
(A) Experimentally-validated PSI values for a subset of variants in the ancestral FAS exon six library. (B) Experimentally-validated PSI values for a subset of variants in the PSMD14 exon 11 library. (C) Correlations between experimentally-determined enrichment scores and the enrichment scores from the DMS experiment. The experimentally-validated values for FAS exon six were obtained from Julien et al., 2016. Error bars show the standard deviation. The small correlation observed for the PSMD14 exon 11 experiment was interpreted as being due to the small effect size of mutations in this exon, with most mutations not having a statistically significant effect on exon PSI. (D) Correlations between experimentally-determined PSI values and PSI values predicted from the DMS data. Error bars show the standard deviation.
Figure 3 with 2 supplements
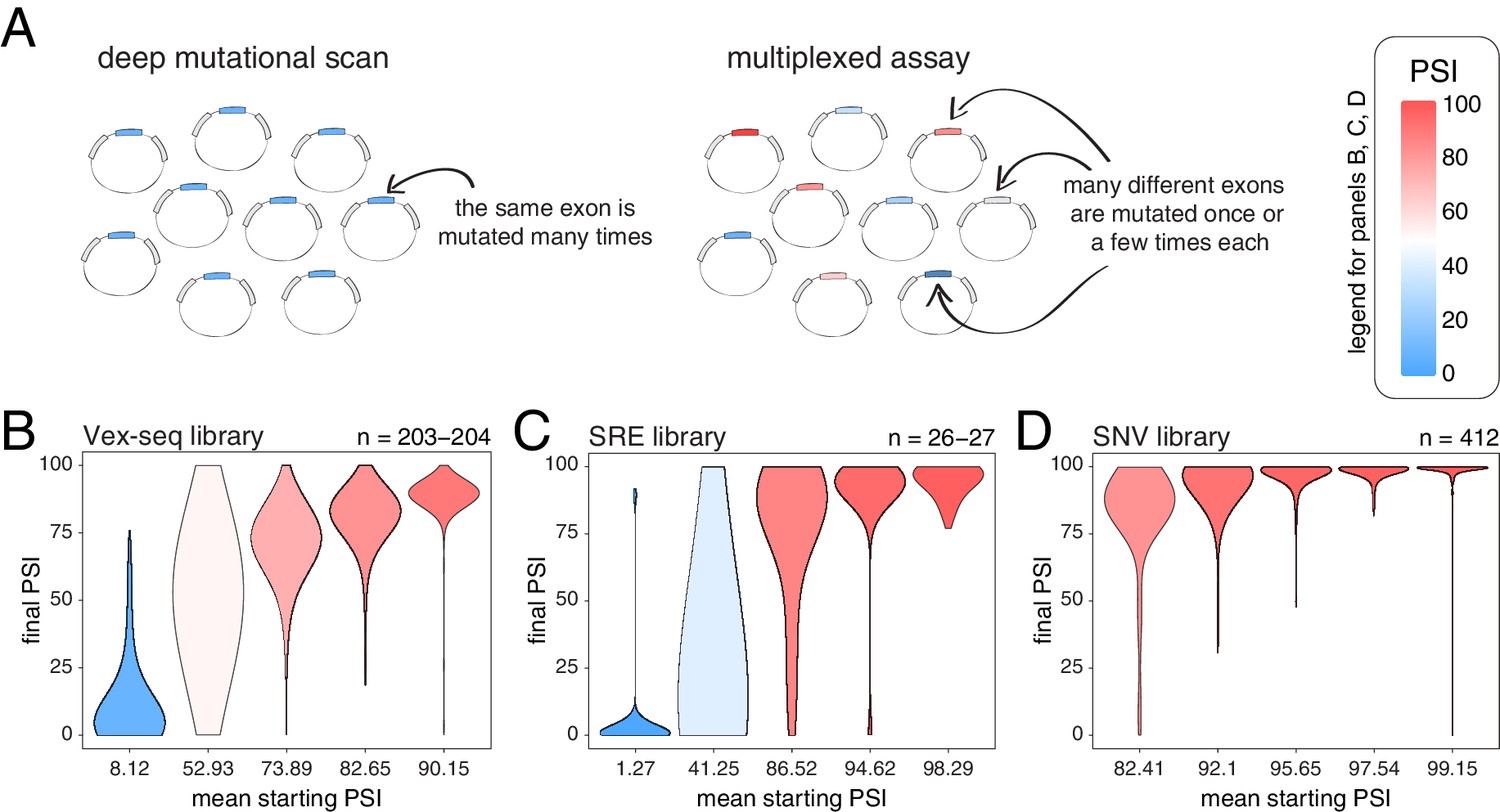
Across thousands of exons, exonic mutations have a stronger effect on the inclusion of exons with intermediate inclusion levels.
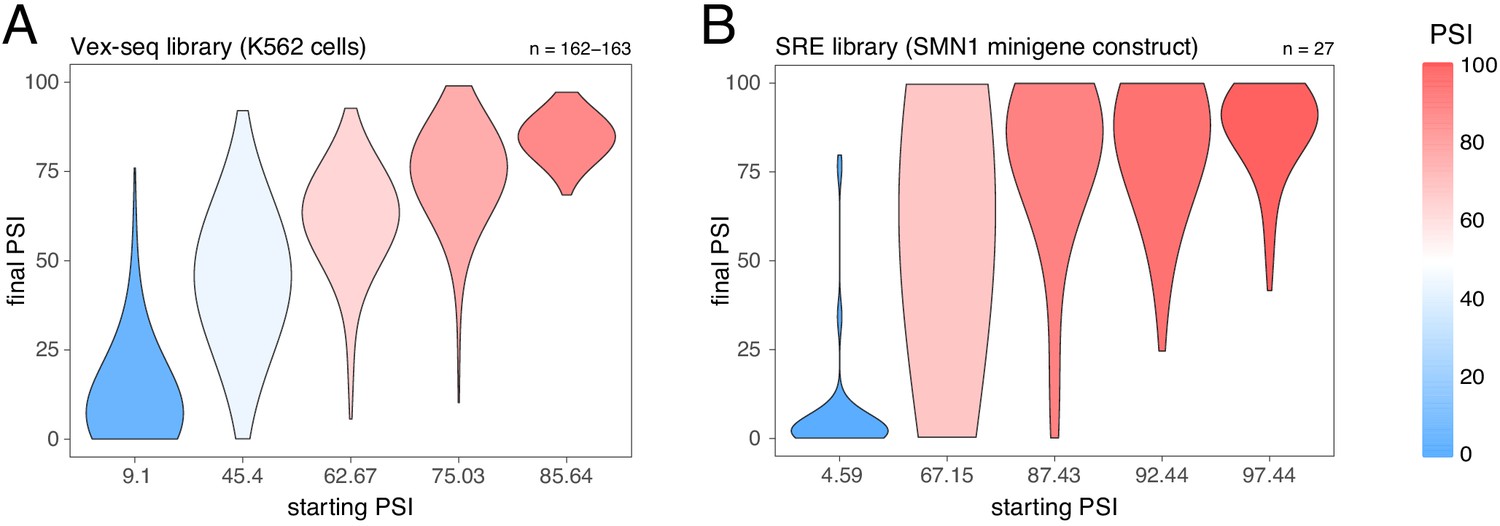
(A) Cartoon highlighting the major difference between a deep mutagenesis experiment and a multiplexed experiment. Deep mutagenesis assays involve the analysis of many different mutations in the same exon. Multiplexed assays introduce one or a few mutations in many different exons. (B) Distribution of exonic mutation effects in the Vex-seq library, separated into five equally-populated bins according to the inclusion levels of the mutated exon. (C) Distribution of exonic mutation effects in the SRE library, separated into five equally-populated bins according to the inclusion levels of the mutated exon. (D) Distribution of exonic mutation effects in the SNV library, separated into five equally-populated bins according to the inclusion levels of the mutated exon.
Figure 3—figure supplement 1
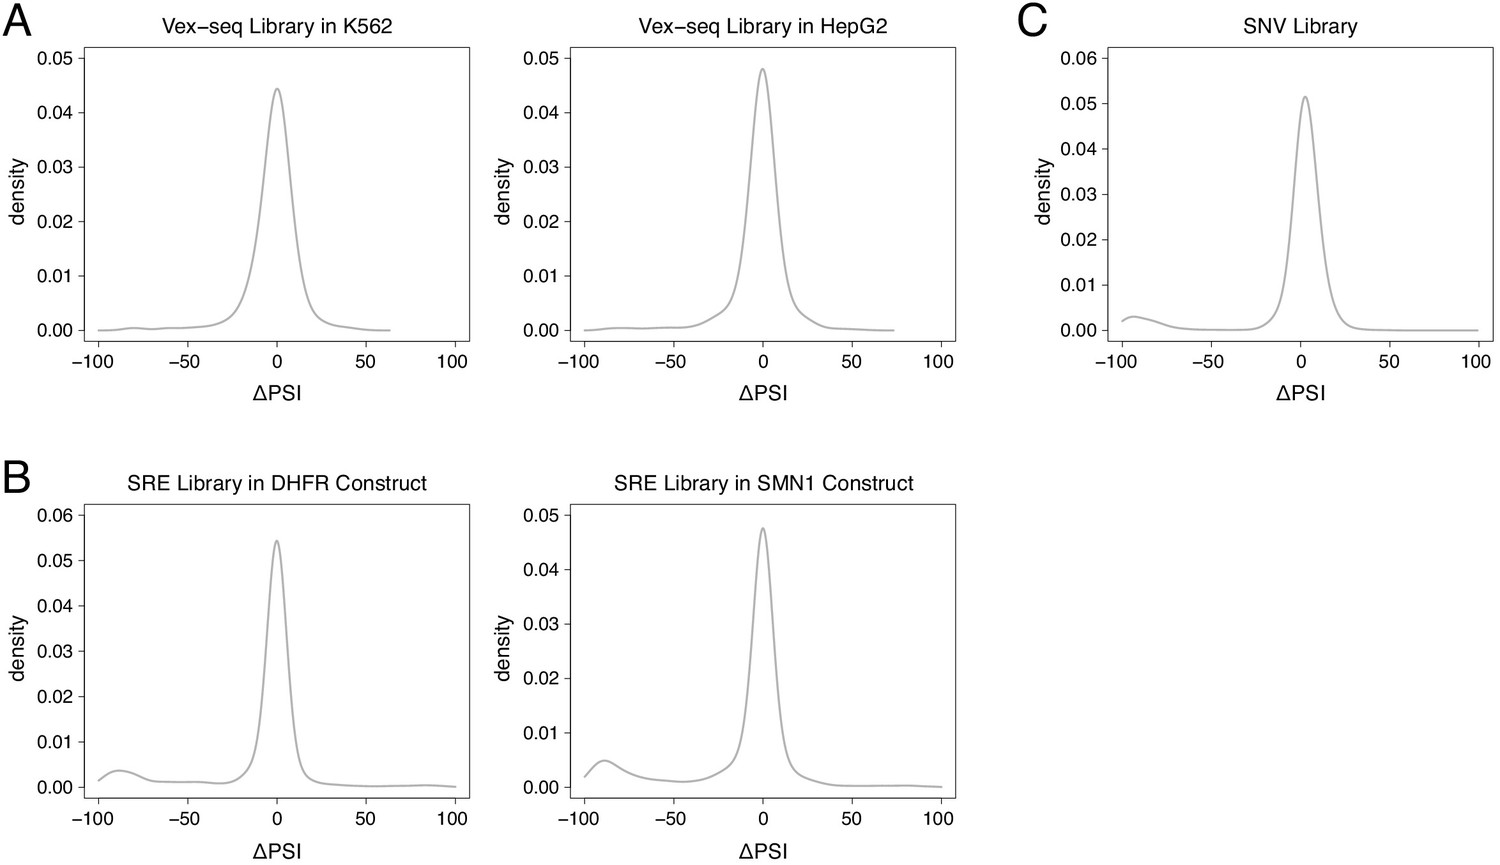
Distribution of mutation effects in different multiplexed libraries.
(A) Mutation effects in the Vex-seq library. (B) Mutation effects in the SRE library. (C) Mutation effects in the SNV library.
Figure 3—figure supplement 2
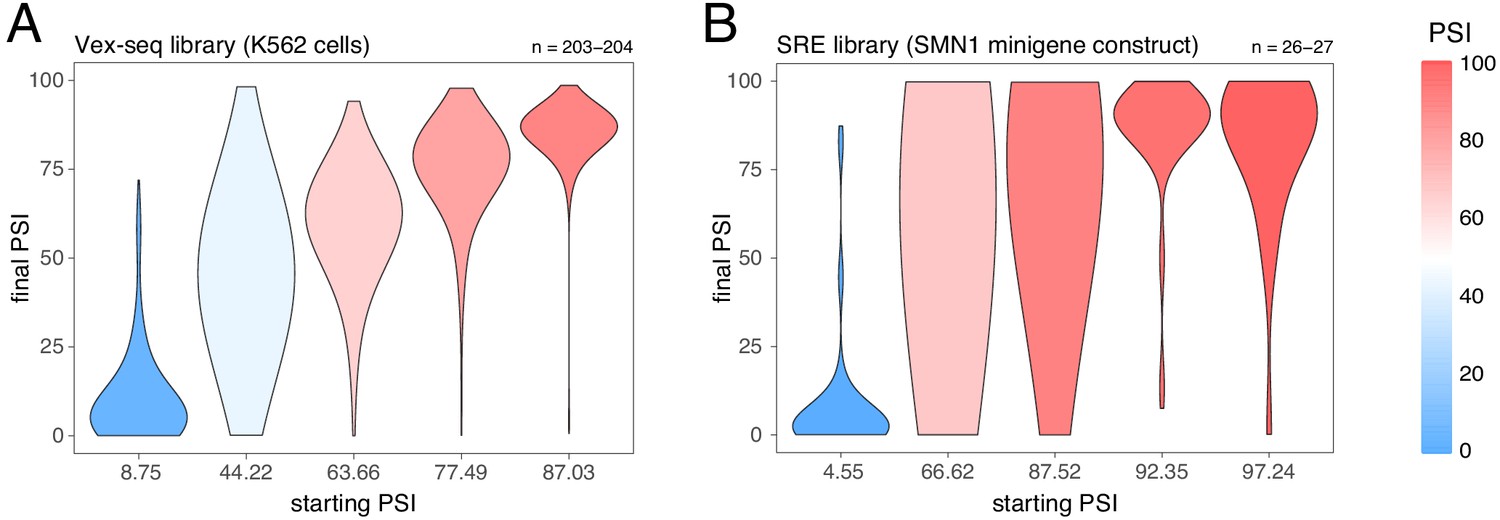
Effects of exonic mutations in the multiplexed datasets, binned by the starting PSI.
(A) Effects of exonic mutations in the Vex-seq library transfected into K562 cells. (B) Effects of exonic mutations in the SRE library inserted into an SMN1 minigene construct. The numbers above the plots show the number of data points in each bin.
Figure 4 with 4 supplements
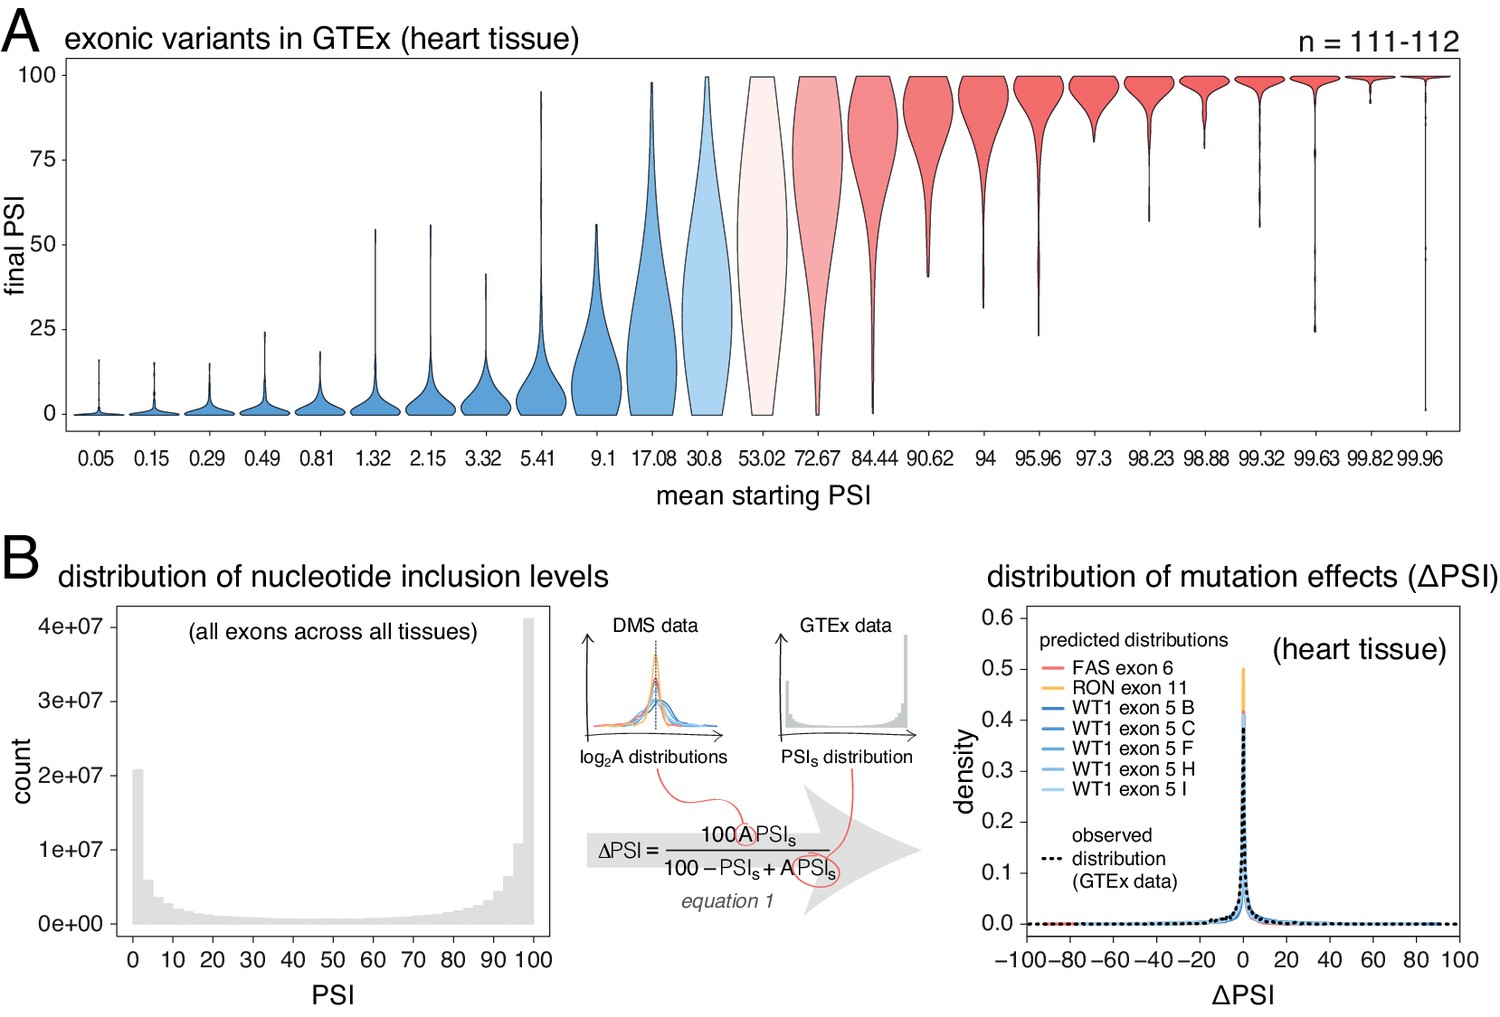
Common alternative alleles have a stronger effect on the inclusion of exons with intermediate inclusion levels.
(A) Distribution of exonic allele effects in all exons and all tissues in the GTEx population. The data was split into 25 equally-populated bins according to the inclusion levels of each exon in the absence of the allele. (B) A random exonic mutation is unlikely to have an effect on splicing. Left. Bimodal distribution of exonic nucleotide inclusion levels for all exons across all tissues in the GTEx dataset. Right. The distribution of splice-altering effects of mutations in all human exons in heart tissue was predicted using the different alternative exon datasets as in Figure 2 (coloured lines). The observed distribution of common allele-associated splicing changes is overlaid (dashed black line).
Figure 4—figure supplement 1
Effects of common exonic alternative alleles in different human tissues, binned by the starting PSI.
Figure 4—figure supplement 2
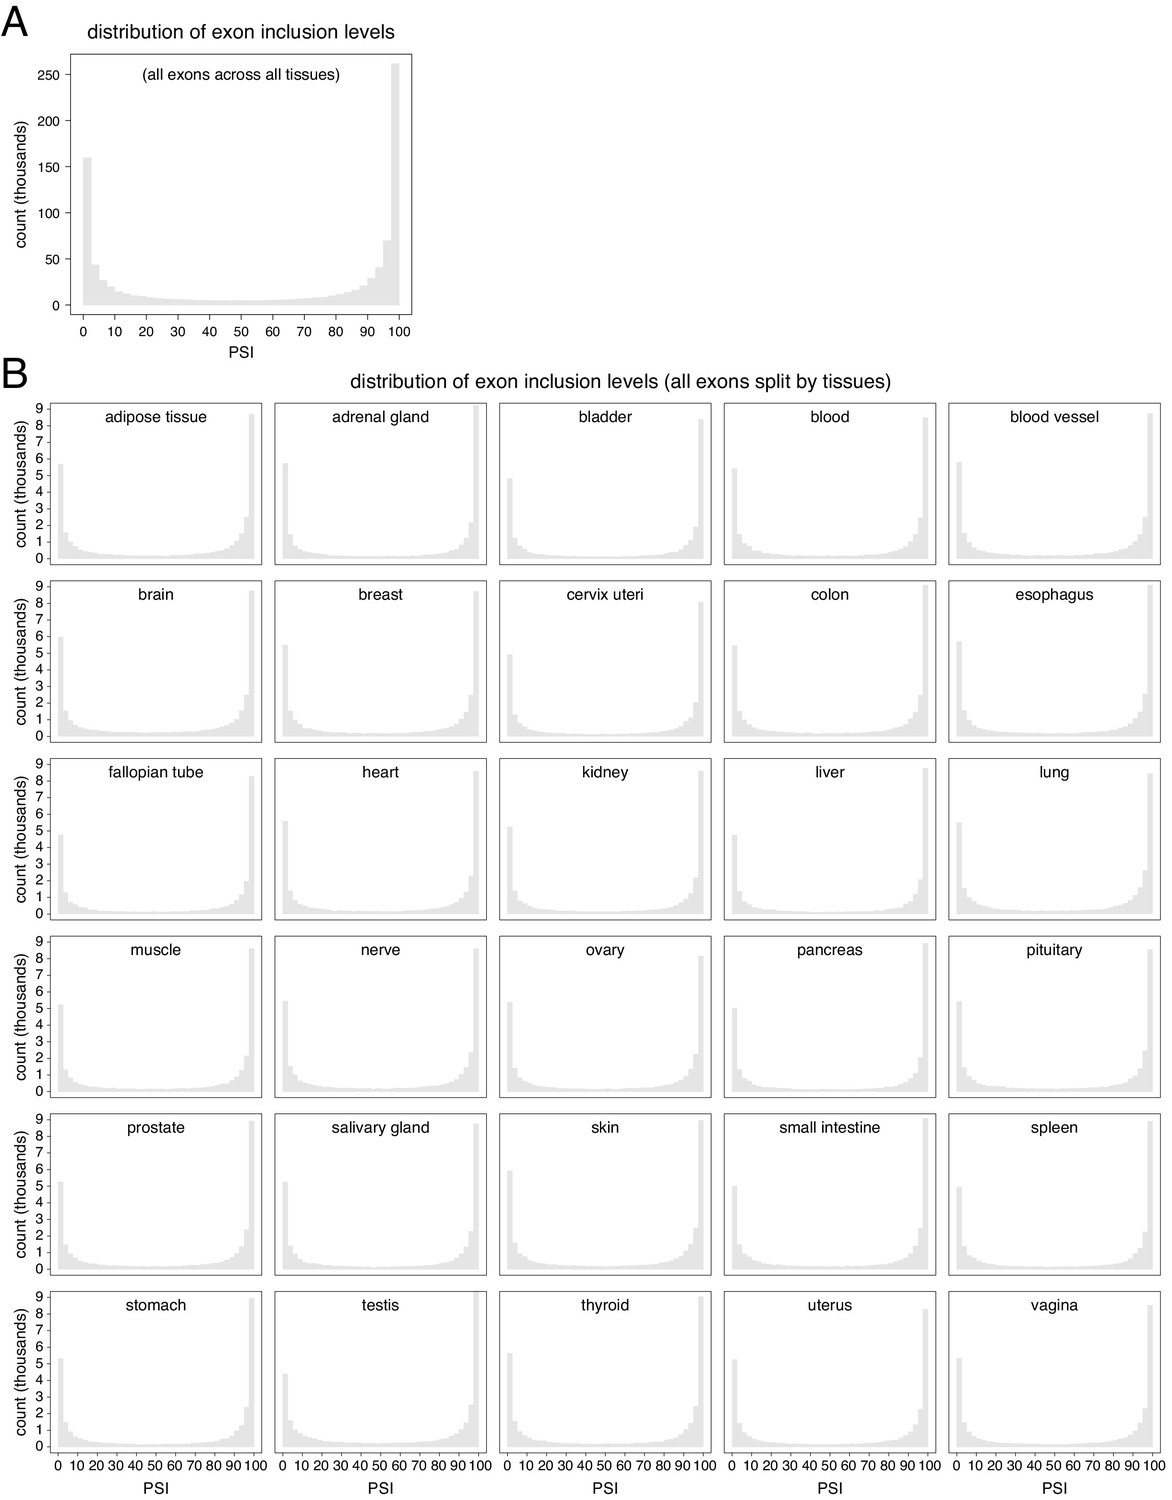
Distribution of exon inclusion levels in the human genome.
(A) All exons in all tissues. (B) All exons, split by tissue.
Figure 4—figure supplement 3
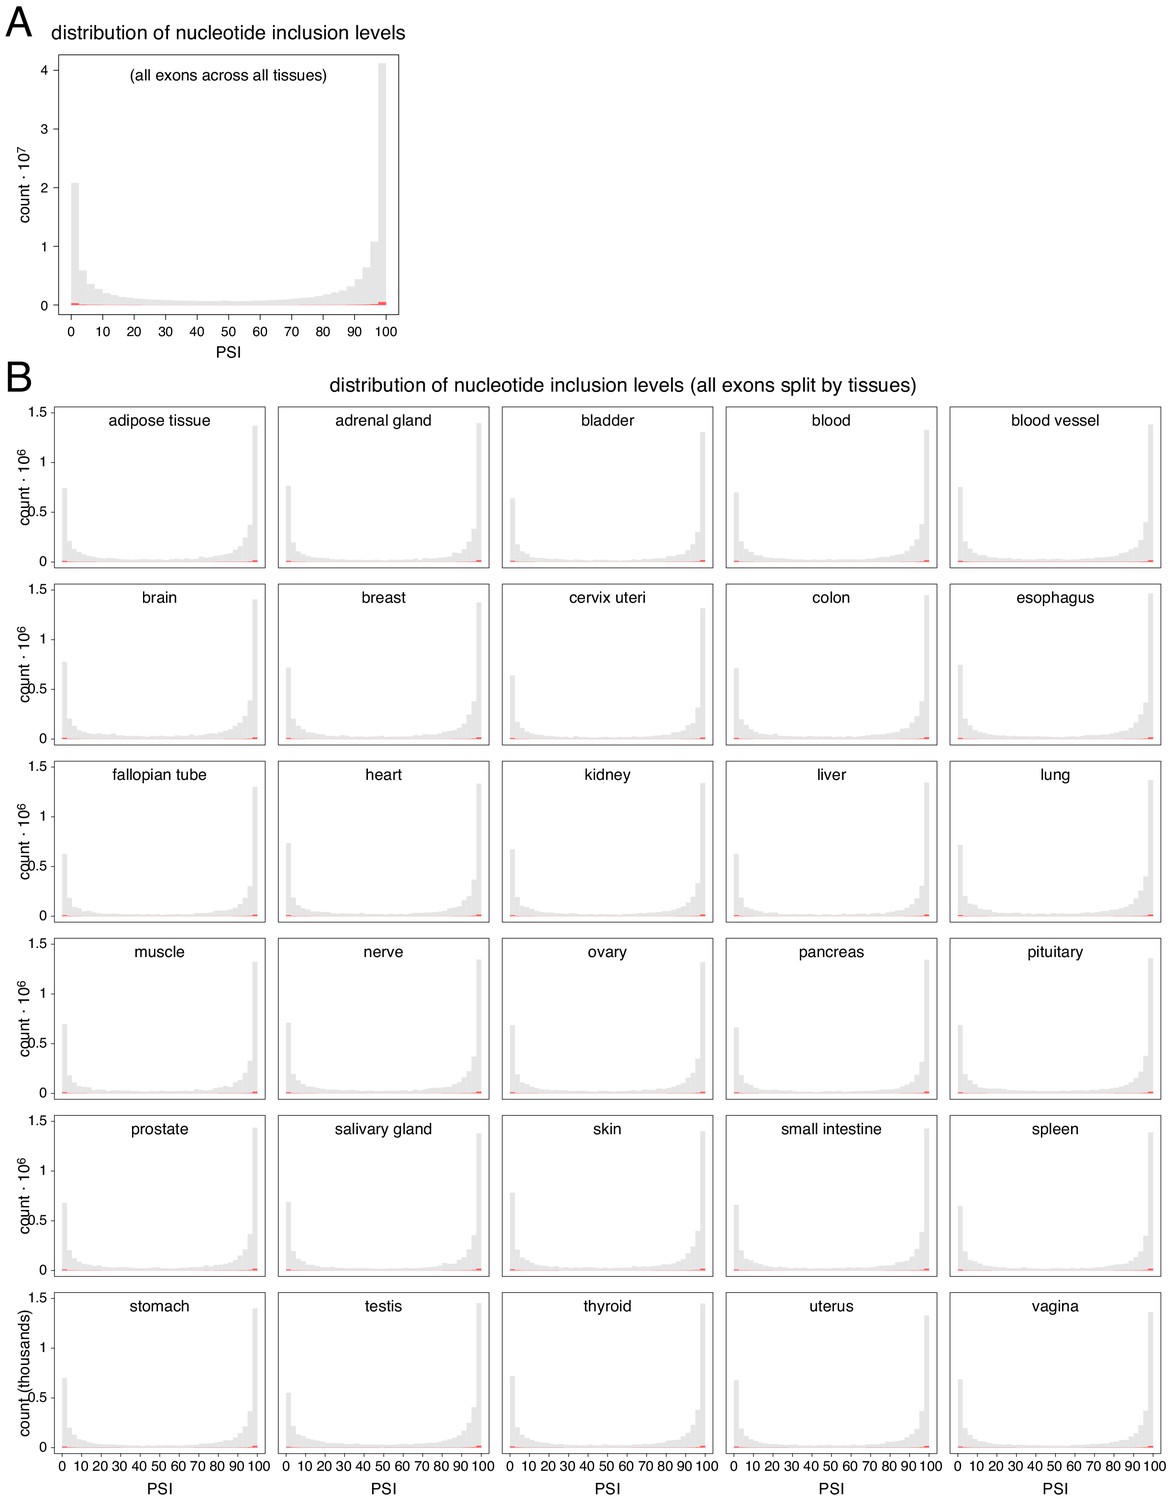
Distribution of genome-wide nucleotide inclusion levels.
Red histogram shows the distribution of splice site inclusion levels. (A) All nucleotides in all exons in all tissues. (B) All nucleotides in all exons, split by tissue.
Figure 4—figure supplement 4
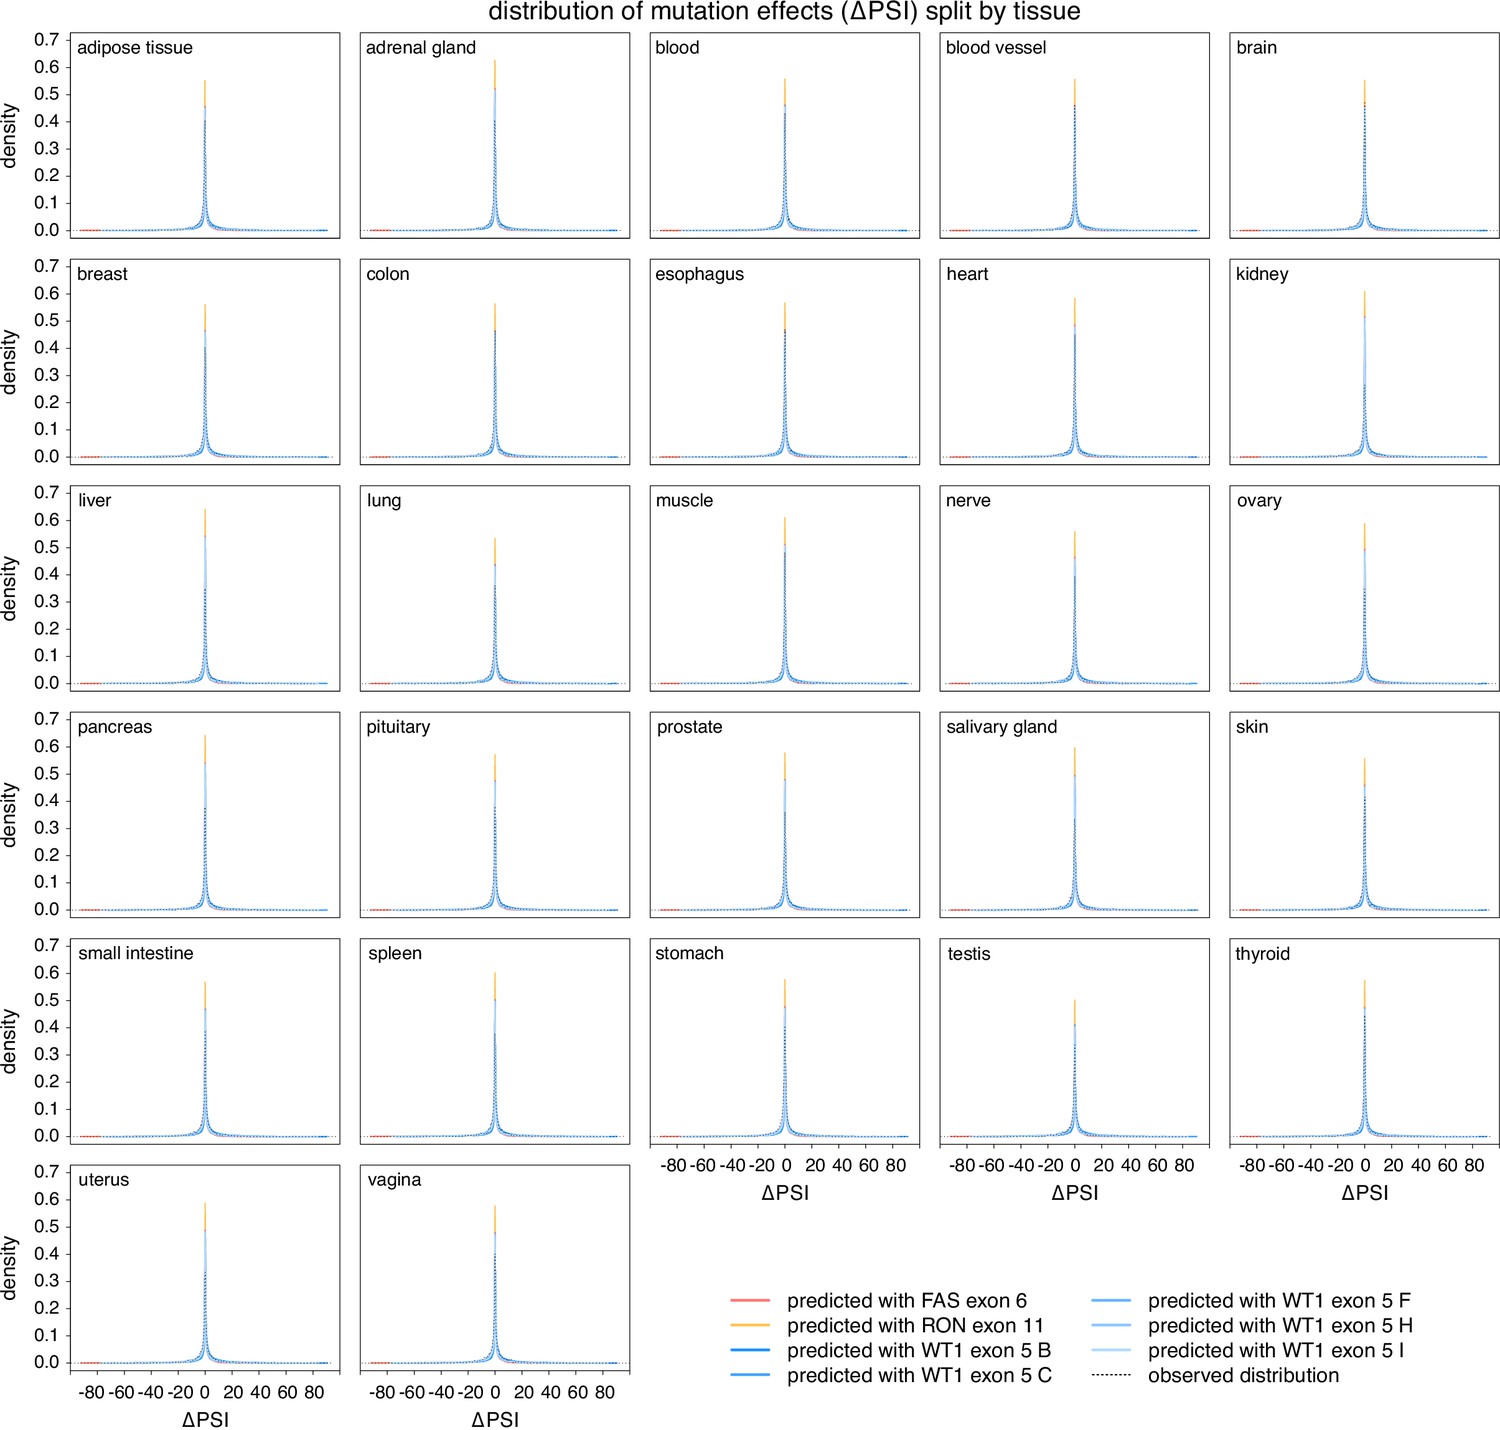
The distribution of splice-altering effects of mutations in all human exons, divided by tissue.
Predicted distributions shown with coloured lines. The distributions of common alternative allele-associated splicing changes is overlaid (dashed black line).
Figure 5 with 4 supplements
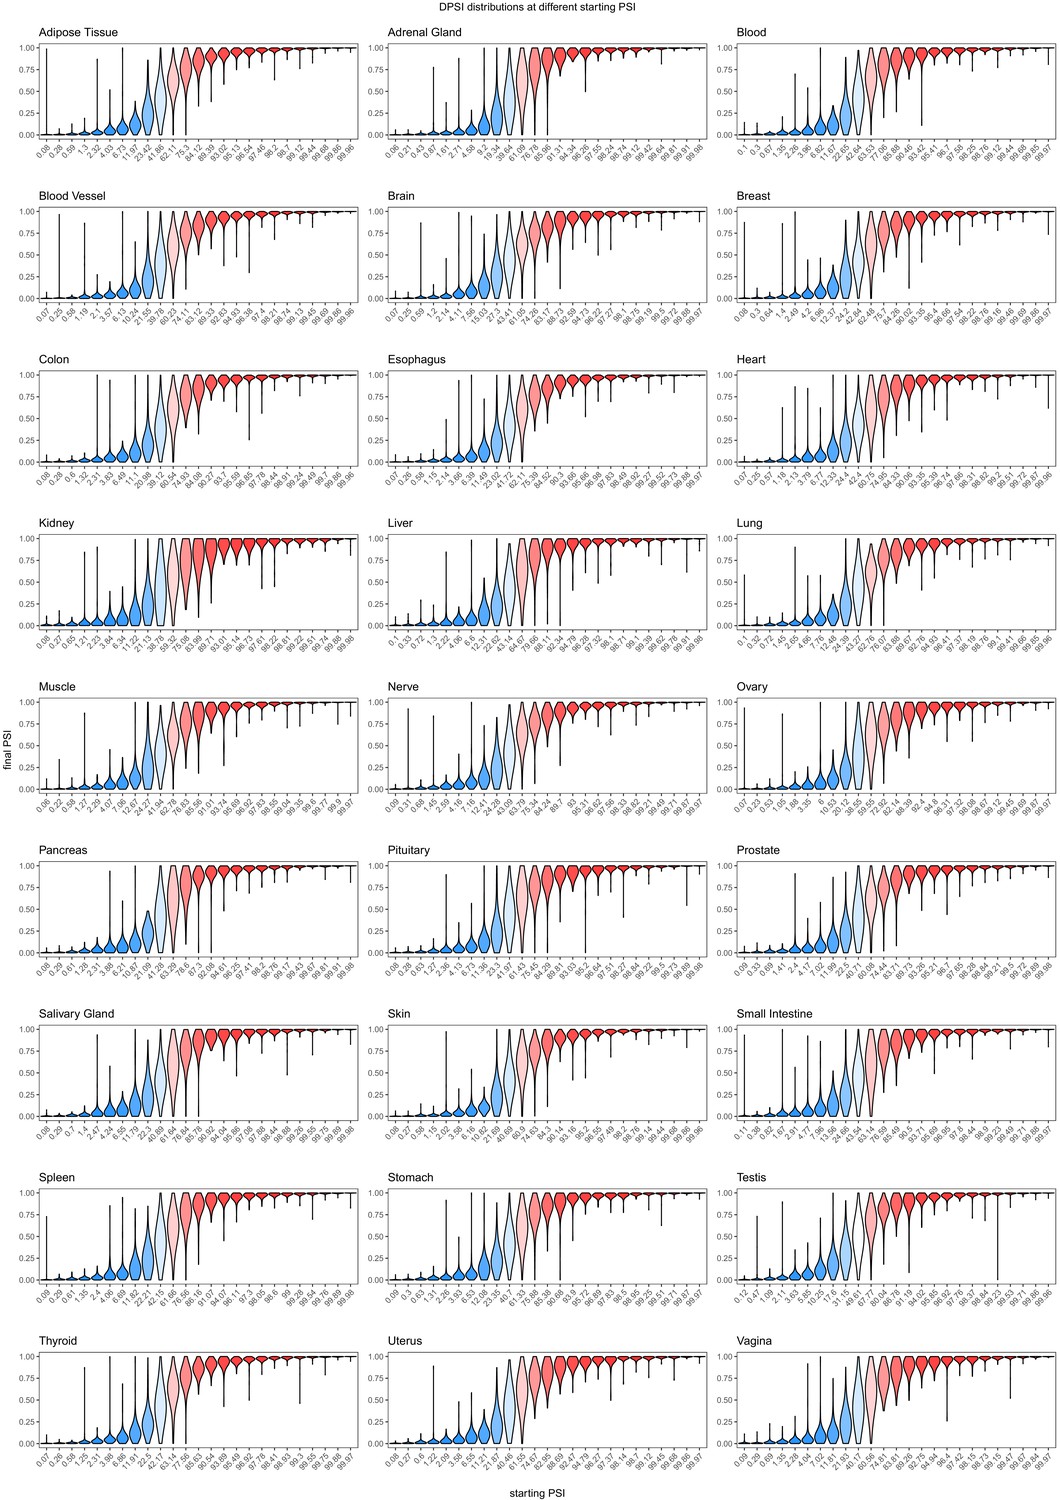
Intronic mutations have a stronger effect on the inclusion of exons with intermediate inclusion levels.
(A) The distribution of intronic mutation effects in the RON exon 11 dataset can be converted into a distribution of effects on splicing efficiency, which can, in turn, be used to predict the distribution of mutation effects at any starting PSI (similar to Figure 1C). The black dashed lines show the corresponding distributions for exonic mutations. (B) Distribution of intronic mutation effects in the Vex-seq library, separated into five equally-populated bins according to the inclusion levels of the affected exon. (C) Distribution of intronic mutation effects in the SRE library, separated into five equally-populated bins according to the inclusion levels of the affected exon. (D) Distribution of intronic mutation effects in the SNV library, separated into five equally-populated bins according to the inclusion levels of the affected exon. (E) Distribution of intronic alternative allele effects in introns flanking all exons in heart tissue (GTEx data). The data was split into 25 equally-populated bins according to the inclusion levels of each exon in the absence of the allele. (F) The distribution of mutation effects in the flanking introns of RON exon 11, in combination with the distribution of nucleotide inclusion levels, can be used to predict the distribution of genome-wide flanking intronic mutation effects (yellow line). The black dashed line shows the effects distribution observed for common intronic alternative alleles in the GTEx population (heart tissue).
Figure 5—figure supplement 1
Effects of intronic mutations in the multiplexed datasets, binned by the starting PSI.
(A) Effects of intronic mutations in the Vex-seq library transfected into K562 cells. (B) Effects of intronic mutations in the SRE library inserted into an SMN1 minigene construct. The numbers above the plots show the number of data points in each bin.
Figure 5—figure supplement 2
Effects of common intronic alternative alleles in different human tissues, binned by the starting PSI.
Figure 5—figure supplement 3

Splice-altering effects of changing the flanking introns, binned by the initial inclusion levels.
(A) The effect of substituting the DHFR introns (the initial PSI condition) with the SMN1 introns (the final PSI condition). (B) The effect of substituting the SMN1 introns (the initial PSI condition) with the DHFR introns (the final PSI condition). The numbers above the plots show the number of data points in each bin.
Figure 5—figure supplement 4

Genome-wide distribution of splice-altering effects of common intronic alternative alleles.
In yellow, the distribution predicted using the RON exon 11 dataset. In black, the observed distribution in the GTEx population.
Figure 6

Splice-altering effects of a complex perturbation in trans binned by the initial inclusion levels.
(A) The effect of moving from HepG2 cells (the initial PSI condition) to K562 cells (the final PSI condition). (B) The effect of moving from K562 cells (the initial PSI condition) to HepG2 cells (the final PSI condition). The numbers above the plots show the number of data points in each bin.
Figure 7 with 14 supplements
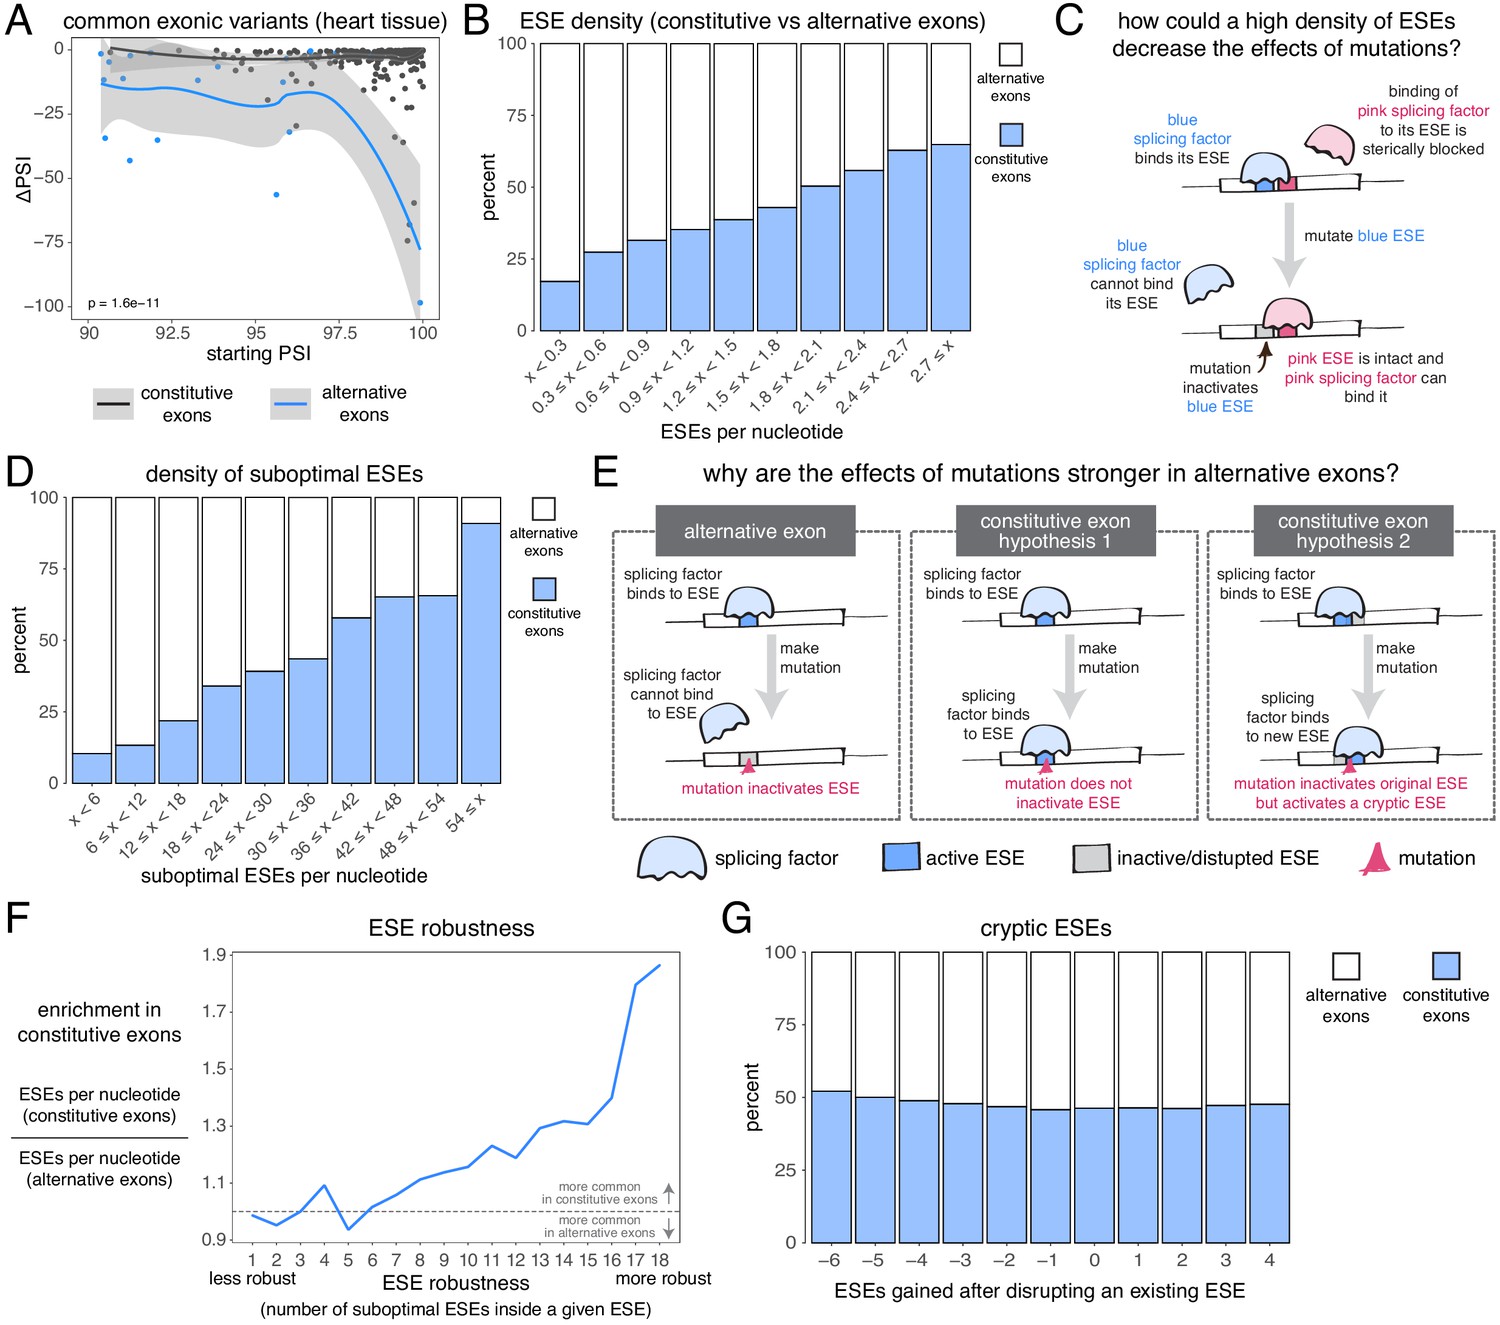
The effects of common alternative alleles in constitutive vs alternative exons.
(A) At the same starting PSI, the effects of skipping-promoting exonic alleles in alternative exons (blue) are stronger than in constitutive exons (black). Data summarised with loess curves and 95% confidence bands. (B) All exons were binned into 10 groups depending on their density of exonic splicing enhancers (ESE). Constitutive exons (blue) were enriched in the bins with a higher density of ESE motifs, and alternative exons (white) were enriched in the bins with a lower ESE density. (C) A hypothetical mechanism illustrating how a high density of ESE motifs in an exon can result in sequence redundancy and decrease the effects of splicing mutations. (D) All exons were binned into 10 groups depending on their density of ‘suboptimal ESE’ sequences. Suboptimal ESEs were defined as sequences that differ from an ESE by one nucleotide substitution. Constitutive exons (blue) were enriched in the bins with a higher suboptimal ESE density, and alternative exons (white) were enriched in the bins with a lower density of such motifs. (E) Two hypotheses for how a higher density of suboptimal ESEs can decrease the effects of mutations in constitutive exons. Left: a mutation in the ESE of an alternative exon disrupts the ESE, leading to lower levels of inclusion. Middle: a mutation in the ESE of a constitutive exon might not disrupt the ESE and the mutation has little to no effect on splicing. Right: a mutation in the ESE of a constitutive exon might disrupt the ESE, but might activate another ESE instead, compensating for the loss of the original ESE. (F) ESEs that are robust to the effects of mutations are more common in constitutive exons. ESE robustness was defined as the number of ESE sequences accessible, from an existing ESE, via one nucleotide substitution. This definition allowed us to group all ESE sequences into 18 groups ranging from 1 (least robust) to 18 (most robust). For each group, we calculated the average number of ESEs per nucleotide in constitutive and alternative exons, and calculated the relative enrichment of sequences in constitutive over alternative exons by taking the ratio of these two numbers. (G) Constitutive and alternative exons have similar numbers of cryptic enhancers. We counted the number of ESEs created upon disrupting each ESE in an exon with a point mutation (without allowing for the creation of ESEs that occupy the exact same six nucleotides as the disrupted ESE).
Figure 7—figure supplement 1

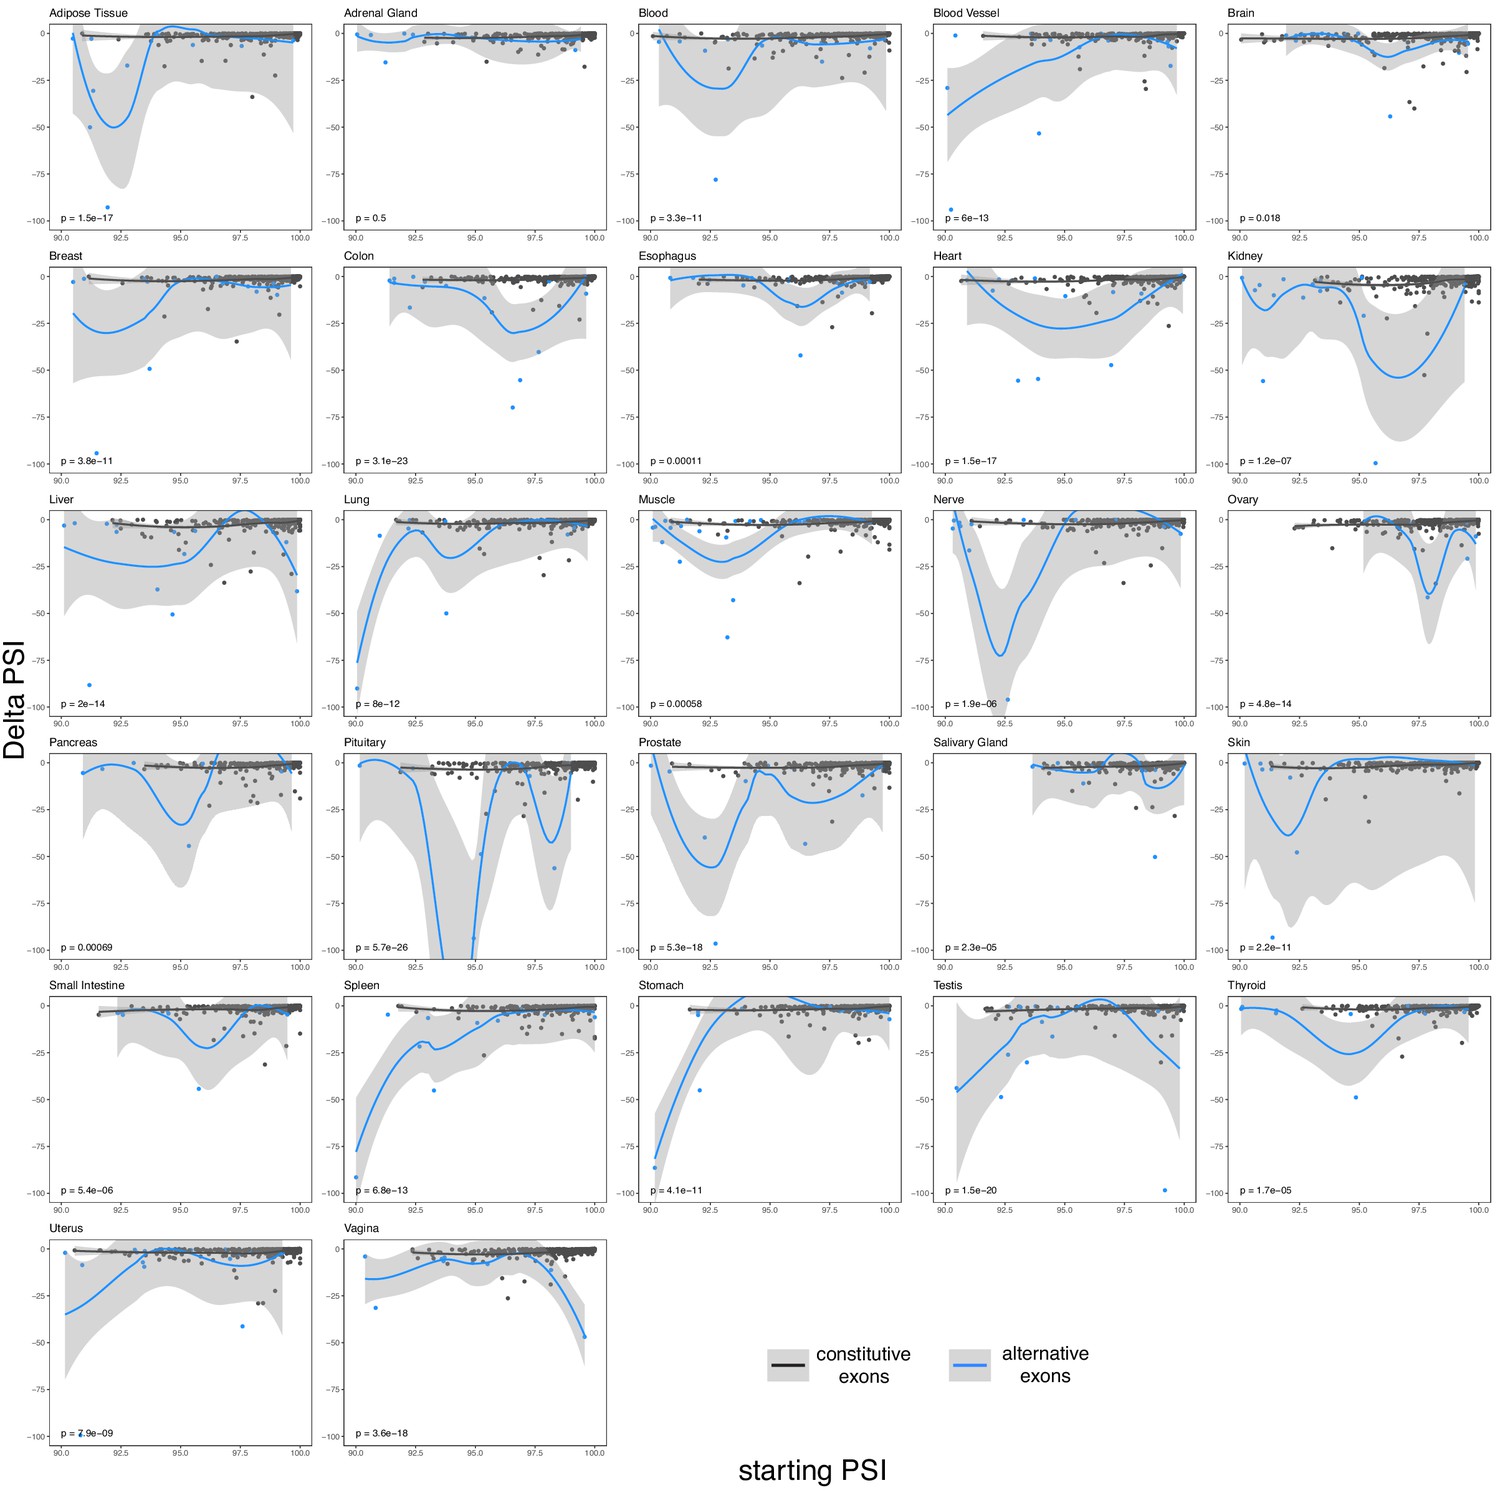
The effects of common exonic alternative alleles in constitutive (black) and alternative (blue) exons in different human tissues.
Exons classified as in Figure 6.
Figure 7—figure supplement 2
The effects of common intronic alleles in constitutive (black) and alternative (blue) exons in different human tissues.
Exons classified as in Figure 6.
Figure 7—figure supplement 3

Using different thresholds to define constitutive and alternative exons.
(A) The difference in exonic mutation effects in constitutive vs alternative exons, using different PSI thresholds to define constitutive and alternative exons. The strongest difference is observed when constitutive exons are defined as those with a PSI > 99% in all human tissues and alternative exons as those with a PSI < 60% in at least one tissue. (B) The difference in intronic mutation effects in constitutive vs alternative exons, using different PSI thresholds to define constitutive and alternative exons.
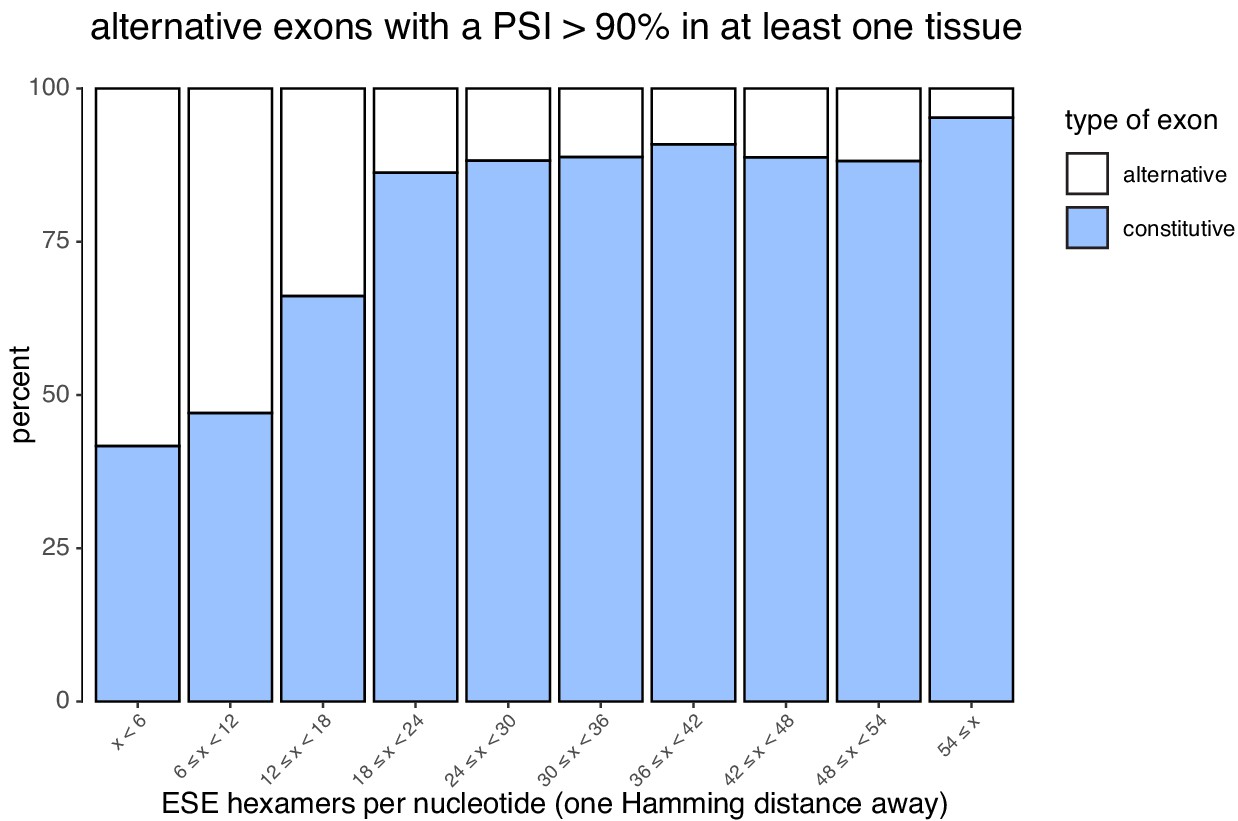
Figure 7—figure supplement 4
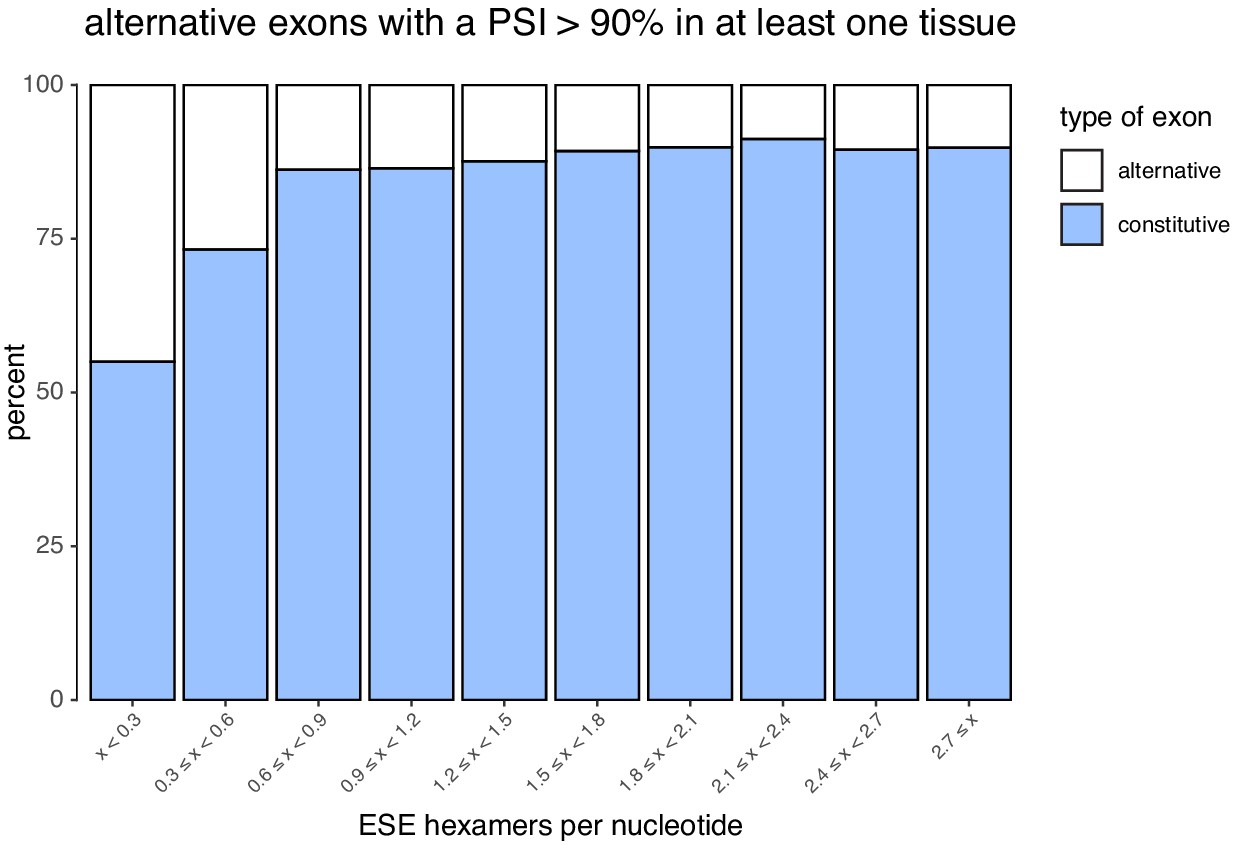
Density of ESEs in constitutive and alternative exons (included at >90% in at least one tissue).
Figure 7—figure supplement 5
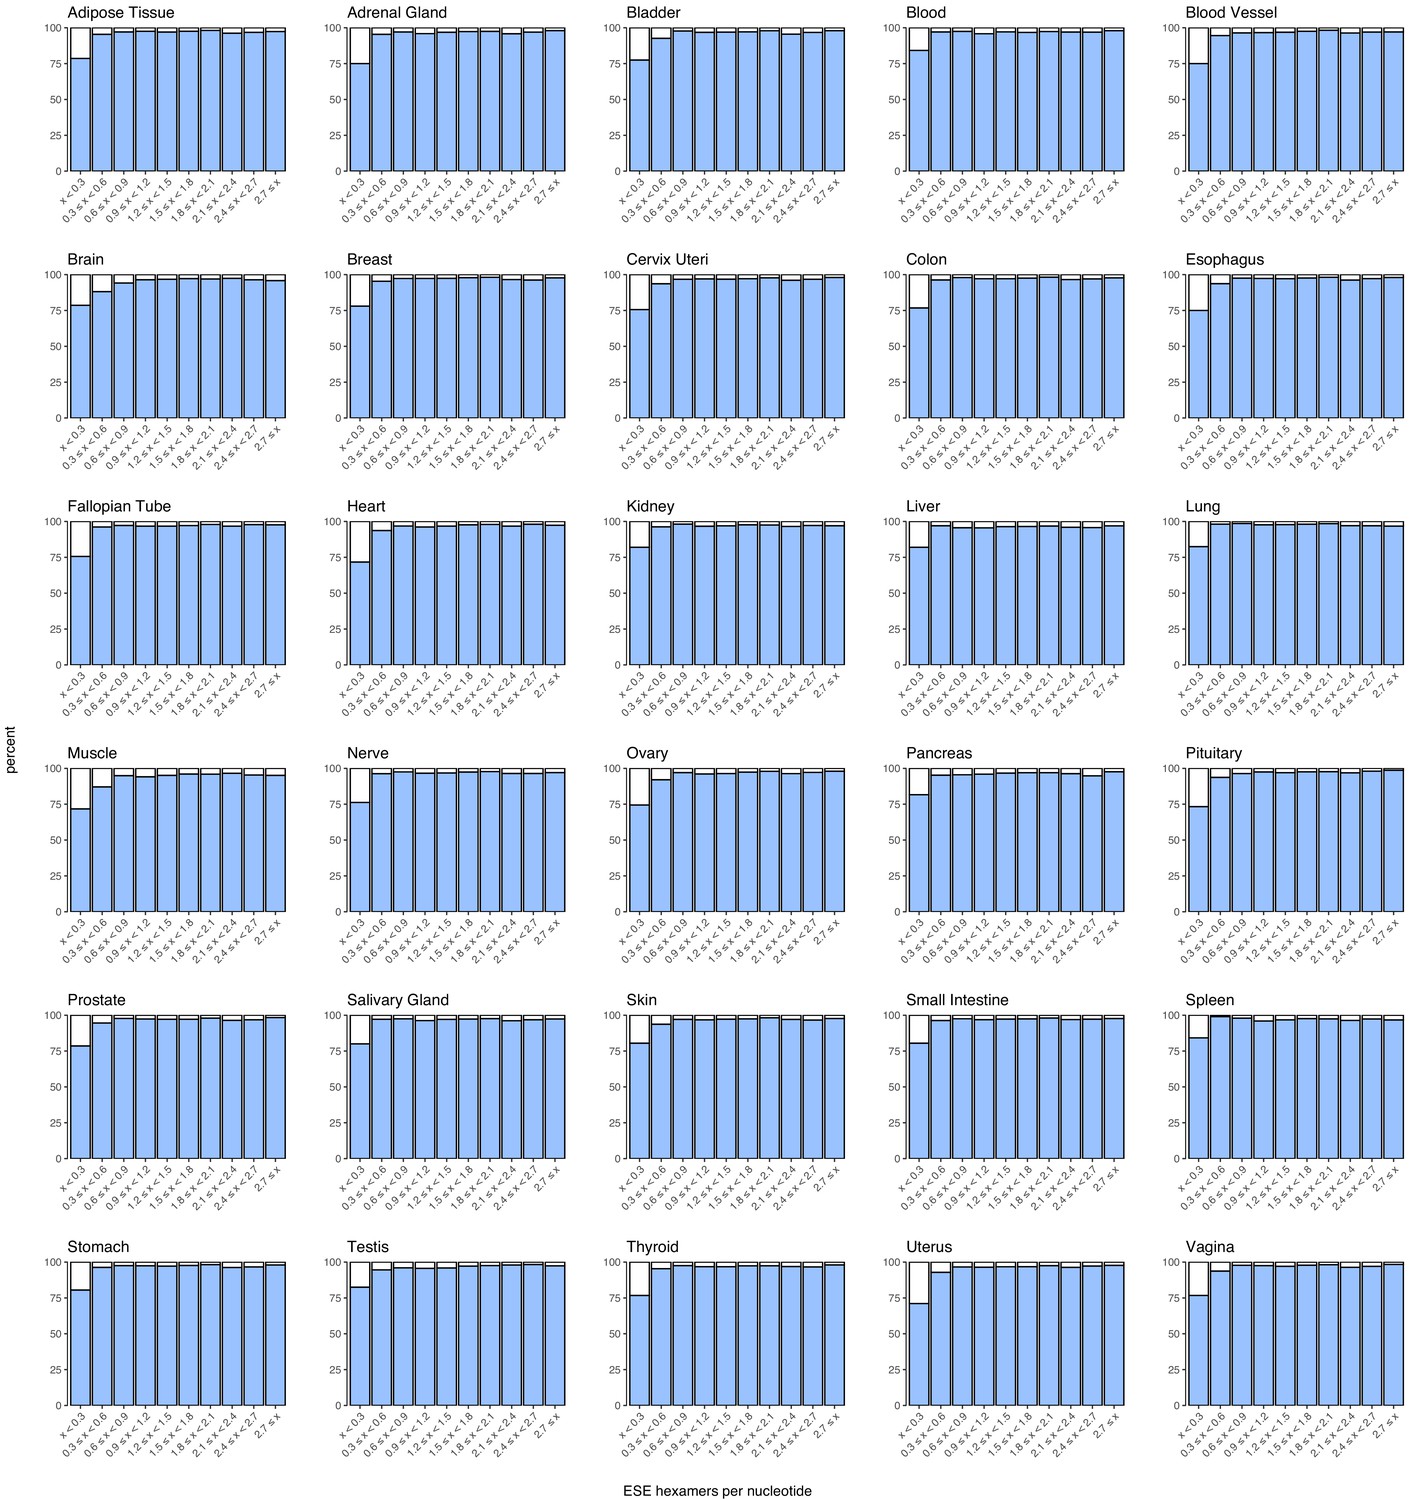
Density of ESEs in constitutive and alternative exons with a PSI > 90% in each human tissue.
Figure 7—figure supplement 6

Density of ESEs in constitutive and alternative exons, accounting for splice site strength.
(A) All exons were binned into 10 groups depending on their density of exonic splicing enhancers (ESE), as in Figure 7B. Exons were further subdivided into whether they had strong or weak 3’ and 5’ splice sites. Regardless of the splice site strength, constitutive exons (blue) were enriched in the bins with a higher density of ESE motifs, and alternative exons (white) were enriched in the bins with a lower ESE density. Alternative exons are generally enriched among exons with weak splice sites, and constitutive exons are enriched among exons with strong splice sites. (B) Density of ESEs in constitutive and alternative exons (included at >90% in at least one tissue), for all exons in all tissues, similar to Figure 7—figure supplement 4. However, exons are further divided into those having strong or weak 3¡ and 5’ splice sites.
Figure 7—figure supplement 7

Density of ESS hexamers.
(A) All exons were binned into 10 groups depending on their density of exonic splicing silencers (ESS), similar to Figure 7B. Constitutive exons (blue) were enriched in the bins with a lower density of ESS motifs, and alternative exons (white) were enriched in the bins with a higher ESS density. (B) Density of ESSs in constitutive and alternative exons that are included at >90% in at least one tissue. ESS hexamers were found in almost none of the alternative exons passing this filter. (C) Same analysis as in A, with exons further classified into those having strong or weak 3’ and 5’ splice sites. Alternative exons are generally enriched among exons with weak splice sites, and constitutive exons are enriched among exons with strong splice sites. (D) Density of suboptimal ESSs in constitutive and alternative exons. Suboptimal ESSs were defined as sequences that differ from an ESS by one nucleotide substitution. (E) Density of suboptimal ESSs in constitutive and alternative exons (included >90% in at least one tissue).
Figure 7—figure supplement 8
Density of suboptimal ESEs in constitutive and alternative exons (included >90% in at least one tissue).
Figure 7—figure supplement 9
Density of suboptimal ESEs in constitutive and alternative exons with a PSI > 90% in each human tissue.
Figure 7—figure supplement 10

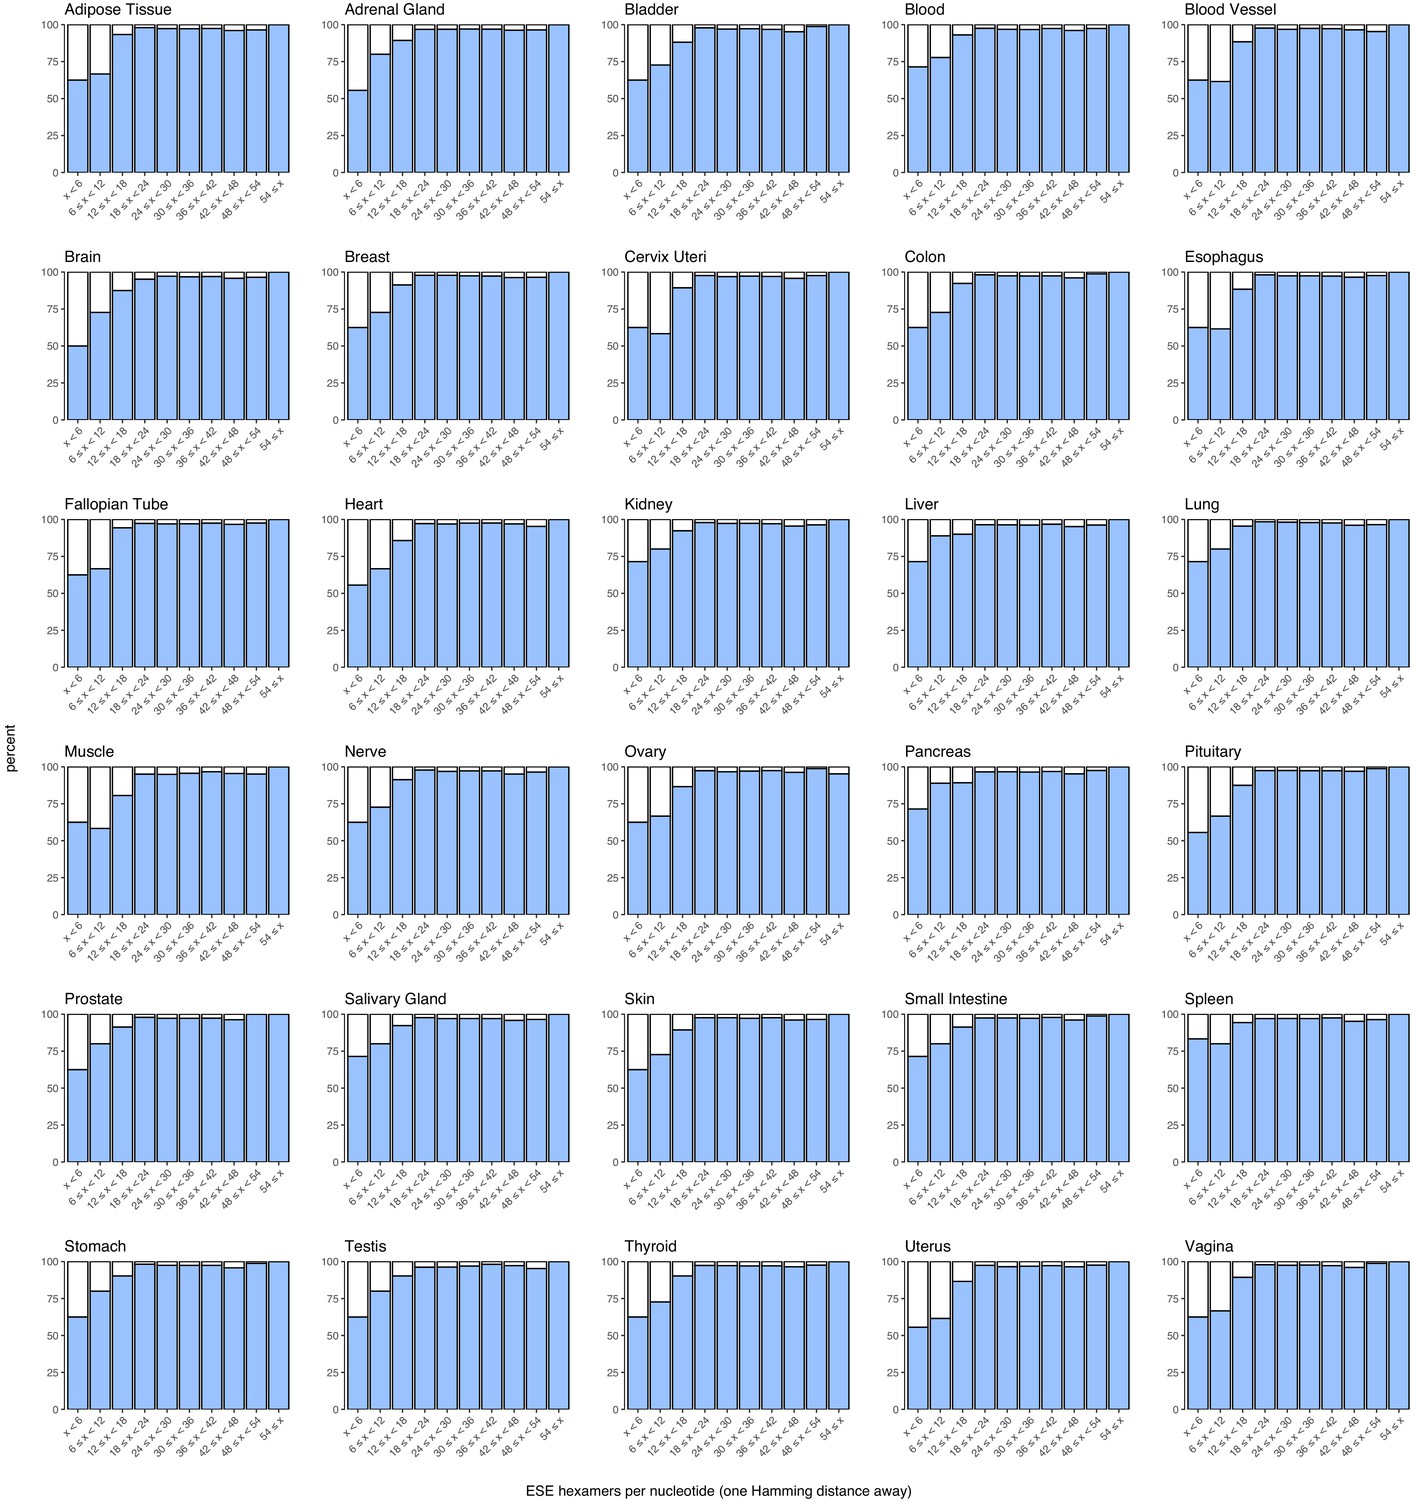
Enrichment of ESEs in constitutive exons vs. ESE robustness (considering only alternative exons with a PSI > 90% in at least one tissue), for all exons in all human tissues.
Figure 7—figure supplement 11
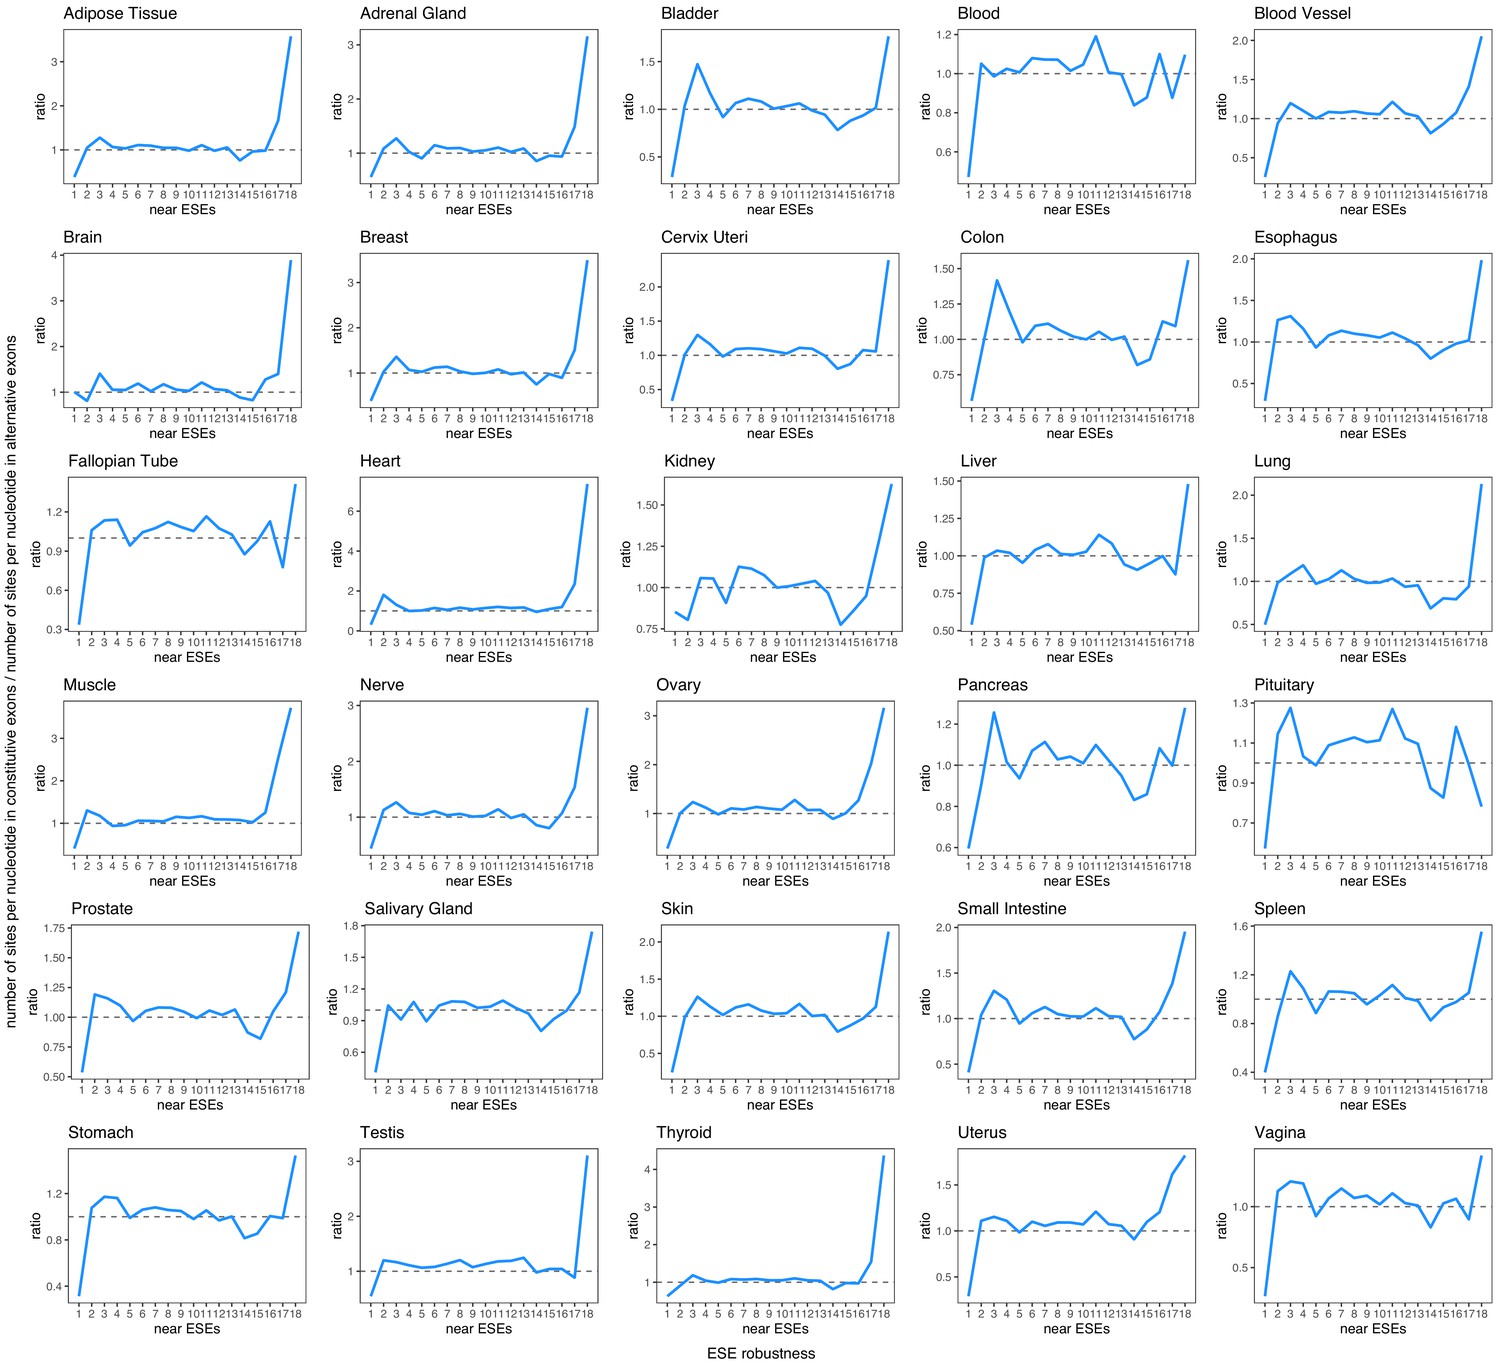
Robustness of ESEs in constitutive exons vs. ESE robustness in each human tissue (considering only alternative exons with a PSI > 90% in that tissue).
Figure 7—figure supplement 12

Robustness of ESEs in constitutive exons vs robustness of ESEs in alternative exons, accounting for splice site strength and exon inclusion levels.
(A) Same analysis as Figure 7F, but further subdividing exons into those having strong or weak 3’ and 5’ splice sites. (B) Same analysis as Figure 7—figure supplement 10, but further subdividing exons into those having strong or weak 3’ and 5’ splice sites.
Figure 7—figure supplement 13
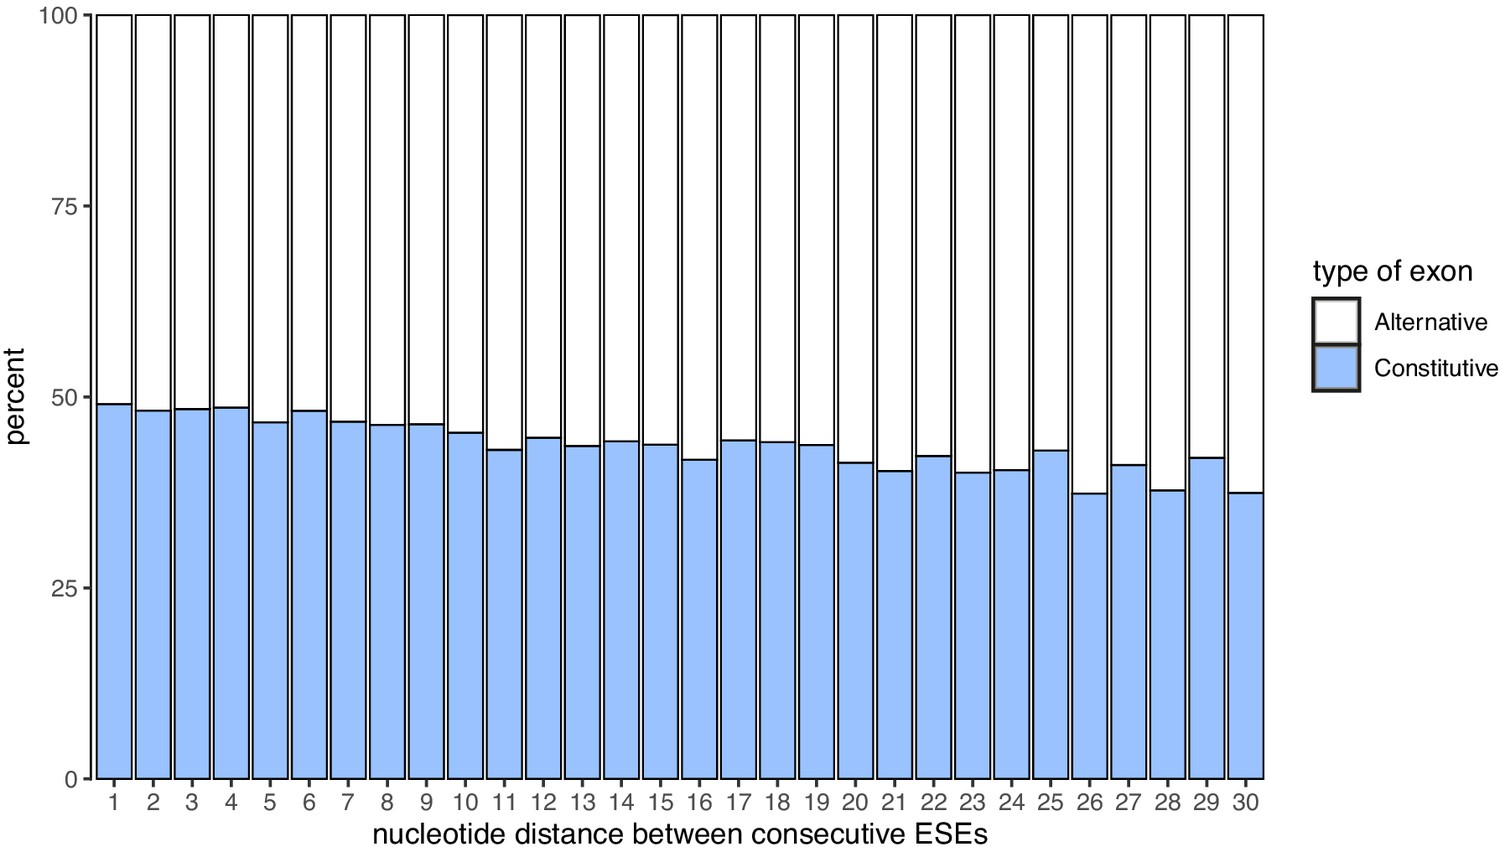
Nucleotide distance between consecutive ESEs.
Constitutive exons are enriched among exons with ESEs closer to each other.
Figure 7—figure supplement 14
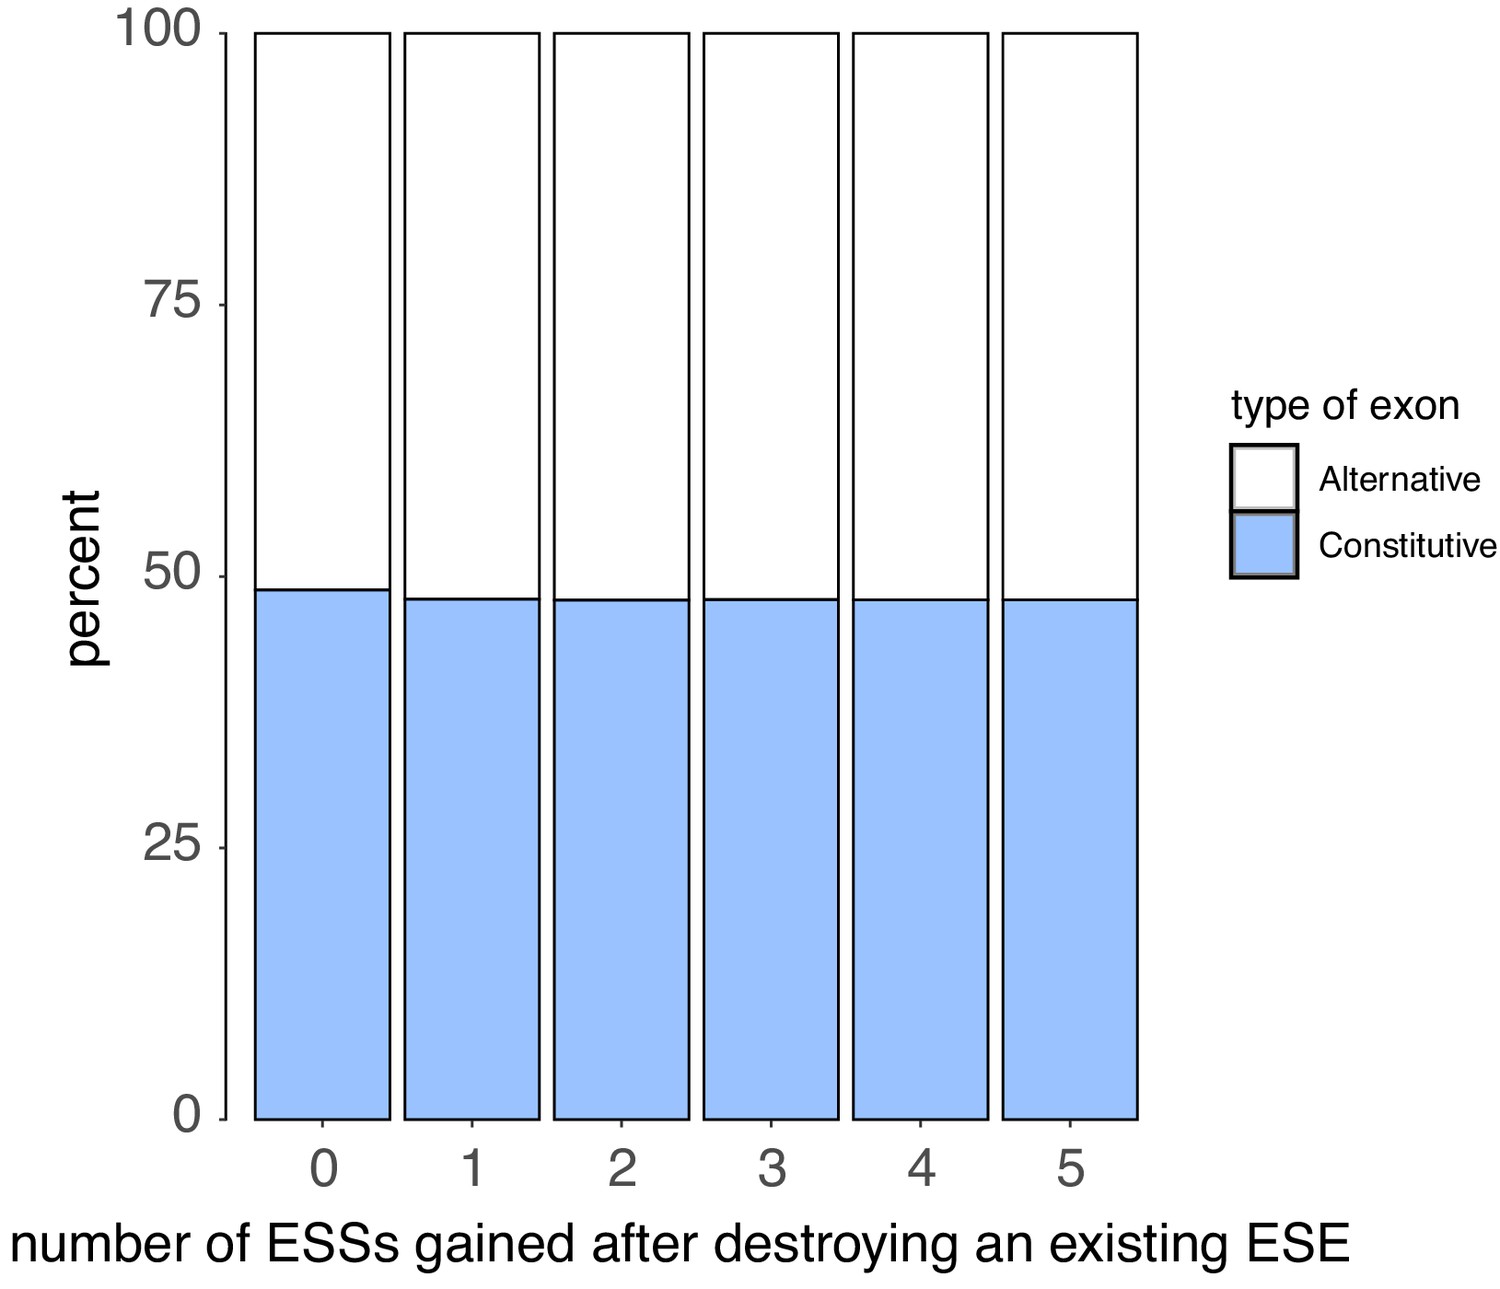
We counted the number of ESSs created upon disrupting each ESE in an exon with a point mutation (without allowing for the creation of ESEs that occupy the exact same six nucleotides as the disrupted ESE).
There is no correlation between the number of ESS created and the exon type.
Figure 8
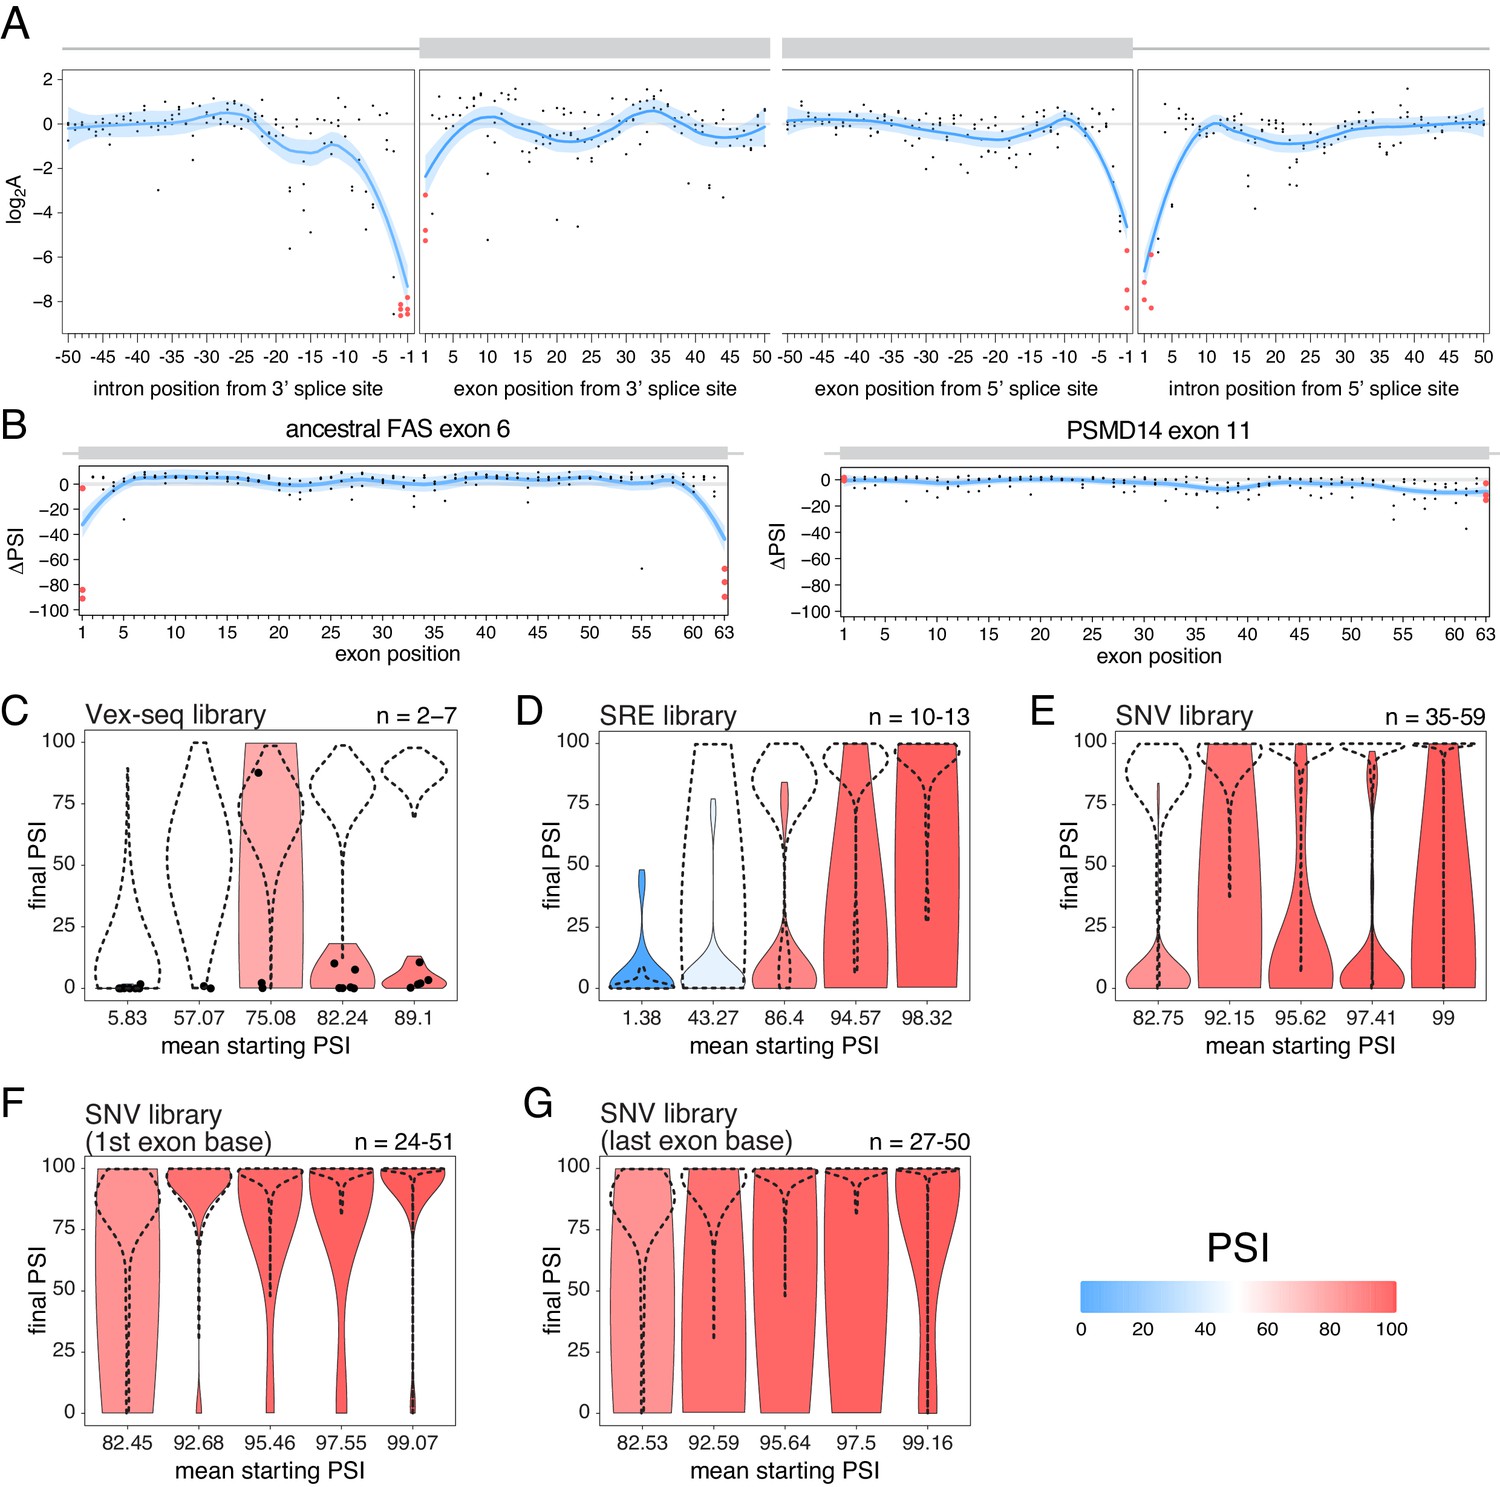
The effects of splice site mutations.
(A) Position-dependent distribution of biophysical mutation effects in the RON exon 11 dataset. Loess curves and their 95% confidence bands are shown in red (all positions) and blue (all positions except for the first and last exonic positions and the invariant intronic dinucleotide positions). (B) Position-dependent distribution of splice-altering effects in the two mutagenesis experiments. Mutations at the first and last exonic positions have a very strong skipping-promoting effect in the ancestral FAS exon 6, but not in PSMD14 exon 11. Loess curves as in A. (C) Distribution of invariant dinucleotide mutation effects in the Vex-seq library, separated into the same bins as Figure 5B. The black dashed lines show the distributions of all intronic mutations. The number on the top right represents the number of data points in each bin. Because this number is so low, each individual data point is also shown (represented as a black dot). (D) Distribution of invariant dinucleotide mutation effects in the SRE library, separated into the same bins as Figure 5C. The black dashed lines show the distributions of all intronic mutations. (E) Distribution of invariant dinucleotide mutation effects in the SNV library, separated into the same bins as Figure 5D. The black dashed lines show the distributions of all intronic mutations. (F) Distribution of first exon position mutation effects in the SNV library, separated into the same bins as Figure 3D. The black dashed lines show the distributions of all exonic mutations. (G) Distribution of last exon position mutation effects in the SNV library, separated into the same bins as Figure 3D. The black dashed lines show the distributions of all exonic mutations.
Figure 9

The scaling of mutational effects can create what appears to be sequence ‘redundancy’ as the exon inclusion level approaches 100 or 0%.
(A) Two exons can be included at nearly 100%, but be spliced with very different efficiencies. (B) A mutation that decreases the efficiency of splicing will have a strong effect on the inclusion of the exon with lower splicing efficiency (pink), but almost no effect on the inclusion of the exon with higher splicing efficiency, even though the starting inclusion level was almost the same.
Additional files
Download links
A two-part list of links to download the article, or parts of the article, in various formats.
Downloads (link to download the article as PDF)
Open citations (links to open the citations from this article in various online reference manager services)
Cite this article (links to download the citations from this article in formats compatible with various reference manager tools)
Mutations primarily alter the inclusion of alternatively spliced exons
eLife 9:e59959.
https://doi.org/10.7554/eLife.59959


