Ribosome recycling is not critical for translational coupling in Escherichia coli
- Department of Molecular Biology and Genetics, United States
- Howard Hughes Medical Institute, Johns Hopkins University School of Medicine, United States
Figures
Figure 1 with 1 supplement
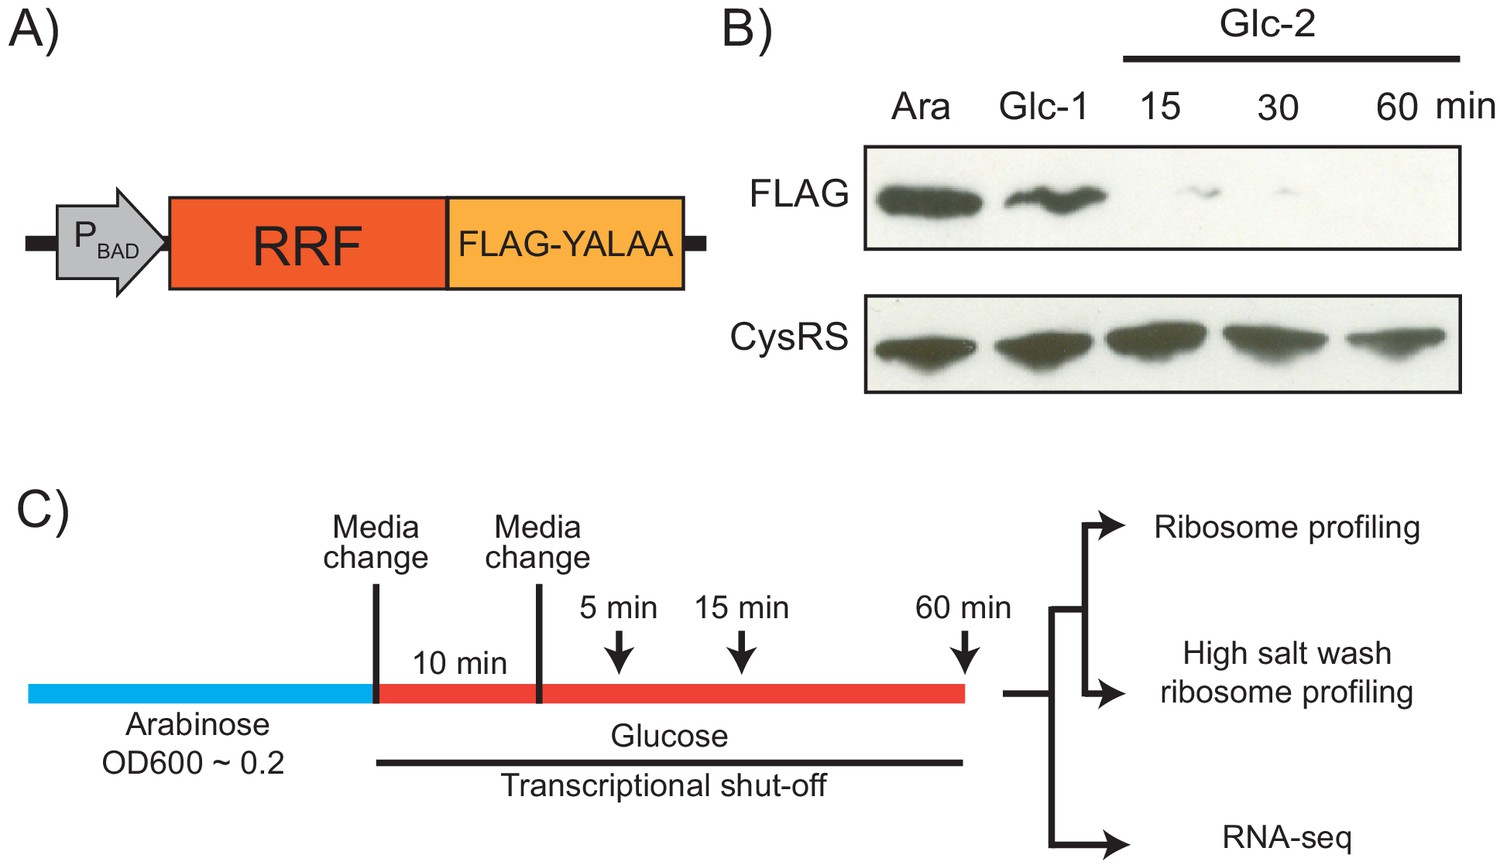
Strategy for ribosome recycling factor (RRF) depletion.
(A) In the genome, the promoter upstream of frr (the gene encoding RRF) was replaced by the ligand-inducible araBAD promoter. A FLAG tag and residues YALAA were added to facilitate RRF detection and target it for degradation by ClpXP. (B) RRF depletion was monitored over time using antibodies against the FLAG epitope. CysRS serves as a loading control. The samples are: Ara (cultured in media with 0.2% arabinose), Glc-1 (harvested 10 min after the 1st change to media with 0.2% glucose), and three samples harvested 15, 30, and 60 min after the 2nd change to media with glucose. (C) Growth conditions for the samples used to make sequencing libraries. Note that the cultures were collected at earlier time points compared to (B).
Figure 1—figure supplement 1
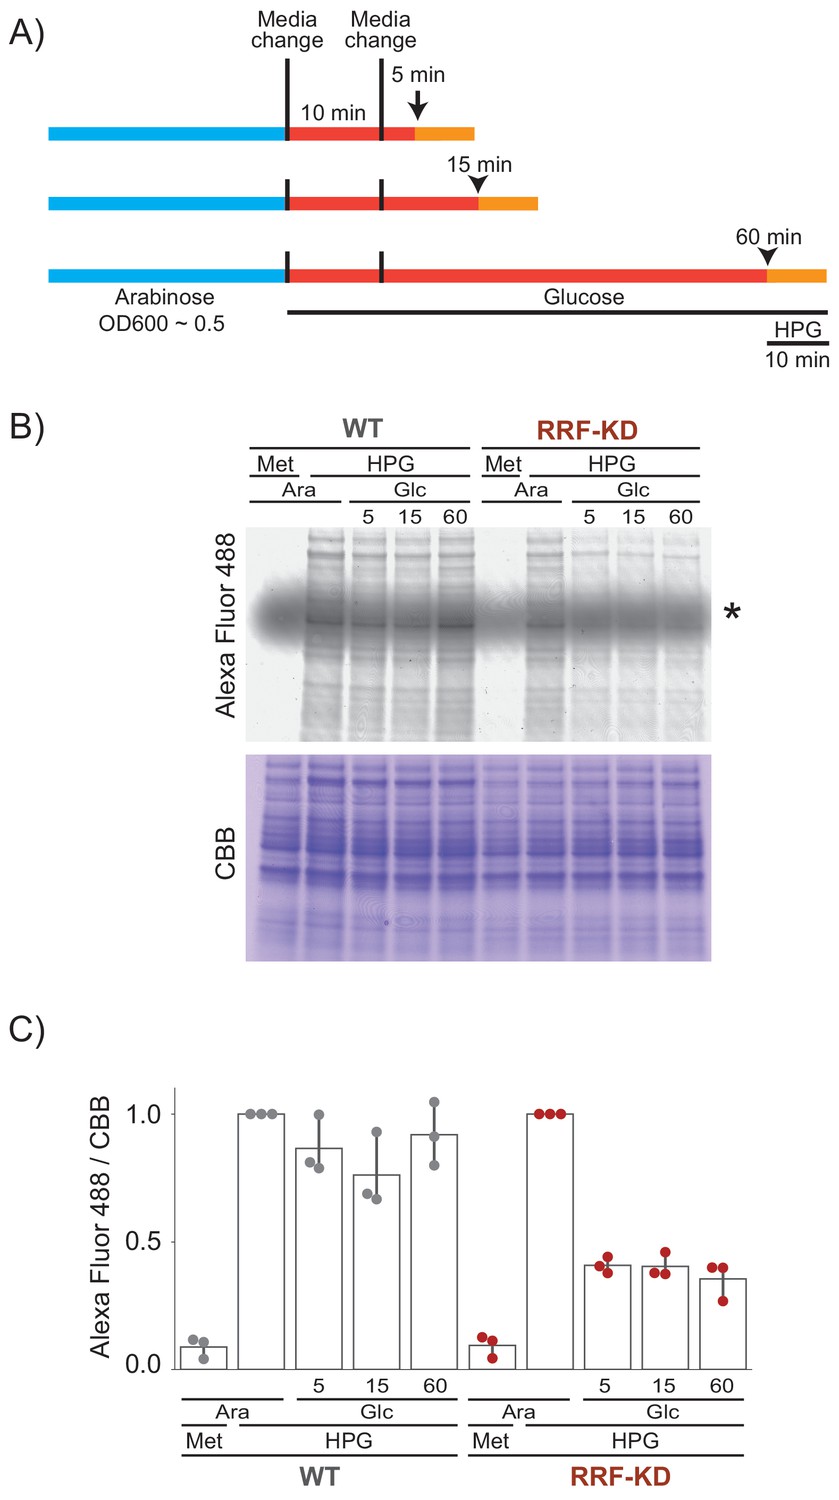
Protein synthesis continues after ribosome recycling factor (RRF) knock down.
(A) Cells were grown in media containing HPG (a methionine analog containing an alkyne moiety) for a period of 10 min at various times after the second change to media containing glucose. (B) HPG-containing protein was reacted with an azide-linked Alexa Fluor 488 using click chemistry. A gel stained with Coomassie brilliant blue (CBB) serves as a loading control. Met: methionine; Ara: arabinose; Glc: glucose. The asterisk indicates unreacted Alexa Fluor 488 azide. (C) Quantification of bulk translation levels: the Alexa Fluor 488 signal (newly synthesized protein) is normalized by CBB signal (total protein level). For each strain, the results were normalized to the level of incorporation observed when HPG is added to the arabinose media (where RRF is expressed). The mean and SD of three replicates are shown.
Figure 2

RRF knockdown creates queues of stalled ribosomes upstream of stop codons and high ribosome density in the 3′-UTR.
(A) Ribosome density (in reads per million mapped reads) on the rpsB gene 60 min after the 2nd media change in the wild-type (top) and RRF knock-down strain (bottom). (B–D) Average ribosome density aligned at stop codons from standard ribosome profiling after 5 min (B), 15 min (C), and 60 min (D). (E) Ratio of ribosome density (in RPKM) in the 3′-UTR and upstream ORF, with and without high salt in the lysis buffer. (F–H) Average ribosome density at stop codons in libraries prepared with the same biological samples as (B–D) but with high-salt lysis buffer.
Figure 3
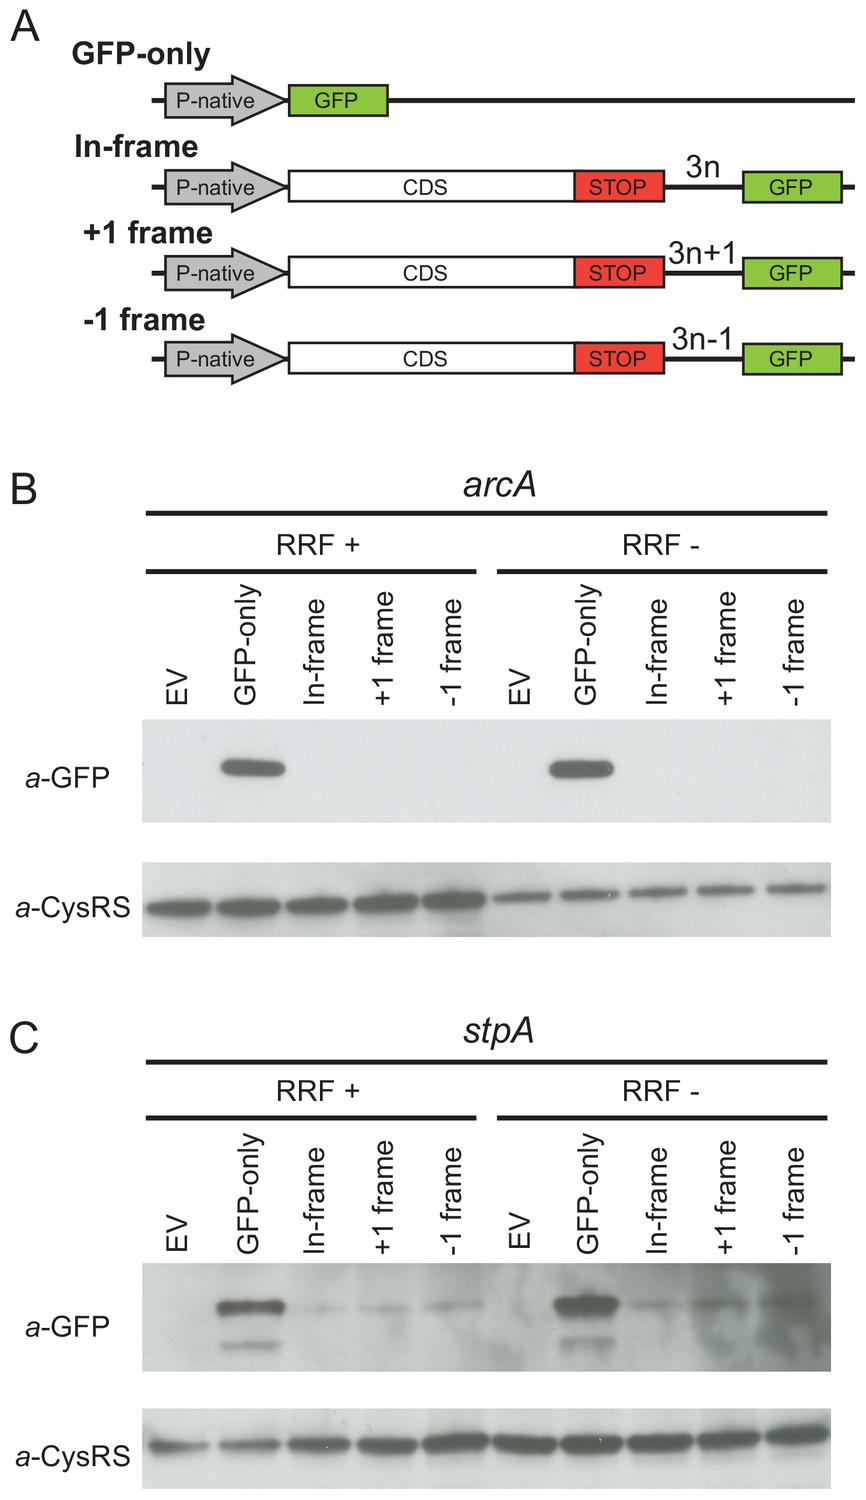
Ribosome recycling factor (RRF) depletion does not upregulate translation of GFP in the 3′-UTR of two genes.
(A) The reporter plasmid encodes an E. coli gene with its native promoter, 5′-UTR and 3′-UTR. The GFP ORF is inserted into the 3′-UTR in each reading frame relative to the upstream ORF. The GFP-only serves as a control showing the level of expression from the native promoter and ribosome-binding site. Antibodies against GFP were used to observe GFP expression from the 3′-UTR of the arcA (B) and stpA genes (C) with and without 60 min of RRF depletion. EV corresponds to an empty vector control. CysRS serves as a loading control.
Figure 4 with 1 supplement
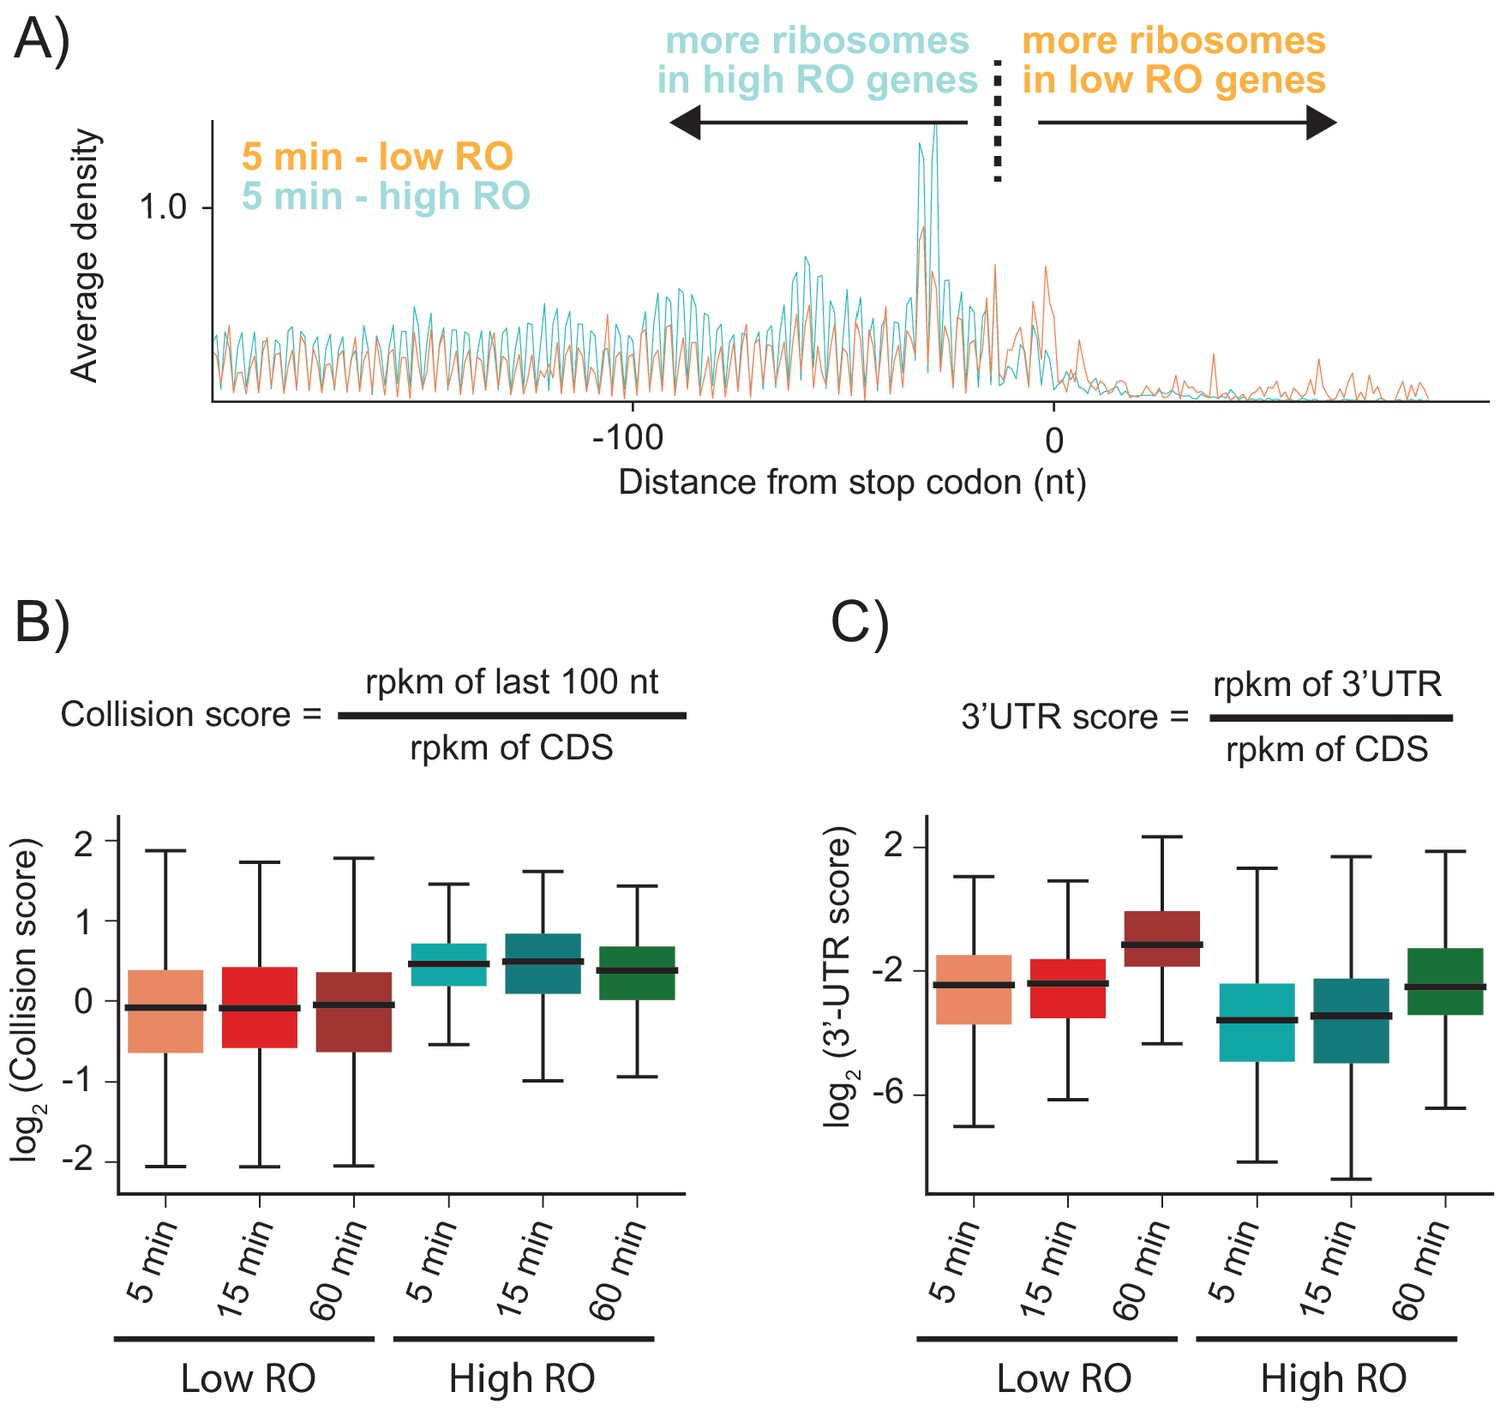
Highly translated genes have more stacked ribosomes and less relative ribosome density in the 3′-UTR.
(A) High and low ribosome occupancy genes were selected using the ratio of ribosome profiling to RNAseq in the WT sample. Here, we show the average ribosome density aligned at stop codons using the high-salt data from the KD strain at the 5 min time point. (B) Evaluation of collision scores for genes with low and high ribosome occupancy (RO). (C) Evaluation of 3′-UTR scores for genes with low and high RO.
Figure 4—figure supplement 1
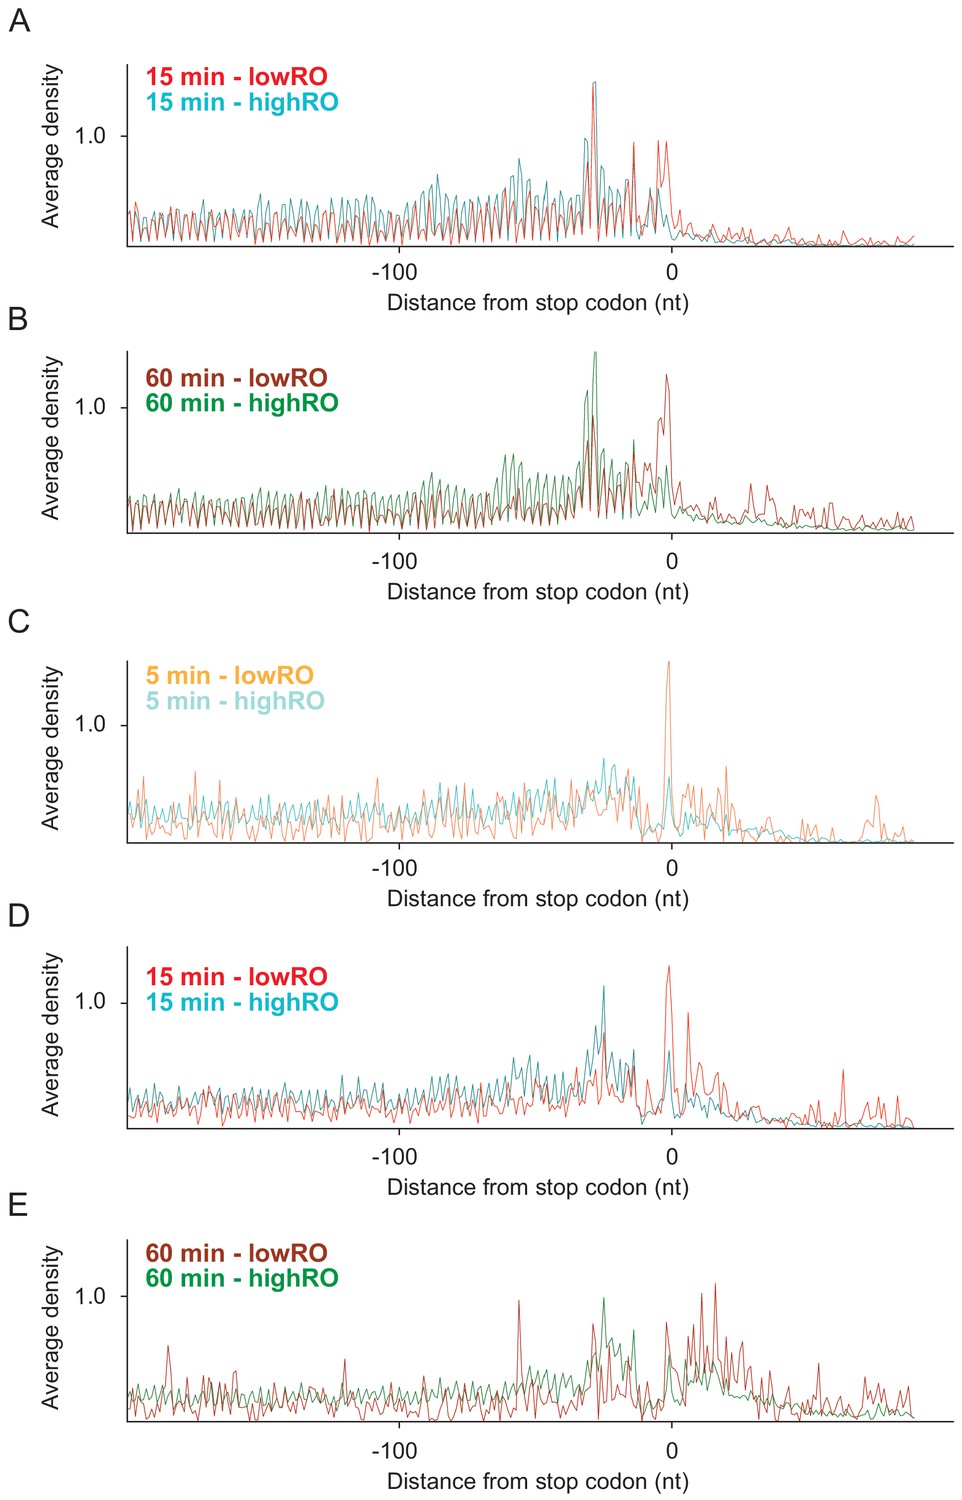
Average ribosome density aligned at stop codons of genes with low and high ribosome occupancy.
(A) From high-salt wash ribosome profiling after 15 min. (B) From high-salt wash ribosome profiling after 60 min. (C) From standard ribosome profiling after 5 min. (D) From standard ribosome profiling after 15 min. (E) From standard ribosome profiling after 60 min.
Figure 5
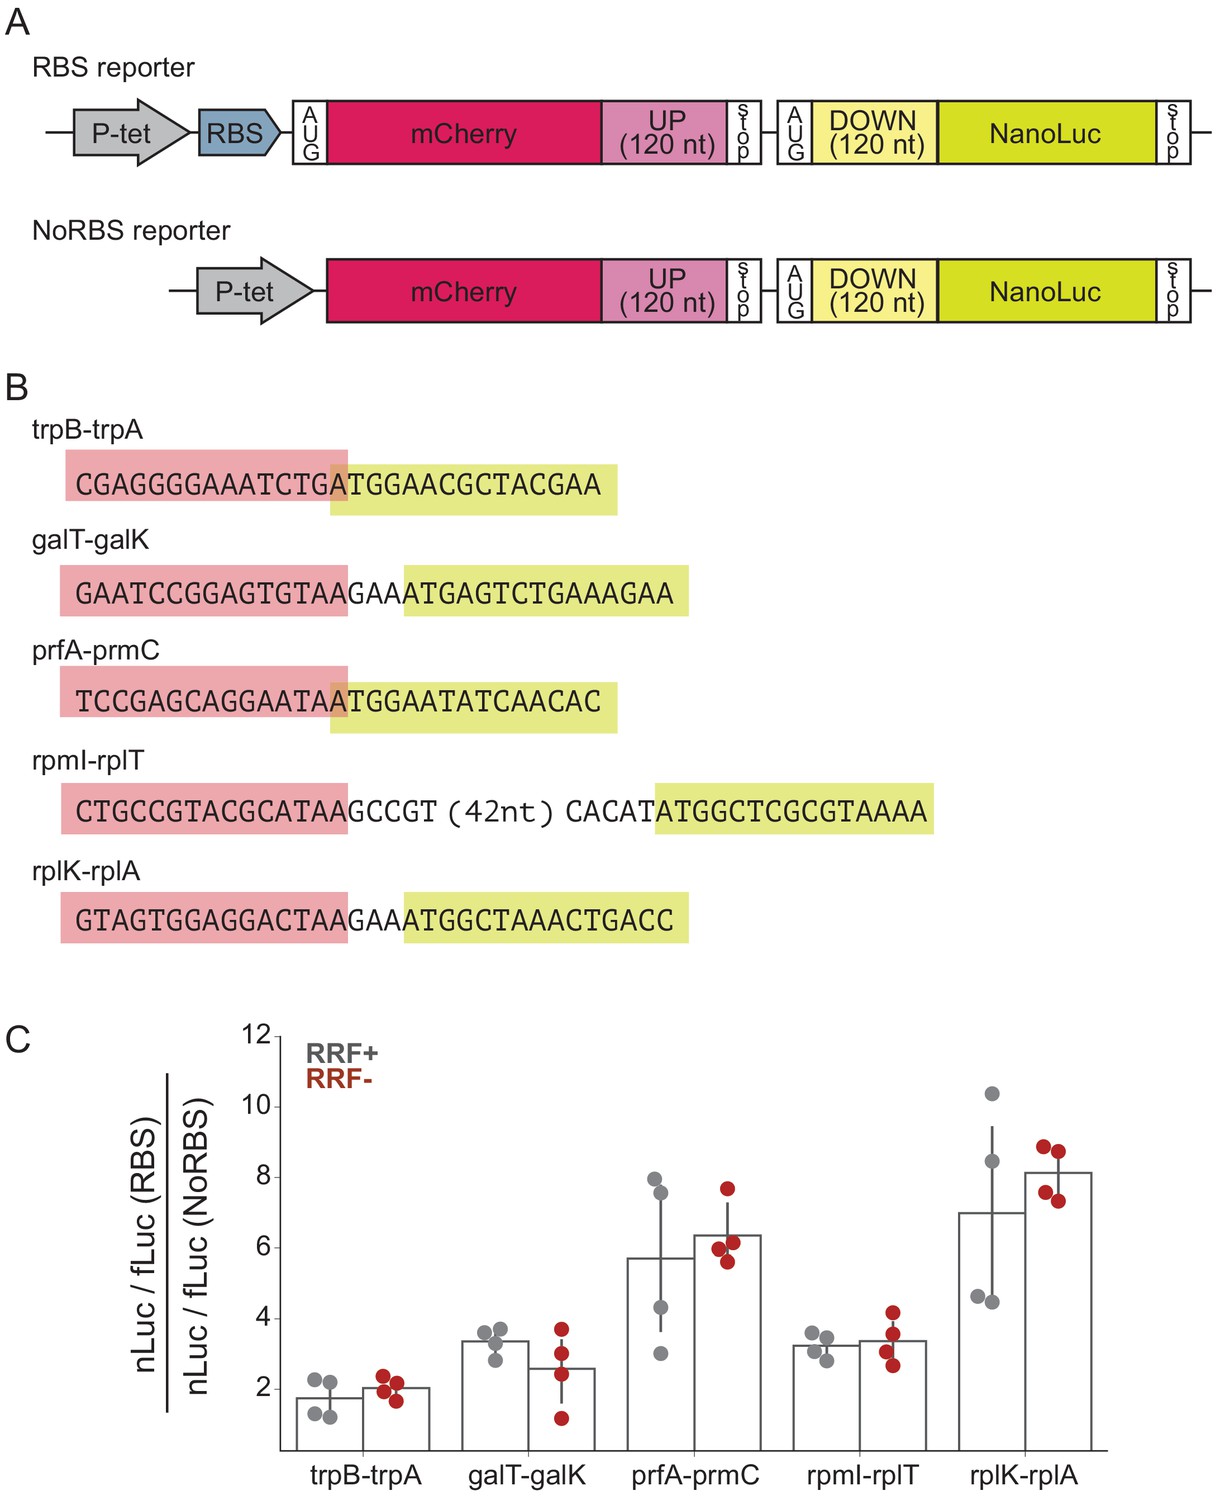
RRF depletion has little or no effect on five gene pairs known to be translationally coupled.
(A) Reporter plasmids encode both mCherry and nano-luciferase separated by the last 120 nt of the upstream gene, the intergenic region, and the first 120 nucleotides of the downstream gene. The RBS reporter expresses mCherry from a strong Shine-Dalgarno motif whereas in the NoRBS reporter, mCherry lacks both an SD motif and a start codon. Firefly luciferase, an internal control, is expressed from the plasmid by an independent promoter. (B) Five gene pairs known to be translationally coupled were tested in the reporter assay. Expression was induced by the addition of anhydrotetracycline at the second media change (where RRF is already being depleted). (C) The ratio of nLuc expression from the RBS reporter/NoRBS reporter reports on the level of translational coupling with (grey) or without (red) RRF. The bar graph shows the mean and SD from four independent tests.
Figure 6
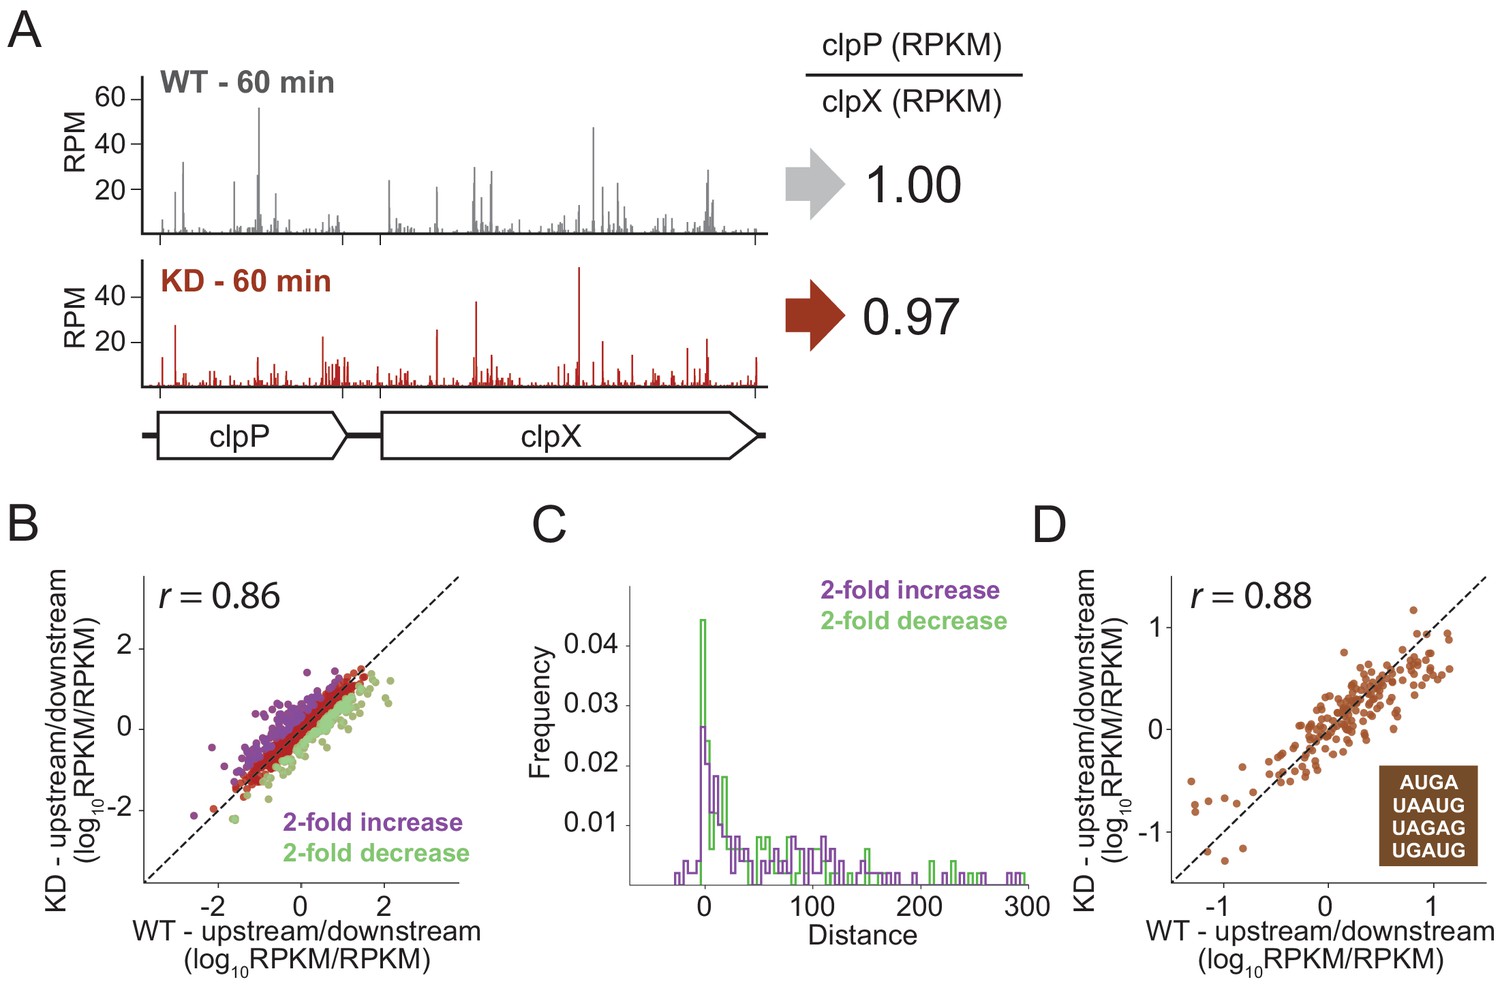
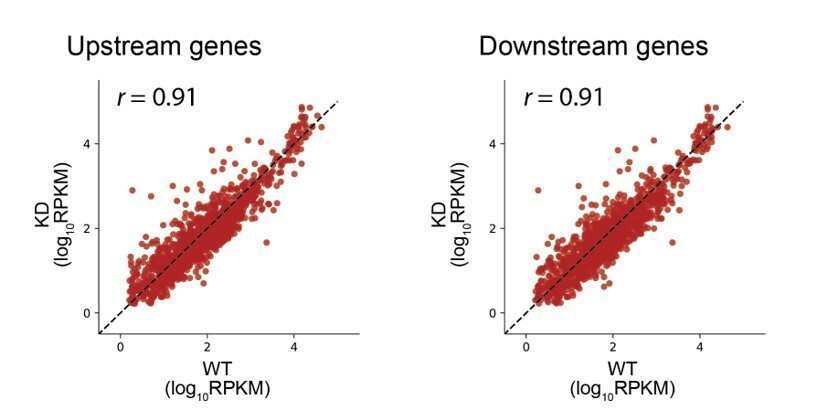
RRF depletion has little or no effect on the relative expression of gene pairs on polycistronic messages genome-wide.
(A) Gene models showing the ribosome density (in reads per million mapped reads) on the clpPX operon 60 min after the second media change in the wild type (top) and RRF knock-down strain (bottom). The ratio of ribosome density (in RPKM) for the upstream/downstream gene is indicated to the right. (B) Scatter plot of the ratio of ribosome density for gene pairs (upstream/downstream) on polycistronic messages 60 min after the second media change in the wild-type (x-axis) and RRF knock-down strain (y-axis). Genes with a twofold increase or decrease in their ratio are colored purple and green, respectively. (C) Histogram of the intergenic distance for genes with twofold higher ratios upon RRF knock-down (purple) and genes with twofold lower ratios (green). (D) Scatter plot as in (B) but only including gene pairs with overlapping stop and start codons. r values indicate Pearson correlations in (B) and (D).
Figure 7
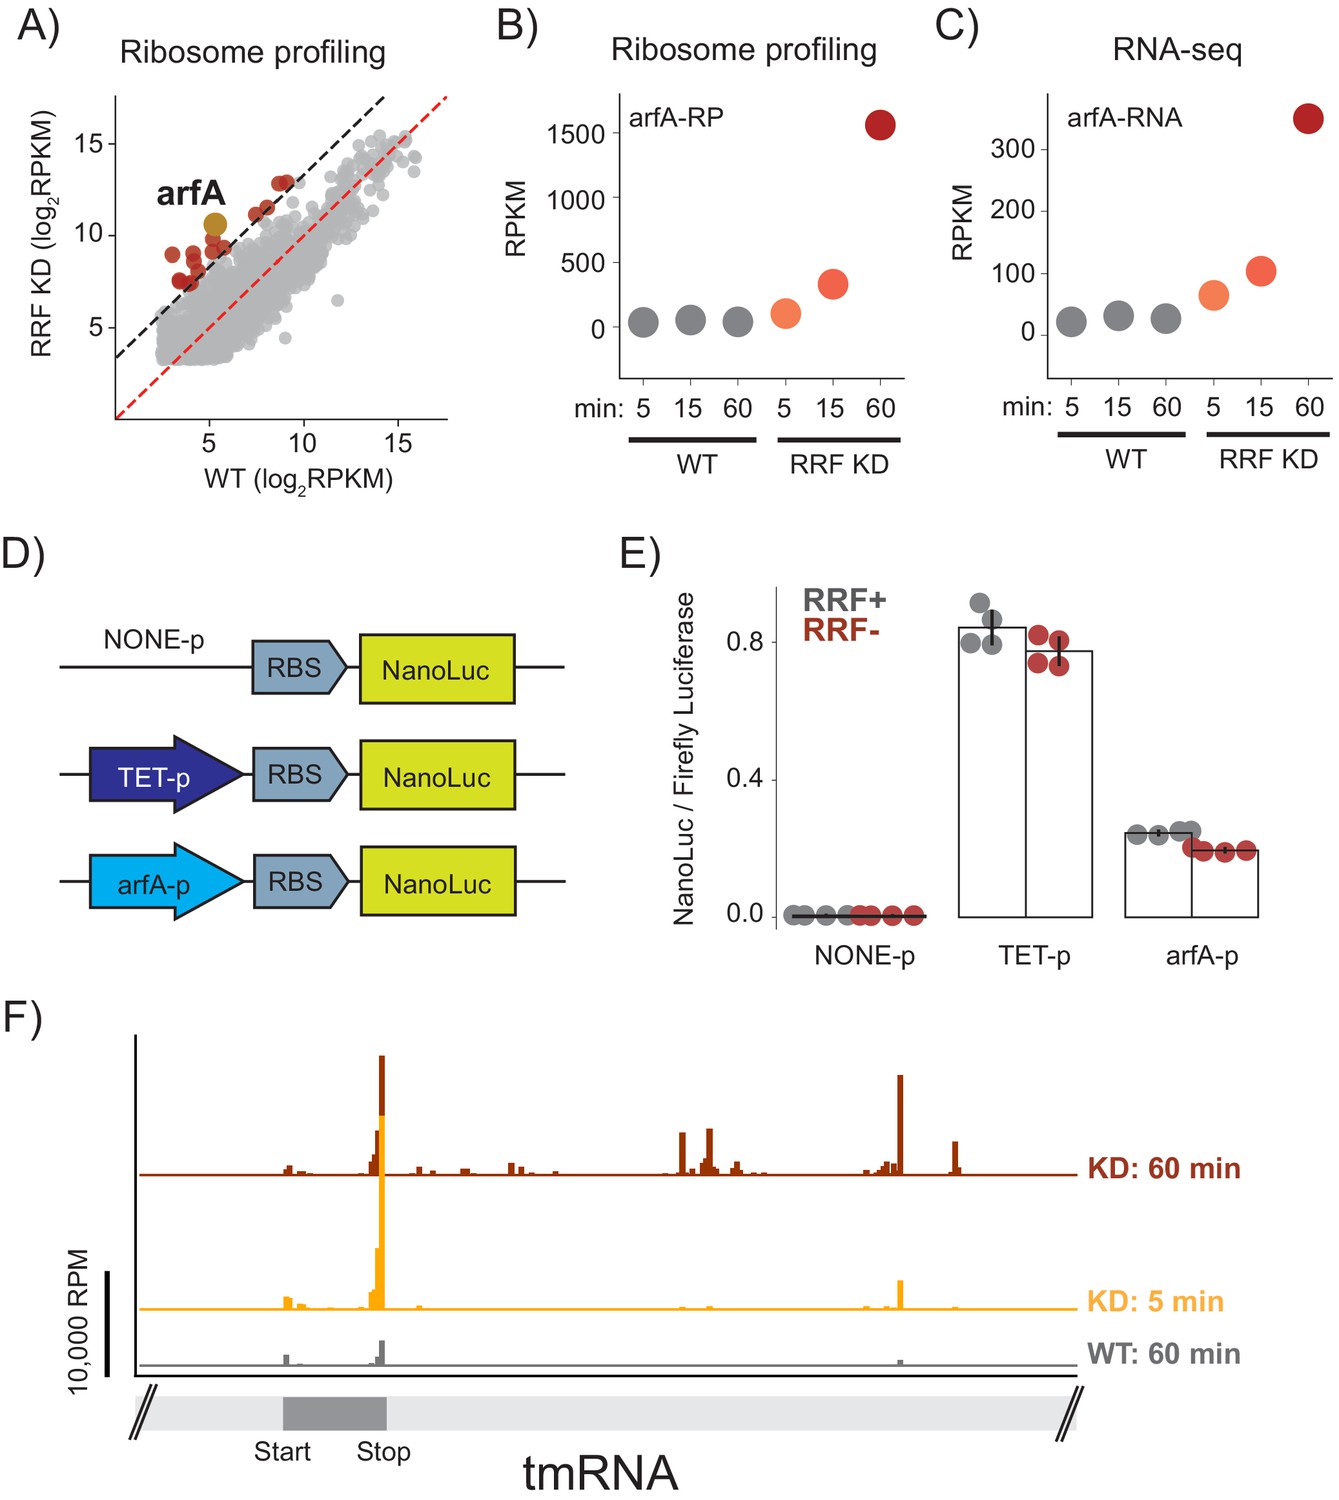
Ribosome recyclinf factor (RRF) depletion upregulates ArfA expression.
(A) Scatter plot of ribosome density (in rpkm) in the wild type (x-axis) and RRF knock-down strain (y-axis) 60 min after the second media change. Genes with 10-fold increase of ribosome density are colored red; arfA is highlighted in yellow. (B) Levels of arfA translation from ribosome profiling at each time point. (C) Levels of arfA mRNA from RNA-seq at each time point. (D) Reporter assay to measure transcription from the arfA promoter. Nano-luciferase is expressed from a plasmid using the same RBS either without a promoter, from the TET-promoter, or from the arfA promoter. Firefly luciferase, an internal control, is expressed from the plasmid by an independent promoter. (E) The nLuc/fLuc ratio reports on the level of transcription by the three promoters with (grey) or without (red) RRF of promoter assay. The bar graph shows the mean and SD from four independent tests. (F) Ribosome density (in reads per million mapped reads) on part of the gene for tmRNA, including the short region that is translated.
Author response image 1
Additional files
Download links
A two-part list of links to download the article, or parts of the article, in various formats.
Downloads (link to download the article as PDF)
Open citations (links to open the citations from this article in various online reference manager services)
Cite this article (links to download the citations from this article in formats compatible with various reference manager tools)
Ribosome recycling is not critical for translational coupling in Escherichia coli
eLife 9:e59974.
https://doi.org/10.7554/eLife.59974


