Integration of genomics and transcriptomics predicts diabetic retinopathy susceptibility genes
- Department of Pathology and Laboratory Medicine, Ann and Robert H. Lurie Children's Hospital of Chicago, United States
- Research and Development, NeoGenomics Laboratories, United States
- University of Illinois at Chicago, United States
- Cellular Screening Center, Office of Shared Research Facilities, The University of Chicago, United States
- Department of Biostatistics, Johns Hopkins University, United States
- National Eye Institute, National Institutes of Health (NIH), United States
- The George Washington University, Biostatistics Center, United States
- Department of Pharmacology, Center for Genetic Medicine, Northwestern University Feinberg School of Medicine, United States
Figures
Figure 1 with 4 supplements
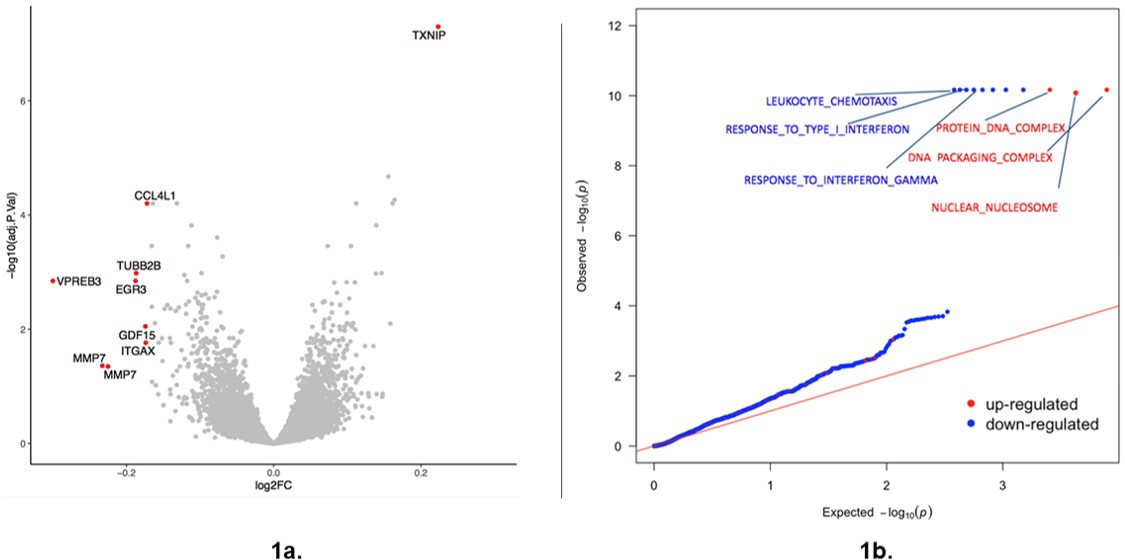
Response to glucose.
(a) Volcano plot summarizing transcriptional response to glucose for all 22 individuals (RGAll consisting of nDM, nDR, and PDR individuals). Each point represents a single gene. Red indicates genes showing a differential response (FDR < 0.05; log10 >1.3 represented by the dotted line) and an absolute log2FC >0.17. Adj p-value is false discovery rate (FDR). FC indicates expression fold change with positive values indicating higher expression in the high glucose condition relative to the standard condition. Source and code files for this plot are available in Figure 1—source data 1 and Source code 1. An additional source file can be found in Gene Expression Omnibus (GEO) at https://www.ncbi.nlm.nih.gov/geo/ under accession code GSE146615. (b) QQ (quantile-quantile) plot plot summarizing GSEA of transcriptional response to glucose in all 22 individuals. Pathways are classified as upregulated (red) or downregulated (blue) in response to glucose. Only significant GO categories (FDR < 0.1%) are labeled. Red line indicates the null expectation. Source and code files for this plot are available in Figure 1—source data 2, 3, 4, and 5 and Source code 2.
-
Figure 1—source data 1
RG volcano plot data.
- https://cdn.elifesciences.org/articles/59980/elife-59980-fig1-data1-v2.xlsx
-
Figure 1—source data 2
GSEA QQ plot data.
- https://cdn.elifesciences.org/articles/59980/elife-59980-fig1-data2-v2.xlsx
-
Figure 1—source data 3
GSEA QQ plot data.
- https://cdn.elifesciences.org/articles/59980/elife-59980-fig1-data3-v2.xlsx
-
Figure 1—source data 4
GSEA QQ plot data.
- https://cdn.elifesciences.org/articles/59980/elife-59980-fig1-data4-v2.xlsx
-
Figure 1—source data 5
GSEA QQ plot data.
- https://cdn.elifesciences.org/articles/59980/elife-59980-fig1-data5-v2.xlsx
-
Figure 1—source data 6
p-value distribution plot data.
- https://cdn.elifesciences.org/articles/59980/elife-59980-fig1-data6-v2.csv
-
Figure 1—source data 7
Intraindividual variation HG plot.
- https://cdn.elifesciences.org/articles/59980/elife-59980-fig1-data7-v2.csv
-
Figure 1—source data 8
Intraindividual variation HG plot.
- https://cdn.elifesciences.org/articles/59980/elife-59980-fig1-data8-v2.xlsx
Figure 1—figure supplement 1
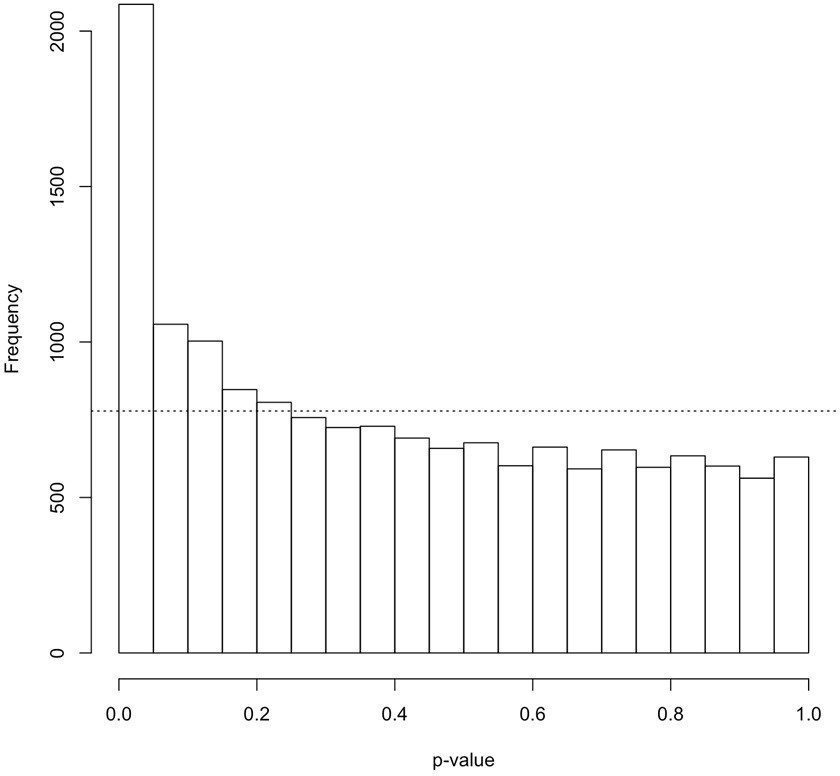
p-value distribution for transcriptional response to glucose in all 22 individuals (RGAll) (no diabetes, nDR, and PDR).
Plotted are limma-derived differential expression p-values for 11,548 genes. The dashed line represents the expected null distribution. Source and code files for this plot are available in Figure 1—source data 6 and Source code 3.
Figure 1—figure supplement 2

Intra- and interindividual transcriptome variation in high glucose treatment.
Intraindividual variation in the transcriptome was quantified among biological replicates and compared to interindividual variation, for individual genes (2,3), and comparing the two distributions of all genes (3,4). Source and code files for these plots are available in Figure 1—source data 7 and 8, and Source code 4.
Figure 1—figure supplement 3

QQ plot demonstrating a significant shift away from the null represented by the red line of no difference between individuals as determined by assessing intra-individual variance from the biologic replicate samples.
Figure 1—figure supplement 4
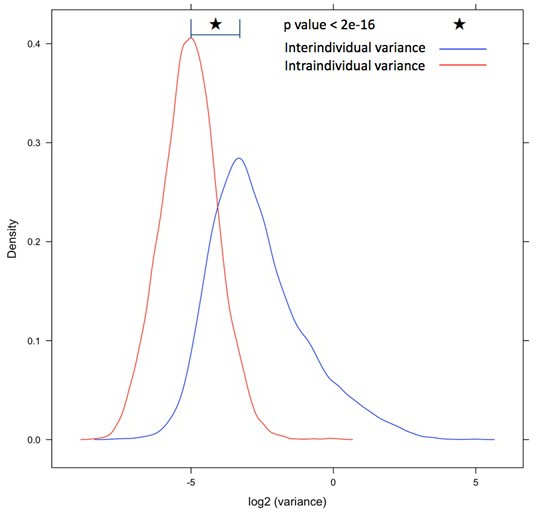
Plot showing distribution of inter vs intra-individual variance.
Figure 2 with 2 supplements
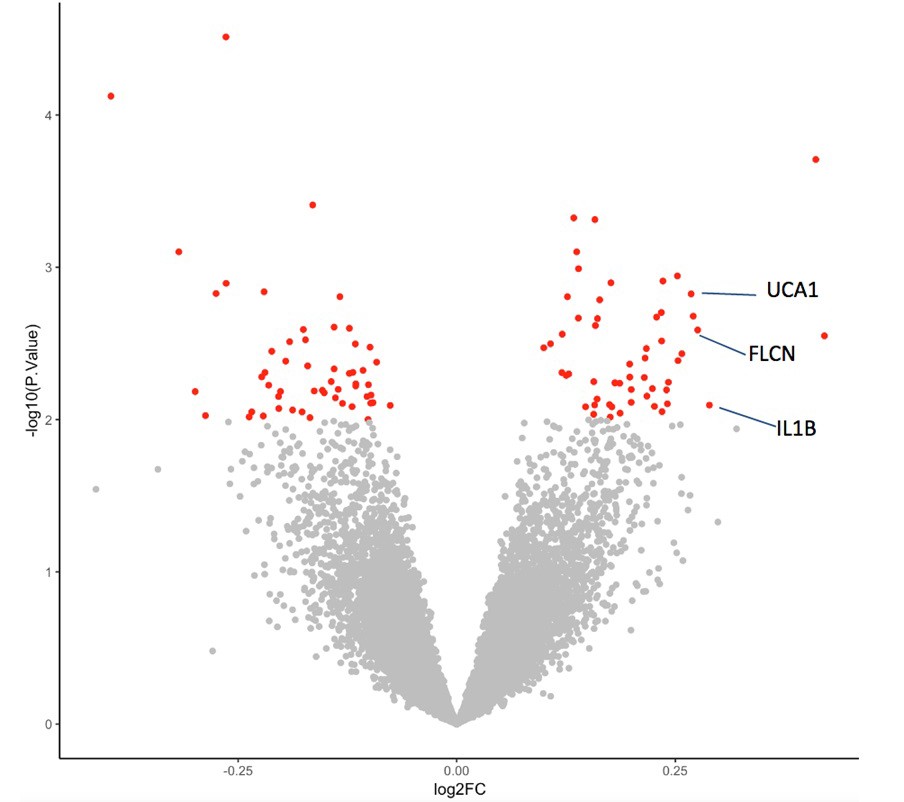
Differential transcriptional response to glucose among individuals with diabetes with and without retinopathy.
Volcano plot summarizing genes exhibiting a differential response to glucose between individuals with diabetes with and without retinopathy (RGPDR–nDR). The difference in FC between groups is represented on the X-axis and p-value of this difference on the Y-axis. Red indicates the 103 genes showing the most differential expression between individuals with and without retinopathy (p<0.01). FC, fold change. Source and code files for this plot are available in Figure 2—source data 1 and Source code 5. An additional source file for this plot can be found in Gene Expression Omnibus (GEO) at https://www.ncbi.nlm.nih.gov/geo/ under accession code GSE146615.
-
Figure 2—source data 1
Differential transcriptional response volcano plot.
- https://cdn.elifesciences.org/articles/59980/elife-59980-fig2-data1-v2.xlsx
-
Figure 2—source data 2
Multidimensional scaling plot.
- https://cdn.elifesciences.org/articles/59980/elife-59980-fig2-data2-v2.xlsx
-
Figure 2—source data 3
Multidimensional scaling plot.
- https://cdn.elifesciences.org/articles/59980/elife-59980-fig2-data3-v2.xlsx
-
Figure 2—source data 4
Multidimensional scaling plot.
- https://cdn.elifesciences.org/articles/59980/elife-59980-fig2-data4-v2.csv
-
Figure 2—source data 5
Multidimensional scaling plot.
- https://cdn.elifesciences.org/articles/59980/elife-59980-fig2-data5-v2.csv
Figure 2—figure supplement 1
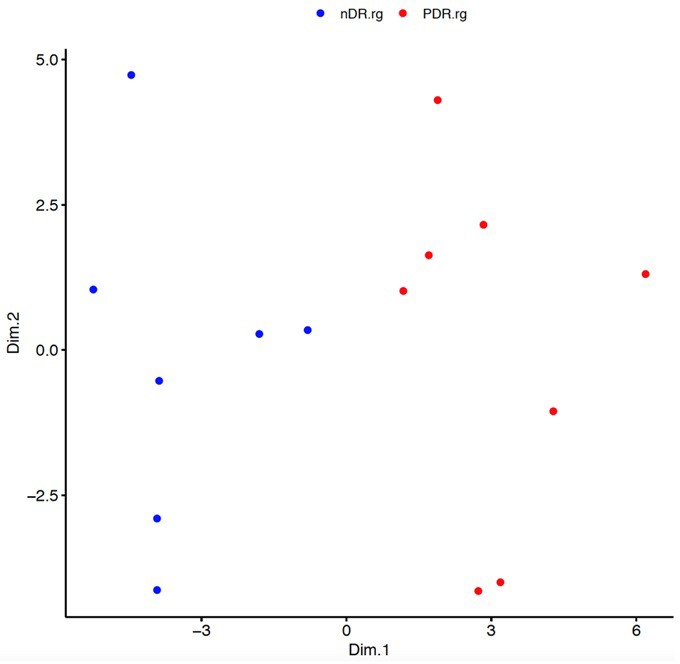
Multidimensional scaling based on differential response to glucose (rg).
Each point represents a single study subject; individuals with proliferative diabetic retinopathy (PDR, red, n = 8) and individuals with diabetes without retinopathy (nDR, blue, n = 7). The first coordinate (Dim.1, x-axis) is correlated with subject retinopathy status (RGpdr–ndr, p=3×10⁻⁶). Source and code files for this plot are available in Figure 2—source data 2, 3, 4, and 5 and Source code 6.
Figure 2—figure supplement 2
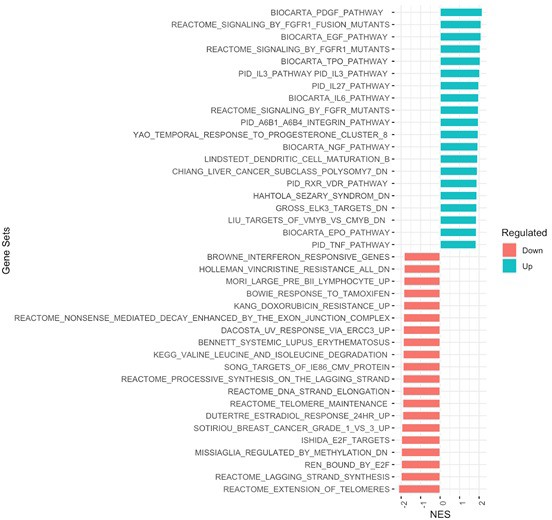
Gene set enrichment analysis (GSEA) of genes with differential response to glucose between individuals with diabetes with and without diabetic retinopathy.
Normalized enrichment score (NES). Source files for this plot can be found in Gene Expression Omnibus (GEO) at https://www.ncbi.nlm.nih.gov/geo/ under accession code GSE146615.
Figure 3 with 2 supplements
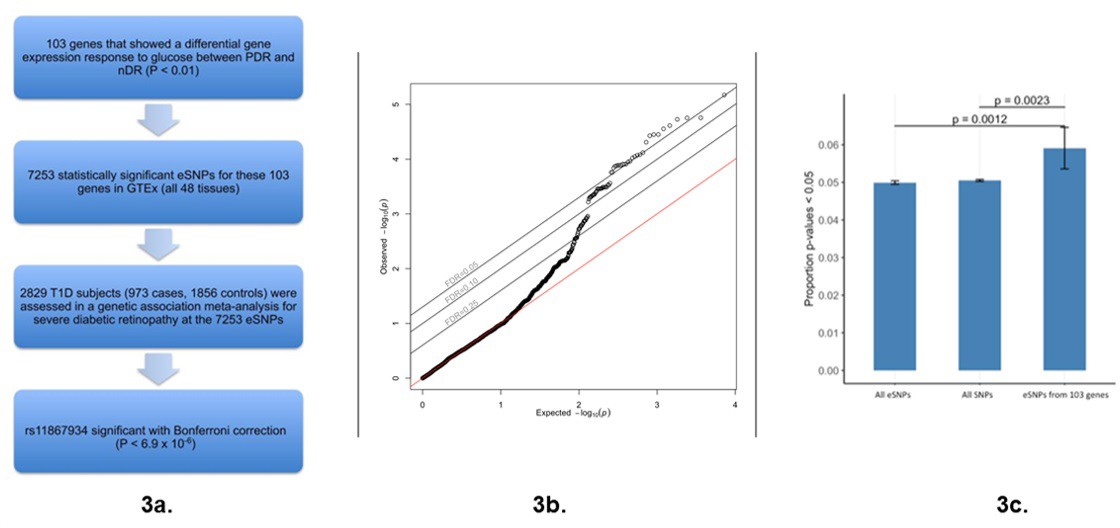
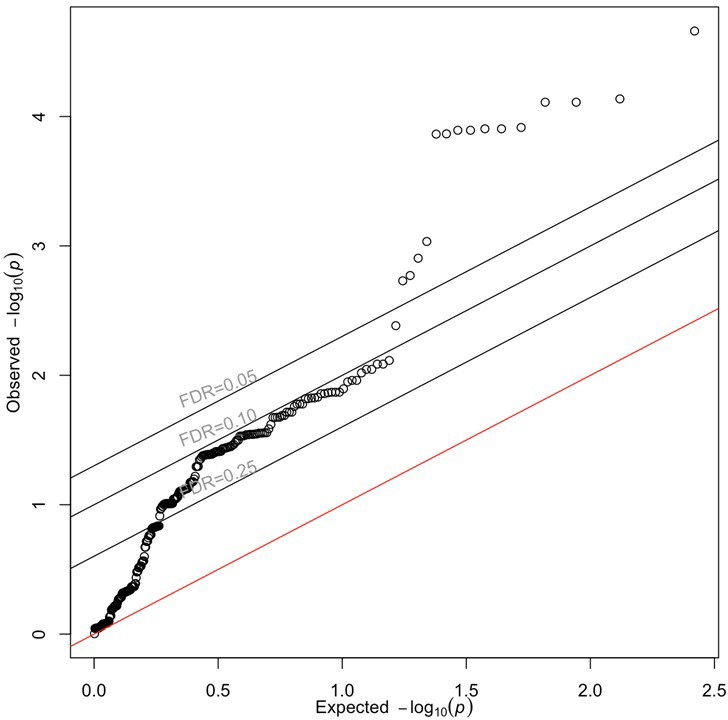
Association of glucose differential response genes (RGpdr–ndr) with diabetic retinopathy.
(a) Workflow of analytical steps integrating glucose differential response genes with genetic association with diabetic retinopathy. Flow chart showing key experimental steps based on stepwise findings. (b) QQ plot revealing a skew away from the null and above the FDR 0.05 threshold suggests that expression of some of the glucose response genes may be causally related to diabetic retinopathy. 7253 GTEx eSNPs were generated from the 103 differential response genes and tested for their association with diabetic retinopathy in a GWAS. Observed vs. expected p-values are plotted. The null hypothesis of no difference between the observed and expected p-values is represented by the red line. No influence of population structure or other design factors was observed (genomic control inflation estimate λGC = 1.005) (Devlin and Roeder, 1999). Source and code files for this plot are available in Figure 3—source data 1 and Source code 7. (c) Bar plot comparing frequency of p-values <0.05 in diabetic retinopathy GWAS of: all eSNPs, all SNPs, and eSNPs from the 103 differential response genes. An excess of GWAS p-values of <0.05 is observed in the eSNPs from the glucose differential response genes (p=0.0012 vs. all eSNPs and p=0.0023 vs. all SNPs). The proportion of SNPs with p<0.05 in the all SNPs, all eSNPs, and 103 differential response gene eSNPs are 0.0505, 0.0499, and 0.0571, respectively. Source and code files for this plot are available in Figure 3—source data 2 and Source code 8.
-
Figure 3—source data 1
Association of glucose differential response genes QQ plot.
- https://cdn.elifesciences.org/articles/59980/elife-59980-fig3-data1-v2.xlsx
-
Figure 3—source data 2
Association of glucose differential response genes Bar plot.
- https://cdn.elifesciences.org/articles/59980/elife-59980-fig3-data2-v2.xlsx
-
Figure 3—source data 3
eGenes Histogram.
- https://cdn.elifesciences.org/articles/59980/elife-59980-fig3-data3-v2.xlsx
Figure 3—figure supplement 1
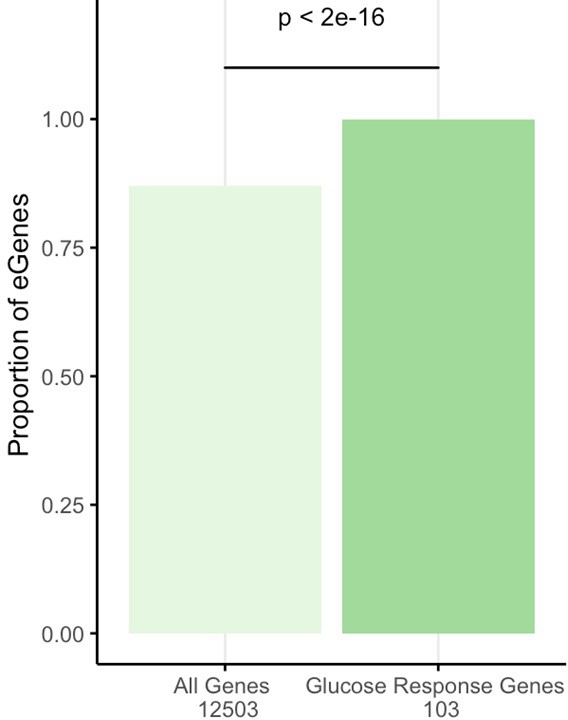
Enrichment of eGenes in glucose differential response genes.
The proportion of eGenes is plotted to compare all 12,503 genes assessed on the microarray to the 103 glucose response genes. An eGene is defined as any gene with a GTEx eSNP (q-value <0.05) in any tissue. GTEx (version 7). Source files are available with open access at https://www.gtexportal.org/home/datasets, and code in Source code 9.
Figure 3—figure supplement 2
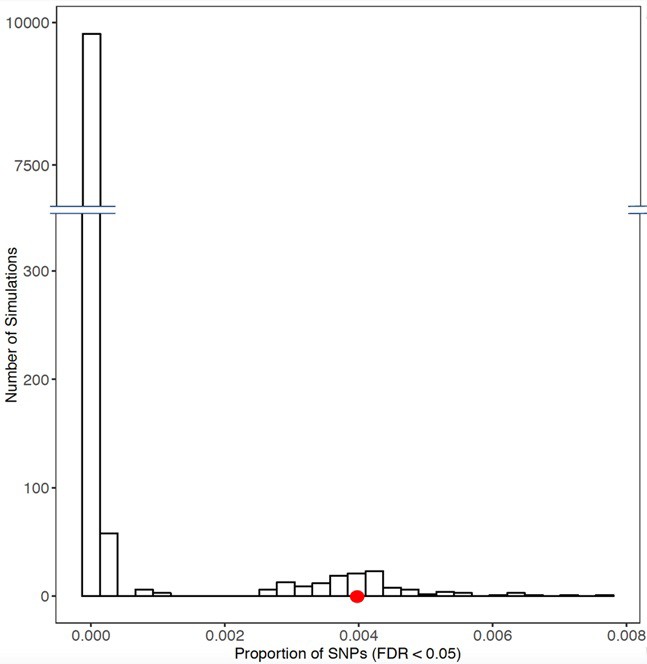
Histogram of frequency in which permutations of eSNPs generated from random sets of 103 genes revealed similar p-values to those generated from the set of 103 differential response genes to glucose (red dot).
For each resampling, 103 genes were chosen at random from the genome. eSNPs for each gene were generated from GTEx (version 7) using all 48 tissues. p-Values for each eSNP were determined in our prior meta-GWAS for diabetic retinopathy (Grassi et al., 2011). The x-axis shows the proportion of eSNPs in each set with an FDR < 0.05 in the diabetic retinopathy meta-GWAS. The figure reveals a significant shift to the right (represented by the red dot) for the glucose response gene eSNPs in the meta-GWAS compared to resampled eSNPs. Source and code files for this plot are available in Figure 3—source data 3, and additional source data files available at https://doi.org/10.5061/dryad.zkh18938j, and Source code 10.
Figure 4 with 4 supplements
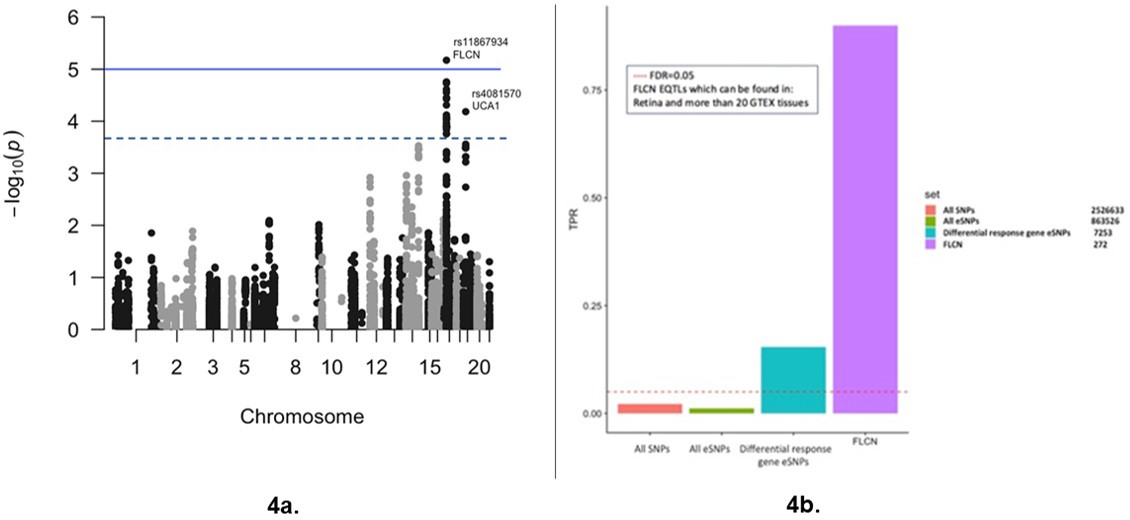
Diabetic retinopathy meta-GWAS for eSNPs of differential response genes to glucose.
(a) Manhattan plot of the results of the meta-GWAS for diabetic retinopathy showing association signals for the eSNPs from the differential response genes to glucose for individuals with and without retinopathy (RGPDR–nDR). Threshold lines represent Bonferroni correction (blue) and FDR < 0.05 (black). Association testing for diabetic retinopathy performed with 7253 eSNPs representing 103 differential response genes to glucose. Source and code files for this plot are available in Figure 4—source data 1 and Source code 11. (b) Bar plot comparing the true positive rate (π1), TPR, for association of diabetic retinopathy with all SNPs, all eSNPs, eSNPs from the 103 differential response genes to glucose (n = 7253), and eSNPs found in retina and >20 GTEx tissues for folliculin (FLCN) (n = 272). TPR is an estimate of the proportion of tests that are true under the alternative hypothesis. Plot reveals significant enrichment for glucose response gene eSNPs in general and for FLCN eSNPs (π1 = 0.9) in particular. Source and code files for this plot are available in Figure 4—source data 2, 3, and 4, and Source code 12.
-
Figure 4—source data 1
Diabetic retinopathy meta-GWAS for eSNPs Manhattan plot.
- https://cdn.elifesciences.org/articles/59980/elife-59980-fig4-data1-v2.xlsx
-
Figure 4—source data 2
Diabetic retinopathy meta-GWAS for eSNPs TPR plot.
- https://cdn.elifesciences.org/articles/59980/elife-59980-fig4-data2-v2.xlsx
-
Figure 4—source data 3
Diabetic retinopathy meta-GWAS for eSNPs TPR plot.
- https://cdn.elifesciences.org/articles/59980/elife-59980-fig4-data3-v2.xlsx
-
Figure 4—source data 4
Diabetic retinopathy meta-GWAS for eSNPs TPR plot.
- https://cdn.elifesciences.org/articles/59980/elife-59980-fig4-data4-v2.xlsx
-
Figure 4—source data 5
Diabetic retinopathy meta-GWAS QQ plot.
- https://cdn.elifesciences.org/articles/59980/elife-59980-fig4-data5-v2.xlsx
-
Figure 4—source data 6
Diabetic retinopathy UKBB QQ plot.
- https://cdn.elifesciences.org/articles/59980/elife-59980-fig4-data6-v2.xlsx
Figure 4—figure supplement 1
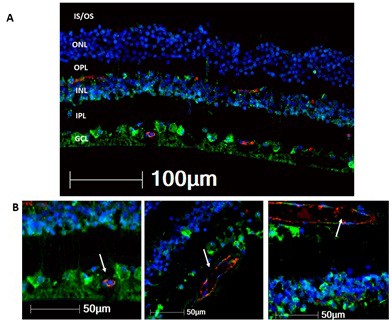
Folliculin (FLCN) expression in the human retina.
(A) FLCN (green) is evident in the ganglion cell layer (GCL), neuronal cells of the inner nuclear layer (INL), and faintly in the outer nuclear layer (ONL). (B) Colocalization of FLCN with CD31 (red), a marker of endothelial cells, confirms FLCN expression in retinal blood vessels (white arrows).
Figure 4—figure supplement 2

Folliculin (FLCN) expression response to glucose by disease status (PDR vs. nDR).
Box and whisker plot of the change in FLCN expression in lymphoblastoid cell lines between standard glucose and high glucose conditions. Pink indicates the distribution of responses for individuals with proliferative diabetic retinopathy (PDR) (log2FC = 0.08), and blue indicates the same for individuals with diabetes but no retinopathy (nDR) (log2FC = −0.19). Y-axis measures the difference in expression fold change on the log2 scale. Each individual is represented by a dot. Difference in means between PDR and nDR is 0.27, p-value 0.003. Source and code files for this plot are available in Gene Expression Omnibus (GEO) at https://www.ncbi.nlm.nih.gov/geo/ under accession code GSE146615, and Source code 13.
Figure 4—figure supplement 3
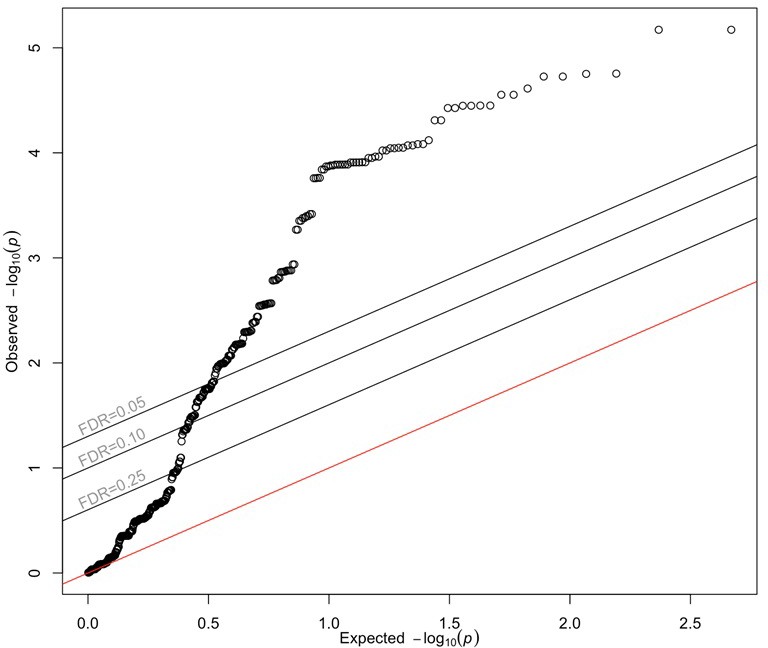
QQ plot of diabetic retinopathy meta-GWAS p-values corresponding to 272 folliculin (FLCN) eSNPs.
Points represent observed and expected GWAS-meta-analysis p-values for each of 272 FLCN eSNPs identified in the retina and more than 20 GTEx tissues. The red line represents the null hypothesis of no difference between the observed and expected p-values. Source and code files for this plot are available in Figure 4—source data 5 and Source code 14.
Figure 4—figure supplement 4
QQ plot of UKBB diabetic retinopathy GWAS p-values corresponding to 272 folliculin (FLCN) eSNPs.
Points represent observed and expected UKBB GWAS p-values for each of 272 FLCN eSNPs identified in the retina and more than 20 GTEx tissues. The red line represents the null hypothesis of no difference between the observed and expected p-values. Source and code files for this plot are available in Figure 4—source data 6 and Source code 15.
Figure 5
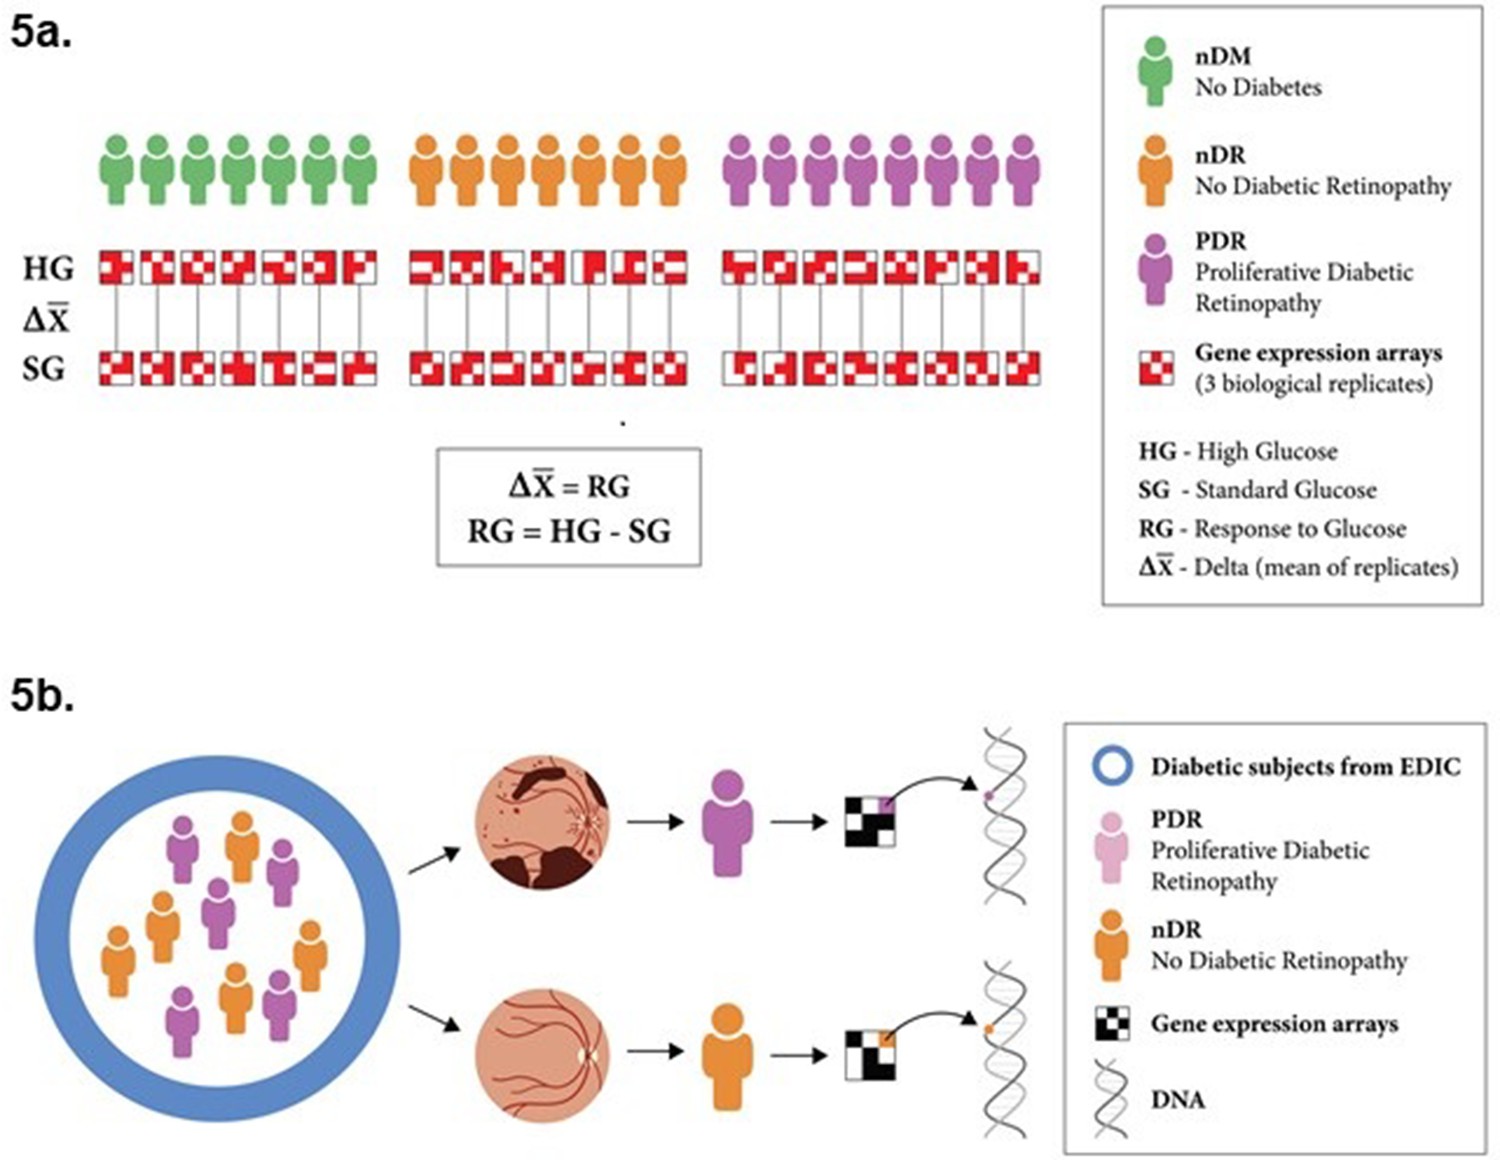
Experimental design.
(a) Schematic representation of the experimental design for transcriptomic profiling. Lymphoblastoid cell lines (LCLs) from 22 individuals were cultured under both standard glucose (SG) and high glucose (HG) conditions. Gene expression was quantified using microarrays for three biological replicates of each LCL in each condition. The response to glucose was determined for all genes on a per-individual basis, by comparing expression in SG and HG conditions. The cell lines were derived from individuals with diabetes and no retinopathy (7), individuals with diabetes and proliferative diabetic retinopathy (8), and individuals without diabetes (7). (b) We identified 15 individuals based on retinopathy status from the Epidemiology of Diabetes Interventions and Complications (EDIC) cohort. We compared the differential response in gene expression to glucose for individuals with and without proliferative retinopathy (RGpdr–ndr). Expression quantitative trait loci (eQTL) for those genes that showed the greatest differential response between individuals with and without retinopathy were tested for their genetic association with diabetic retinopathy.
Additional files
-
Source code 1
RG volcano plot.
- https://cdn.elifesciences.org/articles/59980/elife-59980-code1-v2.zip
-
Source code 2
GSEA QQ plot.
- https://cdn.elifesciences.org/articles/59980/elife-59980-code2-v2.zip
-
Source code 3
p-value distribution plot.
- https://cdn.elifesciences.org/articles/59980/elife-59980-code3-v2.zip
-
Source code 4
Intraindividual variation HG plot.
- https://cdn.elifesciences.org/articles/59980/elife-59980-code4-v2.zip
-
Source code 5
Differential transcriptional response volcano plot.
- https://cdn.elifesciences.org/articles/59980/elife-59980-code5-v2.zip
-
Source code 6
Multidimensional scaling plot.
- https://cdn.elifesciences.org/articles/59980/elife-59980-code6-v2.zip
-
Source code 7
Association of glucose differential response genes QQ plot.
- https://cdn.elifesciences.org/articles/59980/elife-59980-code7-v2.zip
-
Source code 8
Association of glucose differential response genes Bar plot.
- https://cdn.elifesciences.org/articles/59980/elife-59980-code8-v2.zip
-
Source code 9
Enrichment of eGenes plot.
- https://cdn.elifesciences.org/articles/59980/elife-59980-code9-v2.zip
-
Source code 10
eGenes Histogram.
- https://cdn.elifesciences.org/articles/59980/elife-59980-code10-v2.zip
-
Source code 11
Diabetic retinopathy meta-GWAS for eSNPs Manhattan plot.
- https://cdn.elifesciences.org/articles/59980/elife-59980-code11-v2.zip
-
Source code 12
Diabetic retinopathy meta-GWAS for eSNPs TPR plot.
- https://cdn.elifesciences.org/articles/59980/elife-59980-code12-v2.zip
-
Source code 13
FLCN expression response to glucose by disease status box and whisker plot.
- https://cdn.elifesciences.org/articles/59980/elife-59980-code13-v2.zip
-
Source code 14
Diabetic retinopathy meta-GWAS QQ plot.
- https://cdn.elifesciences.org/articles/59980/elife-59980-code14-v2.zip
-
Source code 15
Diabetic retinopathy UKBB QQ plot.
- https://cdn.elifesciences.org/articles/59980/elife-59980-code15-v2.zip
-
Source data 1
Differential response to Glucose PDR vs nDR.
- https://cdn.elifesciences.org/articles/59980/elife-59980-data1-v2.csv
-
Supplementary file 1
Supplementary file 1a.
Demographic features of the DCCT/EDIC study subjects with type 1 diabetes. Source files can be found at Epidemiology of Diabetes Interventions and Complications (EDIC). Design, implementation, and preliminary results of a long-term follow-up of the Diabetes Control and Complications Trial cohort. Diabetes Care. 1999 Jan;22(1):99–111. pmid:10333910. Pubmed Central PMCID: 2745938. Epub 1999/05/20. eng. Supplementary file 1b. Differential response to Glucose PDR vs. nDR (RGpdr–ndr). Source file for this table is available at Source data 1. Supplementary file 1c. Demographic features of UK Biobank subjects with diabetes used in the diabetic retinopathy GWAS. Source file for this table is available at https://www.ukbiobank.ac.uk/. Supplementary file 1d. Demographic features of individuals without diabetes from the Coriell Institute for Medical Research NIGMS Human Genetic Cell Repository. Source file for this table is available at Coriell Institute for Medical Research NIGMS Human Genetic Cell Repository (http://ccr.coriell.org/).
- https://cdn.elifesciences.org/articles/59980/elife-59980-supp1-v2.docx
-
Transparent reporting form
- https://cdn.elifesciences.org/articles/59980/elife-59980-transrepform-v2.docx
Download links
A two-part list of links to download the article, or parts of the article, in various formats.
Downloads (link to download the article as PDF)
Open citations (links to open the citations from this article in various online reference manager services)
Cite this article (links to download the citations from this article in formats compatible with various reference manager tools)
Integration of genomics and transcriptomics predicts diabetic retinopathy susceptibility genes
eLife 9:e59980.
https://doi.org/10.7554/eLife.59980


