Cytotoxic T-cells mediate exercise-induced reductions in tumor growth
- Department of Cell and Molecular Biology, Karolinska Institutet, Sweden
- Department of Laboratory Medicine, Karolinska Institutet, Sweden
- Department of Surgery, Oncology, and Gastroenterology, University of Padova, Italy
- The Francis Crick Institute, United Kingdom
- Department of Physiology, Development, and Neuroscience, University of Cambridge, United Kingdom
- Department of Physiology and Pharmacology, Karolinska Institutet, Sweden
- Department of Oncology-Pathology, Karolinska Institutet, Sweden
Figures
Figure 1 with 1 supplement
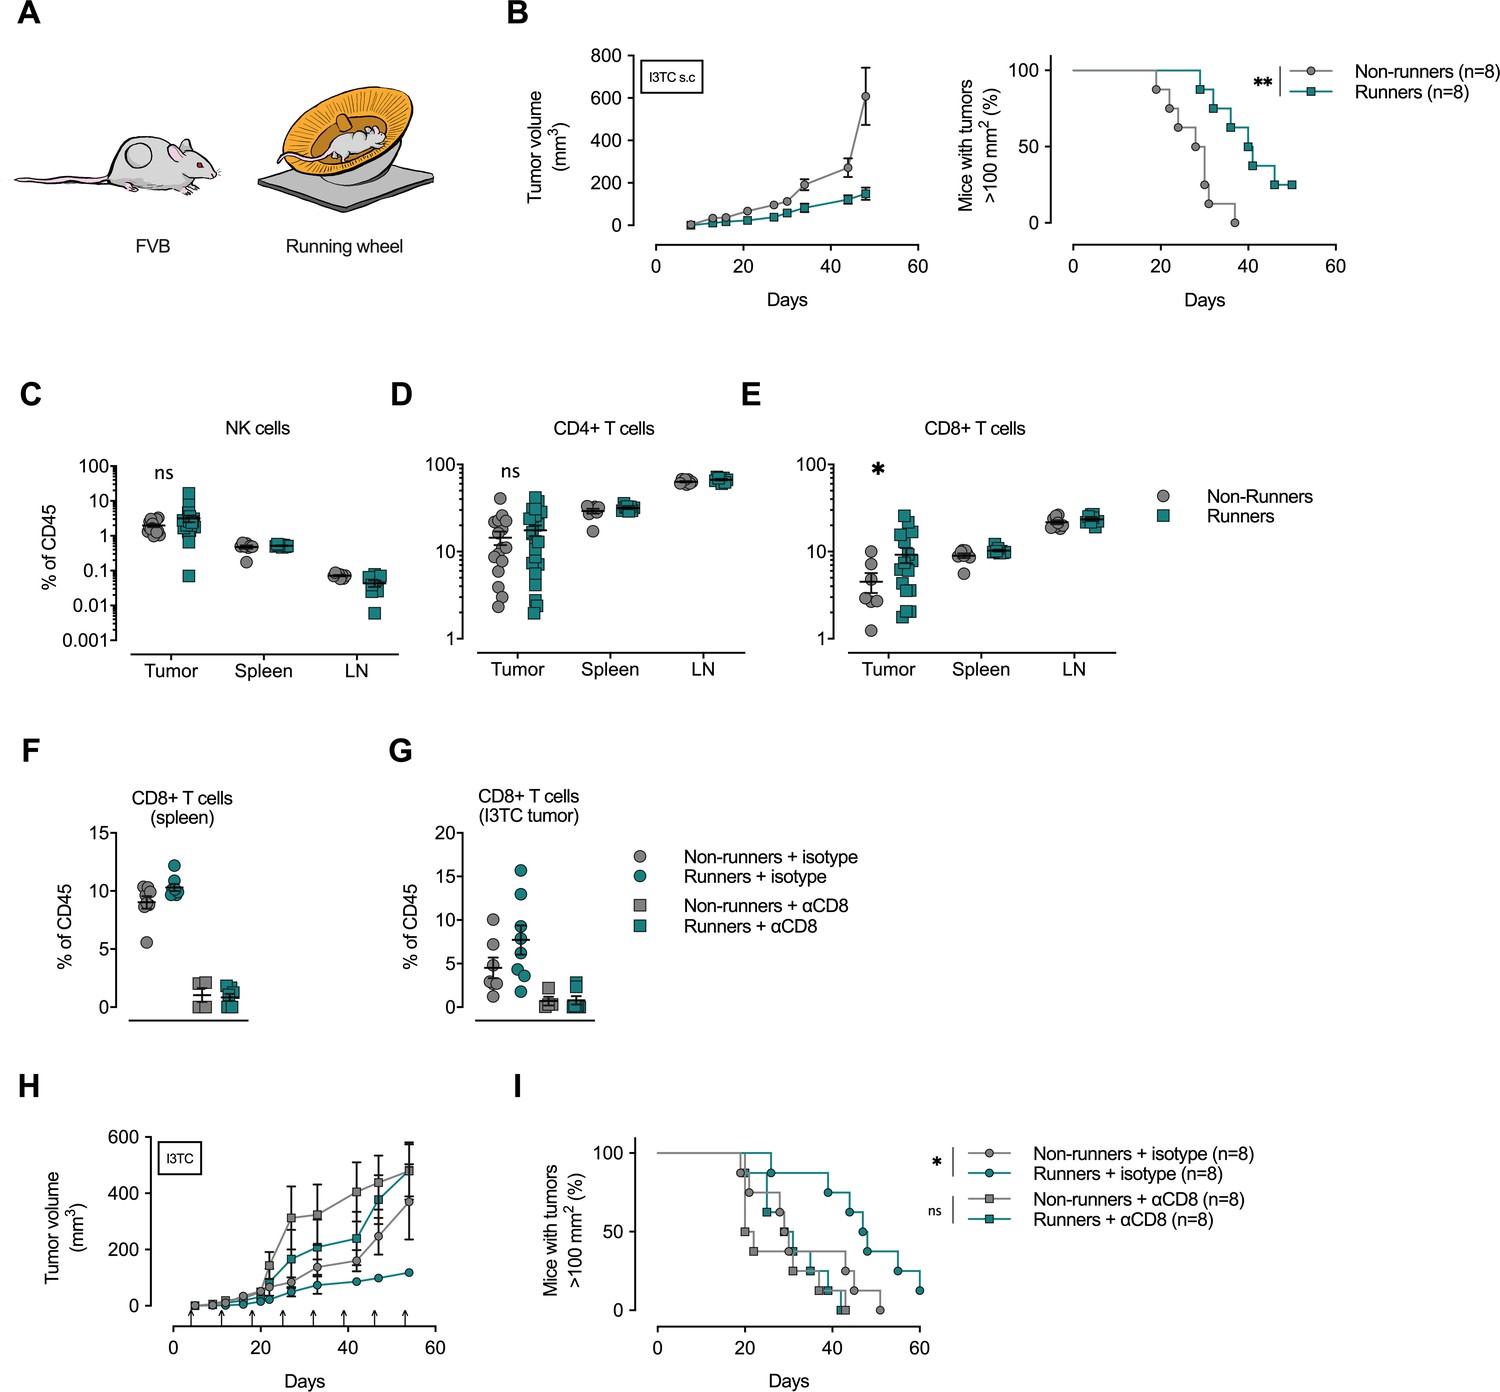
Depletion of CD8+ T-cells abolishes the anti-cancer effects of exercise training.
(A) FVB mice were allowed to exercise voluntarily (in running wheels, runners) or left non-exercised (locked running wheels, non-runners) before and after being inoculated subcutaneously with 5 × 10⁵ tumor cells of the breast cancer cell line I3TC. (B) Mean tumor volume and SEM over time (left) and survival (right). **p<0.01, *p<0.05, Log-rank (Mantel-Cox) survival test. (C–E) Flow cytometry determined frequency of lymphocytic populations within I3TC tumor, spleen and lymph nodes (LN) at day 55 after inoculation. *p<0.05 column factor combining all organs in a two-way ANOVA. ns = not significant. (F–G) Flow cytometry determined frequency of lymphocytic populations within spleen and I3TC tumors after CD8+ depletion and isotype control. (H–I) Same experimental setting as in (A) with (αCD8) or without (isotype ctrl) weekly antibody-mediated depletion of CD8+ T cells (arrows). Graphs show mean tumor volume and SEM over time (F) and survival (G). *p<0.05, Log-rank (Mantel-Cox) survival test.
Figure 1—figure supplement 1

Exercise trained MMTV-PyMT breast cancer mice show enhanced infiltration of GranzymeB+ cells.
(A) Wild type (WT) and MMTV-PyMT (PyMT) mice on the FVB background were allowed to exercise voluntarily (in running wheels, runners) or left non-exercised (locked running wheels, non-runners) between 4 and 12 weeks of age. (B) Running distance (km/day) in WT and PyMT mice. *p<0.05, two-tailed unpaired t test. (C) Tumor volume measured twice weekly for PyMT running and non-running mice. Mean and SEM (n = 10–11). (D) Survival of PyMT mice, runners, and non-runners. Survival curve ns = not significant, Log-rank (Mantel-Cox) test, (n = 10–11). (E) Tumor initiation as age (day) of first indication of a palpable tumor in running (Runners) and non-running (Non-runners) PyMT mice. n = 11, ns = not significant, two-tailed t test. (F) Tumor stage from histological scoring (1-4) in mammary glands of running and non-running PyMT mice at 12 (n = 6–10) and 8 (n = 4) weeks of age, ns = not significant, two-tailed t test. (G) Individual body weight for WT and PyMT running and non-running mice. n = 7–10, ns = not significant, one-way ANOVA with Tukey’s multiple comparison test. (H) Immunohistological characterization of PyMT tumors from non-running and running mice using CD3, F4/80, PCNA, Podocalyxin (PODXL), and Granzyme B (GZMB) antibodies, respectively. n = 8–15, ns = not significant, *p<0.05, Two-tailed unpaired t test. (I) Flow-cytometry-based frequency of macrophages within I3TC tumor. Ns = not significant, two-tailed t-test. (J) Flow-cytometry-based frequency of neutrofiles within I3TC tumor. Ns = not significant, two-tailed t-test.
Figure 2 with 2 supplements
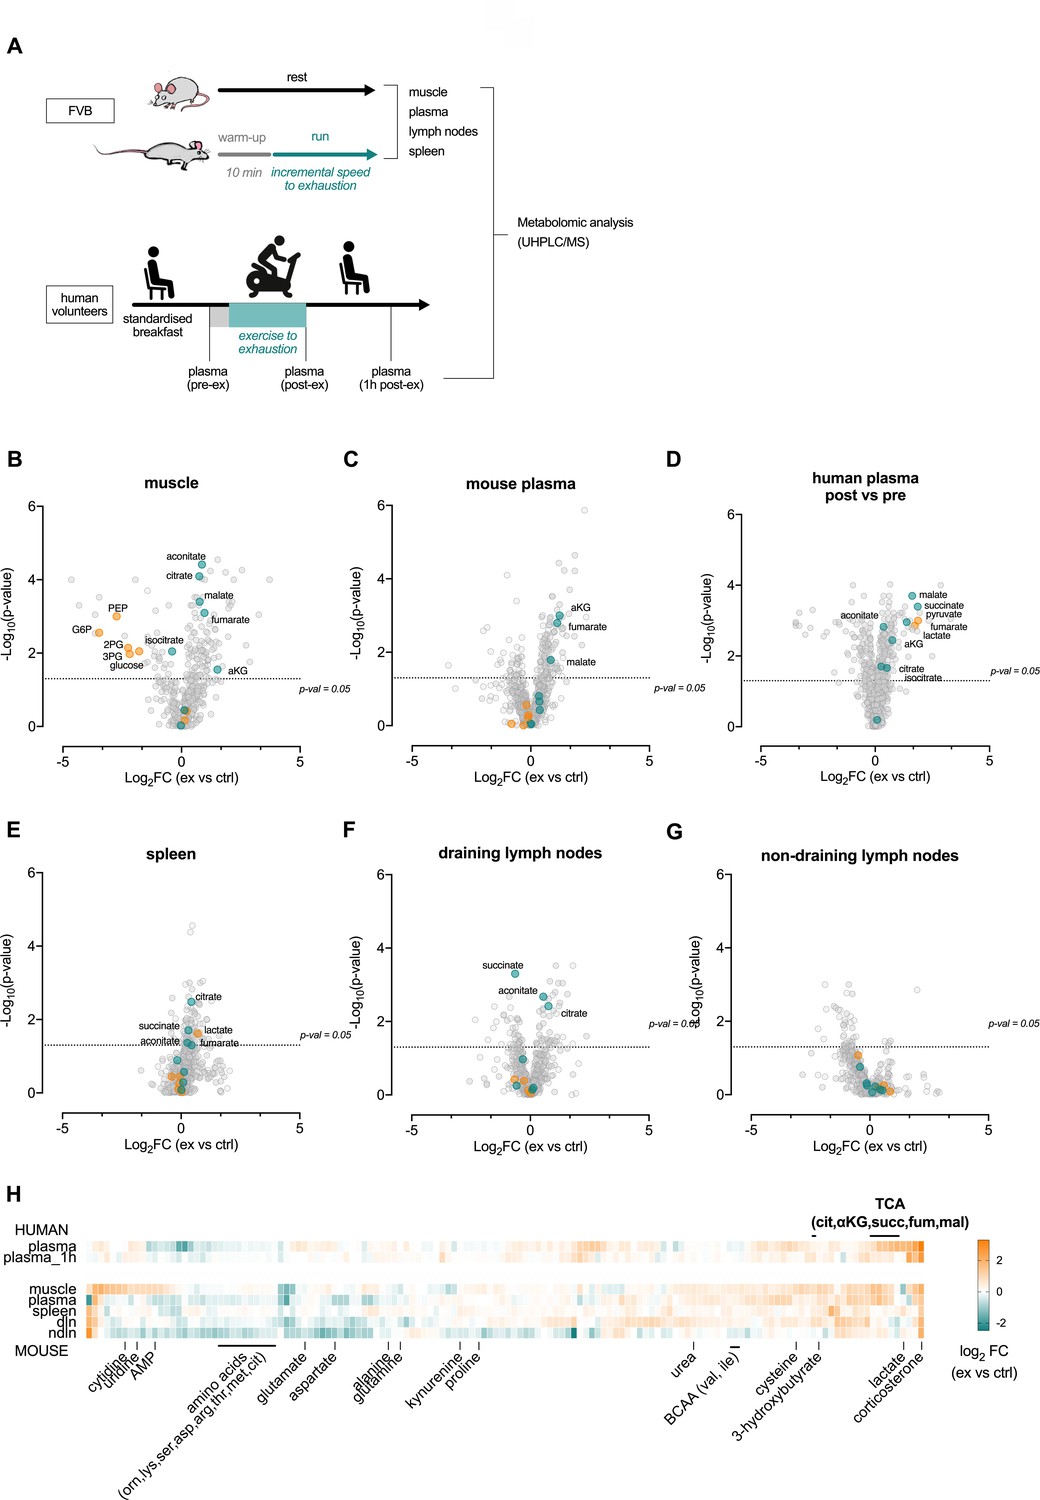
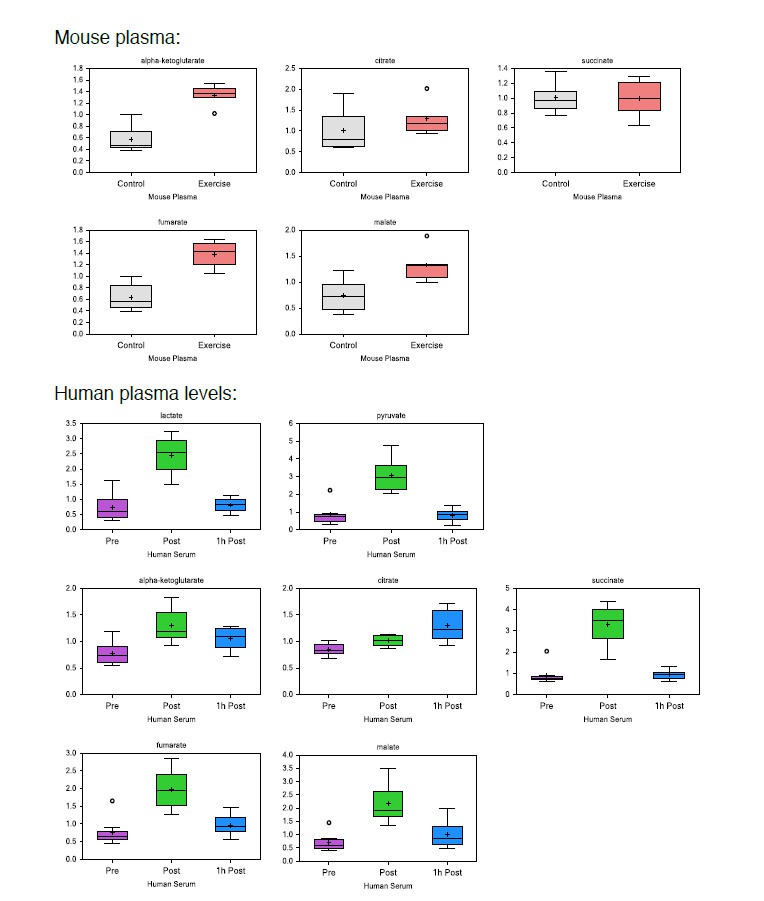
Acute exertion alters the metabolic profile of plasma and lymphoid organs.
(A) FVB mice performed a single exhaustive treadmill exercise. Muscle, plasma, spleen, muscle draining, and non-draining lymph nodes were collected from exercising and control mice immediately after the exercise. Human subjects performed 30 min of endurance exercise at 75% of Wpeak and plasma samples were collected before (pre) and after (post) exercise. Samples were analyzed on the Precision Metabolomics mass spectrometry platform. Data is provided as Figure 2—source data 1. (B–G) Volcano plots of differentially induced metabolites per mouse tissue and human plasma. p-Values from the Student’s T-test and the log2FC (n = 6 and n = 8 for mouse and human samples respectively). TCA metabolites are colored blue. Glycolytic metabolites are colored orange. The dashed horizontal line is drawn at Y = -log10(0.05). (H) Heatmap of exercise-induced changes in metabolite concentrations in human and mouse plasma and tissues. Metabolites with a significant change (adjusted p<0.05) in at least one tissue following exercise were included and clustered using hierarchical clustering.
-
Figure 2—source data 1
Multiple organ metabolomics source data file.
- https://cdn.elifesciences.org/articles/59996/elife-59996-fig2-data1-v1.xlsx
Figure 2—figure supplement 1
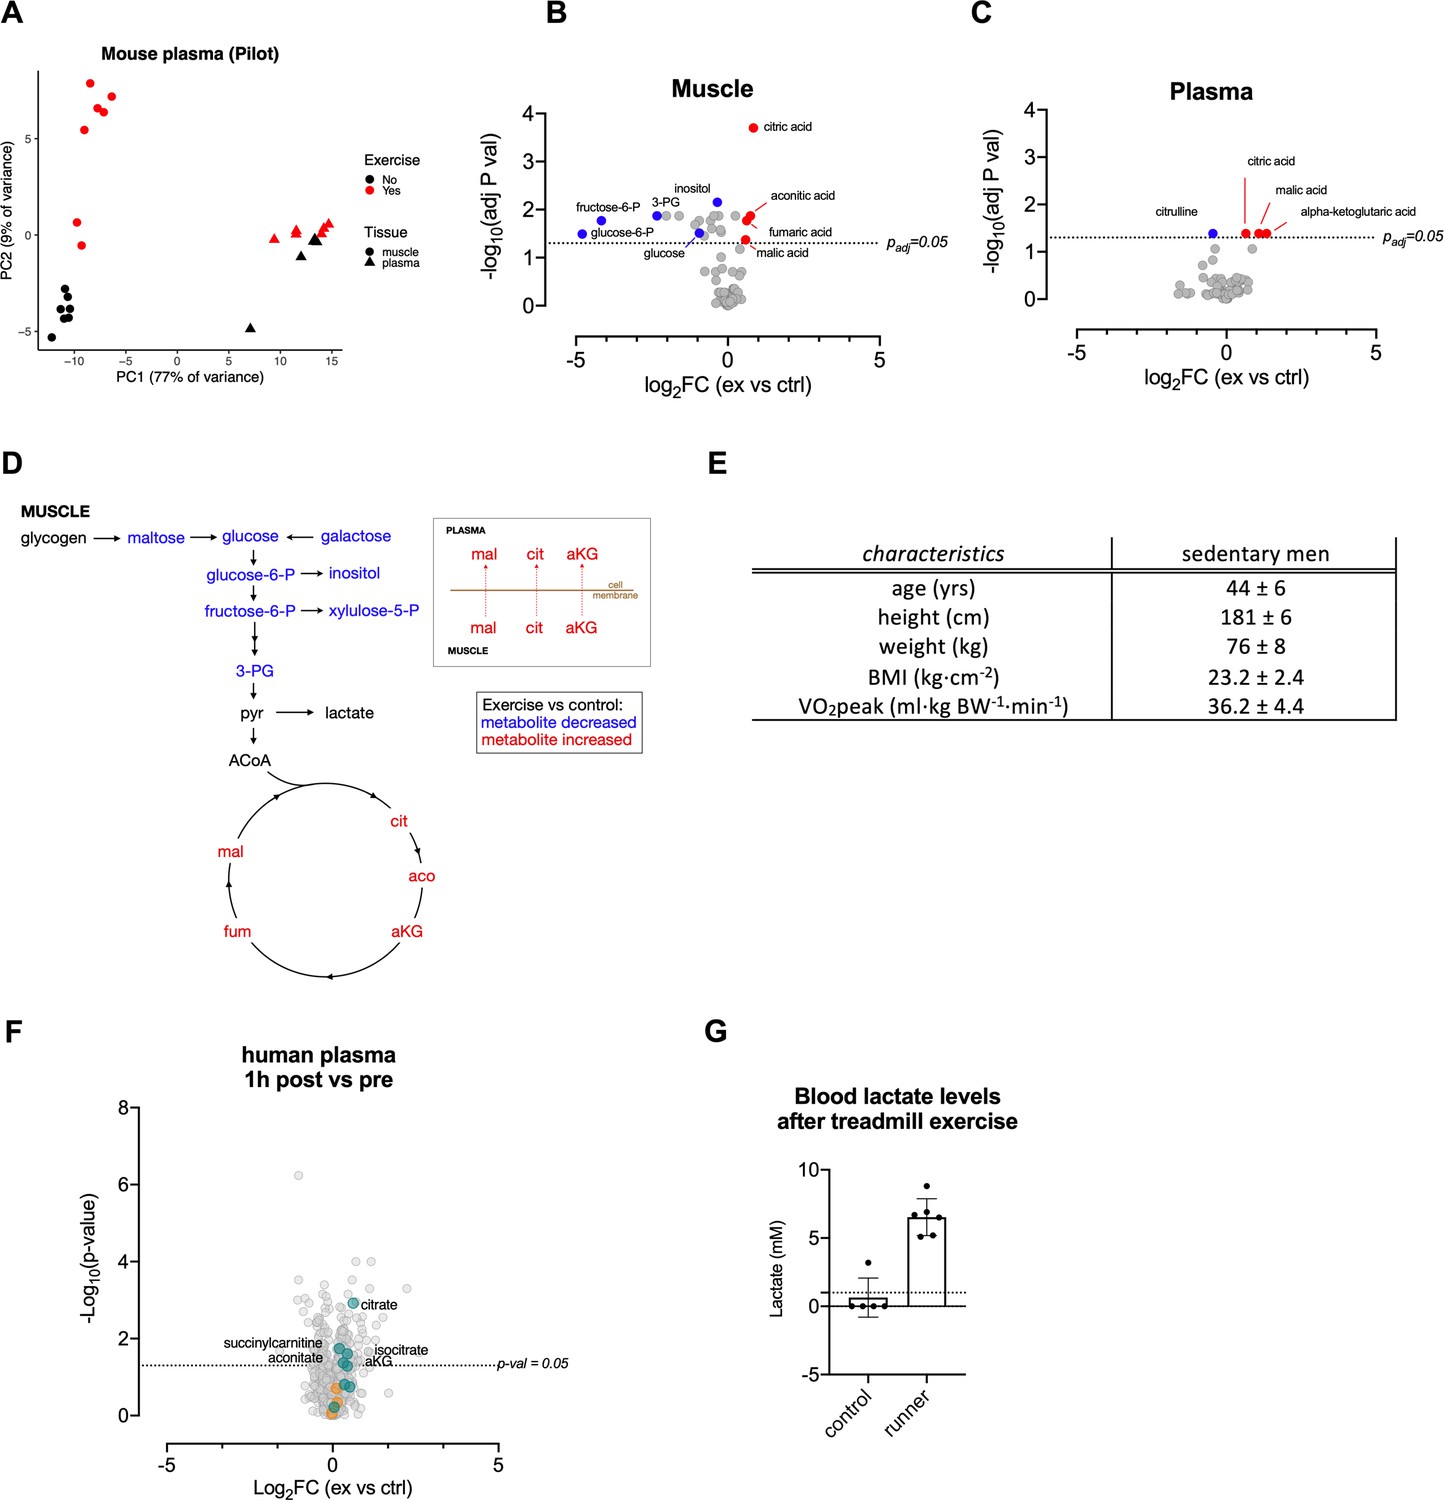
Acute exertion Increases the levels of TCA metabolites in muscle and plasma.
(A) Metabolic assessment (GC-MS) of muscle and plasma from FVB mice after a sprint exercise (n = 7), PCA plot. (B–C) Volcano plots of differentially induced metabolites in muscle and plasma from FVB mice after a sprint exercise (n = 7) measured by GC-MS. The adjusted p-values from the Student’s T-test with False Discovery Rate multiple comparison correction and the log2FC were used to generate these volcano plots. Selected metabolites (adjusted p-value<0.05) are colored blue (log2FC < 0) and red (log2FC > 0). (D) Acute exercise cause intramuscular reductions in glycolytic metabolites and an accumulation of TCA metabolites. TCA metabolites can also be found in plasma post-exercise. (E) Human subject characteristic (n = 8). Mean + / - SD. (F) Human subjects performed 30 min of endurance exercise at 75% of Wpeak, comparison of plasma samples collected before (pre-exercise) and 1 hr (1 hr post-exercise) after the exercise. (G) Murine lactate levels in tail vein blood after exhaustive treadmill exercise (n = 6 and 5, respectively).
Figure 2—figure supplement 2
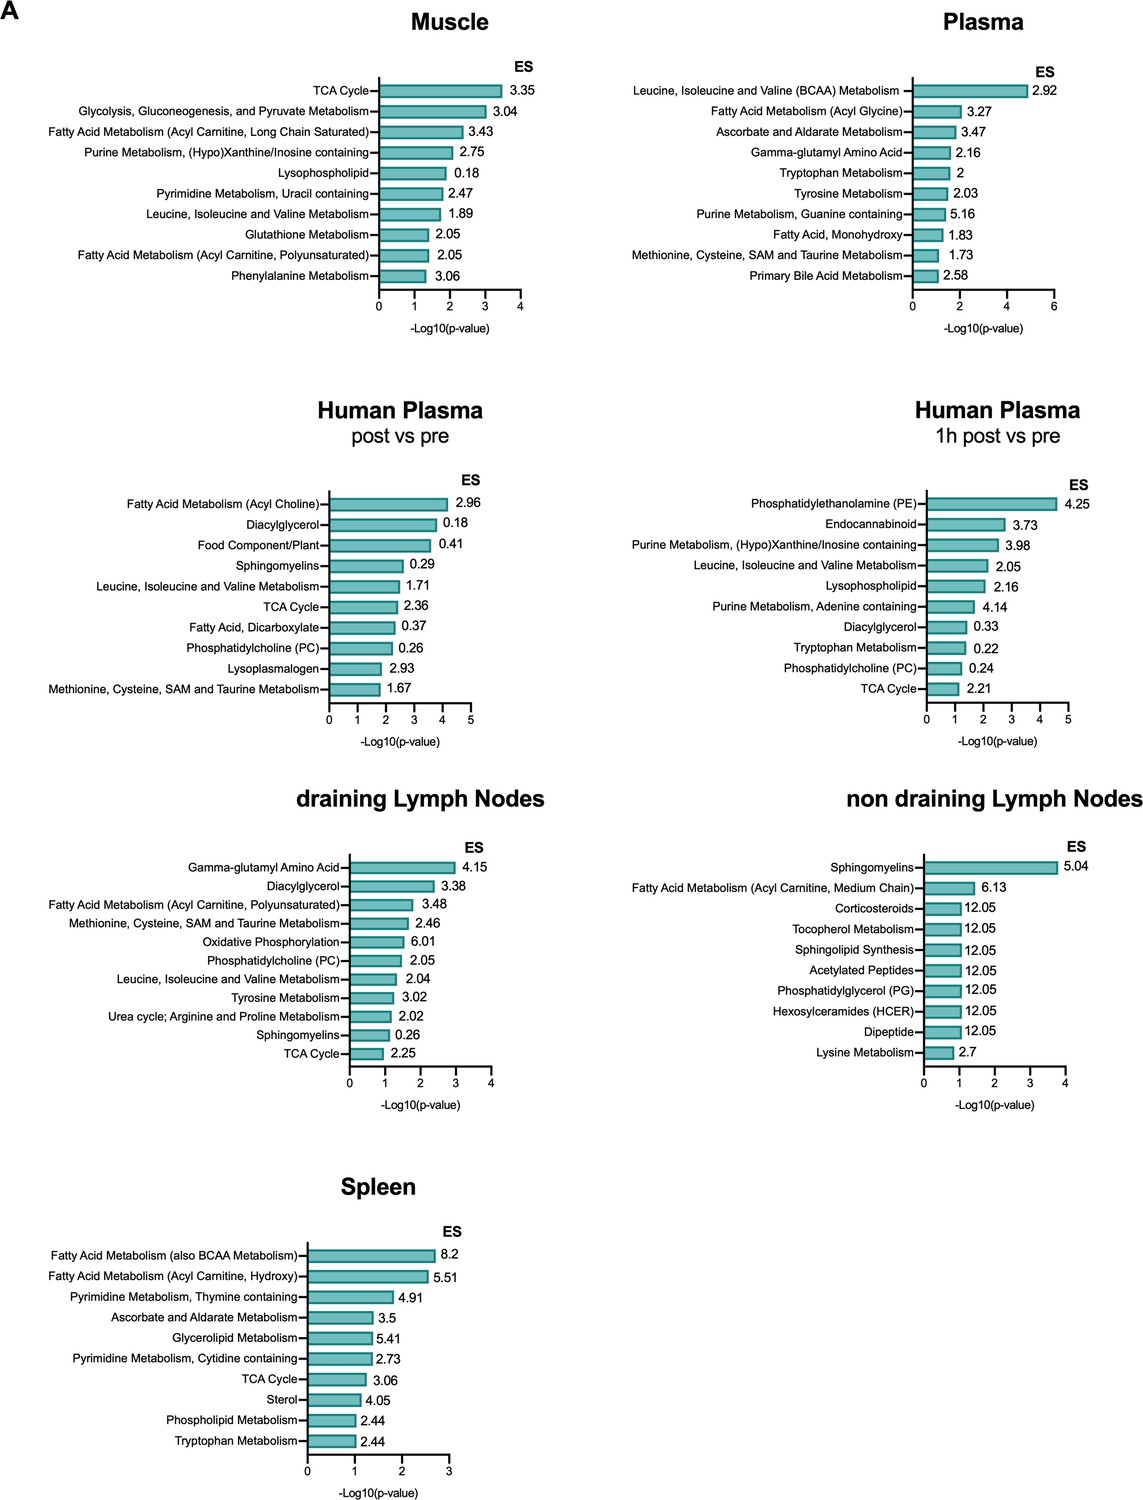
Pathway analysis of post-exercise metabolic profiling.
(A) Pathway analysis of differentially available metabolites in exercising animals for muscle, spleen, plasma, muscle draining (dLN) and non-draining lymph nodes (ndLN) and for human plasma. The enrichment score (ES) was calculated using the ES = (k/m)/[(n–k)/(N–m)] where n is the total number of significant metabolites; m is the total number of metabolites detected in a specific pathway (count); N is the total number of metabolites detected and k is the number of significant metabolites in a specific pathway. Graph showing top 10 metabolites based on the -log10(p-value).
Figure 3 with 1 supplement
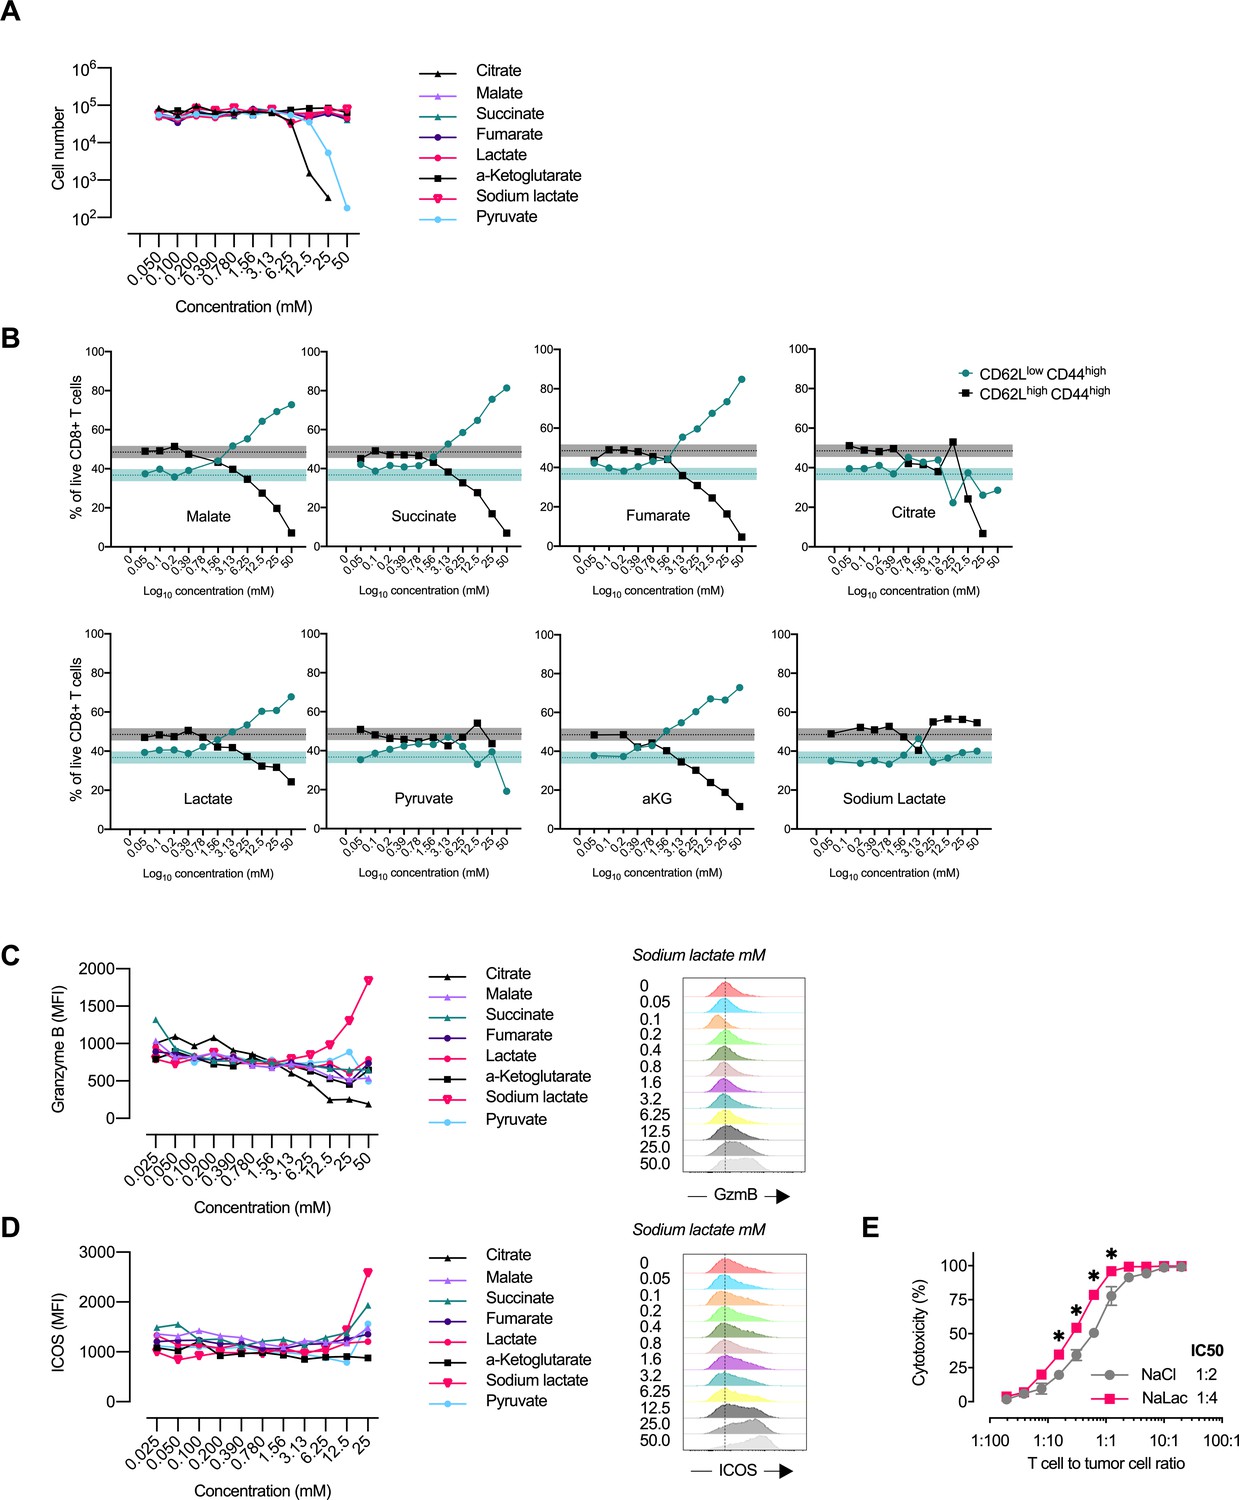
Central carbon metabolites alter the CD8+ T cell effector profile.
(A) Proliferation of activated murine CD8+ T cells in response to increasing concentrations of central carbon metabolites. The proliferation of activated murine CD8+ T cells was assessed by using CountBright counting beads on flow cytometry at day 3 of culture. (B) Flow-cytometry-based CD62L and CD44 expression of live CD8+ T cells expressed as frequency of cells at day 3 of culture with increasing concentrations of central carbon metabolites. Shaded areas represent mean and 95% confidence intervals at 0 mM. (C) Granzyme B median fluorescence intensity (MFI) at day 3 of culture with increasing concentrations of central carbon metabolites. Data from one representative experiment on CD8+ T cells purified and activated from pooled spleens of multiple mice. (D) ICOS median fluorescence intensity (MFI) at day 3 of culture with increasing concentrations of central carbon metabolites. Data from one representative experiment on CD8+ T cells purified and activated from pooled spleens of multiple mice. (E) Cytotoxicity against EL4-OVA tumor cells by OVA-specific OT-I CD8+ T cells activated for 3 days in the presence of 40 mM NaCl or NaLac. Graph represents specific cytotoxicity of n = 3 independent mouse donors at varying effector-to-target ratios. *p<0.01 repeated-measures two-way ANOVA with Sidak’s multiple comparison test.
Figure 3—figure supplement 1

Profiling of CD8+ T cell responses to central carbon metabolites.
(A) Reference values of central carbon metabolite availability in resting, human adult individuals. (B) Proliferation of activated murine CD8+ T cells was assessed with a resazurin assay after 3 days of cell culture. The response is expressed as fold change over the control (0 mM concentration). Error bars represents the standard error of the mean (SEM). CD8+ T cells purified and activated from pooled spleens of multiple mice in four separate experiments (n = 4). (C) Proliferation of activated murine CD8+ T cells in response to increasing concentrations of central carbon metabolites and sodium chloride control. The proliferation of activated murine CD8+ T cells was assessed by using CountBright counting beads on flow cytometry at day 3 of culture. CD8+ T cells purified and activated from four individual mice (n = 4). (D) Flow-cytometry-based CD62L and CD44 expression of live CD8+ T cells expressed as frequency of cells at day 3 of culture with increasing concentrations of central carbon metabolites. CD8+ T cells purified and activated from four individual mice (n = 4). (E) Granzyme B median fluorescence intensity (MFI) at day 3 of culture with increasing concentrations of central carbon metabolites. CD8+ T cells purified and activated from four individual mice (n = 4). Two-way ANOVA comparing sodium L-lactate and sodium chloride. *p<0.05, **p<0.01. (F) ICOS median fluorescence intensity (MFI) at day 3 of culture with increasing concentrations of central carbon metabolites. CD8+ T cells purified and activated from four individual mice (n = 4). (G) CTLA4 median fluorescence intensity (MFI) at day 3 of culture with increasing concentrations of central carbon metabolites. CD8+ T cells purified and activated from four individual mice (n = 4).
Figure 4 with 2 supplements
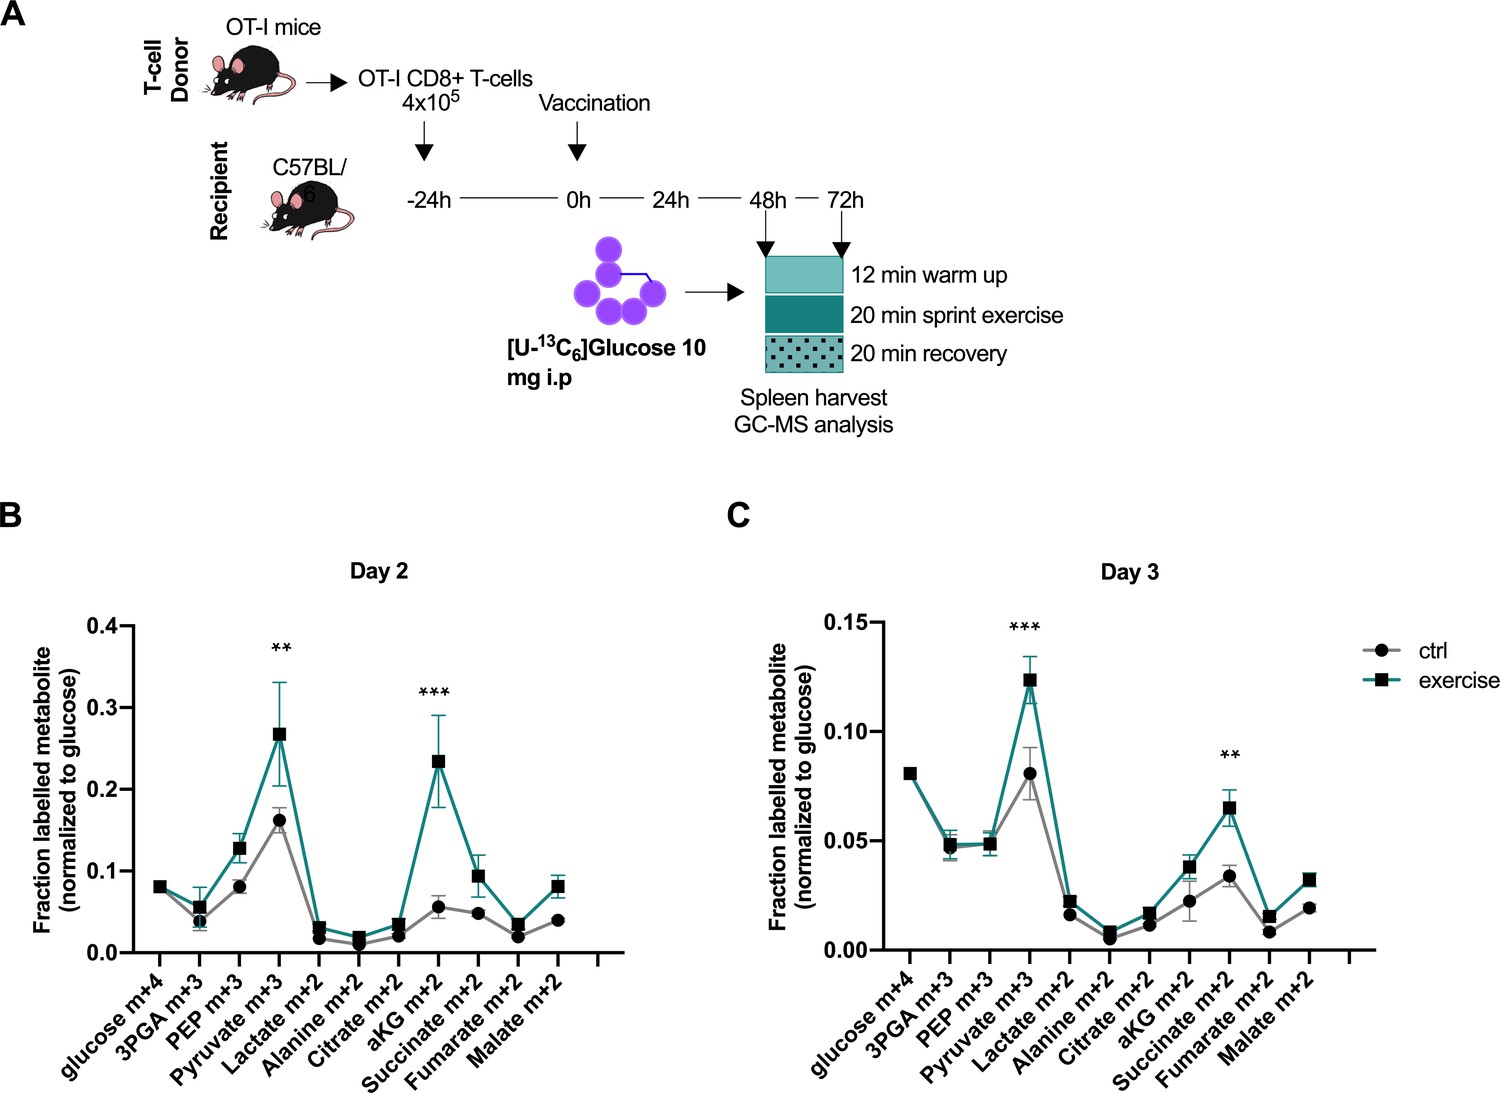
Acute exercise alters CD8+ T cell metabolism in vivo.
(A) Recipient mice received OT-I CD8+ T-cells followed by vaccination. On day 2 and 3 after vaccination, 10 mg of [U-13C6]glucose was introduced to the mice prior to a treadmill exercise. CD8+ T-cells were harvested from the spleen and incorporation of labeled carbons in cellular metabolites was assessed by GC-MS. Data is provided as Figure 4—source data 1. (B) Fraction of labeled metabolites in CD8+ T-cells 48 hr after vaccination. (C) Fraction of labeled metabolites in CD8+ T-cells 72 hr after vaccination. **p<0.01 and ***p<0.001 using a two-way ANOVA with Sidak’s multiple comparison test.
-
Figure 4—source data 1
Glucose derived carbon distribution in CD8+ T cells source data file.
- https://cdn.elifesciences.org/articles/59996/elife-59996-fig4-data1-v1.xlsx
Figure 4—figure supplement 1
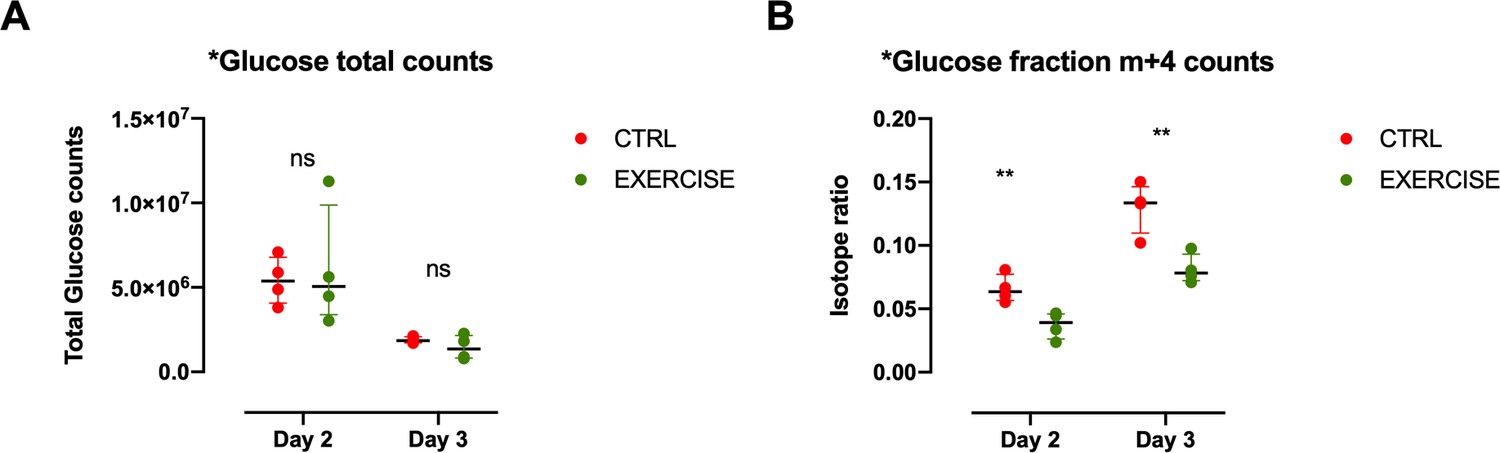
Glucose levels in CD8+ T cells of exercising mice.
(A) Recipient mice received OT-I CD8+ T-cells followed by vaccination. On day 2 and 3 after vaccination, 10 mg of [U-13C6]glucose was introduced to the mice prior to a treadmill exercise. CD8+ T-cells were harvested from the spleen and incorporation of labeled carbons in cellular metabolites was assessed by GC-MS (n = 4). Metabolic diagram showing total glucose fraction in in exercising (EXERCISE) and non-exercising (CTRL) animals at 48 and 72 hr after vaccination. Two-tailed t-test *p<0.05, **p<0.01. (B) Metabolic diagram showing labeled glucose fraction in in exercising (EXERCISE) and non-exercising (CTRL) animals at 48 and 72 hr after vaccination. Two-tailed t-test *p<0.05, **p<0.01,.
Figure 4—figure supplement 2
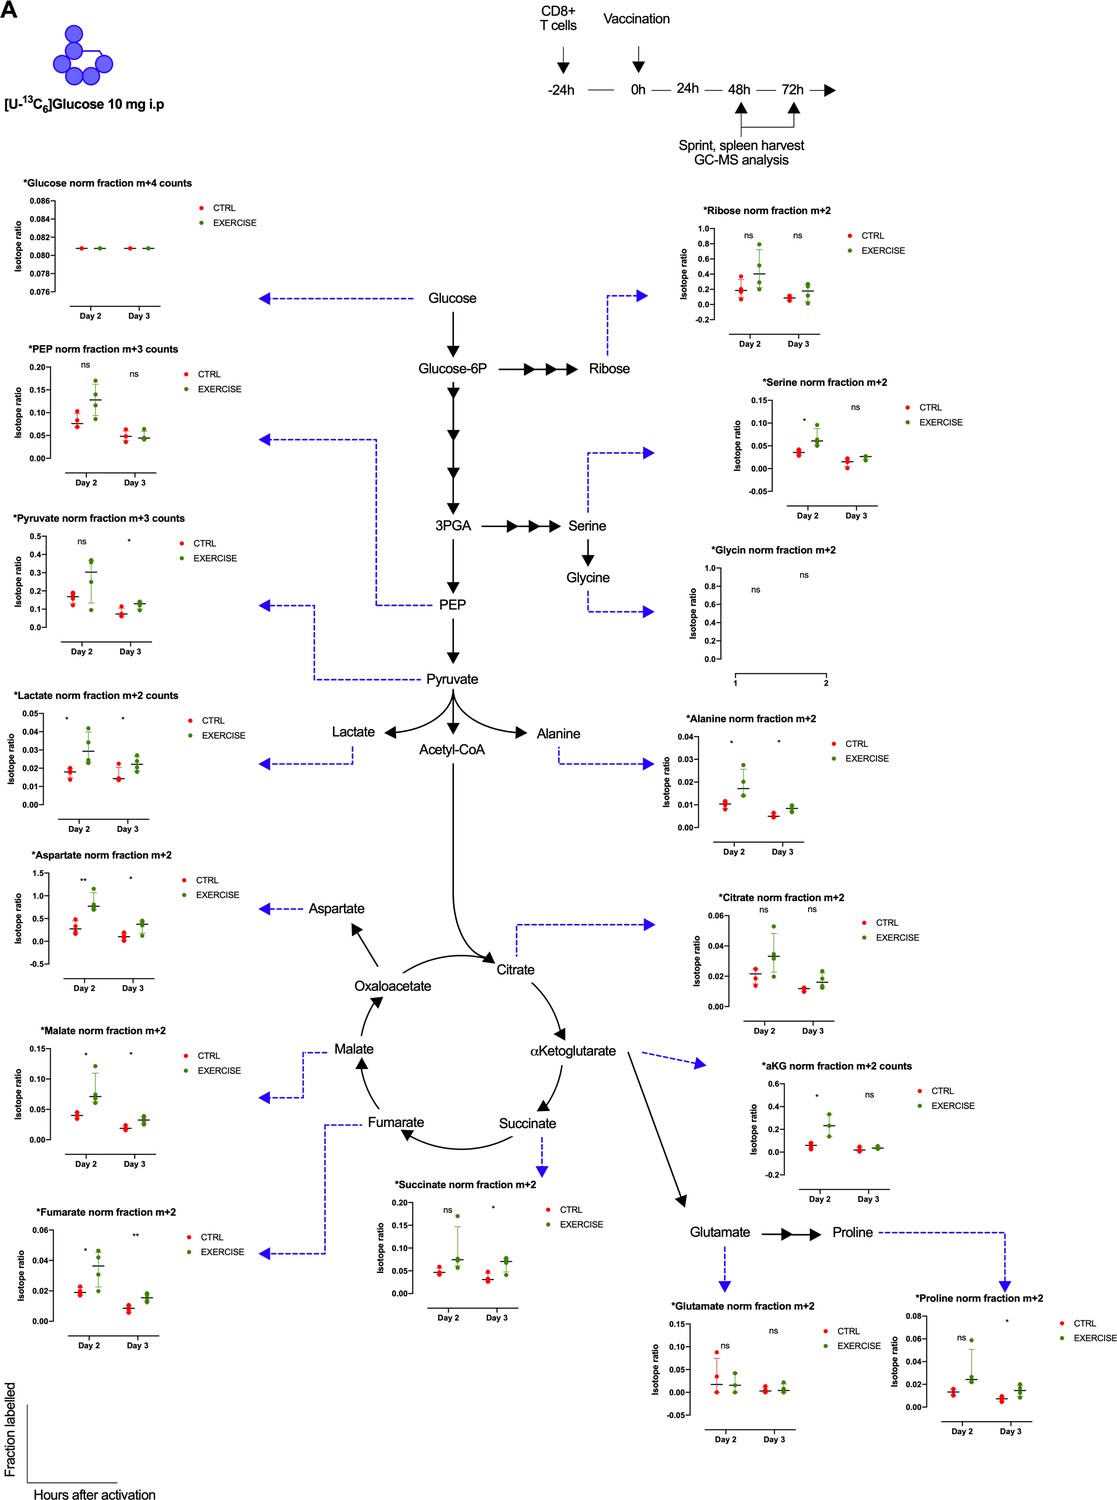
Exercise effects on glucose derived carbon distribution in CD8+ T cells.
(A) Metabolic diagram showing glucose-derived carbon incorporation normalized to labeled glucose in exercising (EXERCISE) and non-exercising (CTRL) animals at 48 and 72 hr after vaccination. Two-tailed t-test *p<0.05, **p<0.01.
Figure 5 with 1 supplement
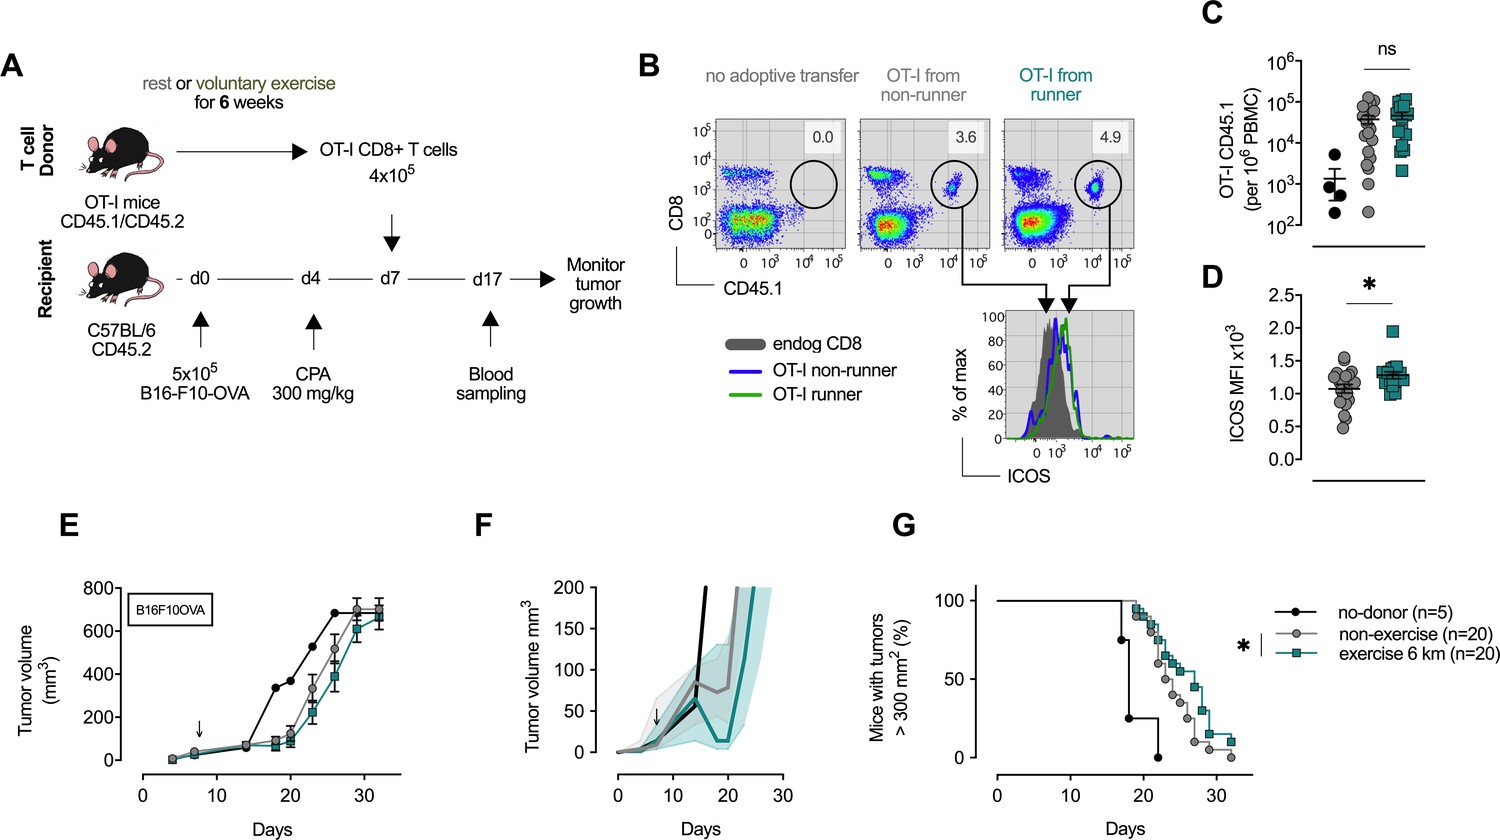
CD8+ T cells transferred from trained mice show enhanced anti-tumoral capacity.
(A) OT-I mice carrying the congenic marker CD45.1 were given access to a locked or moving running wheel for 6 weeks. In parallel, C57Bl/6 (CD45.2) animals were inoculated with 5 × 10⁵ ovalbumin (OVA)-expressing B16-F10 (B16-F10-OVA) melanoma and conditioned with 300 mg/kg cyclophosphamide (CPA). 4 × 10⁵ OVA-reactive OT-I CD8+ T cells were isolated from running or non-running mice and adoptively transferred into tumor-bearing animals. Peripheral blood was sampled 10 days after adoptive transfer and tumor volume monitored. (B) Flow cytometry analysis of OT-I T cell expansion in peripheral blood 10 days after adoptive transfer. Adoptive cells were distinguished from endogenous immune cells by expression of the CD45.1 congenic marker. Histogram shows ICOS surface expression on adoptive and endogenous CD8+ T cells. (C) Frequency of adoptive OT-I T cells in peripheral blood. *p<0.05, two-tailed t-test. ns = not significant. (D) Median fluorescence intensity (MFI) of ICOS (bottom) of adoptive OT-I T cells in peripheral blood. *p<0.05, two-tailed t-test. ns = not significant. (E–G) Mean tumor volume and SEM (E), median IQR (F) and survival (G) over time. ↓ depicts time of OT-I T cell injection *p<0.05, Log-rank (Mantel-Cox) survival test.
Figure 5—figure supplement 1
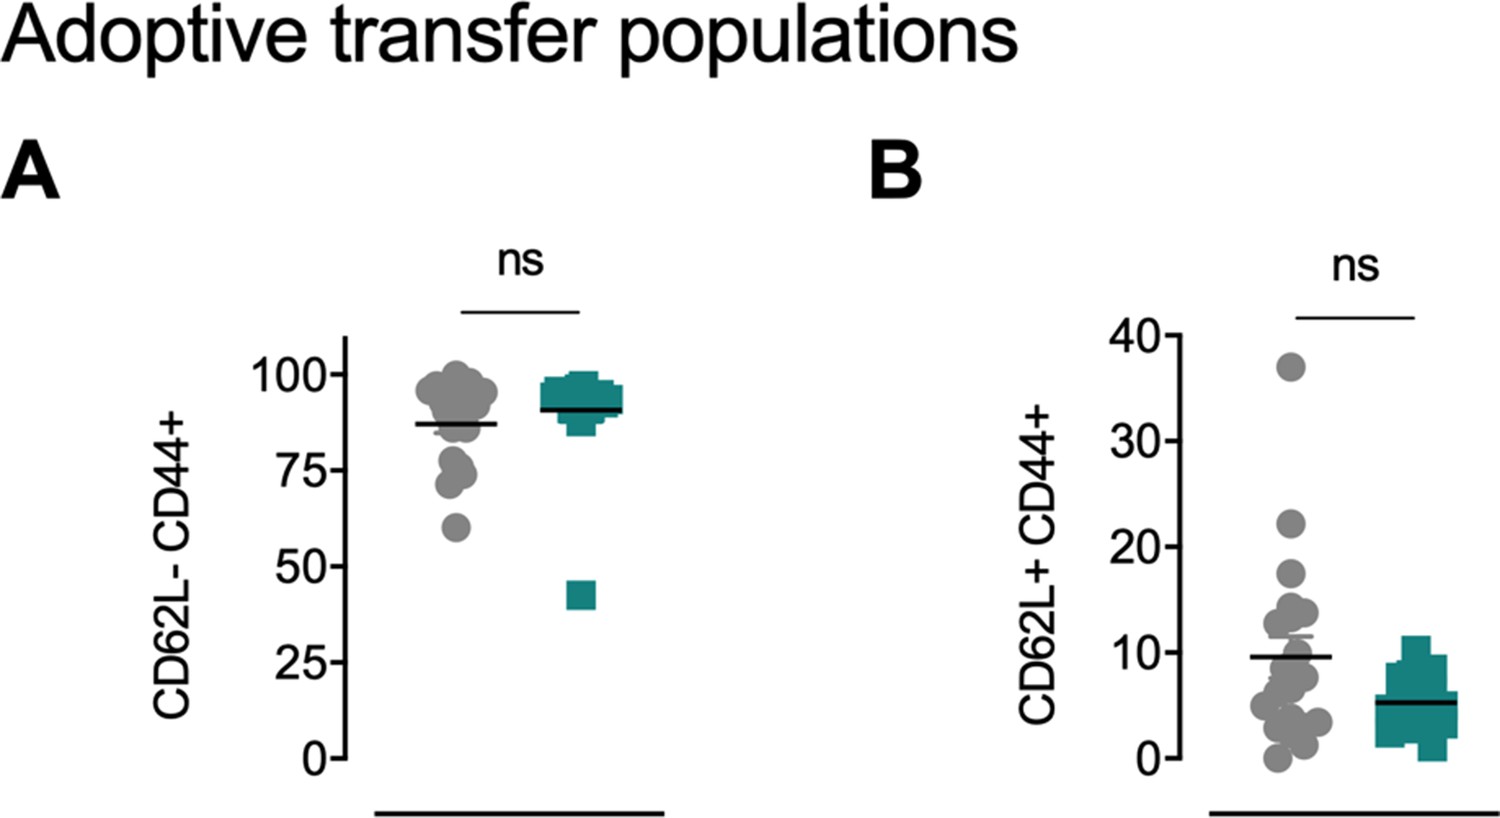
OT-I mice carrying the congenic marker CD45.1 were given access to a locked or moving running wheel for 6 weeks.
In parallel, C57Bl/6 (CD45.2) animals were inoculated with 5 × 10⁵ ovalbumin (OVA)-expressing B16-F10 (B16-F10-OVA) melanoma and conditioned with 300 mg/kg cyclophosphamide (CPA). 4 × 10⁵ OVA-reactive OT-I CD8+ T cells were isolated from running or non-running mice and adoptively transferred into tumor-bearing animals. Peripheral blood was sampled 10 days after adoptive transfer. (A) Flow cytometry based frequency of CD62LlowCD44high cells in peripheral blood. ns = not significant. (B) Flow-cytometry-based frequency of CD62LhighCD44high cells in peripheral blood. ns = not significant.
Figure 6 with 1 supplement
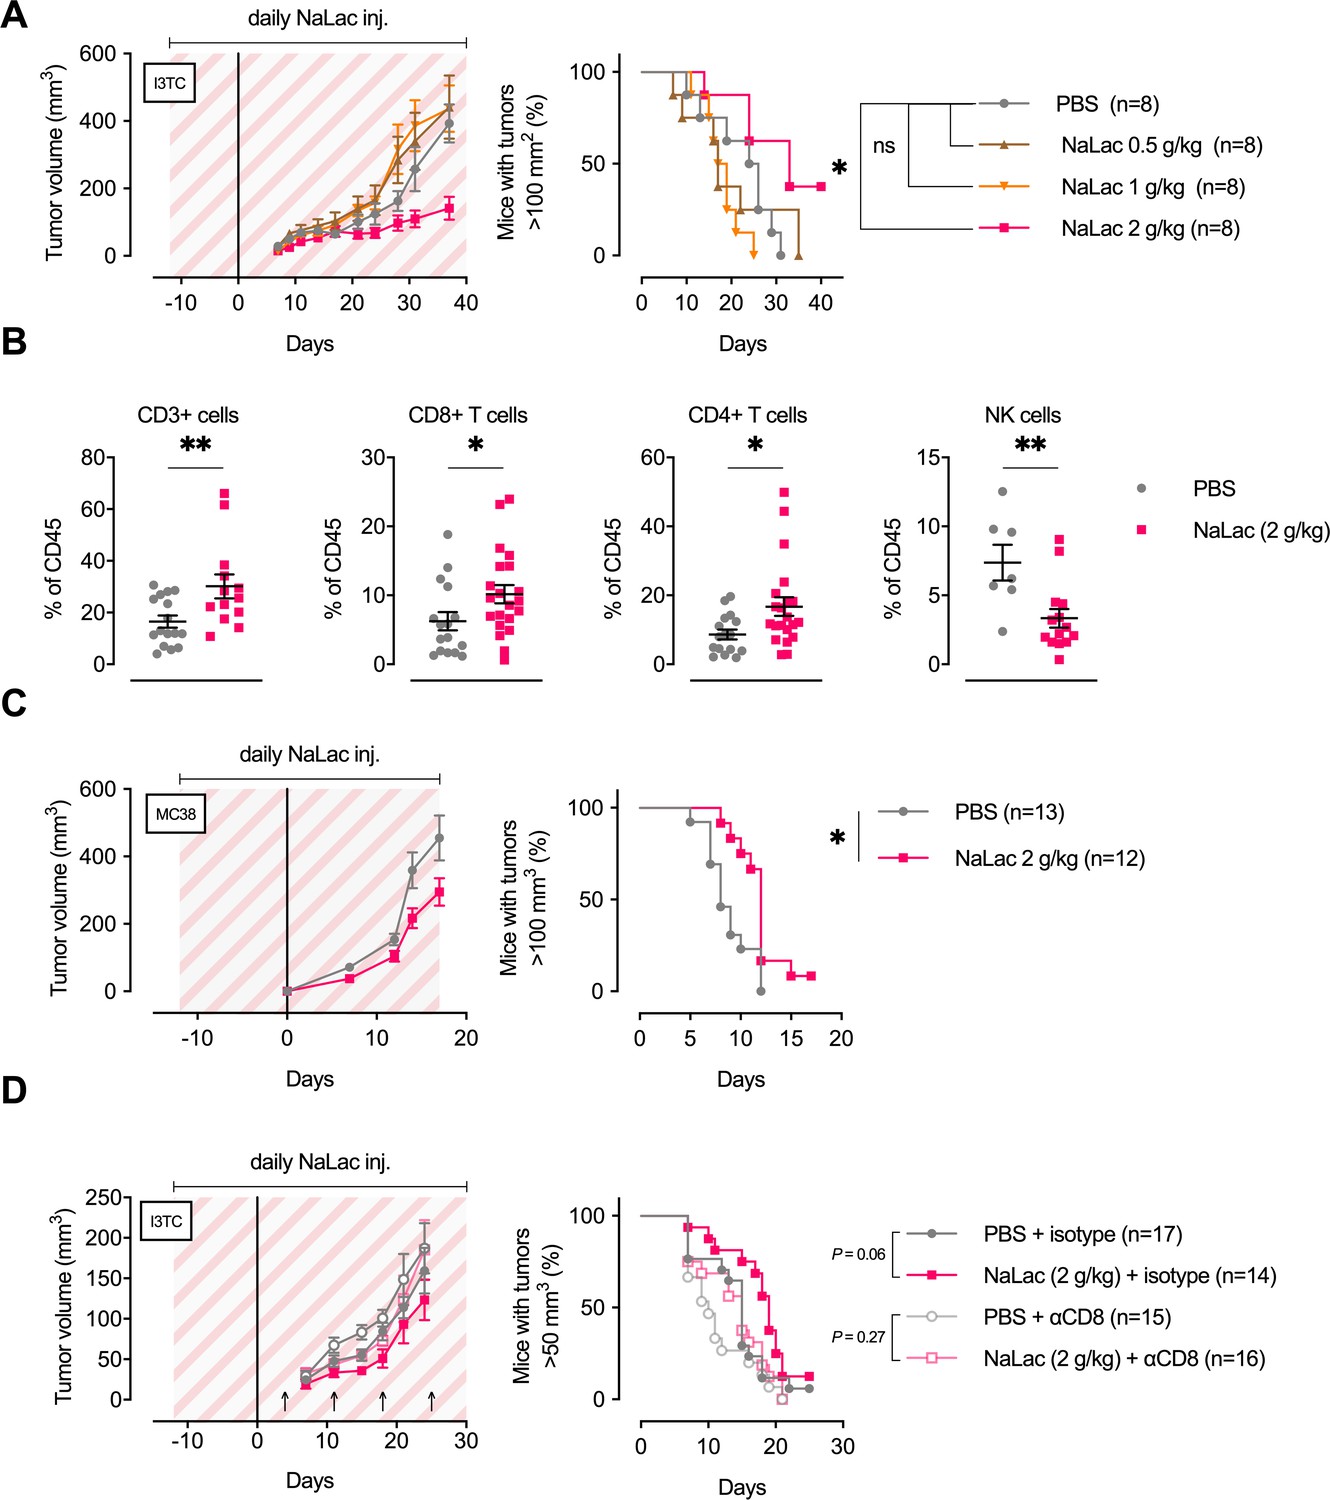
Daily administration of sodium L-lactate delays tumor growth in vivo.
(A) Daily doses of PBS or 0.5, 1, or 2 g/kg Sodium L-lactate (NaLac) were administered i.p to FVB mice for 12 days before subcutaneous inoculation with 5 × 10⁵ cells of the MMTV-PyMT-derived breast cancer cell line I3TC. Daily sodium L-lactate injections were continued throughout the experiment. Graphs show tumor volume (mean and SEM) over time and survival. *p<0.05, Log-rank (Mantel-Cox) survival test. (B) Flow cytometric characterization of I3TC tumor infiltrating immune cell populations. **p<0.01, *p<0.05, two-tailed t test. (C) Daily doses of PBS or 2 g/kg NaLac was administered i.p to C57BL/6J mice for 12 days before subcutaneous inoculation with 5 × 10⁵ cells of the colon cancer cell line MC38. Injections were continued throughout the experiment. Graphs show tumor volume (mean and SEM) over time and survival. **p<0.01, Log-rank (Mantel-Cox) survival test. (D) Same experimental setting as in (A) with or without weekly antibody-mediated depletion of CD8+ T cells (arrows). Graphs show tumor volume (mean and SEM) over time and survival. ns = not significant, Log-rank (Mantel-Cox) survival test.
Figure 6—figure supplement 1
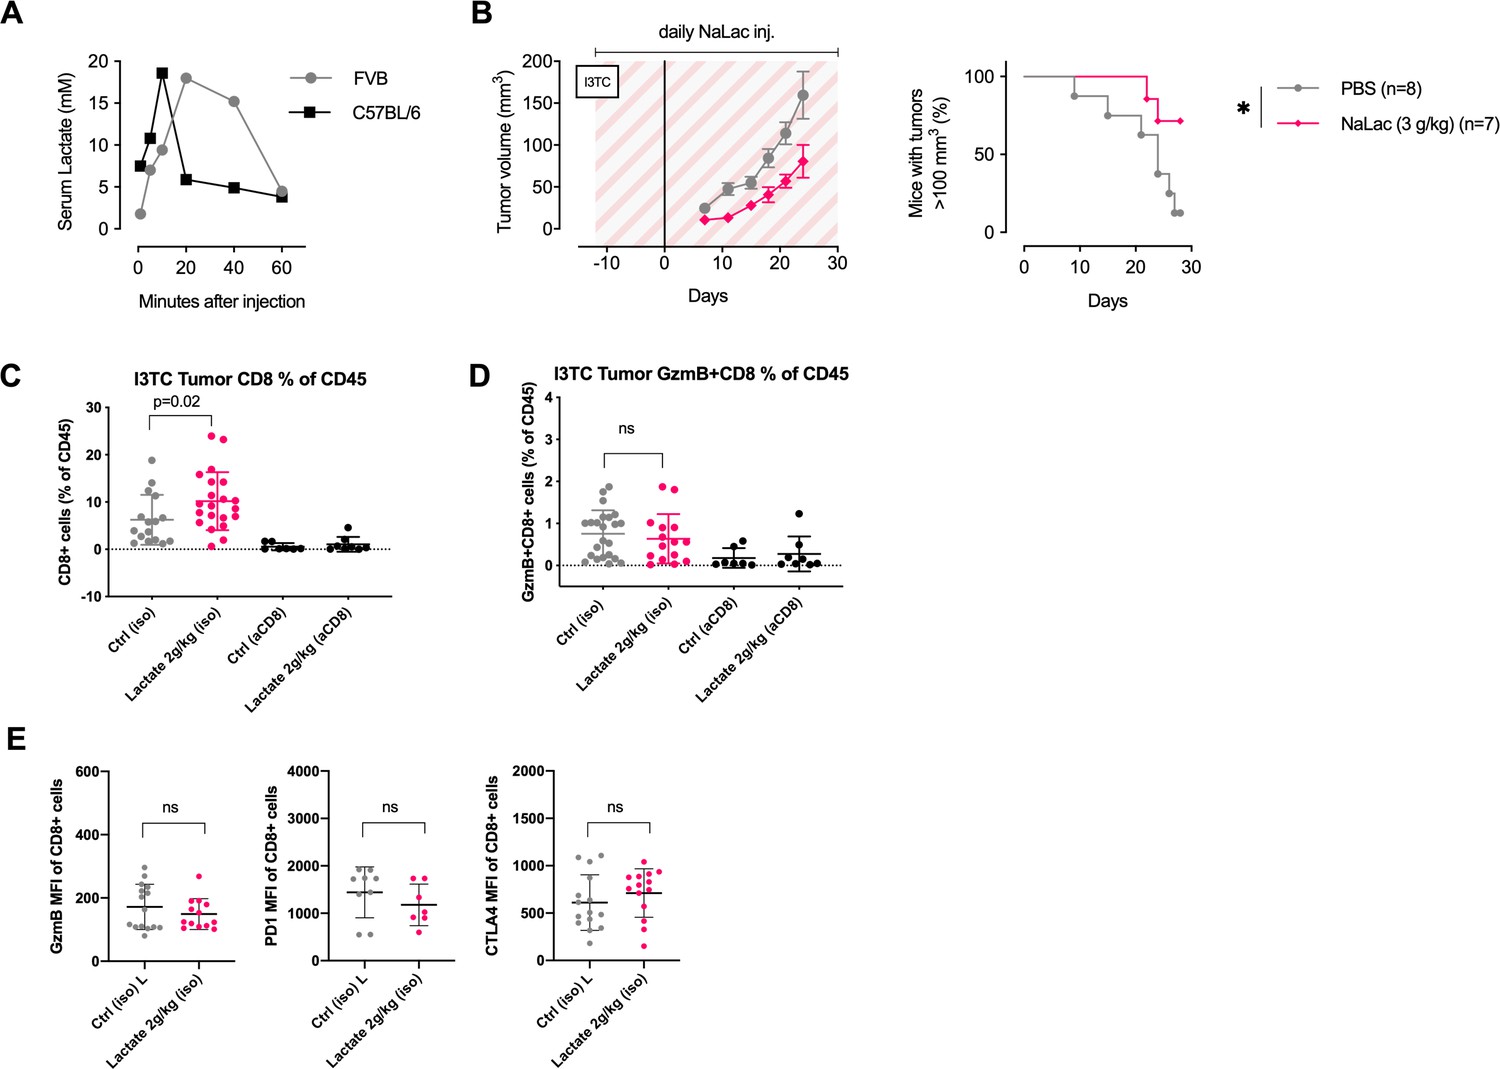
Characterization of tumor infiltrating CD8+ T cells after daily administration of sodium L-lactate.
(A) Peripheral blood lactate concentration (as measured with Accutrend Plus) following a single dose of 2 g/kg Sodium L-lactate (NaLac) administered i.p in FVB or C57BL/6J mice. (B) Daily doses of PBS or 3 g/kg NaLac were administered i.p to FVB mice for 12 days before subcutaneous inoculation with the breast cancer cell line I3TC. Injections were continued throughout the experiment. Graphs show tumor volume (mean and SEM) over time. *p<0.05, Log-rank (Mantel-Cox) survival test. (C) Flow-cytometrybased assessment of tumor infiltrating CD8+ T-cells (CD8+ cells as % of CD45+ cells) in I3TC tumors after daily lactate administration. *p<0.05, two-tailed t-test. (D) Flow-cytometry-based assessment of tumor infiltrating GzmB+CD8+ T-cells (% of CD45+ cells) in I3TC tumors after daily lactate administration. Ns = not significant, two-tailed t-test. (E) Flow-cytometry-based assessment of GzmB (left panel), PD1 (middle panel), and CTLA4 (right panel) MFI of CD8+ T-cells in I3TC tumors after daily lactate administration. Ns = not significant, two-tailed t-test.
Author response image 1
Author response image 2
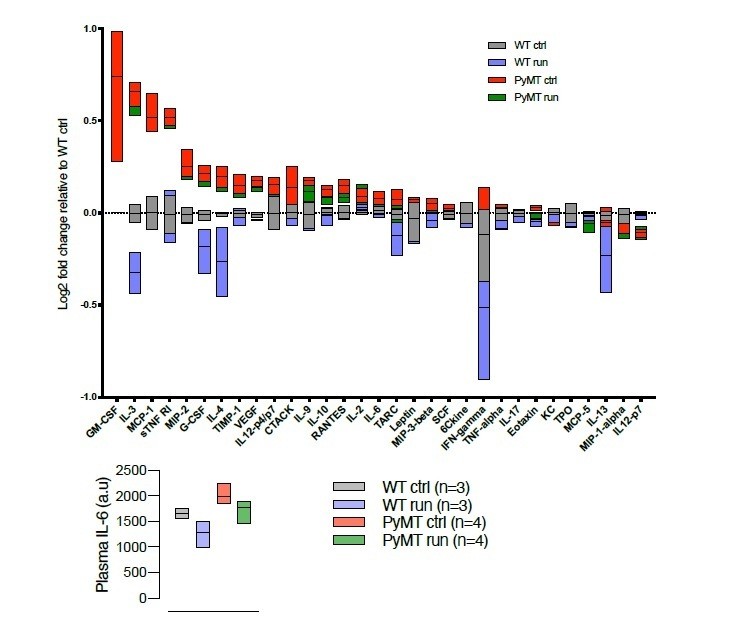
Cytokine array (RayBiotech, Norcross, GA, USA), describing the cytokine profile in serum from WT and tumor bearing (PyMT) running and non-running mice.
Chemiluminiscens detection was done on the ImageQuant LAS 4000 (GE Healthcare, Buckinghamshire, UK).
Author response image 3
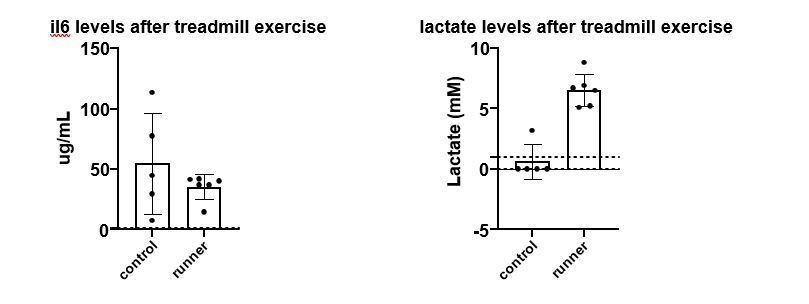
Left panel, mouse IL-6 plasma (RnD ELISA, heart puncture) levels after an acute treadmill exercise and in control animals.
Right panel, blood (tail vein) lactate in the same cohort (Accutrend device).
Tables
Key resources table
| Reagent type (species) or resource | Designation | Source or reference | Identifiers | Additional information |
|---|---|---|---|---|
| Strain, strain background (M. musculus) | FVB/N | Janvier Labs | FVB/N | FVB ‘WT’ mice |
| Strain, strain background (M. musculus) | C57Bl/6J | Charles River | C57Bl/6J (JAX) | C57Bl/6J ‘WT’ mice |
| Strain, strain background (M. musculus) | OT-I | The Jackson Laboratory (JAX) | Cat 003831 | TCR transgenic mice |
| Strain, strain background (M. musculus) | CD45.1 | The Jackson Laboratory (JAX) | Cat 002014 | CD45.1 congenic marker |
| Cell line (M. musculus) | I3TC | Weiland et al., 2012 | Murine breast cancer cell line derived from MMTV-PyMT FVB mice Mycoplasma test data RATIOS under 1 = clear.I3TC 0.3381995134 | |
| Cell line (M. musculus) | B16F10 | ATCC | CRL-6475 | Mouse melanoma cell line Mycoplasma test data RATIOS under 1 = clear. B16 OVA 447 163 0.36465324 |
| Cell line (M. musculus) | LLC | ATCC | CRL-1642 | Mouse lung carcinoma cell line Mycoplasma test data RATIOS under 1 = clear. LLC 438 151 0.34474885 |
| Antibody | aSINFENKL | BioLegend | Clone 25-D1.16 | |
| Chemical compound, drug | Sodium L-lactate | Sigma | L7022 | Metabolite |
| Chemical compound, drug | Cyclophosphamide | Sigma | C0768 | Chemotherapy agent |
| Commercial assay or kit | CD8a microbeads | Miltenyi Biotec | 130-117-044 | Beads for magnetic sorting |
| Chemical compound, drug | Collagenase A | Fisher Scientific | 50-100-3278 | For single cell dissociation of tumors |
| Chemical compound, drug | DNase | Sigma | D5025 | For single cell dissociation of tumors |
| Commercial assay or kit | Dynabeads Mouse T-activator | Thermo Fisher | 11456D | Dynabeads Mouse T-activator CD3/CD28 |
| Chemical compound, drug | IL-2 | Sigma | 11011456001 | IL-2 |
| Chemical compound, drug | Citric acid | Sigma | 251275 | |
| Chemical compound, drug | Malic acid | Sigma | M1000 | |
| Chemical compound, drug | Succinic acid | Sigma | S3674 | |
| Chemical compound, drug | Fumaric acid | Sigma | 47910 | |
| Chemical compound, drug | Lactic acid | Sigma | L1750 | |
| Chemical compound, drug | Pyruvic acid | Sigma | 107360 | |
| Chemical compound, drug | a-Ketoglutaric acid | Sigma | K1750 | |
| Chemical compound, drug | Oxaloacetic acid | Sigma | O4126 | |
| Commercial assay or kit | Resazurin reduction assay | Sigma | R7017 | T-cell proliferation assessment |
| Commercial assay or kit | Dead cell stain kit | Thermo Fisher | L10119 | Fixable Near-IR Dead cell Stain Kit |
| Antibody | aCD44 (rat monoclonal) | BD Biosciences | Clone IM7 | 1:2000 |
| Antibody | aCD45.1 (mouse monoclonal) | BD Biosciences | Clone A20 | 1:200 |
| Antibody | aCD45.2 (mouse monoclonal) | BD Biosciences | Clone 104 | 1:200 |
| Antibody | CD8 (rat monoclonal) | BD Biosciences | Clone 53–6.7 | 1:200 |
| Antibody | aCTLA-4 (Armenian hamster monoclonal) | BD Biosciences | Clone UC10-4F10-11 | 1:200 |
| Antibody | aCD62L (mouse monoclonal) | BioLegend | Clone MEL-14 | 1:200 |
| Antibody | aICOS (Armenian hamster monoclonal) | BioLegend | Clone C398.4A | 1:200 |
| Antibody | aGzmB (mouse monoclonal) | Thermo Fisher | Clone GB12 | 1:100 |
| Commercial assay or kit | Counting beads | Thermo Fisher | C36950 | CountBright Absolute Counting Beads |
| Software | FlowJo | Tree Star | Version 8.8.7 | |
| Software | Prism | GraphPad | Version 8 | |
| Software | R | R Core Team | Version 3.6.1 | |
| Antibody | CD3 (rabbit polyclonal) | Abcam | #ab5690 | IHC 1:100 |
| Antibody | F4/80 (rat monoclonal) | Abd Serotec | #MCA497 | IHC 1:100 |
| Antibody | Podocalyxin (goat polyclonal) | R and D Systems | #AF1556 | IHC 1:200 |
| Antibody | PCNA (mouse monoclonal) | Dako | #M0879 | IHC 1:500 |
| Antibody | GzmB (rabbit polyclonal) | Abcam | #ab4059 | IHC 1:100 |
| Commercial assay or kit | ABC kit | Vector | PK6100 | Avidin-Biotin peroxidase Complex |
| Commercial assay or kit | DAB | Vector | SK4100 | Diaminobenzidine staining |
| Software | Image J | NIH |
Additional files
Download links
A two-part list of links to download the article, or parts of the article, in various formats.
Downloads (link to download the article as PDF)
Open citations (links to open the citations from this article in various online reference manager services)
Cite this article (links to download the citations from this article in formats compatible with various reference manager tools)
Cytotoxic T-cells mediate exercise-induced reductions in tumor growth
eLife 9:e59996.
https://doi.org/10.7554/eLife.59996


