Co-movement of astral microtubules, organelles and F-actin by dynein and actomyosin forces in frog egg cytoplasm
- Department of Systems Biology, Harvard Medical School, United States
- Marine Biological Laboratory, United States
- Department of Physics, Massachusetts Institute of Technology, United States
- Flatiron Institute, Center for Computational Biology, United States
Figures
Figure 1 with 1 supplement
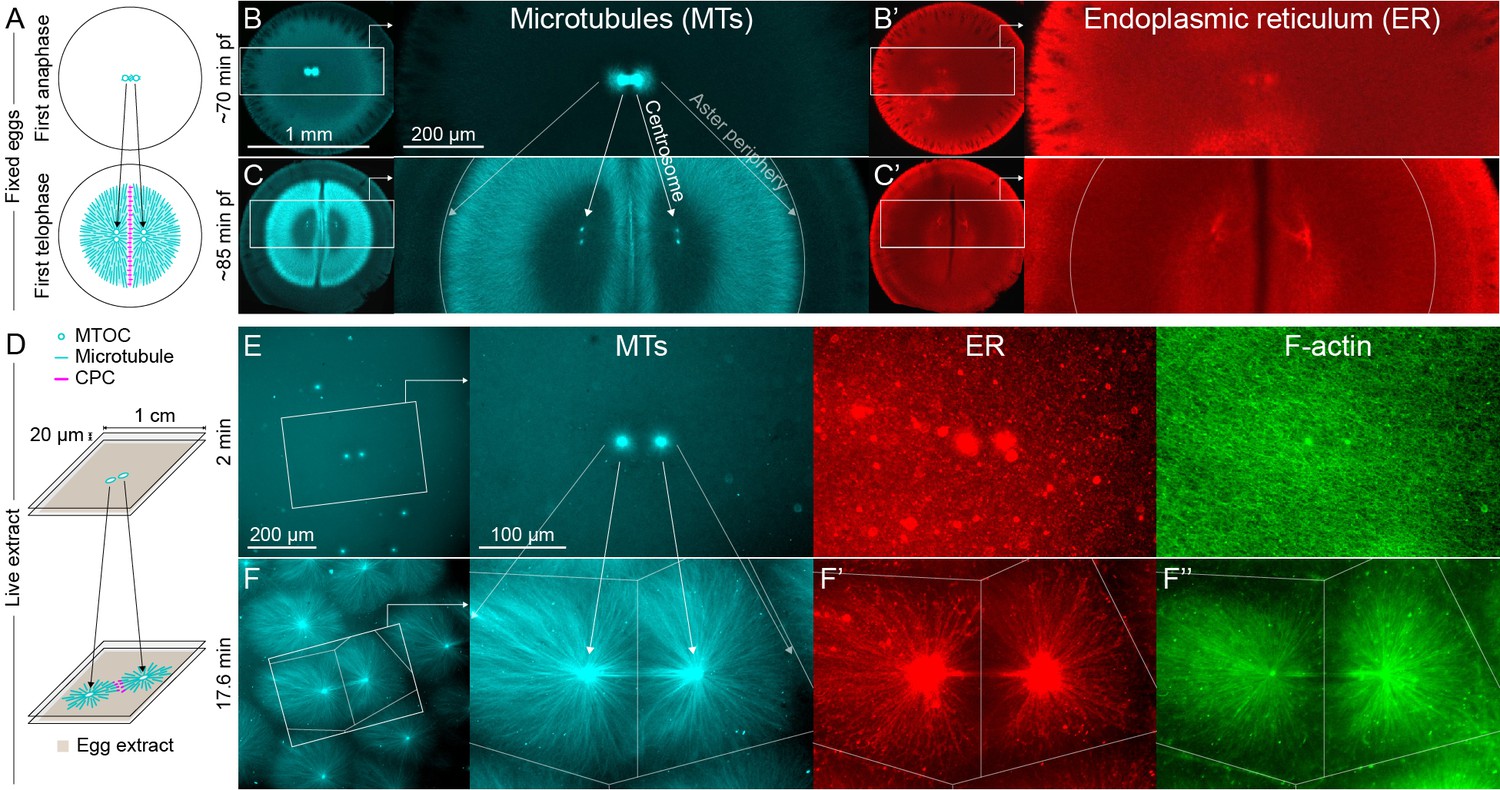
MTOC separation movement in Xenopus eggs and egg extract.
Panels A-C are fixed embryos, and panels D-F are in Xenopus egg extract. (A) Cartoon illustrating MTOC movement away from the CPC-positive midplane before astral microtubules (MTs) reach the cortex in Xenopus laevis eggs. MTs shown in cyan and CPC-positive interaction zone in magenta. Note the CPC is shown in the cartoon panels A and D, but not in the rest of the figure. (B,C) Anti-tubulin immunofluorescence of eggs fixed ~70 and ~85 min post-fertilization (pf). Diagonal lines connecting different eggs in panels B and C emphasize centrosome separation movement and the growing aster periphery. (B’,C’) Anti-LNPK (ER) immunofluorescence of the same eggs. (D) Cartoon illustrating aster separation movement in an extract system. MTs and CPC as in panel A. Asters were reconstituted from artificial microtubule organizing centers (MTOCs) in interphase Xenopus egg extracts. (E,F) MTOCs moved apart as asters grew and interacted with one another over time. Time is defined with respect to perfusing the sample and warming to 20°C, so the start of aster growth occurred soon after 0 min. (F’) A fraction of the ER became enriched around MTOCs, and (F’’) F-actin was disassembled locally along interaction zones.
Figure 1—figure supplement 1
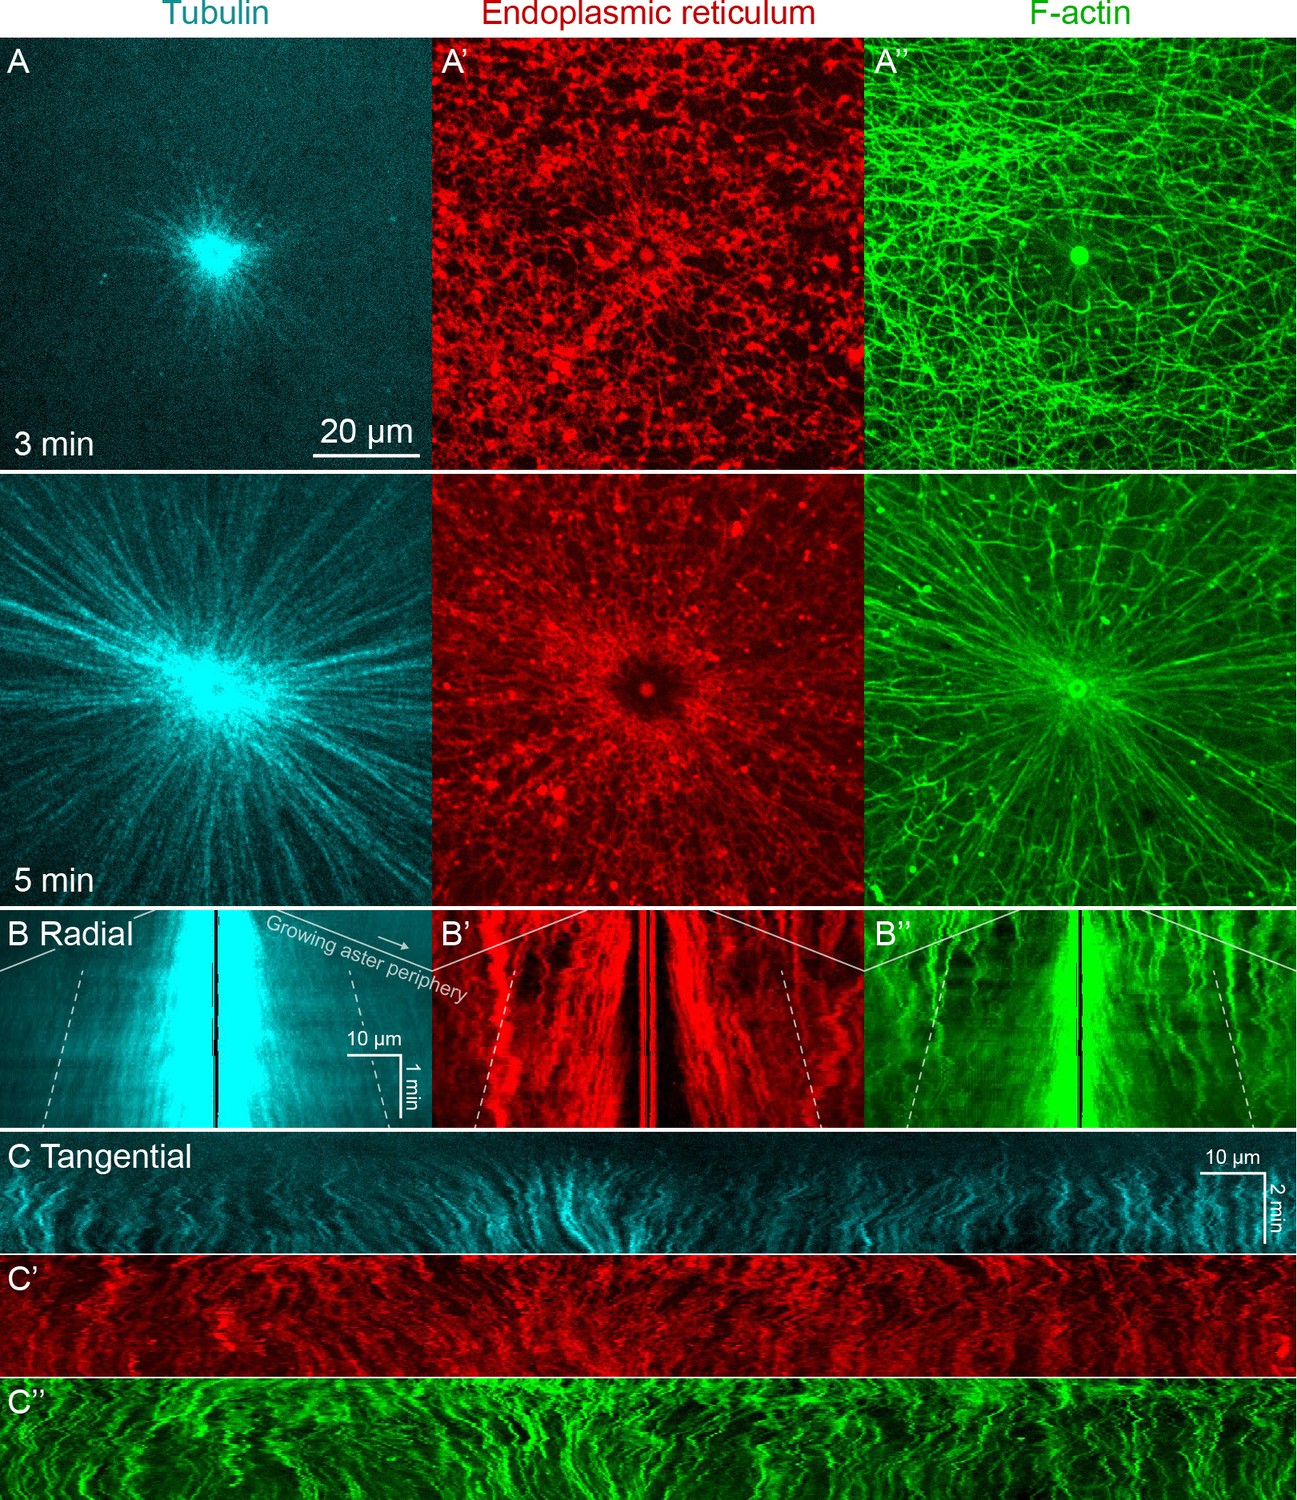
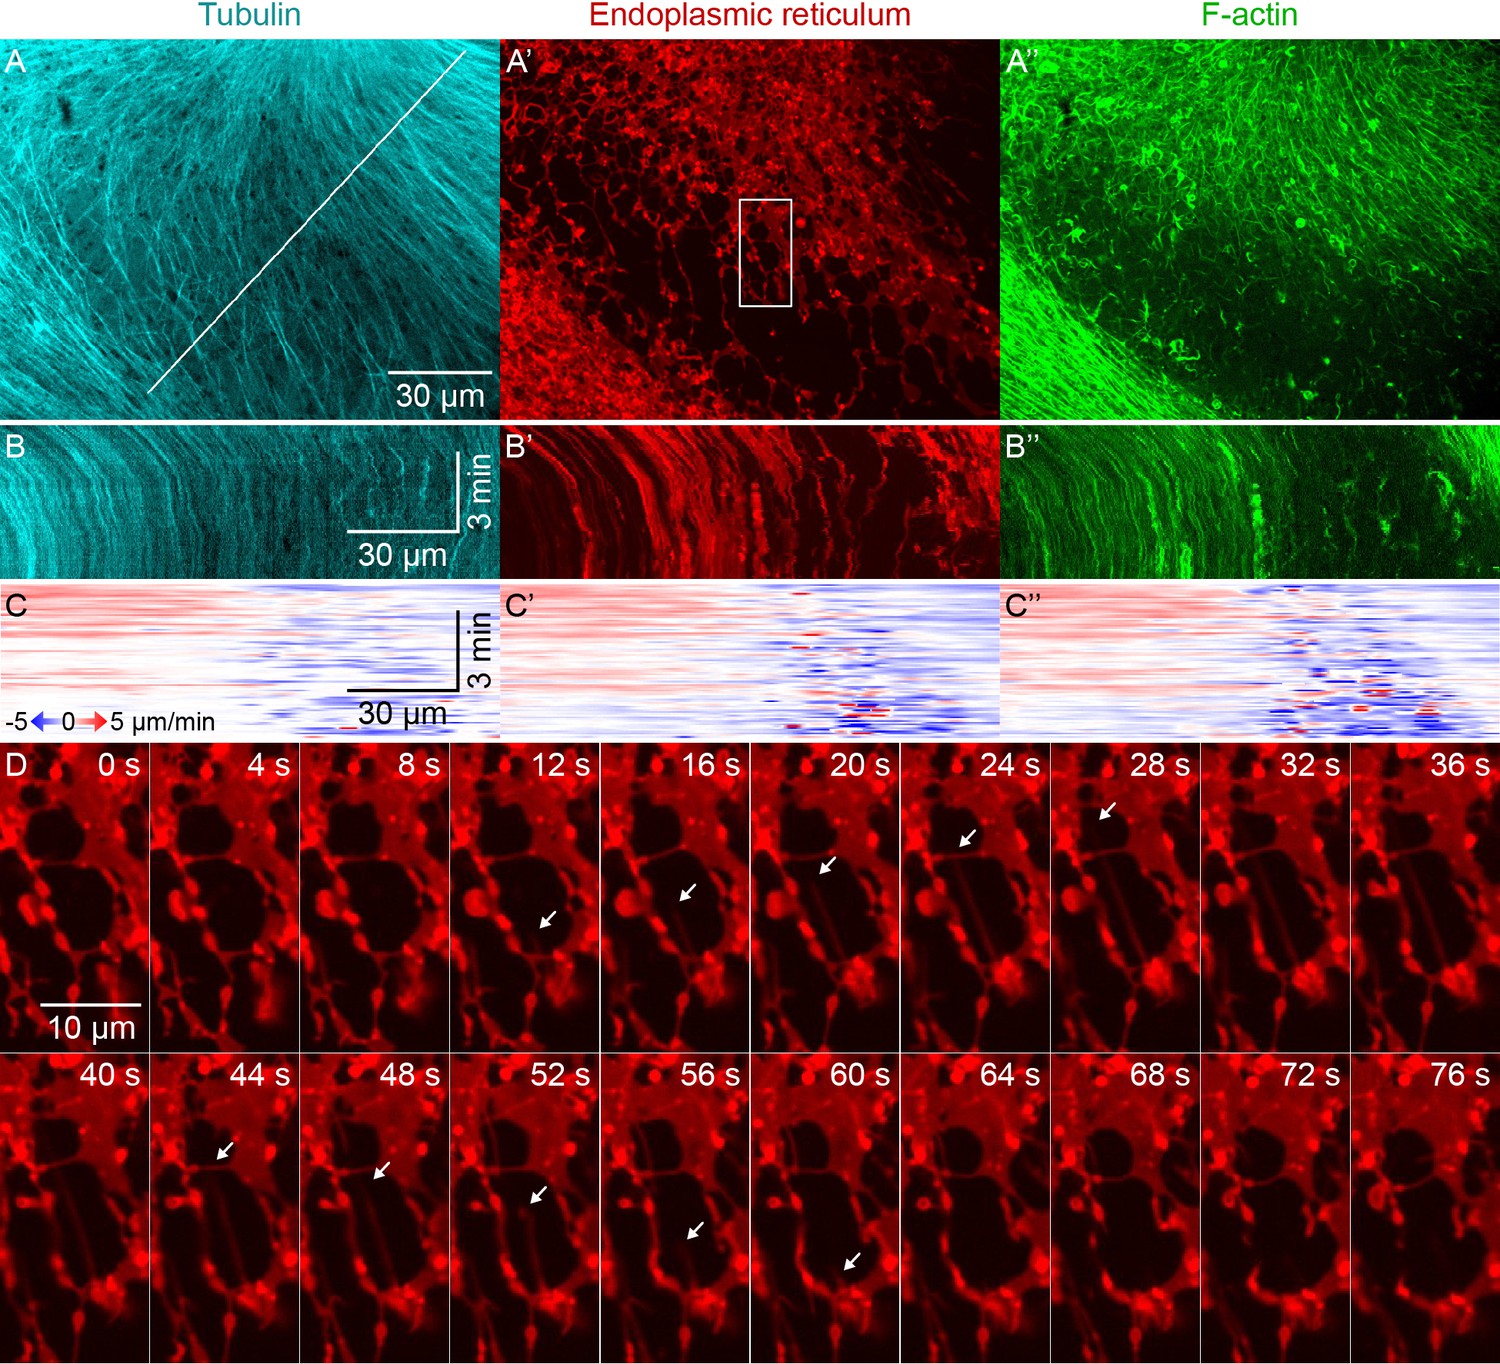
Higher magnification imaging around MTOCs included signatures of both co-movement and relative movement of astral MTs, ER, and F-actin.
(Related to Figure 1, Video 1) (A) MTs imaged at near-speckle concentrations with tubulin-Alexa Fluor 647, ER labeled with DiI, and F-actin labeled with Lifeact-GFP. Images taken on a spinning disk confocal microscope with 60x objective. (B) Radial kymographs generated by averaging the intensity over 10° sectors originating at the MTOC. One end remained pinned at the MTOC, and the other end rotated with the average flow of ER, so features would remain in the sector, and the kymograph would highlight their radial movement. To guide the eye, the solid lines indicate the growing aster periphery (slope corresponds to 30 µm/min), and the dotted lines track with outward sliding of tubulin speckles away from the MTOC (slope corresponds to 3 µm/min). (C) Tangential kymographs generated along a circle centered on the MTOC, so moving features represent tangential displacement with respect to the MTOC.
Figure 2
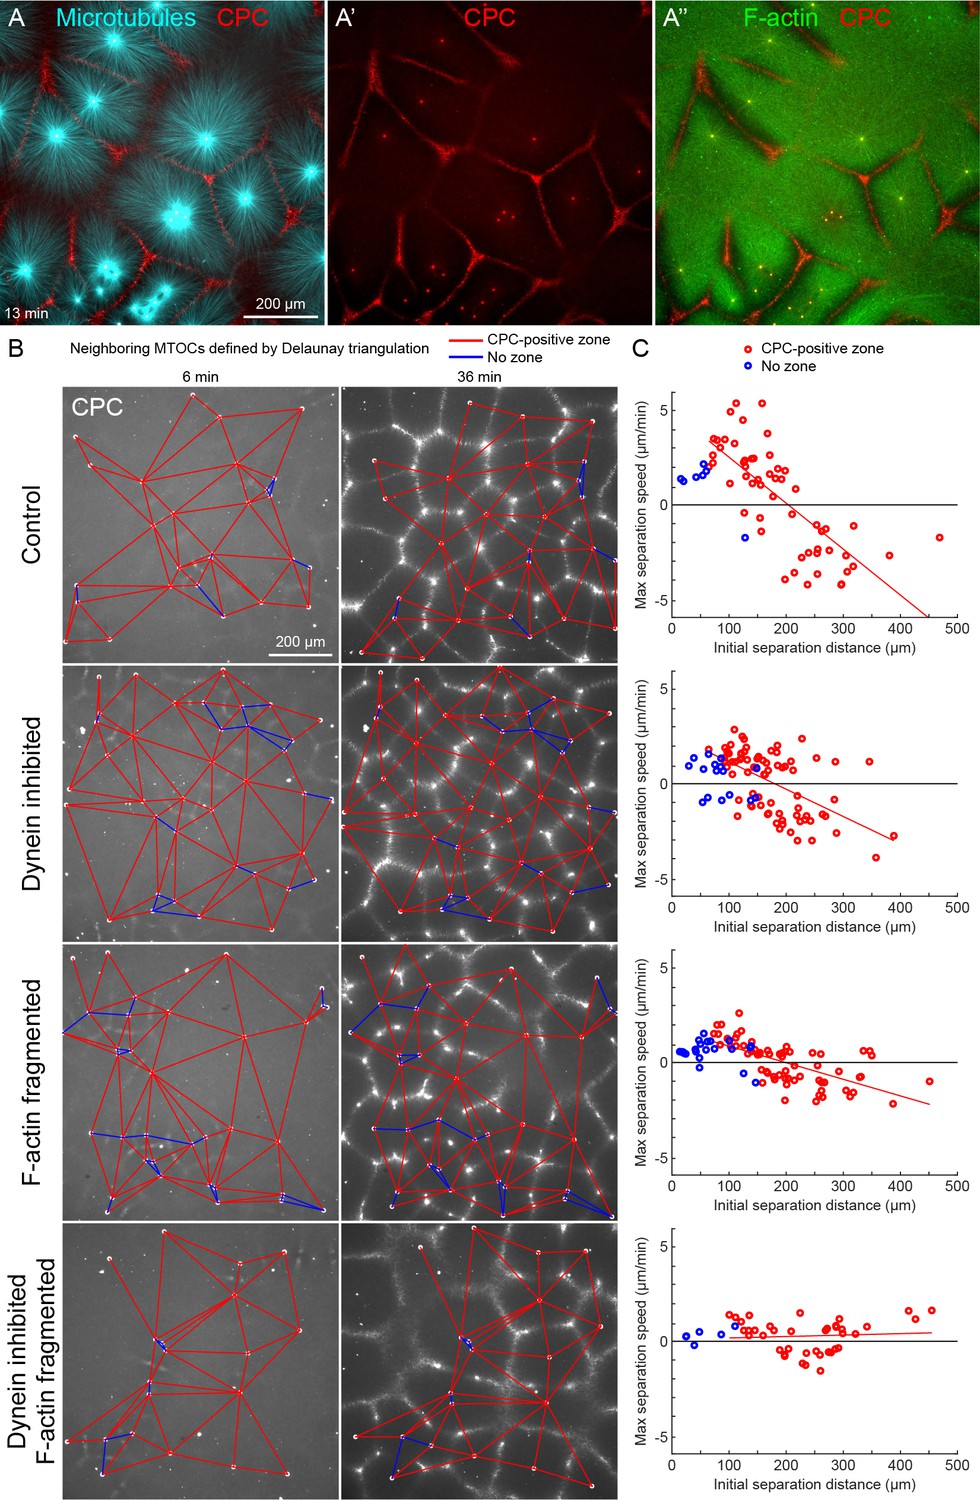
MTOC separation movement in egg extract by dynein and actomyosin.
(A) The CPC localized to interaction zones between neighboring asters, blocking mutual interpenetration of MTs and disassembling F-actin locally. Time is defined with respect to perfusing the sample and warming to 20°C, so the start of aster growth occurred soon after 0 min. (B) Four aster growth reactions were followed in parallel under control vs inhibitor conditions. The first column in each condition shows an early time point, and the second column shows a time point 30 min later. MT growth was similar and CPC-positive interaction zones formed under all conditions (see Video 3). (C) Maximum speed of separation with respect to initial distance between the MTOCs. Red lines indicate linear fits to red points.
-
Figure 2—source data 1
MTOC trajectories and Delaunay triangulations for panels B and C.
The ‘beads’ variables are structures that contain the MTOC trajectories. Some MTOCs enter or exit the image during the movie, and the ‘t’ field within each element represents the frames during which an MTOC was present, with 1 the first frame and 10 the last frame. The ‘x’ and ‘y’ fields represent the MTOC position, and the ‘nn’ field represents the indices of the nearest neighbor MTOCs defined by the Delaunay triangulation. The ‘pairs’ variables enumerate all pairs of nearest neighbor MTOCs, that is, the edges in panel B. The last column is 0 if the corresponding interaction zone was not CPC-positive, and 0.5 or 1 if the corresponding interaction was CPC-positive. The ‘edges’ variables list all neighboring edges for each edge.
- https://cdn.elifesciences.org/articles/60047/elife-60047-fig2-data1-v2.mat
Figure 3 with 1 supplement
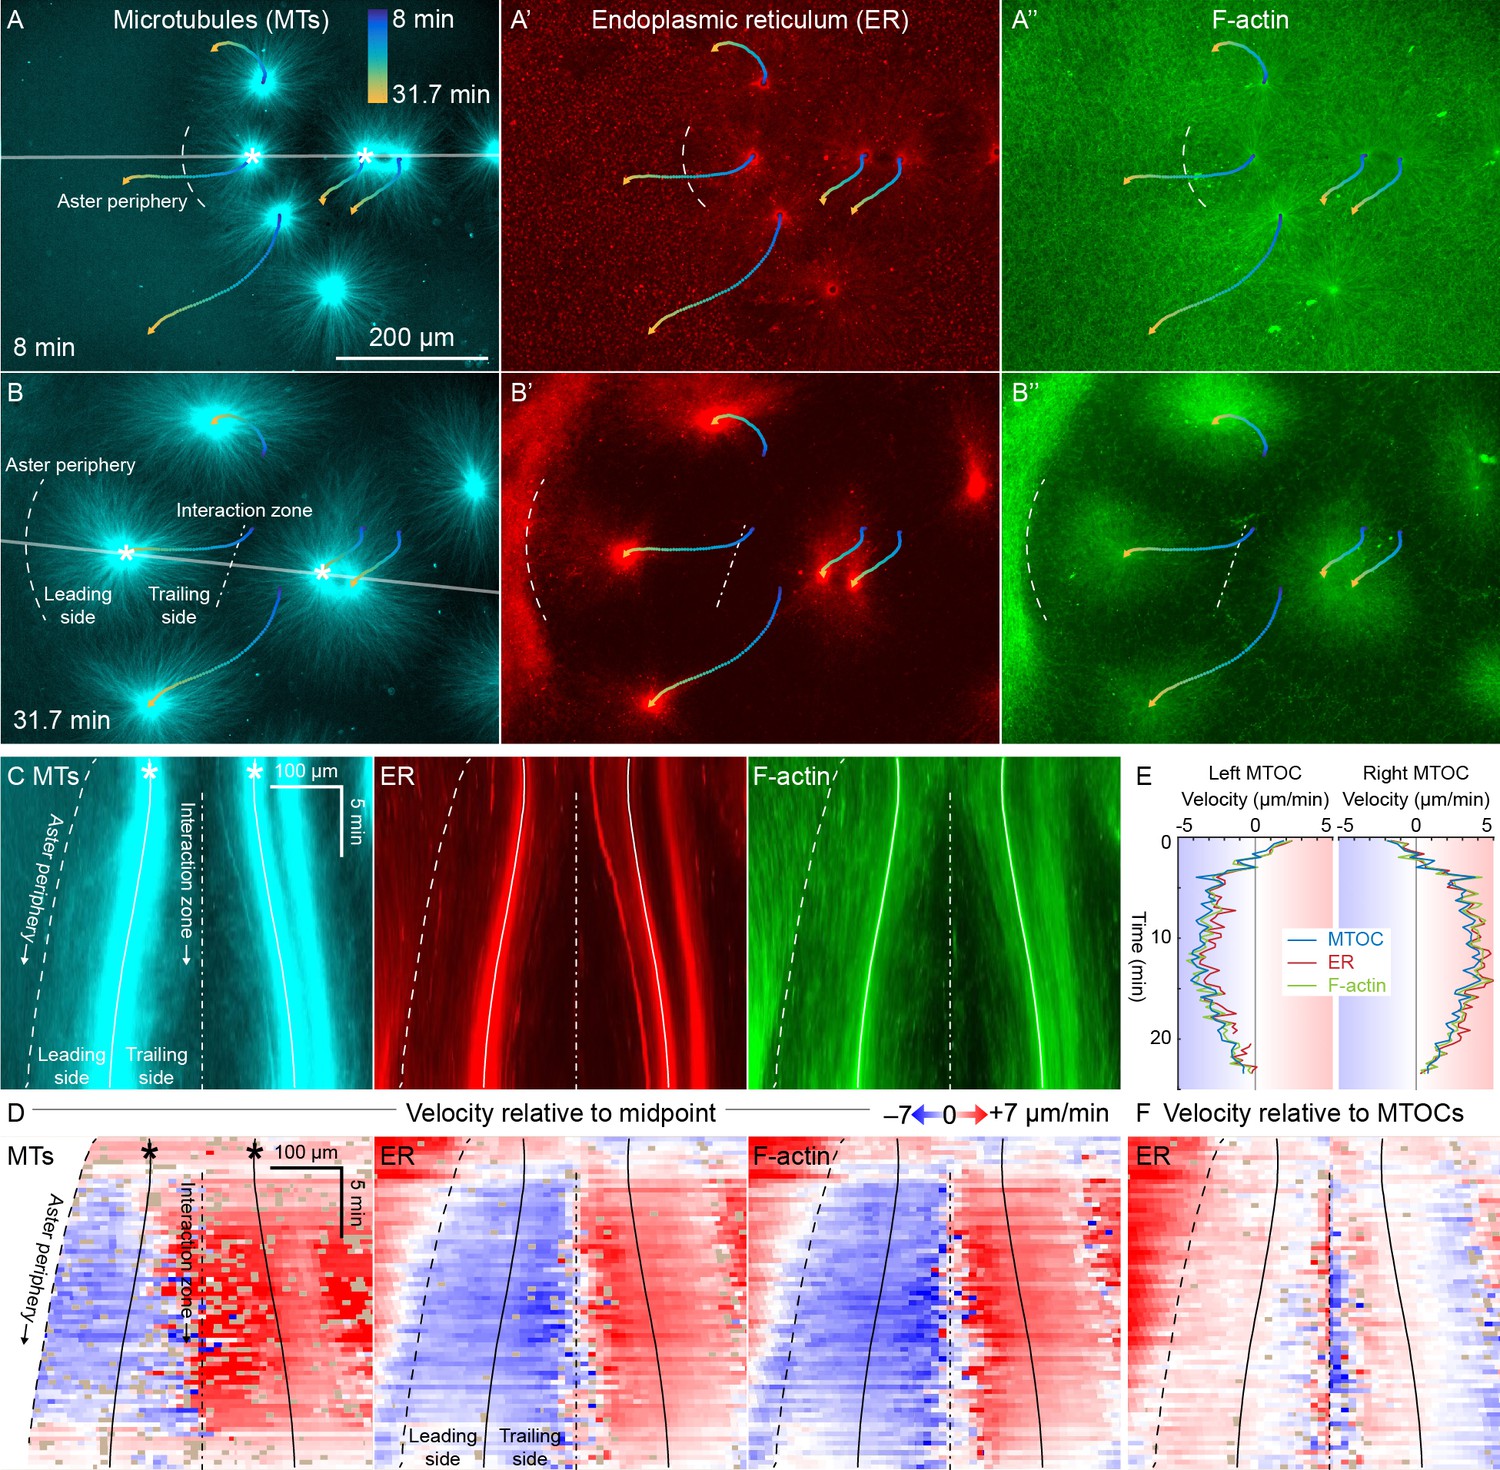
ER and F-actin move with MTs in separating asters.
(A,B) Asters grew until they reached their neighbors, formed interaction zones approximately equidistant between the MTOCs, then moved away from the interaction zones (see Video 2). MTOC trajectories are represented by contours colored from blue to yellow. Time is defined with respect to perfusing the sample and warming to 20°C, so the start of aster growth occurred soon after 0 min. (C) Intensity kymographs along the gray line shown in panels A and B, passing through the MTOCs marked with a white star. To show relative movement of the MTOCs, each row of the kymograph was computationally translated to keep stationary the midpoint between the MTOCs, where the interaction zone formed. Solid curves indicate the MTOCs, the dashed curve indicates the growing aster periphery, and the dash-dotted line indicates the interaction zone. (D) Velocity maps in the same frame of reference as in panel C. 2D flow fields were measured by particle image velocimetry (PIV), projected onto the line passing through the MTOCs, then the projected velocity of the midpoint between the MTOCs was subtracted, again to show movement relative to the interaction zone. A white color indicates stationary with respect to the midpoint, blue indicates moving to the left, and red to the right. PIV outliers were filtered and shown in beige. (E) Velocity of the MTOCs based on particle tracking, as well as the velocity of ER and F-actin in the neighborhood of the MTOCs based on PIV. (F) Velocity of ER with respect to the moving MTOCs, not with respect to the interaction zone as in panel D.
-
Figure 3—source data 1
Velocity maps for panel D, as well as the full 2D velocity fields from PIV used to generate the velocity maps.
Velocities in the neighborhood of the MTOCs (from PIV for the ER and F-actin, and from particle tracking for the MTOC) for panel E.
- https://cdn.elifesciences.org/articles/60047/elife-60047-fig3-data1-v2.mat
Figure 3—figure supplement 1
Higher magnification imaging around zones included signatures of both co-movement and relative movement of astral MTs, ER, and F-actin.
(Related to Figure 3, Video 4) (A) MTs labeled with tubulin-Alexa Fluor 647, ER labeled with DiI, and F-actin labeled with Lifeact-GFP. Images taken on a spinning disk confocal microscope with 60x objective. (B) Kymographs along the line indicated in panel A. (C) Velocity maps in the same frame of reference as panel B. Velocity maps represent the horizontal component of the velocity estimated by PIV. (D) Temporal montage of the box indicated in panel A’ showing an example of deformation of the ER. Time with respect to the start of the montage.
Figure 4 with 1 supplement
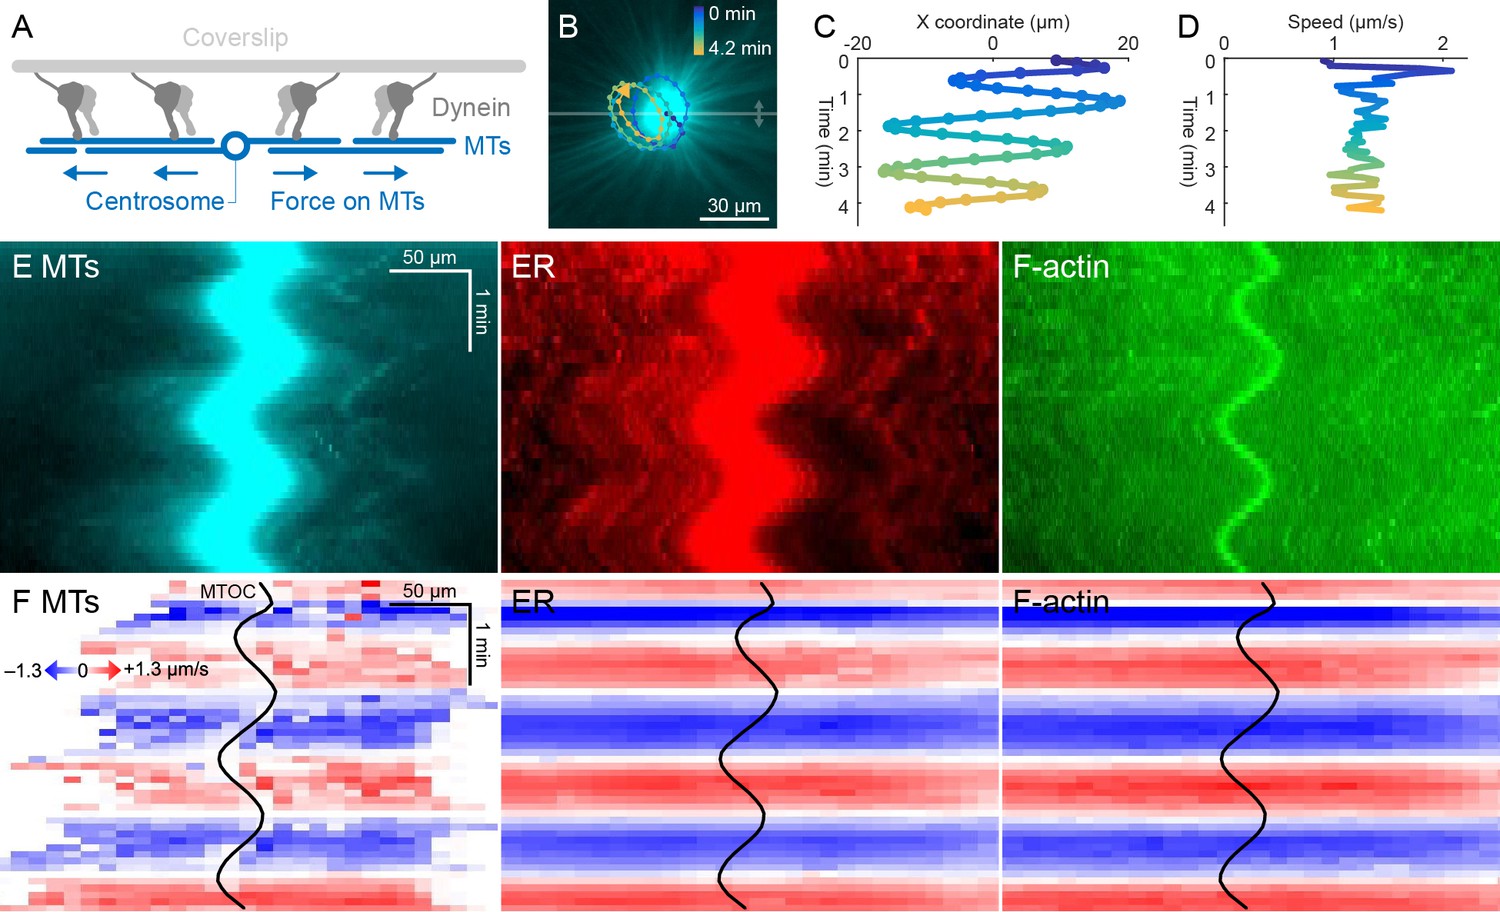
ER and F-actin move with MTs on coverslips functionalized with dynein.
(A) Coverslips were functionalized with an antibody against HOOK2, so the rigid coverslip substrate generated pulling forces on the astral MTs. (B) Circular oscillatory trajectory of the MTOC (see Video 5). (C) X coordinate of the MTOC. (D) Speed of the MTOC relative to the coverslip, including both X and Y components of motion. (E) Intensity kymographs along the horizontal line passing through the MTOC, indicated in panel B. (F) Velocity maps in the same frame of reference as in panel E. 2D velocity fields were measured by particle image velocimetry (PIV) then projected onto the horizontal line as in panel E. The MTOC position is shown as a black curve.
-
Figure 4—source data 1
Velocity maps for panel F, as well as the full 2D velocity fields from PIV used to generate the velocity maps.
- https://cdn.elifesciences.org/articles/60047/elife-60047-fig4-data1-v2.mat
Figure 4—figure supplement 1
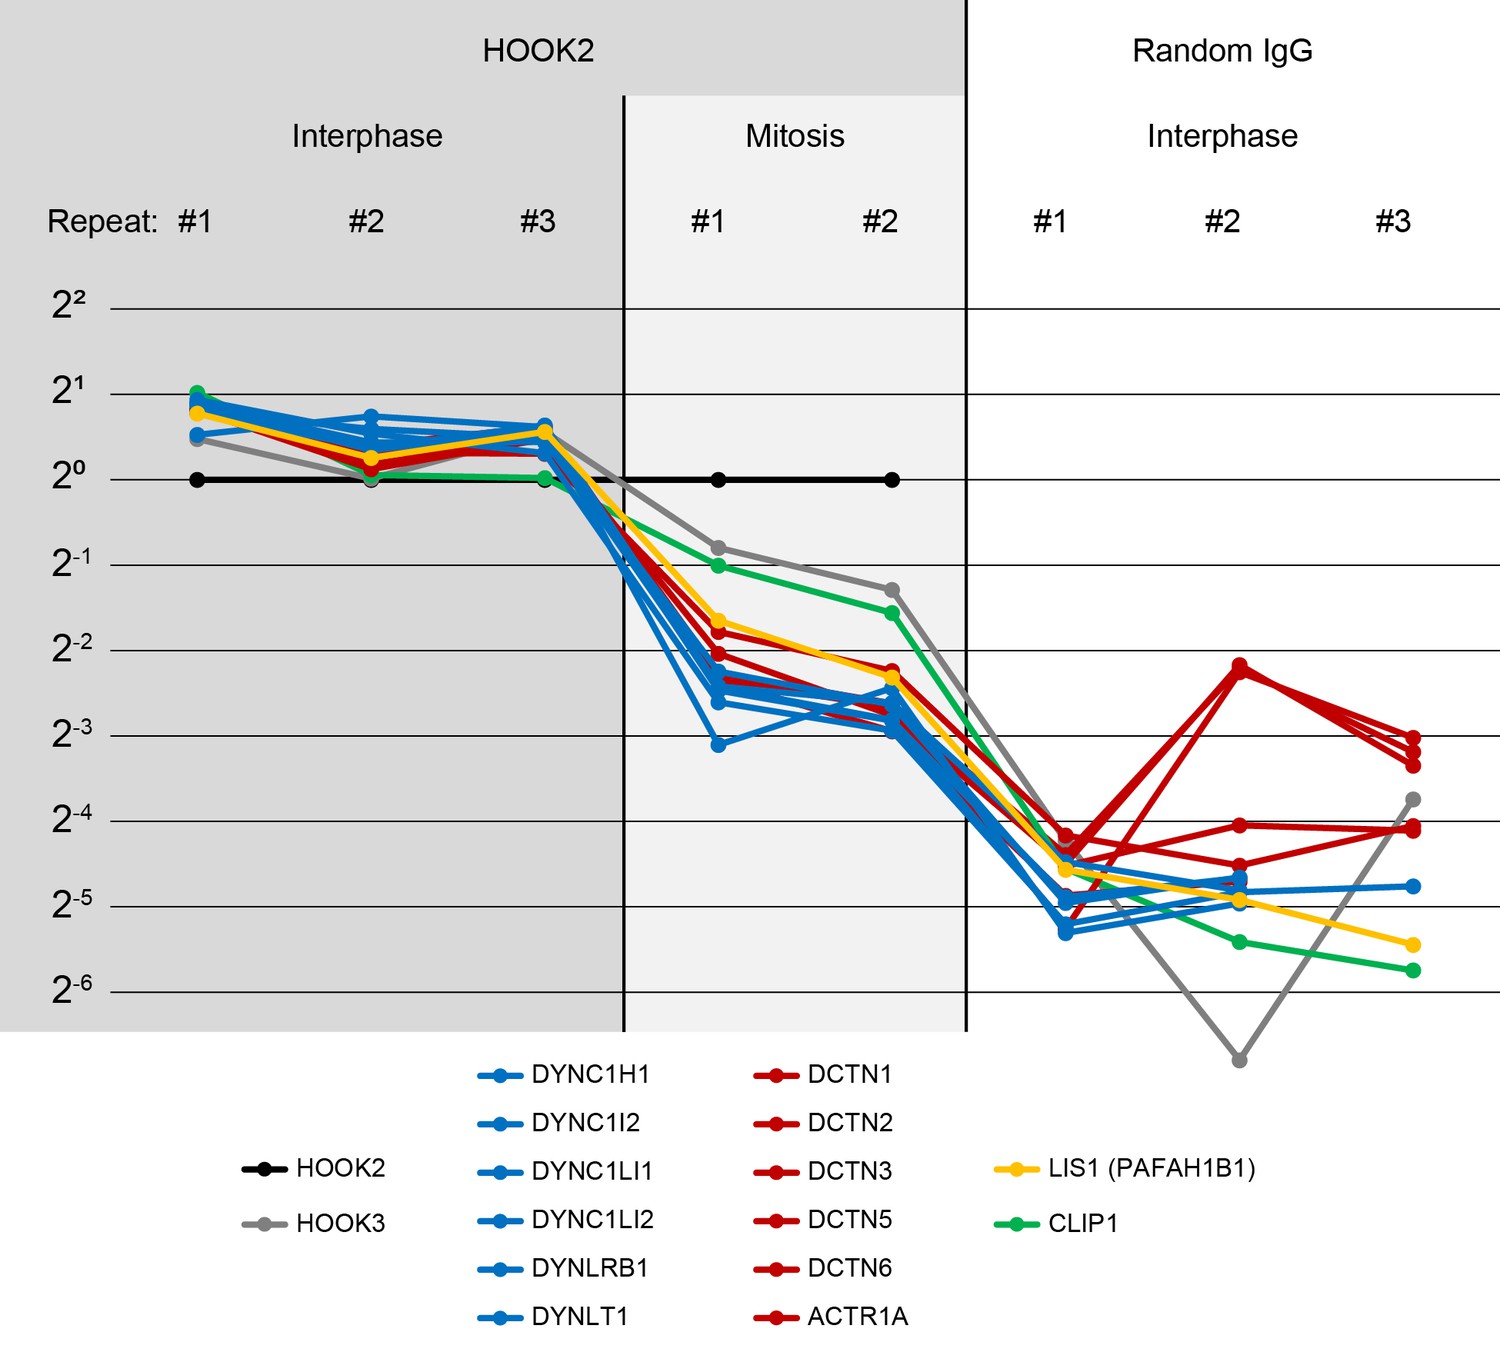
Characterization of the HOOK2 C-terminal peptide antibody.
(Related to Figures 4, 5 and 8) We performed immunoprecipitation-mass spectrometry (IP-MS) on Protein G Dynabeads functionalized with anti-HOOK2. In three repeat extracts, we measured three conditions: anti-HOOK2 in interphase extracts (columns 1 to 3), anti-HOOK2 in mitotic extracts (columns 4 and 5), and as negative control, random IgG in interphase (columns 6 through 8). HOOK2 conditions were normalized so the amount of HOOK2 was constant. Random IgG conditions were normalized to have the same IgG count as the average IgG count of the HOOK2 columns. Then for each protein, the sum across channels was normalized, so the abundance values represent relative enrichment across the eight channels. Abundances are shown on a log scale with base 2. We here show dynein subunits (blue), dynactin subunits (red), and other proteins known to interact with dynein-dynactin (yellow, green) that came down in the immunoprecipitations. The interaction between HOOK2 and the dynein-dynactin complex was stronger in interphase (left columns) than in mitosis (middle columns).
-
Figure 4—figure supplement 1—source data 1
Immunoprecipitation-mass spectrometry (IP-MS) counts for Figure 4—figure supplement 1.
- https://cdn.elifesciences.org/articles/60047/elife-60047-fig4-figsupp1-data1-v2.xlsx
Figure 5 with 2 supplements
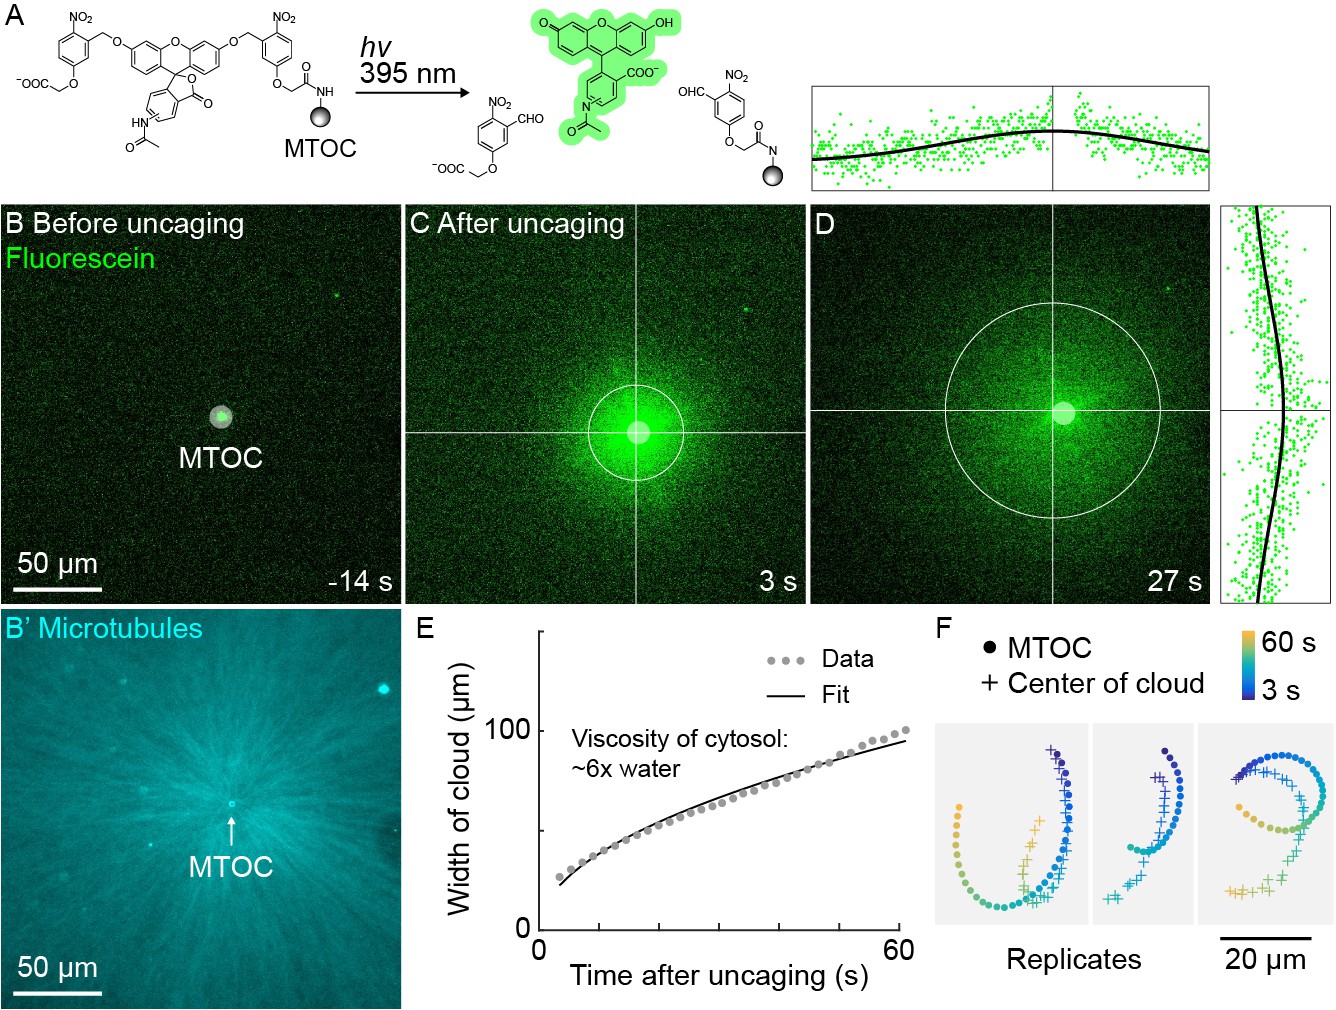
A small molecule is advected with moving asters.
(A) To track the flow of a small molecule within moving asters, MTOCs were functionalized with caged fluorescein. (B) Caged fluorescein, before uncaging. (B’) Astral MTs radiating from the MTOC filled the region. The aster was oscillating on a coverslip functionalized with anti-HOOK2 as in Figure 4. (C) Fluorescein, after uncaging. (D) Within tens of seconds, the fluorescein diffused away from the MTOC and approached the background intensity (see Video 7). 2D Gaussian fits to estimate the width and center of the fluorescein cloud. The bright MTOC was excluded from the Gaussian fit, so uncaged fluorescein that remained bound to the MTOC did not bias the fitted position. (E) Expansion of the fluorescein cloud width fit to a model of diffusion. (F) Several replicate trajectories of the MTOC (circle) and the center of the fluorescein cloud (plus).
Figure 5—figure supplement 1
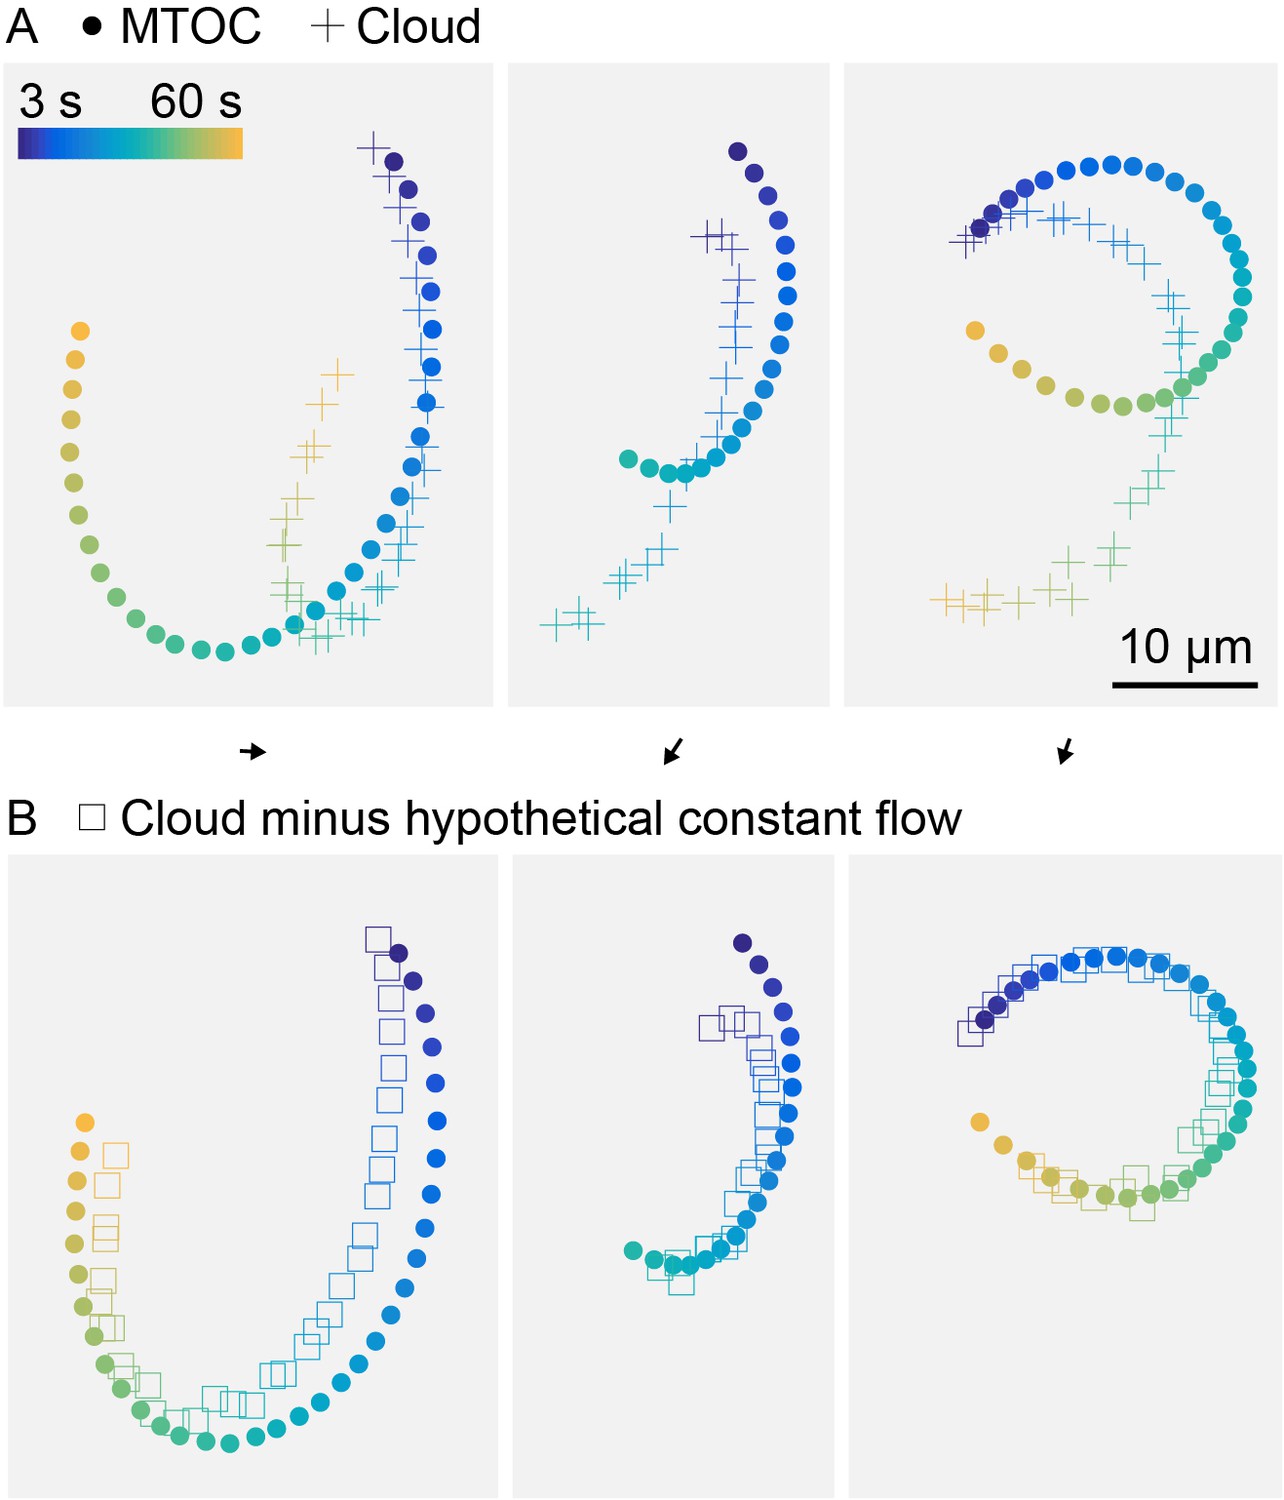
Hypothetical constant flow permeating asters can improve registration between MTOC and center of fluorescein cloud.
(Related to Figure 5) (A) Trajectory of MTOC (circle) and center of the fluorescein cloud, within aster oscillating on HOOK2-functionalized coverslip, same as Figure 5F. (B) Trajectory of MTOC (circle) and center of the fluorescein cloud after computationally subtracting a constant flow (square). Flow direction and magnitude shown as a black arrow above each panel. The hypothetical constant flow was optimized to minimize the difference between the MTOC and cloud trajectories.
-
Figure 5—figure supplement 1—source data 1
Width of the fluorescein cloud vs time for panel E, and MTOC and cloud center trajectories for panel F.
The ‘driftVec’ variables are the hypothetical constant flow that was optimized to minimize the difference between the MTOC and cloud trajectories for Figure 5—figure supplement 1.
- https://cdn.elifesciences.org/articles/60047/elife-60047-fig5-figsupp1-data1-v2.mat
Figure 5—figure supplement 2
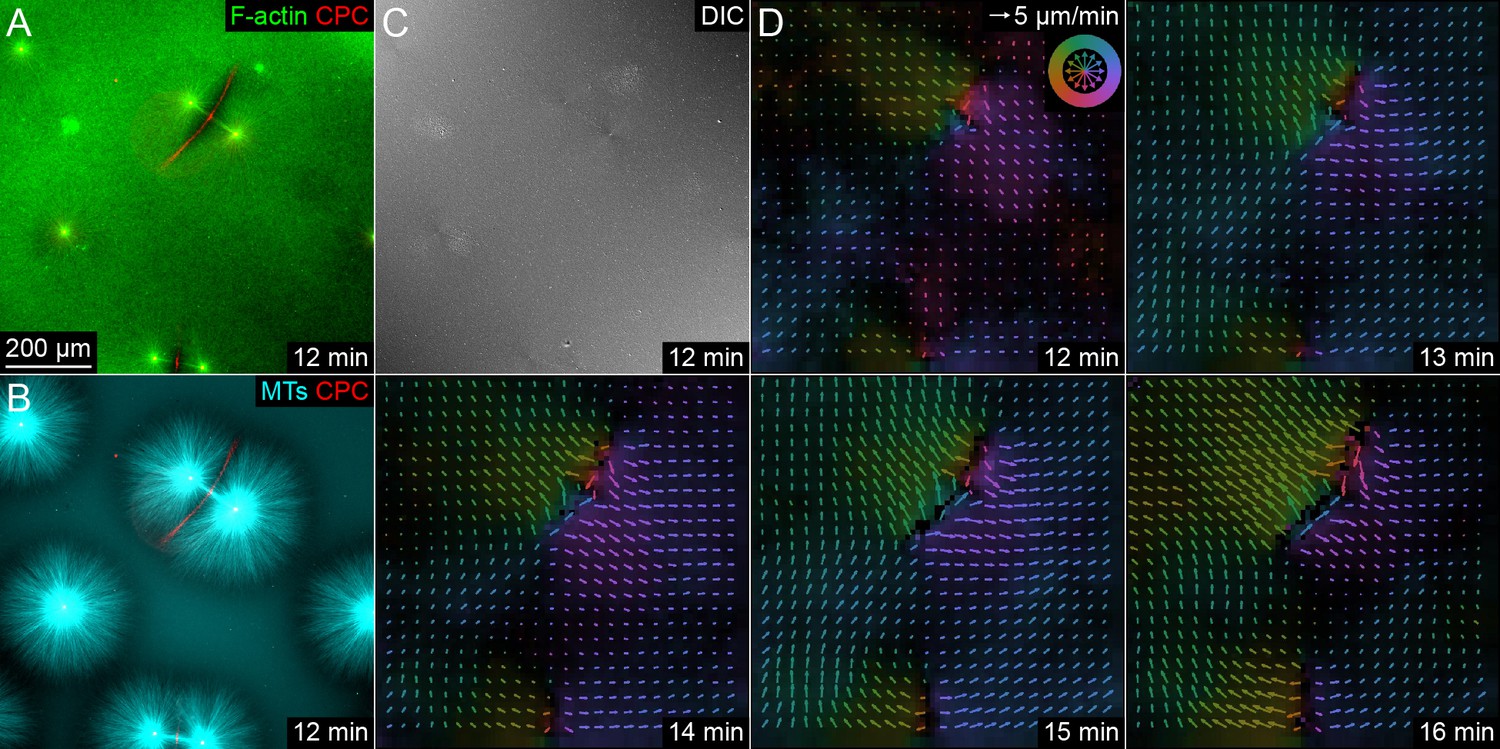
Separating asters exhibited saddle-shaped flow fields, consistent with advection of cytosol by moving asters.
(Related to Figure 5) (A,B) F-actin labeled with Lifeact-GFP, CPC labeled with anti-INCENP-Alexa Fluor 647, and MTs labeled with Tau-mCherry. (C) Differential interference contrast to visualize mitochondria and other small vesicles. (D) Flow fields of the DIC channel estimated by PIV exhibited a saddle shape, with flow along the interaction zone toward the midpoint between the asters. F-actin and MTs exhibited similar flow fields. Color represents direction (legend in upper right of first panel), and brightness represents velocity. Note that arrows are downsampled from full flow fields. Time with respect to warming the sample and the onset of aster polymerization.
Figure 6
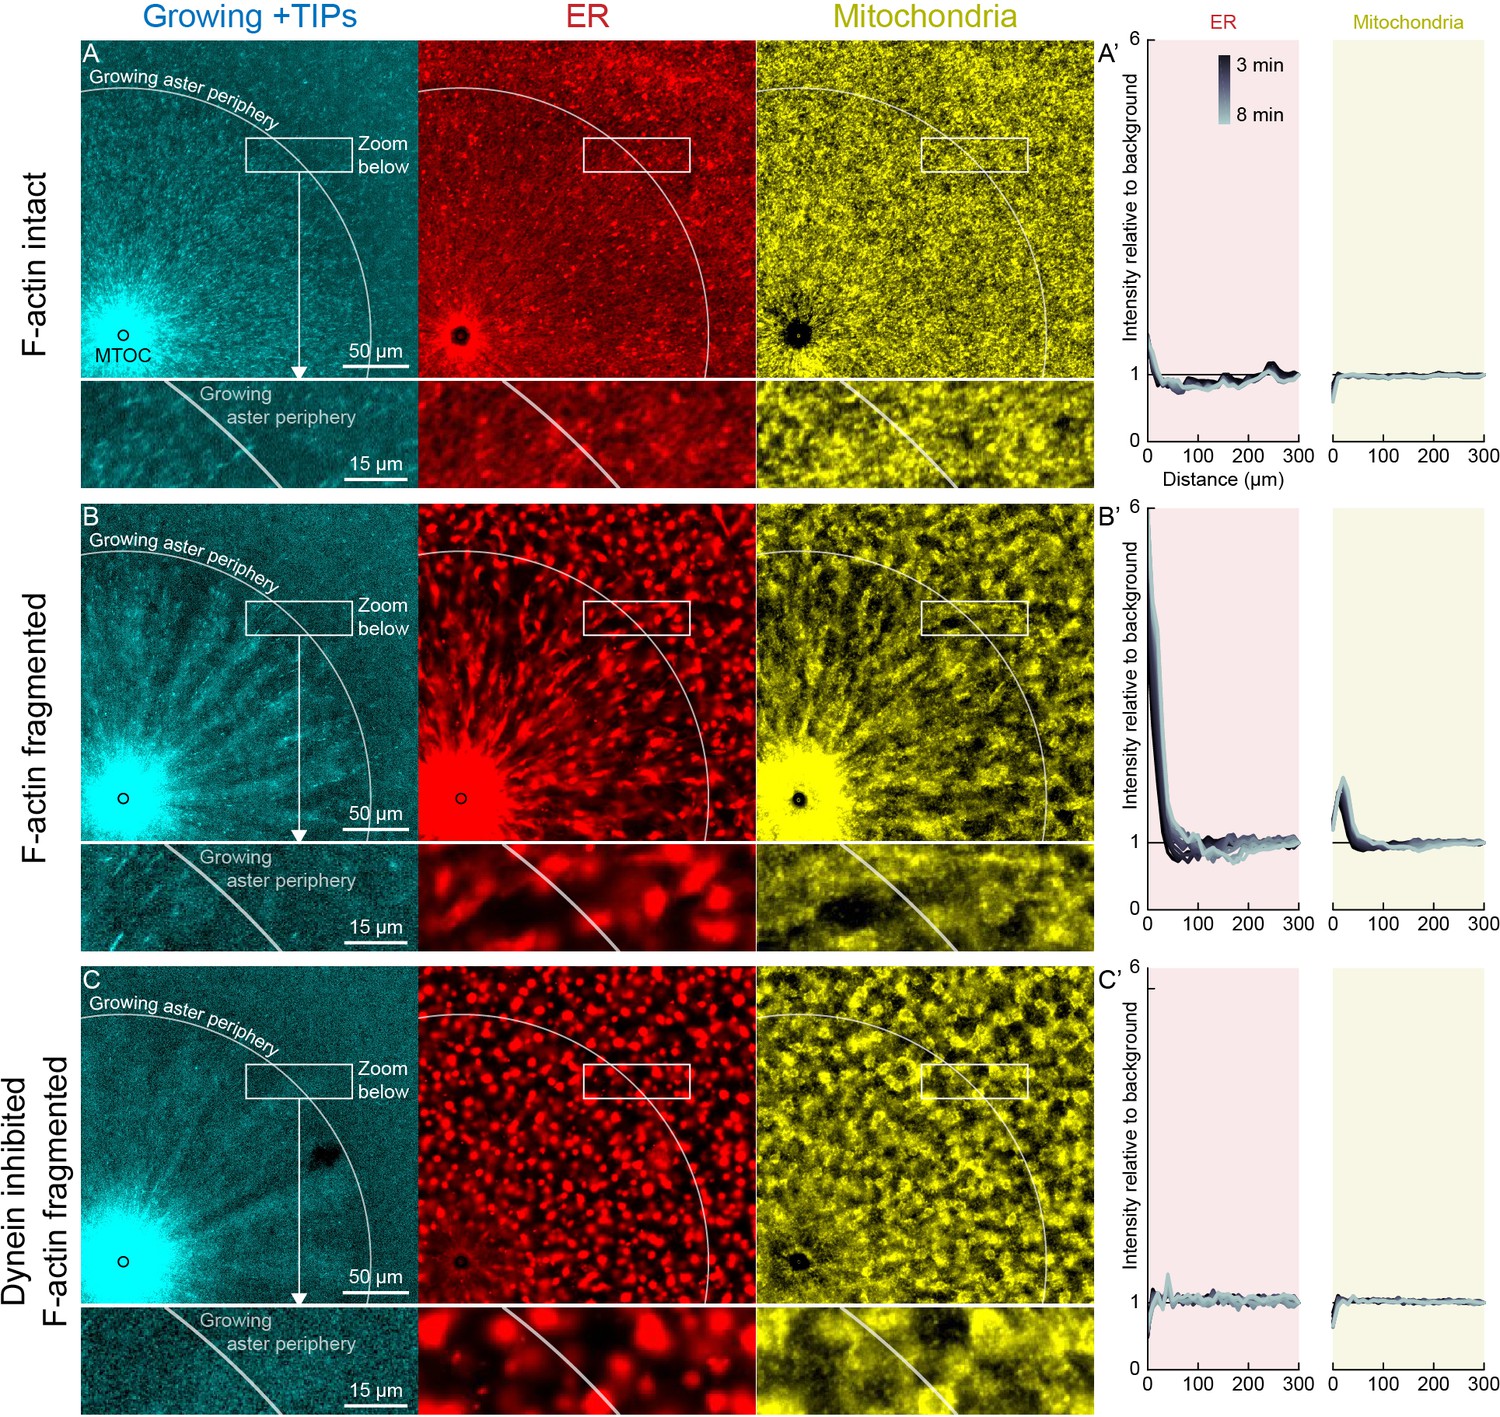
Dynein-mediated organelle movement is restricted by F-actin.
(A) In control with intact F-actin, a small amount of ER became concentrated around the MTOC, but the majority of the ER and mitochondria remained distributed over the aster (see Video 8). The white arc indicates the growing aster periphery, and the box indicates the zoomed region in the lower panels. (A’) Average intensity with respect to distance from the MTOC over time, from black to gray. (B) When F-actin was fragmented with Cytochalasin D, a greater fraction of the ER was transported toward the MTOC, and a fraction of mitochondria was transported as well. Higher magnification: ER started to move when MTs indicated by growing +TIPs first grew into the cytoplasm, and ER and mitochondria co-localized with one another. (C) When dynein was inhibited with p150-CC1, the ER was not transported, neither toward nor away from the MTOC.
-
Figure 6—source data 1
ER and mitochondria intensity profiles for panels A’, B’, and C’.
Intensity profiles were normalized to the average intensity outside the aster to correct for photobleaching.
- https://cdn.elifesciences.org/articles/60047/elife-60047-fig6-data1-v2.mat
Figure 7 with 3 supplements
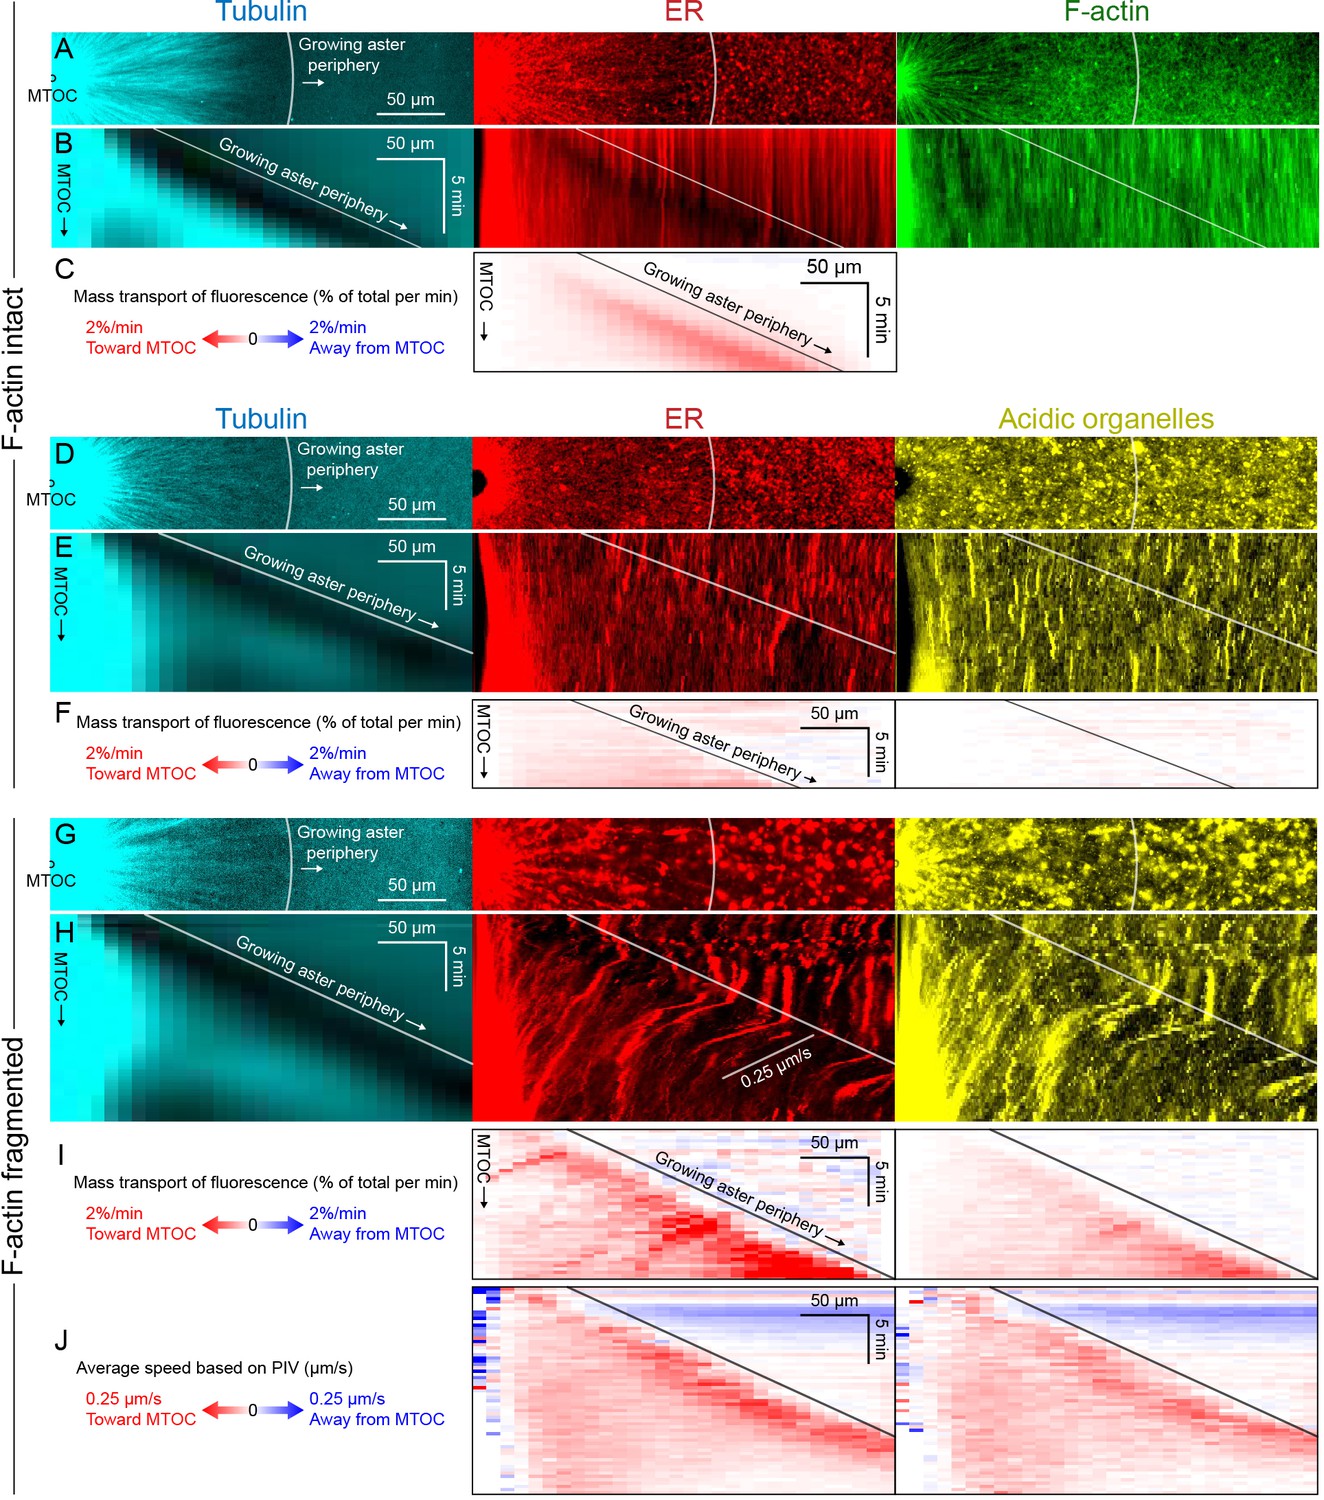
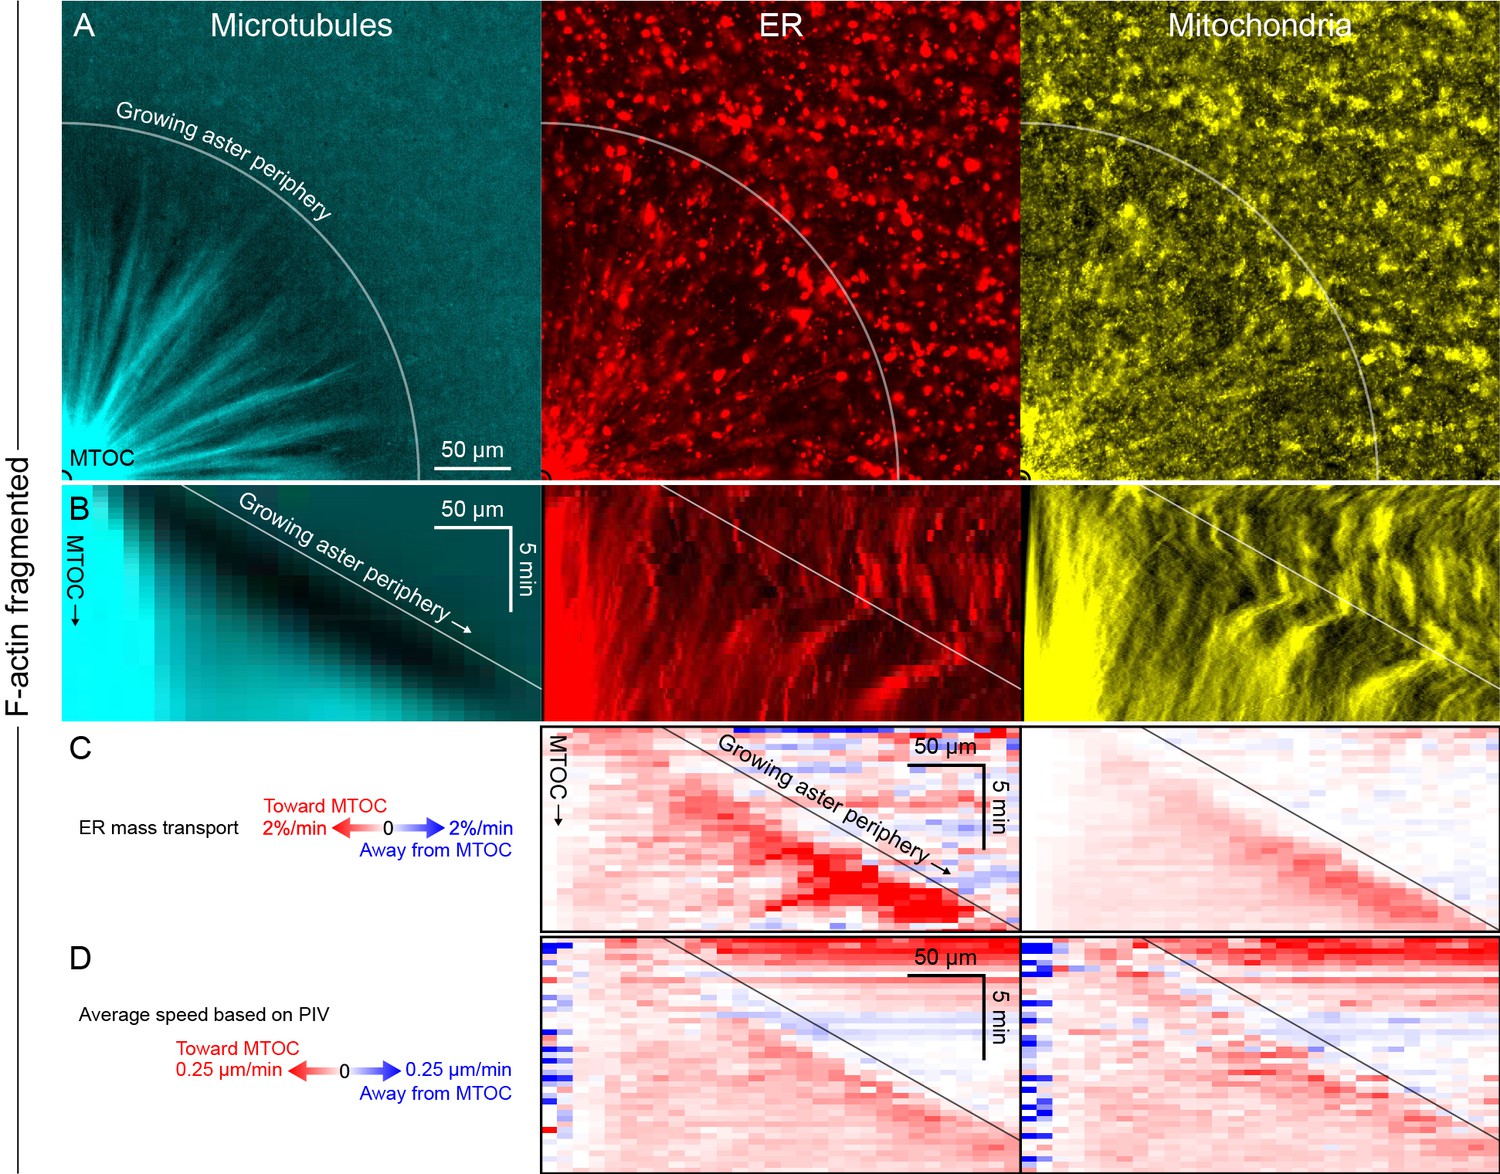
Dynein-mediated organelle movement is maximal on the aster periphery.
(A) Stationary asters were grown from isolated MTOCs. The growing aster periphery is indicated by a white arc, and the ER was largely distributed but slightly depleted just inside the growing aster periphery. The ER exhibited a change in texture from slightly coarser outside the aster to finer inside the aster (see Video 9). (B) Kymographs along a line extending away from the MTOC. The MTOC corresponds to the left column, and the growing aster periphery corresponds to the diagonal line where soluble tubulin is depleted upon incorporation into the growing aster. (C) Mass transport map for ER averaged over a quadrant, in the same frame of reference as the kymographs in panel B. Mass transport analysis is described in Figure 7—figure supplement 2. (D–F) Similar experiment with F-actin intact, in a different batch of extract that exhibited less organelle movement. (G–J) Similar experiment with F-actin fragmented by Cytochalasin D (see Video 10). (J) Average speed based on PIV, in the same frame of reference as panels H,I and averaged over a quadrant. PIV is not shown for control because movement was too slow to be reliably quantified.
-
Figure 7—source data 1
Mass transport maps for panels C, F, and I (in units of % of total per min), and PIV maps for panel J (in µm/s).
- https://cdn.elifesciences.org/articles/60047/elife-60047-fig7-data1-v2.mat
Figure 7—figure supplement 1
Like other organelles, mitochondria exhibited a burst of organelle movement near the growing aster periphery.
(Related to Figures 6 and 7, Video 11) (A) F-actin was fragmented by Cytochalasin D. Microtubules were labeled with tubulin-Alexa Fluor 647, ER with DiD, and mitochondria with TMRE. (B) Kymographs along a line from the MTOC. (C) Mass transport map for ER and mitochondria averaged over a quadrant, in the same frame of reference as the kymographs in panel B. Mass transport analysis is described in Figure 7—figure supplement 2. (D) Average speed based on PIV, in the same frame of reference as panels B and C, and averaged over a quadrant. In all analysis methods, mitochondria behaved similar to acidic organelles and likewise exhibited a burst of movement at the growing aster periphery.
Figure 7—figure supplement 2
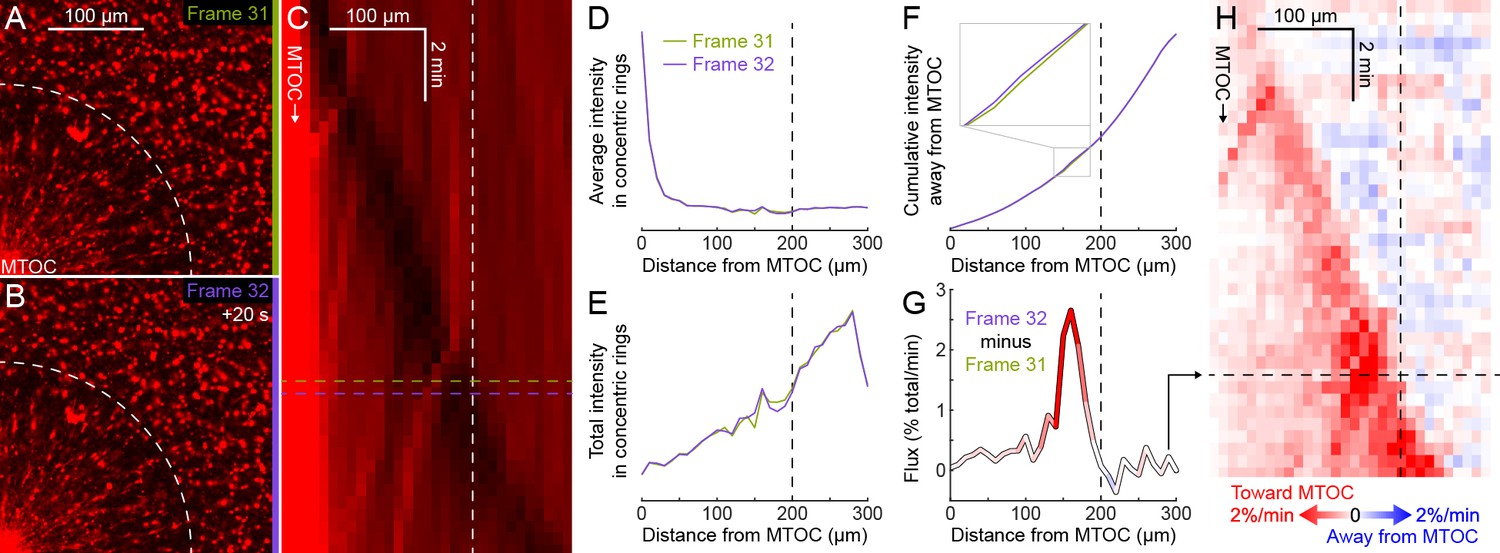
Explanation of flux analysis of organelle transport.
(Related to Figure 7) (A,B) Subsequent frames in a video to measure dynein-based flux of organelles along astral MTs. The flux analysis requires that the region of interest (ROI) contains the entire aster at all times, so there is no transport of organelles into or out of the ROI, just radial redistribution of organelles along astral MTs within the ROI. Images were flat field corrected, then normalized to constant total intensity to correct for photobleaching. (C) Kymograph of average organelle intensity in concentric rings away from the MTOC. Frames 31 (green, panel A) and 32 (purple, panel B) correspond to the rows of the kymograph indicated by horizontal dotted lines. The distance to the aster periphery at this time, indicated by the white dotted arc in panels A and B, is indicated by the vertical white dotted line. (D) Average organelle intensity in concentric rings away from the MTOC. (E) Total intensity in concentric rings away from the MTOC. The total intensity increases roughly linearly with the circumference. (F) Cumulative total intensity away from the MTOC. Zoomed inset shows where the cumulative total intensity at frame 32 most exceeds that at frame 31. (G) Flux of fluorescence intensity toward the MTOC, calculated as the cumulative total intensity at frame 32 minus that at frame 31. Flux was normalized to the percentage of the total fluorescence intensity moving across each bin edge (10 µm) per min. (H) Flux map in the same frame of reference as the kymograph in panel C. Panel G corresponds to the row indicated by the horizontal black dotted line.
Figure 7—figure supplement 3
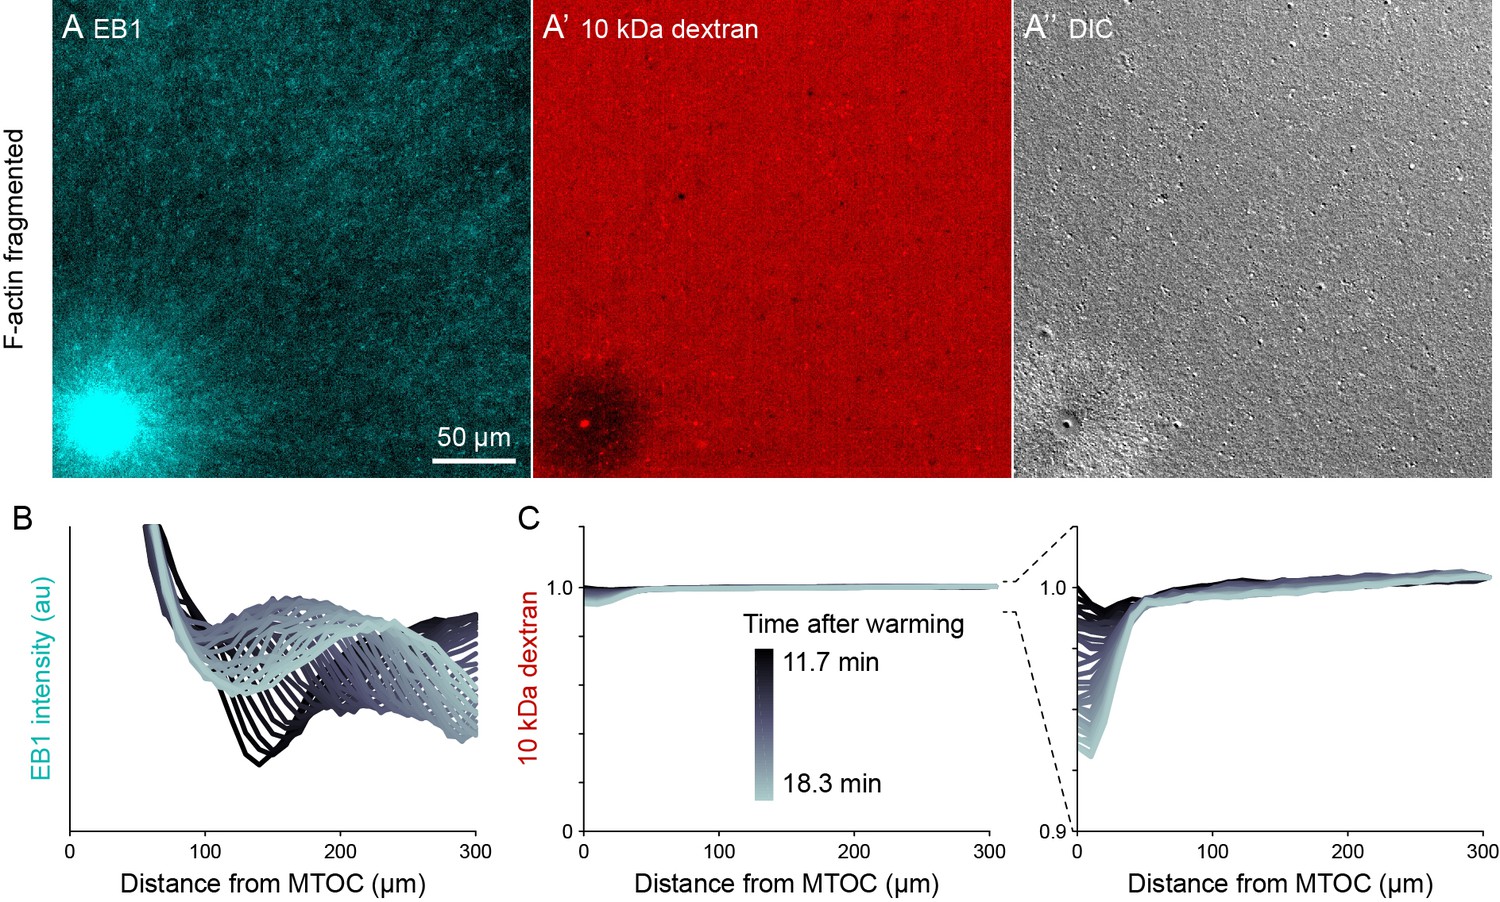
Dextran was excluded in organelle-rich region within ~50 µm of MTOCs.
(Related to Figures 7 and 8, Video 13) (A) The growing +TIPs of MTs were labeled with EB1-GFP, the relative concentration of cytosol was inferred from 10 kDa dextran labeled with Alexa-Fluor 568, and organelles were visualized with differential interference contrast (DIC). Images taken 18.3 min after warming to 20°C and the onset of aster growth. (B,C) Intensity profiles away from the MTOC colored by time point. In the EB1 graph, the wavefront corresponds to the growing aster periphery. To correct for photobleaching, dextran profiles were normalized to the intensity at the point farthest from the MTOC.
Figure 8
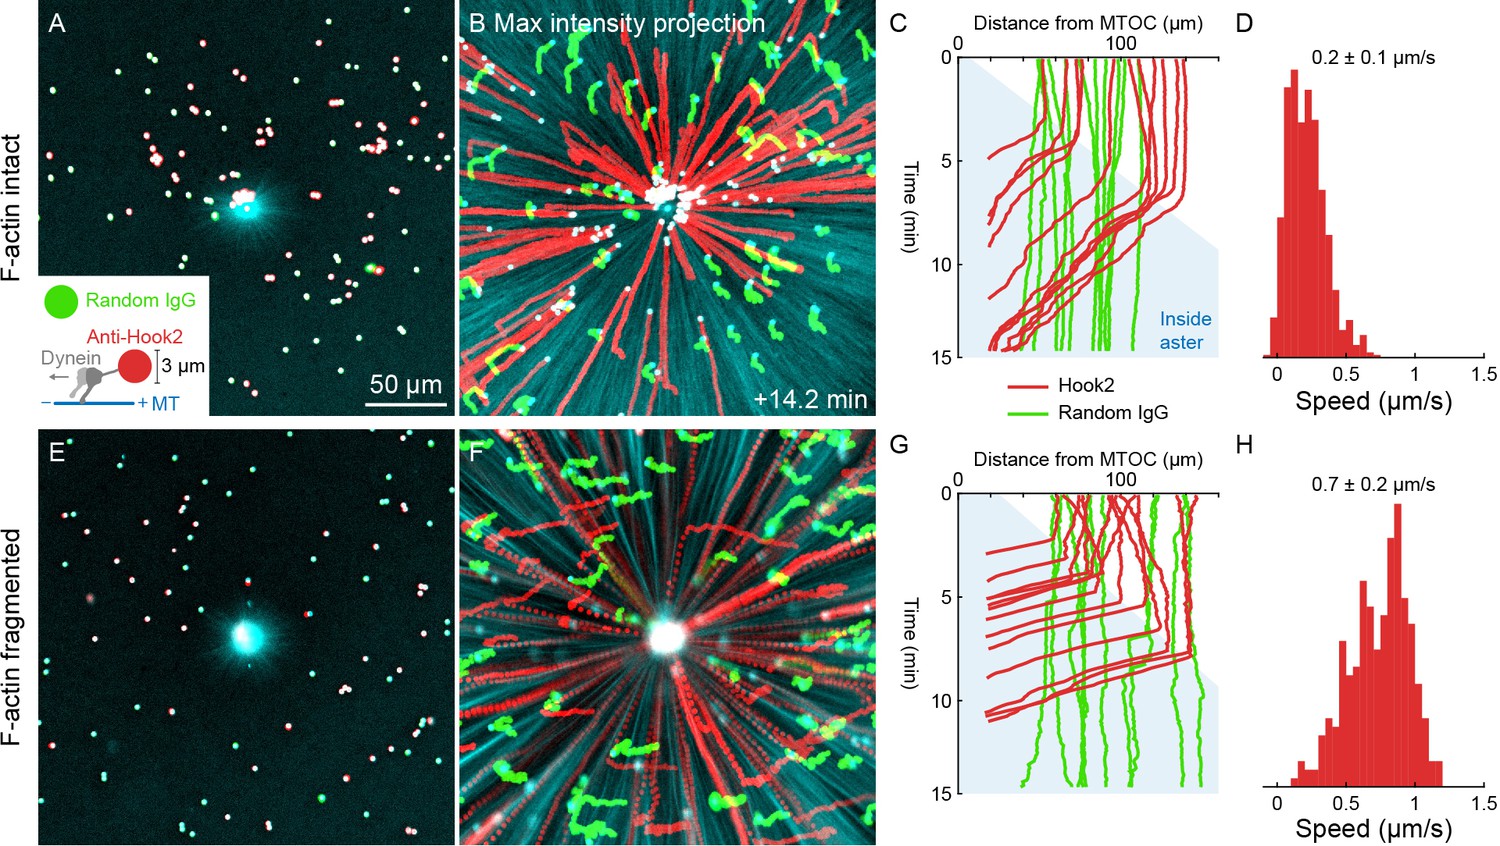
Unlike organelles, artificial cargoes functionalized with dynein move at constant speed throughout asters.
(A) Artificial cargoes were functionalized with an antibody against the dynein adapter HOOK2, and negative control beads were functionalized with random antibody (see Video 12). (B) Max intensity projections of beads functionalized with anti-HOOK2 (red) or random antibody (green). (C) Trajectories of anti-HOOK2 and negative control beads relative to the MTOC. The growing aster is indicated by the blue region. Anti-HOOK2 beads started to be transported when they were engulfed by the growing aster. (D) Velocity distribution of anti-HOOK2 beads inside the aster. (E–H) Similar experiment with F-actin fragmented by Cytochalasin D.
-
Figure 8—source data 1
Bead trajectories for panels C, D, G, and H.
The ‘beads’ variables are structures that contain the bead trajectories in XY, as well as the distance from the MTOC at the aster center. The ‘TinsideAster’ variables are the time index at which beads first enter the aster, which was used to generate the velocity distributions in panels D and H.
- https://cdn.elifesciences.org/articles/60047/elife-60047-fig8-data1-v2.mat
Figure 9
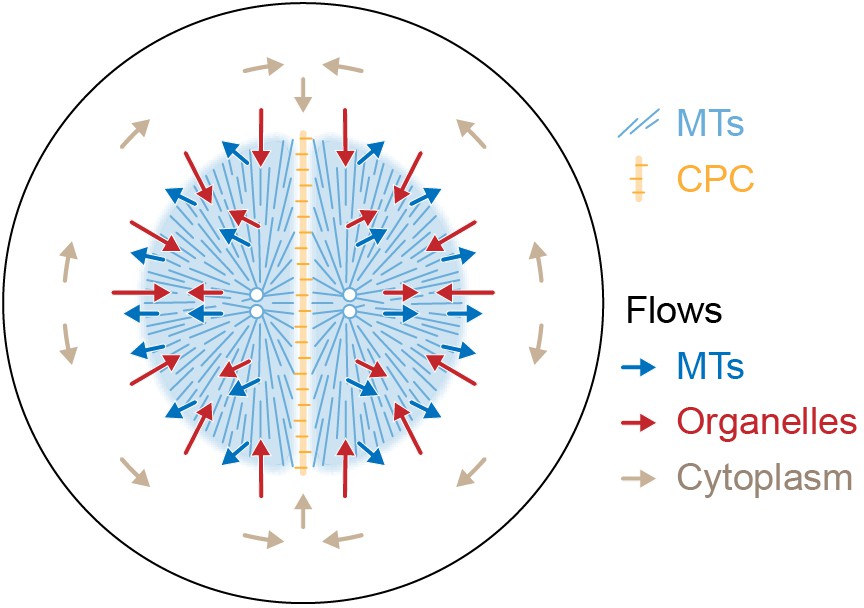
Model for component flows during aster separation movement in frog eggs.
Within moving asters, all cytoplasmic networks move together, advecting cytosol. Near the aster periphery, organelles flow rapidly inwards while MTs flow outwards. Outside the aster, cytosol is displaced around asters and into the midplane by hydrodynamic forces.
Videos
Video 1
Dynamic reorganization of cytoplasmic networks during the initial stages of aster nucleation and growth imaged at 60x.
(Related to Figure 1—figure supplement 1) MTs were labeled with tubulin-Alexa Fluor 647, ER with DiI, and F-actin with Lifeact-GFP. Imaged on a spinning disk confocal with 60x objective lens. Cytoplasmic networks were highly dynamic, and astral MTs dynamically reorganized the ER and F-actin networks. Parts of the ER exhibited abrupt and transient motion toward the MTOC, presumably driven by dynein, and the F-actin transitioned from random to radial entrainment with MTs.
Video 2
Co-movement of MTs, ER, and F-actin during aster separation movement.
(Related to Figures 2A and 3) MTs were labeled with tubulin-Alexa Fluor 647, ER with DiI, F-actin with Lifeact-GFP, and organelles were shown in differential interference contrast (DIC). All cytoplasmic networks moved together. Note the flow of organelles visible in DIC: inside asters, where the density of F-actin, MTs, and ER was higher, organelles flowed with the asters; whereas along interaction zones between asters where the density of F-actin was lower, organelles flowed in the opposite direction, into the space on the right that was vacated by the asters moving to the left.
Video 3
Both dynein and actomyosin contribute to aster separation movement.
(Related to Figure 2) We compared four conditions: control with F-actin intact, dynein inhibited by p150-CC1, F-actin fragmented by Cytochalasin D, and double inhibition of dynein and F-actin. F-actin was labeled with Lifeact-GFP, ER was labeled with DiI, organelles were shown in differential interference contrast (DIC), and CPC-positive interaction zones were labeled with anti-INCENP-Alexa Fluor 647. MTs grew and CPC-positive interaction zones formed between asters in all conditions. F-actin and ER were imaged instead of MTs because local disassembly of F-actin along CPC-positive interaction zones is thought to help aster separation movement, and inward transport of ER and other organelles is thought to drive dynein-based aster movement.
Video 4
Signatures of both co-movement and relative movement in moving asters imaged at 60x.
(Related to Figure 3—figure supplement 1) MTs were labeled with tubulin-Alexa Fluor 647, ER with DiI, and F-actin with Lifeact-GFP. Imaged on a spinning disk confocal with 60x objective lens. All networks were highly dynamic. Some ER and F-actin features moved relative to astral MTs, deformed, or otherwise changed structure, which provide examples where co-movement breaks down on small spatiotemporal scales; however, the dominant trend was co-movement of the networks.
Video 5
Co-movement of MTs, ER, and F-actin during oscillatory aster movement on coverslips functionalized with dynein.
(Related to Figure 4) MTs were labeled with tubulin-Alexa Fluor 647, ER with DiI, and F-actin with Lifeact-GFP. All cytoplasmic networks moved together. Dynein was recruited to coverslips via an antibody to the endogenous dynein adapter HOOK2.
Video 6
Co-movement of keratin with moving asters during oscillatory aster movement.
(Related to Figure 4) MTs were labeled with tubulin-Alexa Fluor 647, F-actin with Lifeact-GFP, and keratin with anti-keratin-Alexa Fluor 568. All cytoplasmic networks moved together.
Video 7
Advection of fluorescein with moving asters during oscillatory aster movement.
(Related to Figure 5) The first frames show MTs labeled with tubulin-Alexa Fluor 647, and the aster filled the region. The next few frames show the caged fluorescein attached to the MTOC. Then, the fluorescein was simultaneously photo-released from the MTOC as its fluorescence was uncaged, releasing a cloud of fluorescent fluorescein around the MTOC. The fluorescein cloud was fit with a 2D Gaussian. The center of the cloud is indicated at the intersection of the red and green lines, and the standard deviation of the cloud is indicated by the black circle. The plots above and to the right indicate the intensity values along the lines, and the black curves show the 2D Gaussian fit along the lines.
Video 8
F-actin reduced dynein-based transport of ER and mitochondria on stationary asters.
(Related to Figure 6) The growing aster is indicated by growing +TIPs labeled with EB1-GFP, ER was labeled with DiI, and mitochondria with TMRE. In control with intact F-actin, some ER accumulated around the MTOC, and little to no mitochondria accumulated around the MTOC. When F-actin was fragmented, a greater fraction of ER and mitochondria were transported toward the MTOC. When dynein was inhibited, organelles were not transported, neither toward nor away from the MTOC.
Video 9
Burst of ER movement at the growing aster periphery in control with F-actin intact.
(Related to Figure 7) MTs were labeled with tubulin-Alexa Fluor 647, ER with DiI, and F-actin with Lifeact-GFP. The ER exhibited a burst of movement toward the MTOC at the growing aster periphery, resulting in transient depletion of the ER intensity near the aster periphery.
Video 10
Burst of ER and acidic organelle movement at the growing aster periphery with F-actin fragmented.
(Related to Figure 7) Transport of ER and acidic organelles with F-actin fragmented by Cytochalasin D. MTs were labeled with tubulin-Alexa Fluor 647, ER with DiD, and acidic organelles with LysoTracker Red. Unlike in control with F-actin intact, the burst of movement near the aster periphery was highly reproducible when F-actin was fragmented with Cytochalasin D.
Video 11
Burst of ER and mitochondria movement at the growing aster periphery with F-actin fragmented.
(Related to Figure 7—figure supplement 1) MTs were labeled with tubulin-Alexa Fluor 647, ER with DiD, and mitochondria with TMRE.
Video 12
Artificial cargoes, Dynabeads functionalized with dynein via anti-HOOK2, were transported at constant speeds throughout asters.
(Related to Figure 8) MTs were labeled with tubulin-Alexa Fluor 488, anti-HOOK2 beads with Fab fragment-Alexa Fluor 568, and negative control beads were functionalized with random rabbit IgG and labeled with Fab fragment-Alexa Fluor 647.
Video 13
Exclusion of 10 kDa dextran from the organelle-rich region around MTOCs.
(Related to Figure 7—figure supplement 3) 10 kDa dextran labeled with Alexa Fluor 568 was excluded in a ~ 50 µm radius around the MTOC.
Video 14
Post-anaphase aster separation movement in a zebrafish embryo consistent with co-movement.
(Related to Figure 9) Video from Wühr et al., 2010 and analyzed with permission. Microtubules were labeled with microtubule-binding domain of Ensconsin fused to three GFPs (EMTB-3GFP) (Faire et al., 1999; von Dassow et al., 2009). Flows of MTs were estimated by PIV (Materials and methods).
Tables
Key resources table
| Reagent type (species) or resource | Designation | Source or reference | Identifiers | Additional information |
|---|---|---|---|---|
| Strain, strain background (Escherichia coli) | Rosetta 2(DE3)pLysS competent cells | Novagen | Cat#: 71401 | Competent cells |
| Strain, strain background (Escherichia coli) | BL21(DE3)pLysS competent cells | Promega | Cat#: L1195 | Competent cells |
| Biological sample (Xenopus laevis adult females) | Eggs | Harvard Medical School Xenopus Colony | http://www.xenbase.org/entry/ | |
| Biological sample (Xenopus laevis adult females) | Egg extracts | Field et al., 2017 | ||
| Biological sample (Bos taurus) | Fluorescently labeled tubulin from bovine brain | Desai and Mitchison, 1998; Miller and Wilson, 2010 | ||
| Biological sample (Xenopus laevis adult females) | Fluorescently labeled tubulin from frog egg extract | Groen and Mitchison, 2016 | ||
| Antibody | Anti-tubulin, clone B-5-1-2. (Mouse monoclonal) | Sigma-Aldrich | Cat#: T6074 RRID:AB_477582 | IHC (1:2000) |
| Antibody | Anti-Xenopus LNPK, raised against cytosolic fragment of LNPK, aa 99–441. (Rabbit polyclonal) | Wang et al., 2016 | IHC (1:1000) | |
| Antibody | Anti-PDIA3 (Rabbit polyclonal) | Boster Bio | Cat#: PB9772 | IHC (1:1000) |
| Antibody | Anti-Xenopus AURKA, raised against full-length protein (Rabbit polyclonal) | Field et al., 2017; Tsai and Zheng, 2005 | IP (3 µL per 50 µL Dynabeads, to saturate Dynabeads) | |
| Antibody | Anti-INCENP, C-terminal peptide immunogen. CAVWHSPPLSSNRHHLAVGYGLKY (Rabbit polyclonal) | Sampath et al., 2004 | IHC (1:1200) | |
| Antibody | Anti-cytokeratin pan, clone C-11 (Mouse monoclonal) | Sigma-Aldrich | Cat#: P2871 RRID:AB_261980 | IHC (1:500) |
| Antibody | Anti-HOOK2, C-terminal peptide immunogen. CSRSHTLLPRYTDKRQSLS (Rabbit polyclonal) | This paper | See Materials and methods, ‘HOOK2 antibody’ and ‘Preparation of dynein on coverslips’ | |
| Antibody | ChromPure rabbit IgG, whole molecule | Jackson ImmunoResearch | Cat#: 011-000-003 RRID:AB_2337118 | IP (1 µL per 50 µL Dynabeads, to saturate Dynabeads) |
| Antibody | Goat anti-rabbit whole serum | Jackson ImmunoResearch | Cat#: 111-001-001 RRID:AB_2337909 | See Materials and methods, ‘Photo-release of fluorescein from MTOCs’ |
| Peptide, recombinant protein | Tau MT-binding domain (mTMBD)-mCherry, E. coli expression | Mooney et al., 2017 | ||
| Peptide, recombinant protein | EB1-GFP, E. coli expression | Nguyen et al., 2014 | ||
| Peptide, recombinant protein | Lifeact-GFP, E. coli expression | Moorhouse et al., 2015; Riedl et al., 2008 | ||
| Peptide, recombinant protein | p150-CC1 fragment of dynactin, E. coli expression | King et al., 2003 | ||
| Peptide, recombinant protein | NeutrAvidin | Thermo Fisher | Cat#: 31000 | |
| Peptide, recombinant protein | Biotinylated Protein A | GenScript | Cat#: M00095 | |
| Commercial assay or kit | 2.8 µm Protein A coated Dynabeads | Thermo Fisher | Cat#: 10002D | |
| Commercial assay or kit | 2.8 µm Protein G coated Dynabeads | Thermo Fisher | Cat#: 10004D | |
| Commercial assay or kit | Protein G UltraLink resin | Thermo Fisher | Cat#: 53125 | |
| Commercial assay or kit | Affi-Prep Protein A resin | Bio-Rad | Cat#: 1560006 | |
| Commercial assay or kit | HisPur cobalt resin | Thermo Fisher | Cat#: 89965 | |
| Commercial assay or kit | Superdex Increase 75 10/300 GL column | GE Healthcare | Cat#: 29-1487-21 | |
| Chemical compound, drug | Formamide | Sigma-Aldrich | Cat#: F9037 | |
| Chemical compound, drug | Benzyl benzoate | Sigma-Aldrich | Cat#: B6630 | |
| Chemical compound, drug | Benzyl alcohol | Sigma-Aldrich | Cat#: 402834 | |
| Chemical compound, drug | IGEPAL CA-630 | Sigma-Aldrich | Cat#: I8896 | |
| Chemical compound, drug | DiI (1,1'-dioctadecyl-3,3,3',3'- tetramethylindocarbocyanine perchlorate, aka DiIC18(3)) | Thermo Fisher | Cat#: D282 | |
| Chemical compound, drug | DiD (1,1'-dioctadecyl-3,3,3',3'- tetramethylindodicarbocyanine perchlorate, aka DiIC18(5)) | Thermo Fisher | Cat#: D307 | |
| Chemical compound, drug | Tetramethylrhodamine, ethyl ester (TMRE) | Thermo Fisher | Cat#: T669 | |
| Chemical compound, drug | LysoTracker Red DND-99 | Thermo Fisher | Cat#: L7528 | |
| Chemical compound, drug | Cytochalasin D | Cayman Chemical | Cat#: 11330 | |
| Chemical compound, drug | Poly-L-lysine-g-polyethylene glycol (PLL-g-PEG) | SuSoS Chemicals | Cat#: [PLL(20)-g[3.5]- PEG(2)] | |
| Chemical compound, drug | Lanolin for VALAP (Vaseline, lanolin, paraffin 1:1:1 by mass) | Sigma-Aldrich | Cat#: L7387 | |
| Chemical compound, drug | Paraffin | Sigma-Aldrich | Cat#: 327204 | |
| Chemical compound, drug | Phenylmethylsulfonyl fluoride (PMSF) | Sigma-Aldrich | Cat#: 78830 | |
| Chemical compound, drug | AlexaFluor-488,–568, −647 NHS ester | Thermo Fisher | Cat#: A20100, Cat#: A20003, Cat#: A20106 | |
| Chemical compound, drug | Caged fluorescein | Mitchison et al., 1998 | ||
| Chemical compound, drug | 1-Ethyl-3-(3-dimethylaminopropyl) carbodiimide (EDC) | Thermo Fisher | Cat#: 22980 | |
| Software, algorithm | Fiji | Schindelin et al., 2012 | RRID:SCR_002285 | |
| Software, algorithm | PIVlab | Thielicke and Stamhuis, 2014 | ||
| Software, algorithm | 2D Gaussian fitting in MATLAB | Nootz, 2020 | ||
| Software, algorithm | Radial mass transport analysis in MATLAB | This paper | See Materials and methods, ‘Analysis of organelle mass transport’ | |
| Other | Extended Liner Tape, thickness 25 µm, for flow cells | 3M | Cat#: 920XL |
Additional files
Download links
A two-part list of links to download the article, or parts of the article, in various formats.
Downloads (link to download the article as PDF)
Open citations (links to open the citations from this article in various online reference manager services)
Cite this article (links to download the citations from this article in formats compatible with various reference manager tools)
Co-movement of astral microtubules, organelles and F-actin by dynein and actomyosin forces in frog egg cytoplasm
eLife 9:e60047.
https://doi.org/10.7554/eLife.60047


