The organizational principles of de-differentiated topographic maps in somatosensory cortex
- Institute for Cognitive Neurology and Dementia Research (IKND), Otto-von-Guericke University Magdeburg, Germany
- German Center for Neurodegenerative Diseases (DZNE), Germany
- Vision and Computational Cognition Group, Max Planck Institute for Human Cognitive and Brain Sciences, Germany
- Center for Behavioral Brain Sciences (CBBS) Magdeburg, Germany
Figures
Figure 1 with 1 supplement
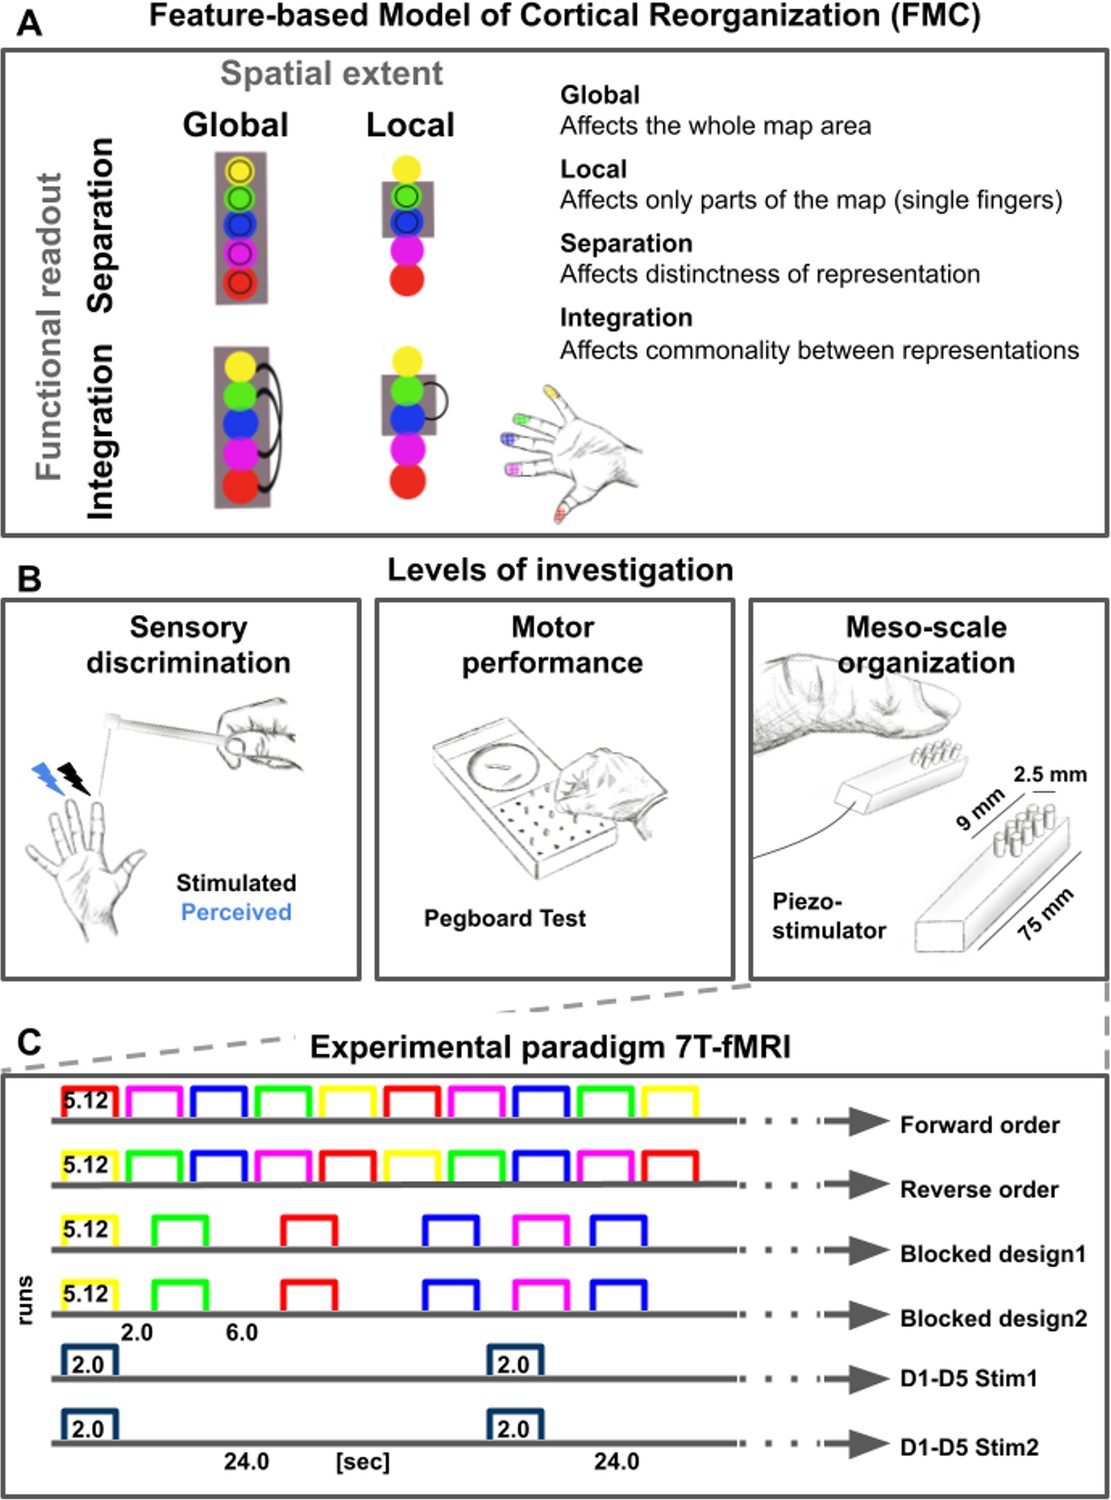
Feature-based characterization of meso-scale topographic maps in younger and older adults using 7T-fMRI and behavioral tests.
(A) A feature-based model of cortical reorganization (FMC) requires a distinction between global and local map changes (factor of spatial extent), and between effects on functional integration versus effects on functional separation (factor of functional readout). (B) Younger and older adults’ somatosensory thresholds were tested via tactile detection, spatial tactile acuity, and digit confusion (left). They were also characterized for individual differences in hand motor behavior using the Purdue Pegboard Test, the Grooved Pegboard Test, and the O’Connor Dexterity Test (middle). Participants underwent 7T-fMRI at a separate testing day, where tactile finger stimulation was applied using piezoelectric stimulators (one module per fingertip, five in total, right). (C) In the 7T-MRI scanner, different stimulation protocols were tested in separate runs (each row represents one run, note that one 5 min resting state run was acquired at the end). See Figure 1—figure supplement 1 for an overview of analyses pipelines.
Figure 1—figure supplement 1
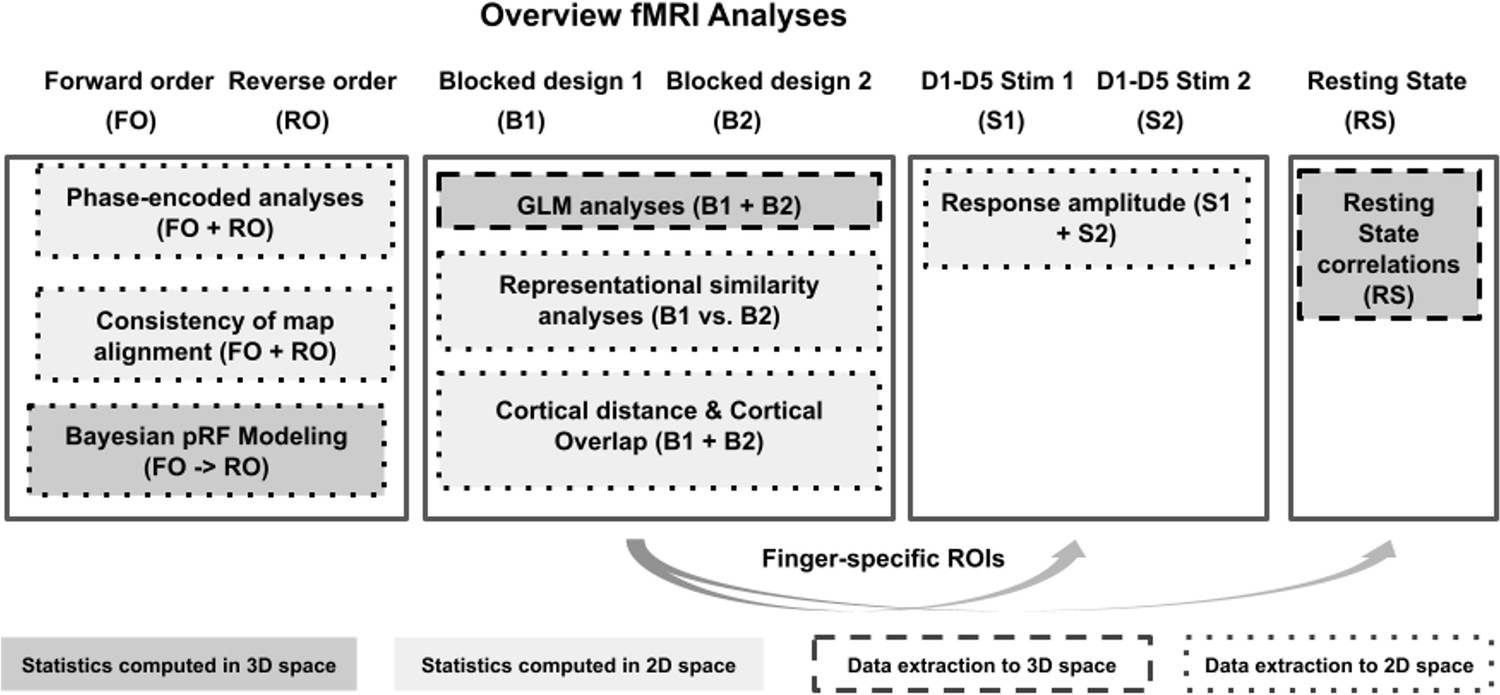
Overview of fMRI analyses.
For an overview of experimental designs used to collect the functional data (first row) see Figure 1. Boxes indicate performed analyses, arrows indicate data transfer across analyses. Different box colors indicate which analyses were performed in 2D space (light gray) or in 3D space (dark gray), different box outlines indicate which analyses were extracted to 2D space (dotted lines) or to 3D space (dashed lines).
Figure 2 with 3 supplements

Surface area and % signal change of area 3b topographic maps do not differ significantly between younger and older adults.
(A) Significant topographic finger maps of younger and older adults averaged separately over the group of younger adults and over the group of older adults. Data are visualized on average surfaces of the current set of subjects (younger/older).White dotted lines show the schematic outline of area 3b. (B) Map dispersion d and Fourier transformed (FT, gray arrow indicates stimulation order) data of significant topographic group maps of younger and older adults (d young: 0.68 ± 0.002, d old: 0.72 ± 0.002). Lower d indicates less stable topographic arrangements over the group. Black dotted lines indicate the area of the significant topographic map. (C) Significant topographic FT maps of each single participant (P1-P36). See Figure 2—figure supplement 1 and Figure 2—figure supplement 3 for zoomed-in views of individual maps. (D,H) Response amplitudes (in %) of topographic maps (D) and of individual fingers (H) in area 3b compared between younger and older adults (mean ± SE and individual data). (E,I) f-values of topographic maps (E) and of individual fingers (I) in area 3b compared between younger and older adults (mean ± SE and individual data). (F,G,J) Surface area of topographic maps of area 3b of younger and older adults; values extracted from original (F) and resampled (G) surfaces of the topographic maps, and of individual fingers (J) (mean ± SE and individual data). Shown are data of n = 19 younger adults and n = 17 older adults. See Figure 2—figure supplement 3 for significant differences in response amplitudes between younger and older adults during fixed amplitude stimulation.
Figure 2—figure supplement 1
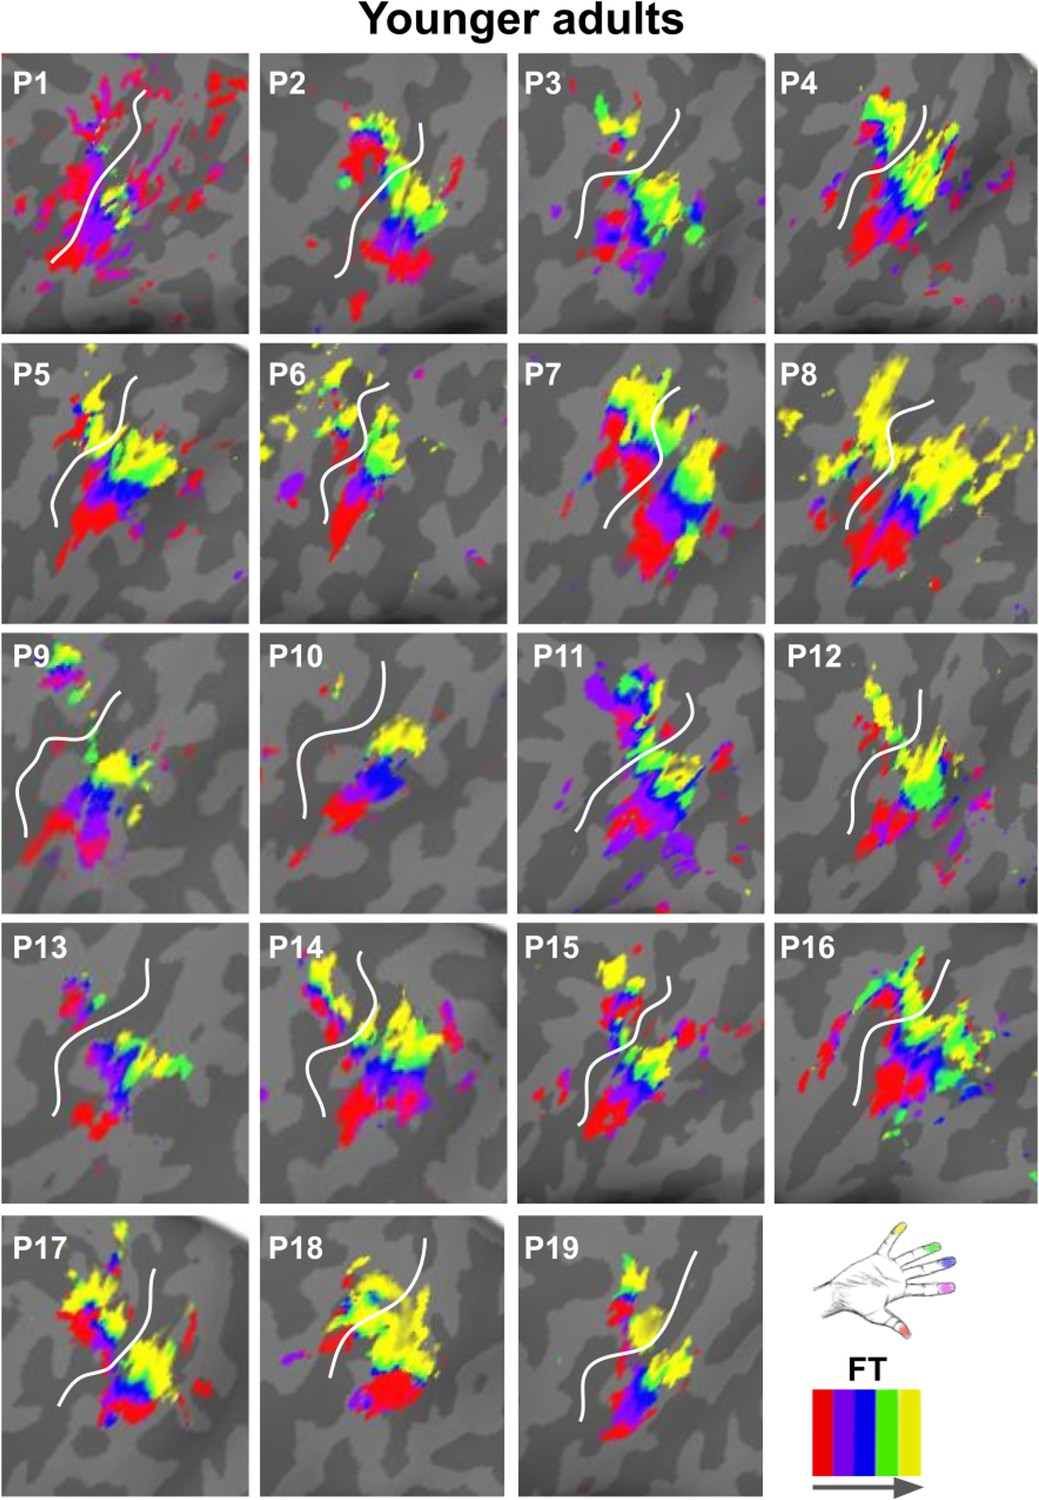
Zoomed-in topographic maps of younger adults.
Significant topographic FT maps of each single younger participant (P1–P19).
Figure 2—figure supplement 2
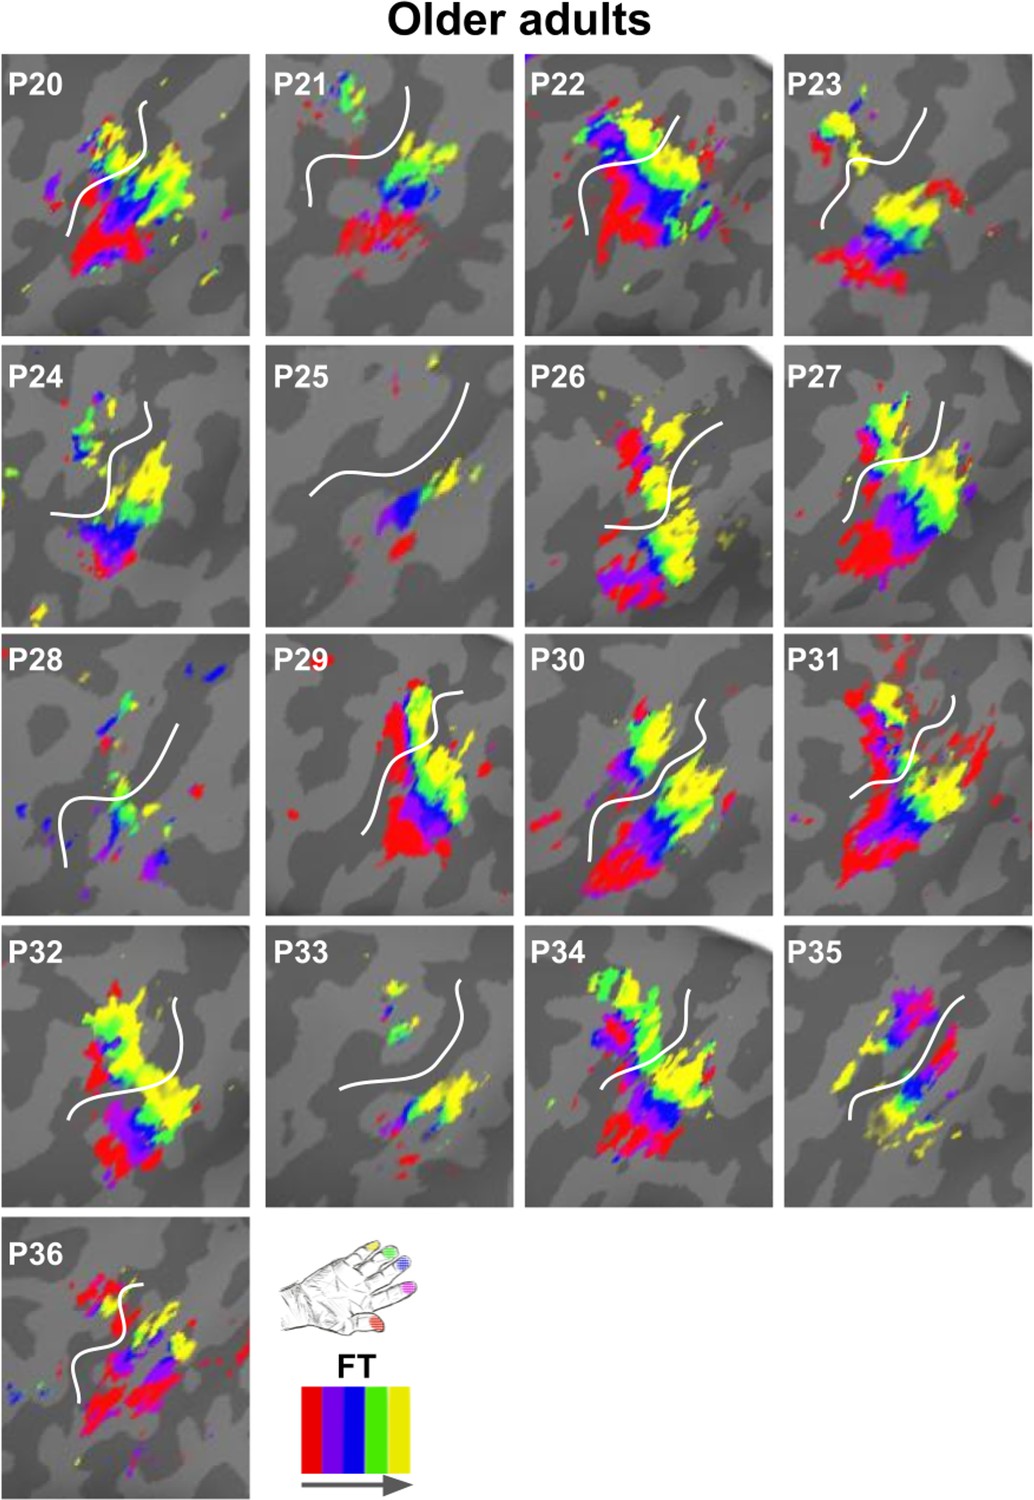
Zoomed-in topographic maps of older adults.
Significant topographic FT maps of each single older participant (P20–P36).
Figure 2—figure supplement 3

Tactile detection thresholds and response amplitudes during fixed amplitude stimulation in younger and older adults.
(A) Detection thresholds (mean ± SE and individual data) for younger and older adults, separately for each digit (D1–D5). The initially obtained stimulus intensities for each digit, representing the tactile detection thresholds, were logarithmically transformed (log100.1mg) before proceeding with further analysis. For the ANOVA with the factors digit and age on tactile detection thresholds, we obtained a main effect of digit (F(4,192)=9.81, p<0.001), a main effect of age (F(1,38)=48.56, p<0.001), and an interaction between age and digit (F(4,192)=5.16, p<0.01). Post hoc tests revealed that the main effect of digit was due to higher detection threshold for D1 compared to D4 (t(88.82) = 2.58, p<0.05), for D1 compared to D5 (t(91.97) = 2.49, p<0.05), for D2 compared to D4 (t(98)=2.42, p<0.05), and for D2 compared to D5 (t(98)=2.33, p<0.05). The main effect of age was due to significantly higher detection thresholds for older compared to younger adults (younger: mean = 0.80 ± 0.04, older: mean = 1.37 ± 0.07, t(35.83) = 6.97, p<0.001). (B) Response amplitudes of the area 3b finger map in response to maximal (and identical) amplitude stimulation to all fingers of the right hand at once. Older adults showed significantly higher response amplitudes compared to younger adults (younger: 1.05 ± 0.01, older: 1.08 ± 0.008, t(34)=-2.10, p<0.05). (C) Correlations between detection thresholds (see A) and response amplitudes (see B) within the groups of younger and older adults were not significant (i.e. p>0.15).
Figure 3 with 2 supplements
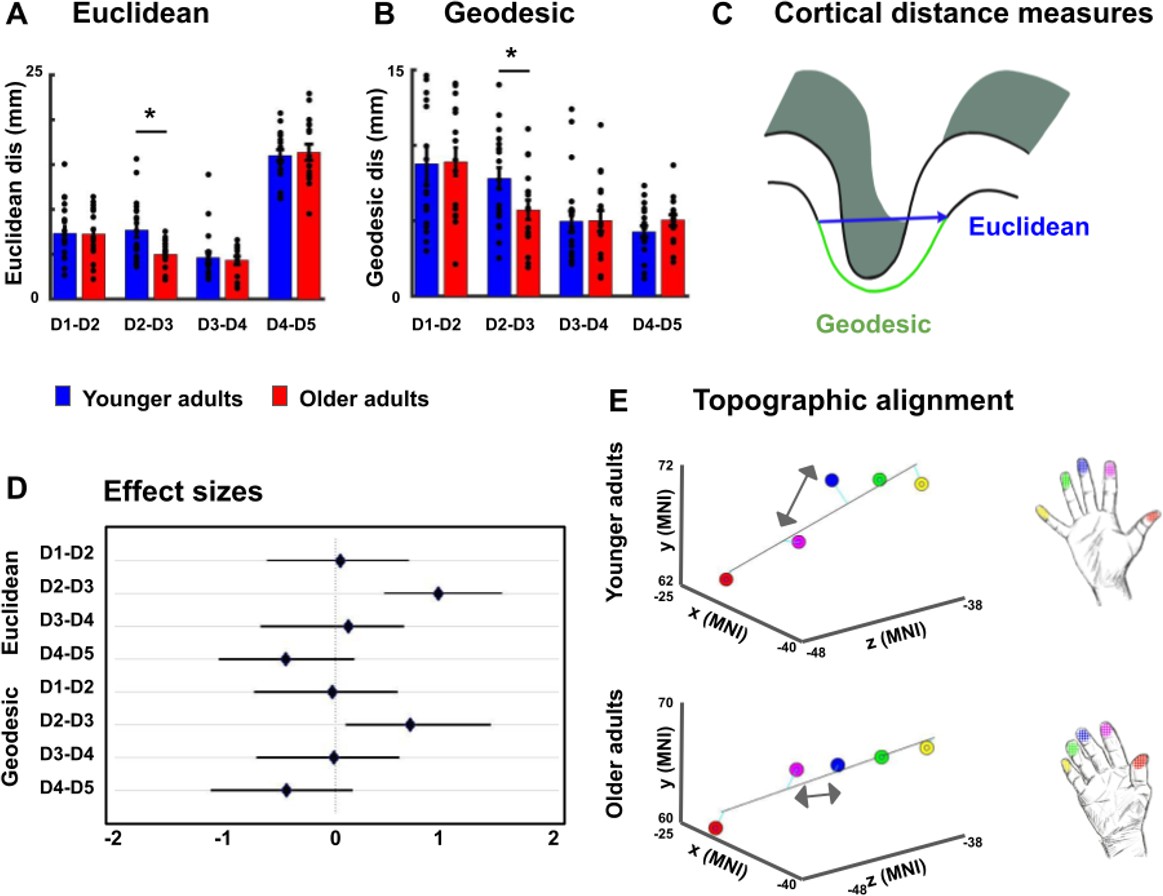
Reduced cortical distances between representations of D2 and D3 in older adults.
(A, B) Cortical distances between digit representations in younger and older adults estimated as total (Euclidean) distance (A) and as surface-based (geodesic) distance (B) (mean ± SEM and individual data) (C) Schematic visualization of cortical distance measures. (D) Effect sizes (Hedge’s g and 95% confidence intervals) for Euclidean and geodesic distances. (E) Spatial alignment of younger adults’ (top) and older adults (bottom) digit representations in area 3b displayed in the MNI coordinate system. Line represents linear fit, arrows highlight significant differences in cortical distance between younger and older adults. Shown are data of n = 19 younger adults and n = 17 older adults. See Figure 3—figure supplement 1 for individual plots, and Figure 3—figure supplement 2 for cortical distances using center estimates.
Figure 3—figure supplement 1
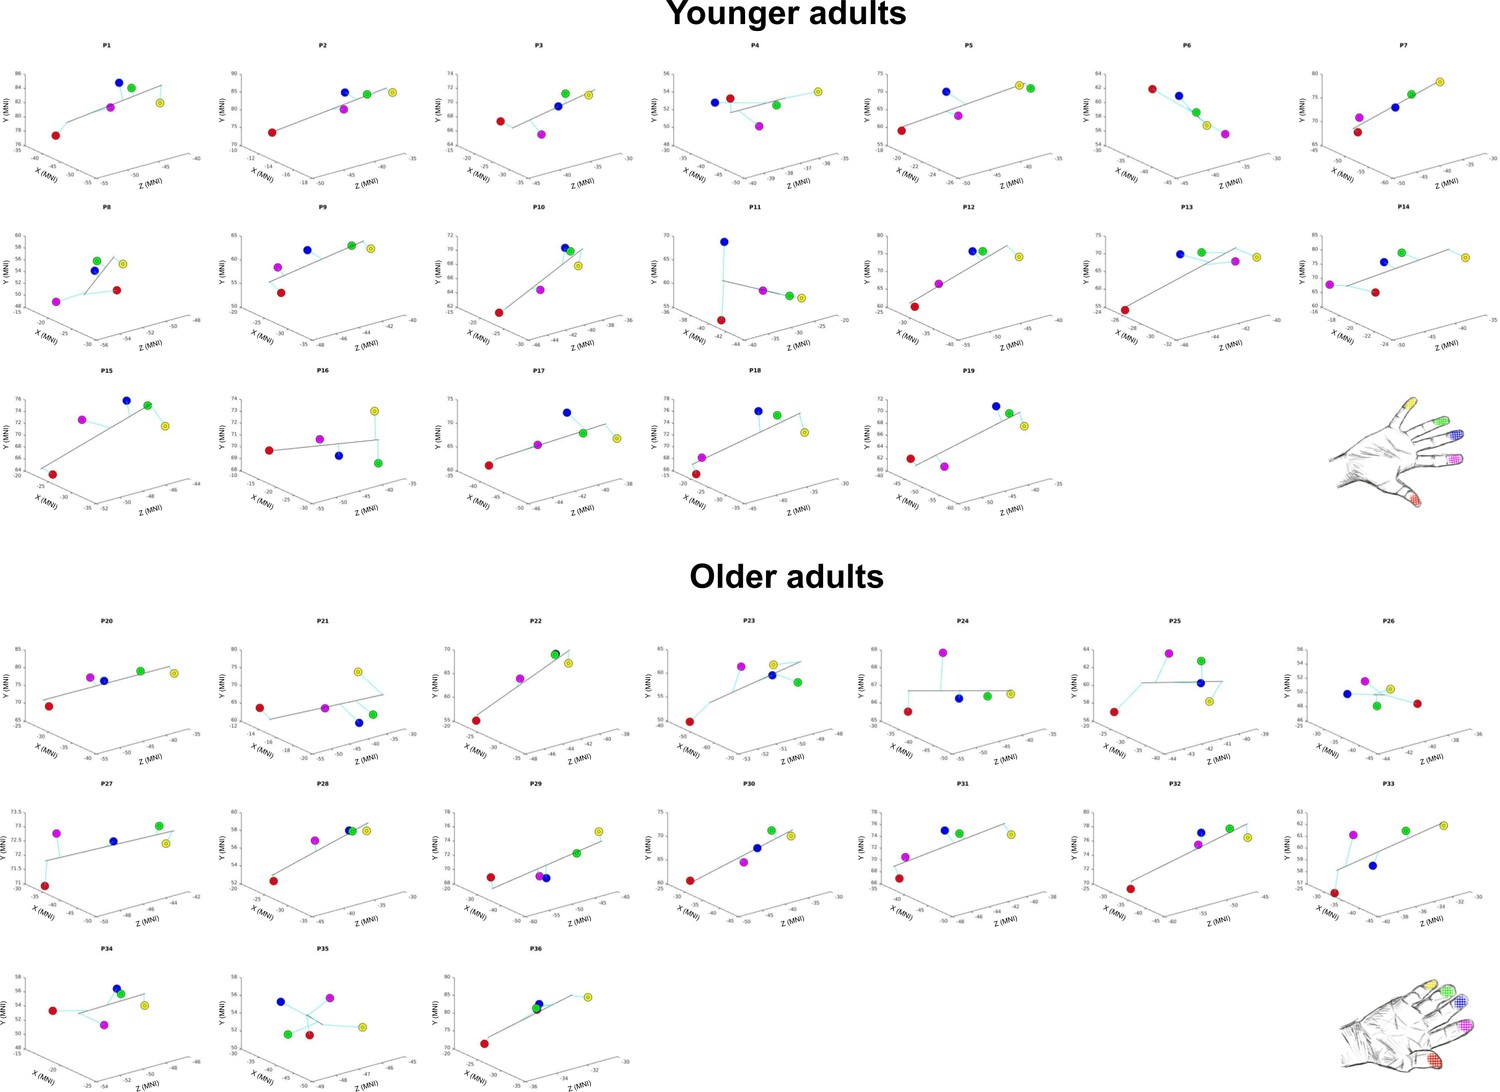
Spatial alignment of individual maps.
Spatial alignment of younger adults’ (top) and older adults (bottom) digit representations in area 3b displayed in the MNI coordinate system. Line represents linear fit.
Figure 3—figure supplement 2
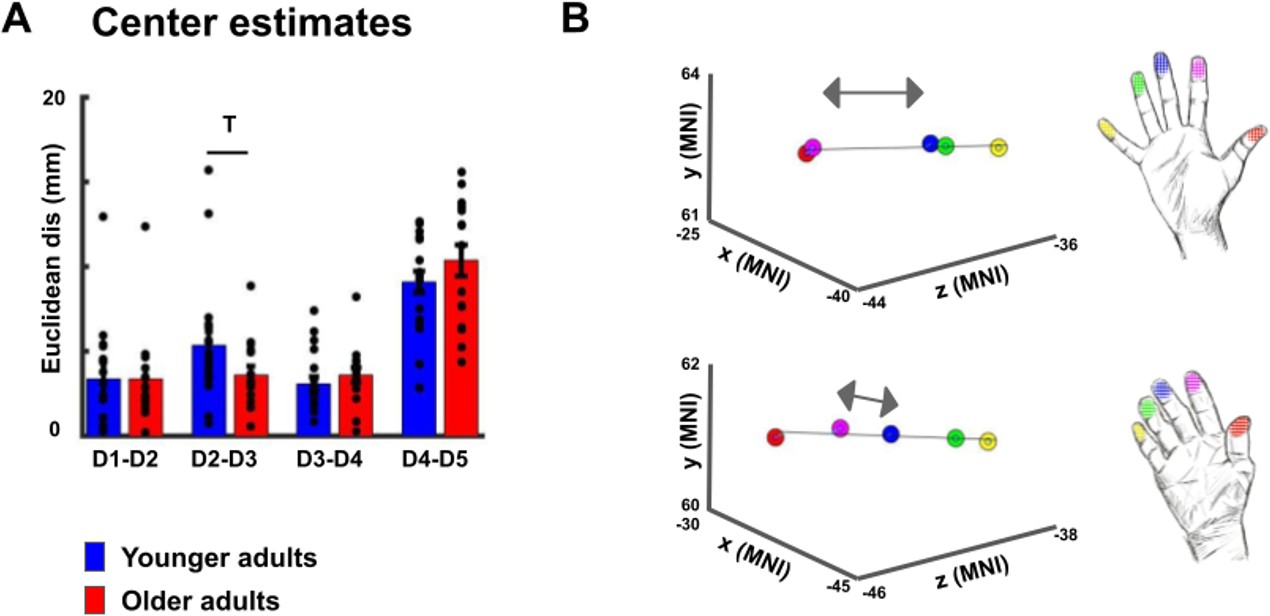
Cortical distances based on center estimates.
(A,B) When using center estimates instead of peak vertices as measure for cortical distance, t-tests revealed a trend toward a significant difference in Euclidean distance between D2 and D3 (D2-D3 younger: 5.34 mm ±0.83 mm, older: 2.62 mm ±0.67 mm, p=0.099), and no trend or significant difference for the other finger pairs (D1-D2 younger: 3.38 mm ±0.69 mm, older: 3.36 mm ±0.70 mm, p=0.98; D3-D4 younger: 3.09 mm ±0.41 mm, older: 3.59 mm ±0.45 mm, p=0.41; D4-D5 younger: 9.09 mm ±0.64 mm, older: 10.36 mm ±0.92 mm, p=0.25). Power analyses revealed that a significant effect for the D2-D3 distance would be obtained with slightly higher sample sizes (n = 20 for each group to reach p<0.05 and power of 80%).
Figure 4 with 3 supplements
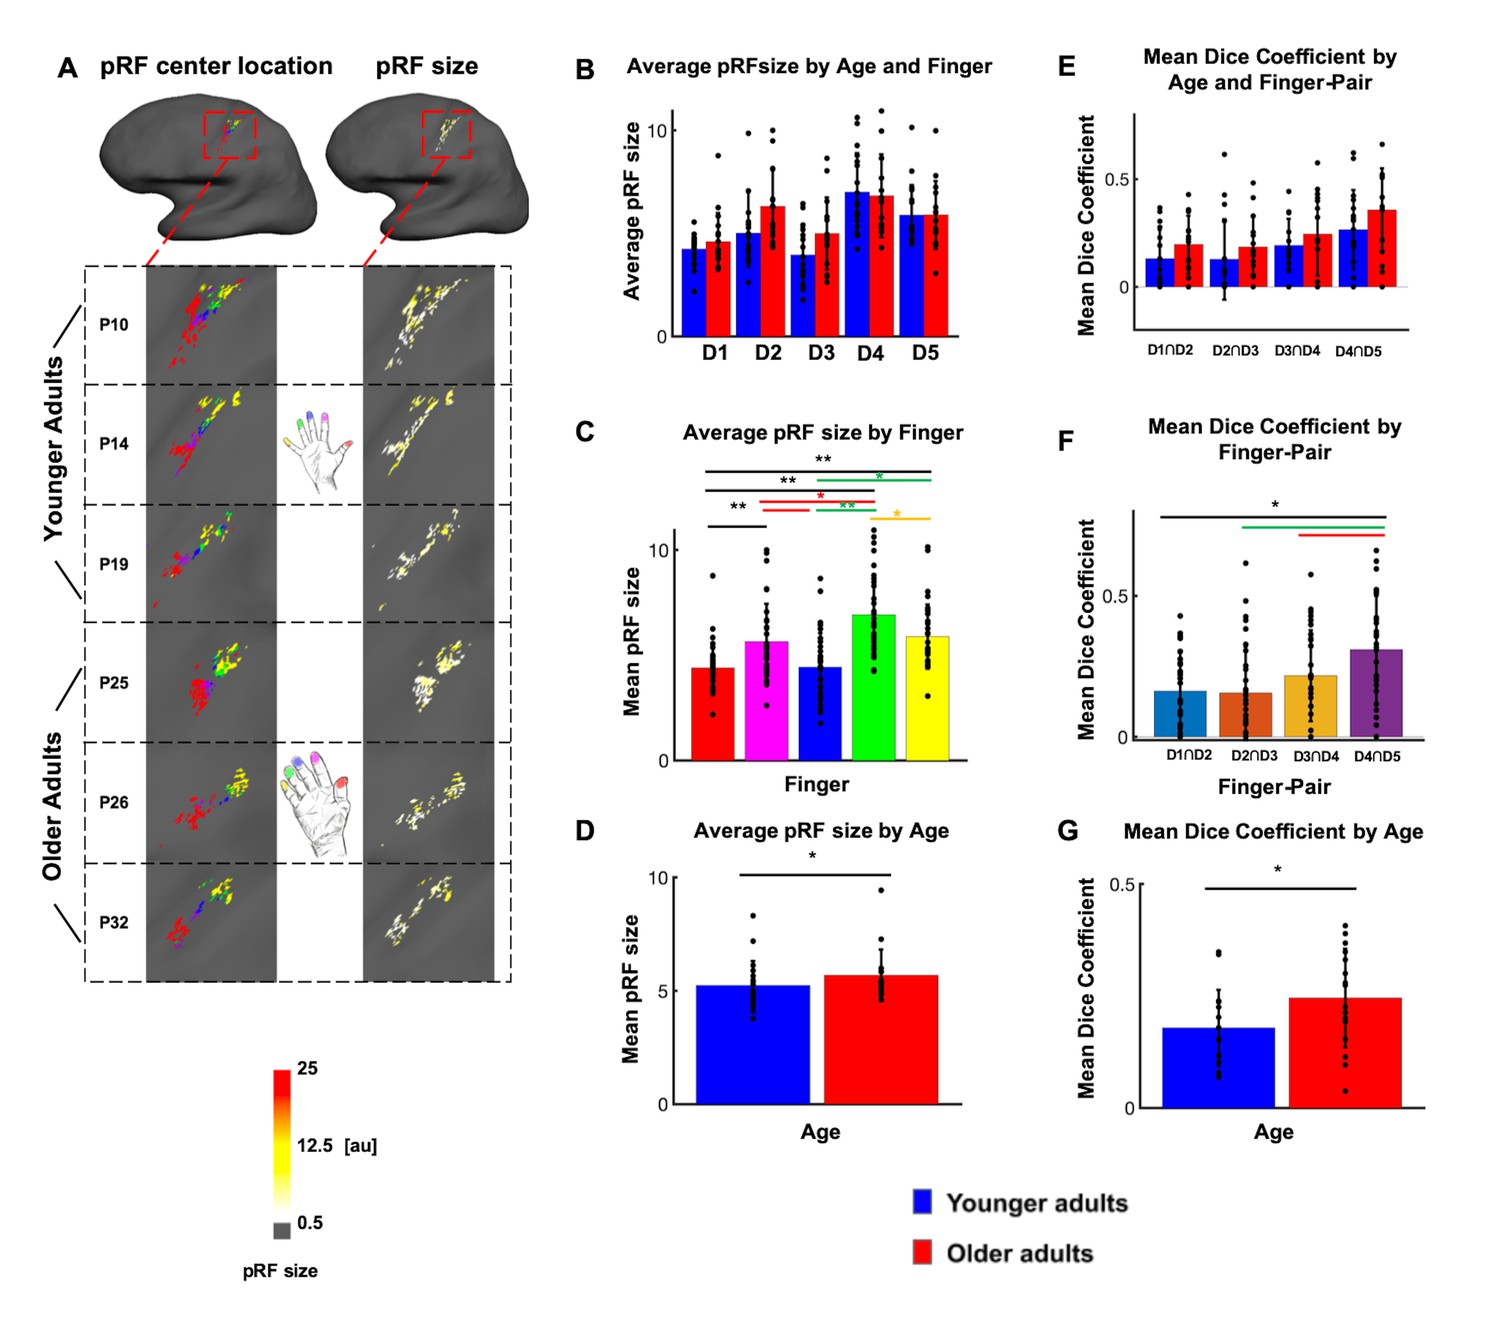
Larger population receptive field (pRF) sizes in older adults compared to younger adults.
(A) pRF centre locations (which encode each individual finger, left column) and pRF sizes (which encode the estimated pRF size of each finger representation, right column) shown for six individual participants (randomly chosen, participant numbers same as in Figure 2, see Figure 4—figure supplement 1 for all individual data and a comparison to the Fourier transformed maps shown in Figure 2). (B) Average pRF sizes for each finger for younger and older adults (mean ± SEM and individual data). (C) Visualization of significant main effect of finger for pRF sizes (mean ± SEM and individual data). (D) Visualization of significant main effect of age for pRF sizes (mean ± SEM and individual data). Correlations between pRF sizes and cortical distances, motor behavior and tactile discrimination performance are shown in Figure 4—figure supplement 2. Shown are data of n = 19 younger adults and n = 17 older adults. (E) Mean dice coefficients for each finger pair for younger and older adults (mean ± SEM and individual data). (F) Visualization of significant main effect of finger-pairs for dice coefficient (mean ± SEM and individual data). (G) Visualization of significant main effect of age for dice coefficient (mean ± SEM and individual data).
Figure 4—figure supplement 1
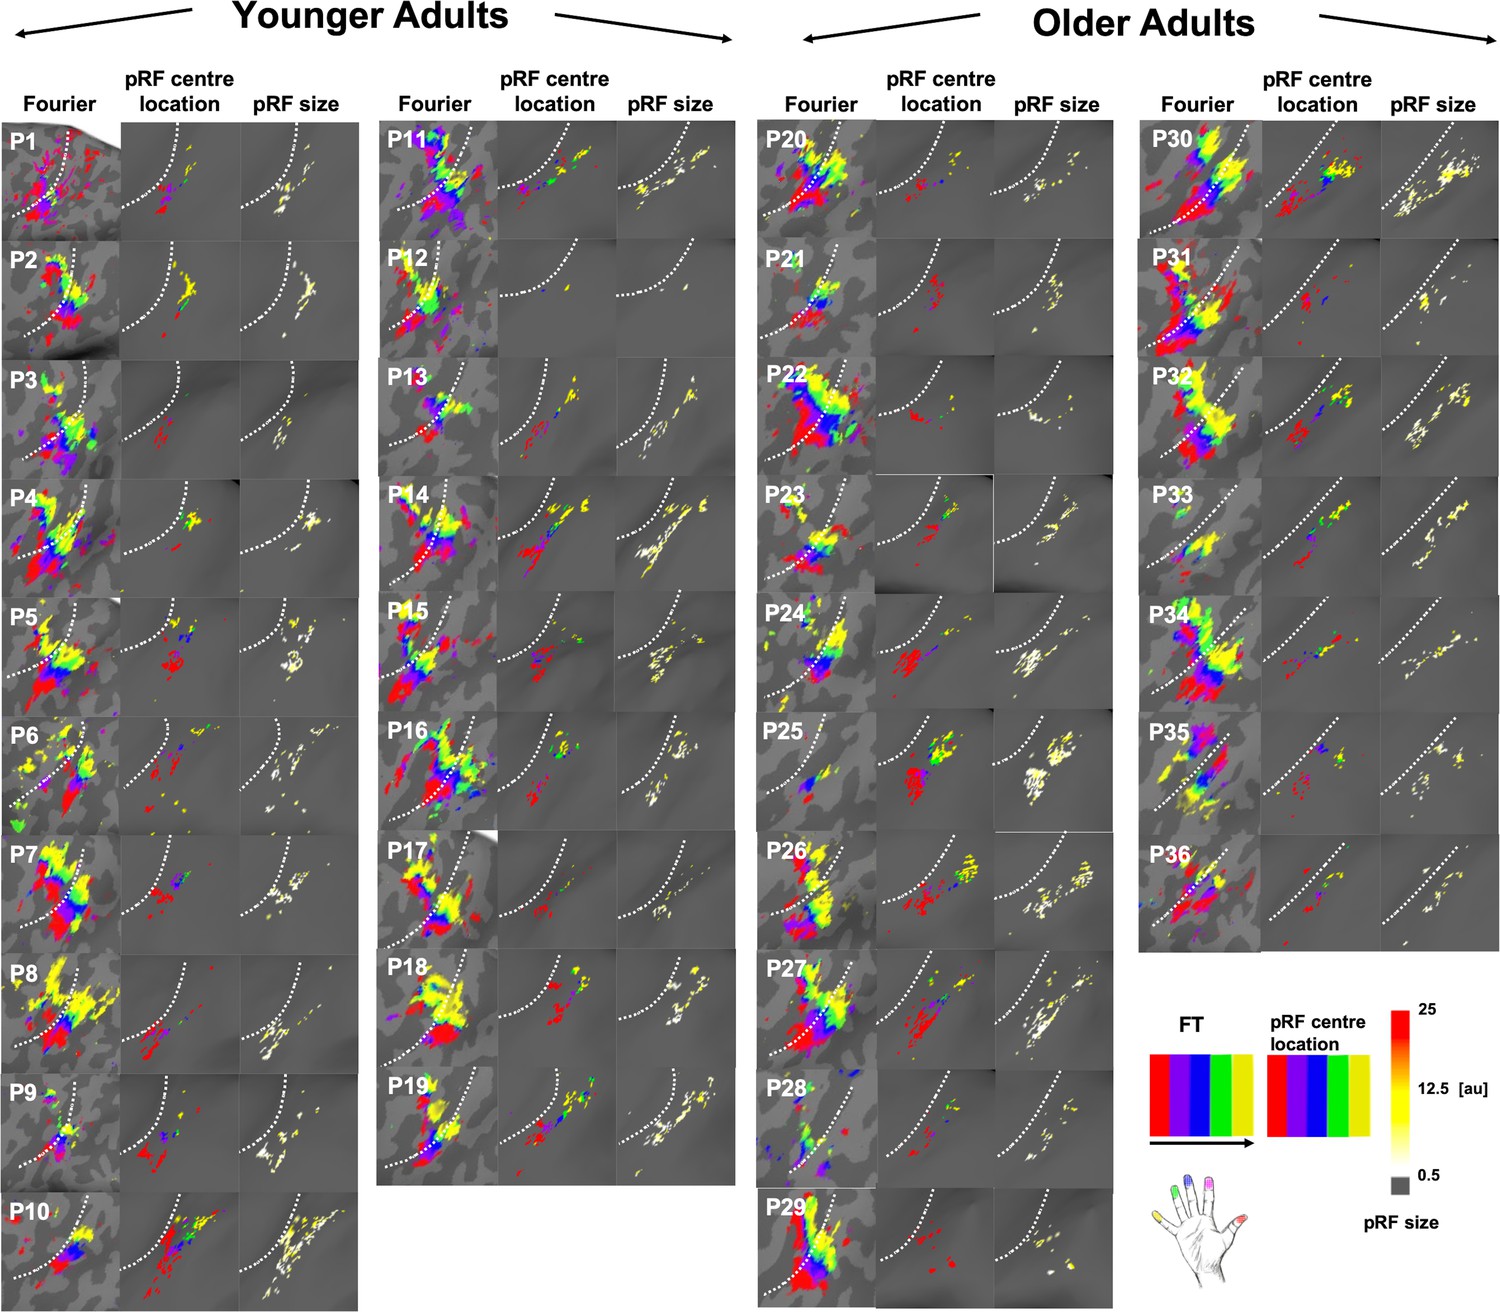
Comparison between Fourier-based topographic maps and pRF-based topographic maps for each younger and each older adult.
Fourier-based topographic maps (left column within each column group) were created with Fourier transformed (FT) data sensitive to frequency and phase. The black arrow indicates stimulation order. pRF-based topographic maps (middle column within each column group) and pRF sizes (right column within each column group) were created using Bayesian pRF modeling. Note that for both topographic maps, the same color scales were chosen for an easy visual comparison (red, purple, blue, green and yellow for D1-D5), even though the analyses pipelines were different. The white-dash line indicates the border between BA 3a and 3b. The color scale for pRF size indicates pRF size for each participant falls within the range between 0.5 to 25 (arbitrary units = au).
Figure 4—figure supplement 2

Correlations between average pRF size and functional and behavioral variables.
Shown are correlations within the group of younger adults and within the group of older adults between average pRF sizes across fingers and the following variables: (A) cortical distances: Euclidean distance and geodesic distance, (B) behavioral measures: time to complete the Purdue Pegboard Test (in s) and time to complete the Grooved Pegboard Test (in s), and correlation between pRF size of D2 and (C) two-point discrimination (2PD) thresholds (given in mm).
Figure 4—figure supplement 3
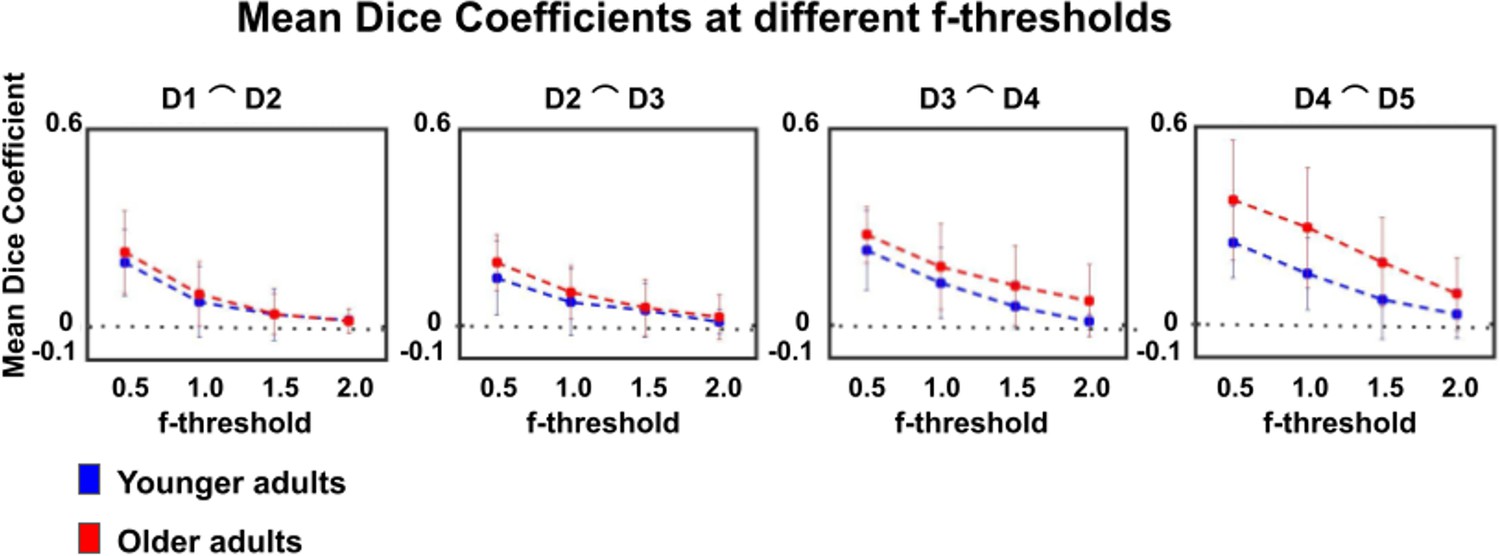
Dice coefficients at different statistical thresholds in younger and older adults.
Visualization of dice coefficient (mean ± SEM) at different f-thresholds (f > 0.5, f > 1.0, f > 1.5, f > 2.0) within the group of younger and older adults.
Figure 5 with 2 supplements
Lower representational similarity between distant finger representations in older adults.
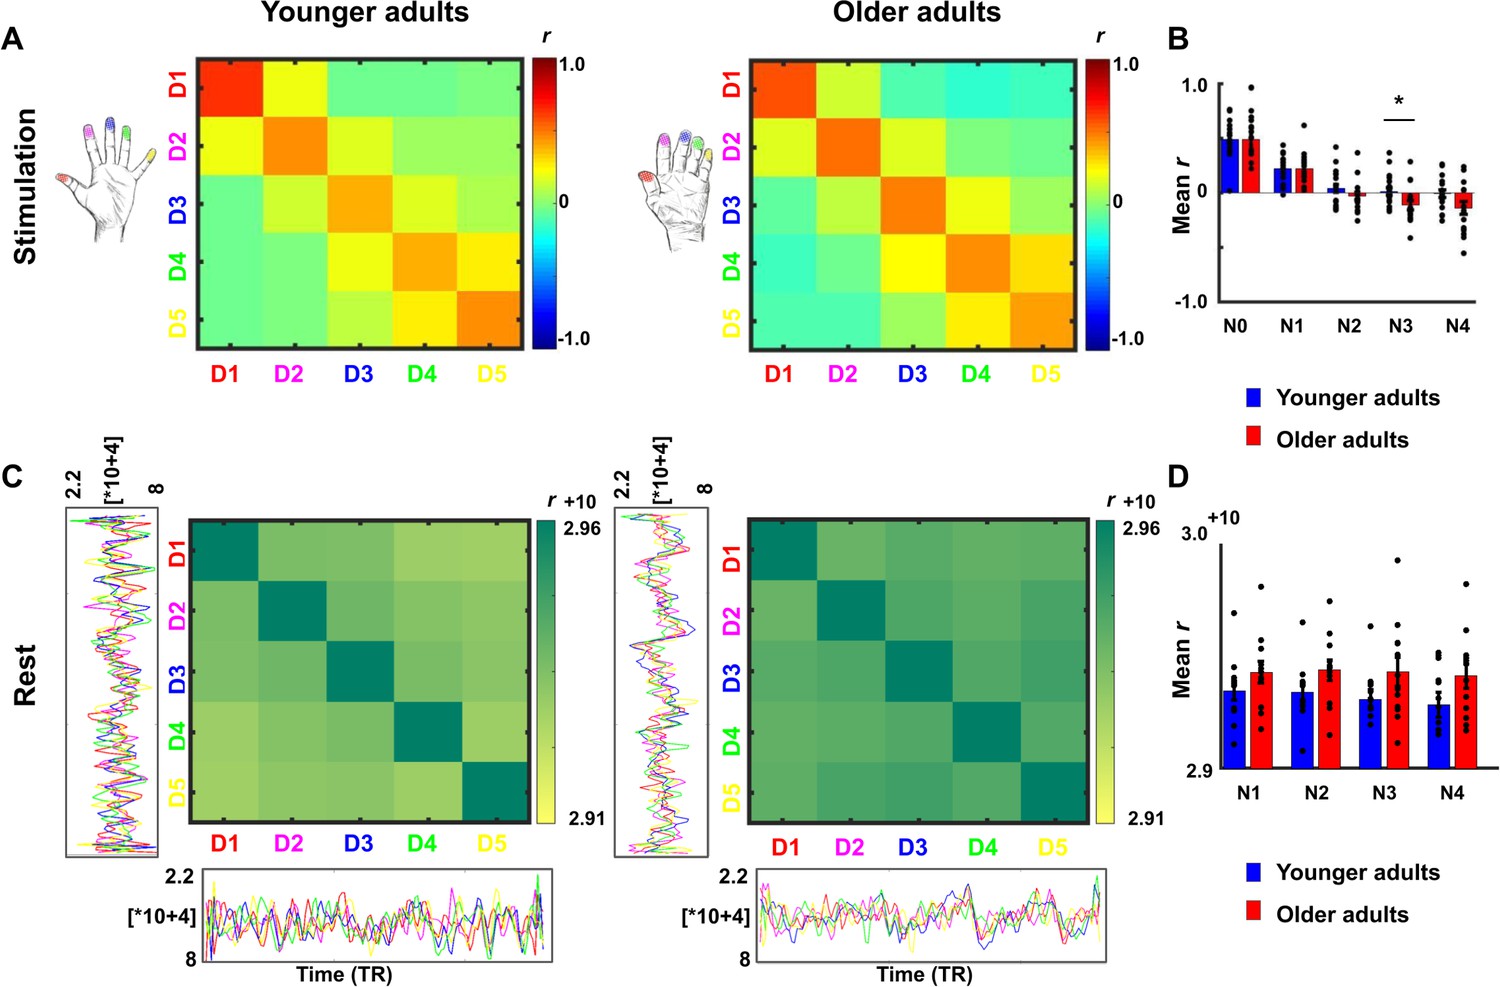
(A) Between-run representational similarity matrices of finger representations in younger and older adults. Higher values indicate higher representational similarity in area 3b. (B) Mean representational similarity between same fingers (N0), 1st neighbor fingers (N1), 2nd neighbor fingers (N2), 3rd neighbor fingers (N3), and 4th neighbor fingers (N4) (mean ± SE and individual data). For correlations between N3 representational similarity and individual age, see Figure 5—figure supplement 1. For results after applying multivariate noise normalization to the data, see Figure 5—figure supplement 2. (C) Cross-correlations between finger-specific time series of resting state data. On the x- and y-axes, exemplary finger-specific time series for one younger adult and one older adult are shown. TR = Repetition time, where each TR represents one volume. Note that the diagonal shows autocorrelations between resting state time series. (D) Mean cross-correlation coefficients of resting state data between N1-N4 in younger and older adults (mean ± SE and individual data). Shown are data of n = 19 younger adults and n = 17 older adults (A,B) and data of n = 12 younger adults and n = 12 older adults (C,D).
Figure 5—figure supplement 1
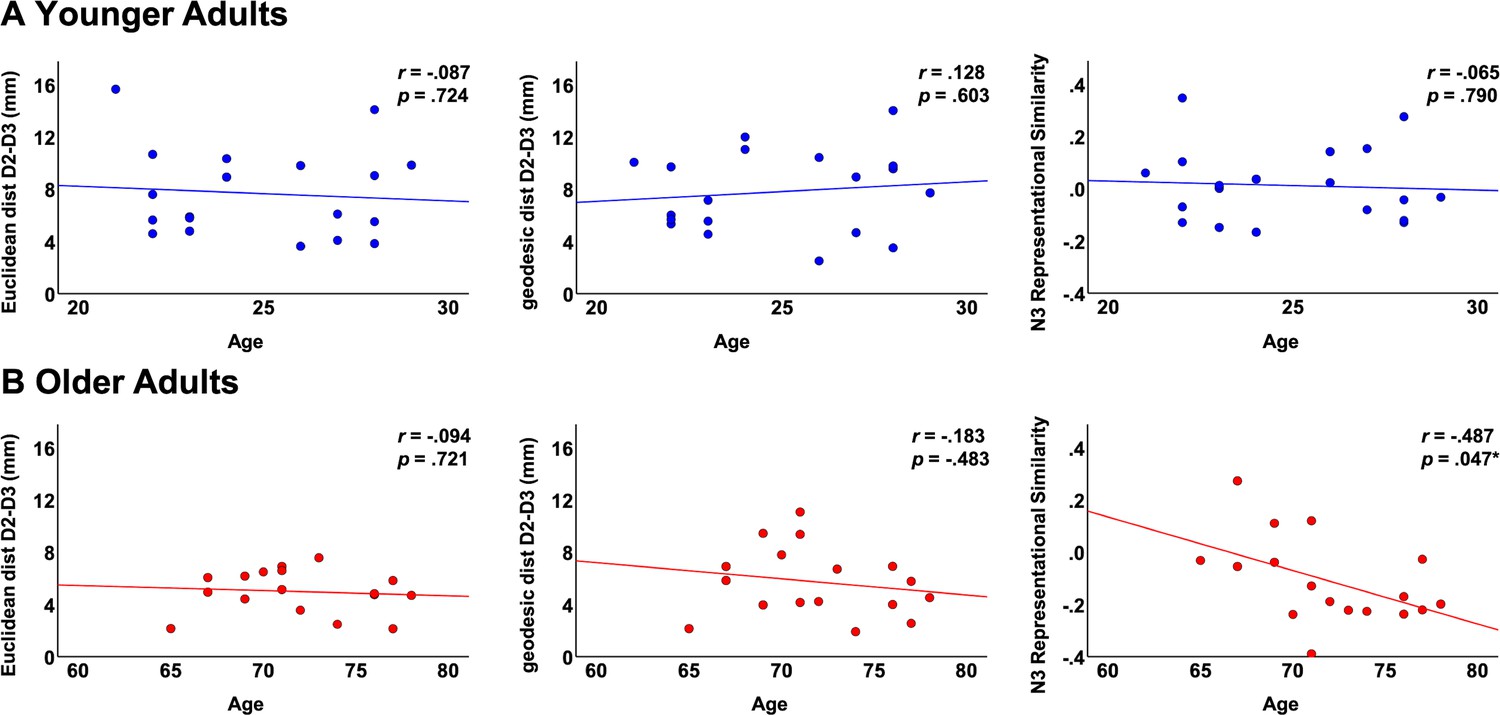
Correlations between fMRI variables and individual age.
Shown are correlations in the group of younger adults (A) and in the group of older adults (B) between individual age and the following parameters: Euclidean distance D2-D3, geodesic distance D2-D3 and N3 representational similarity.
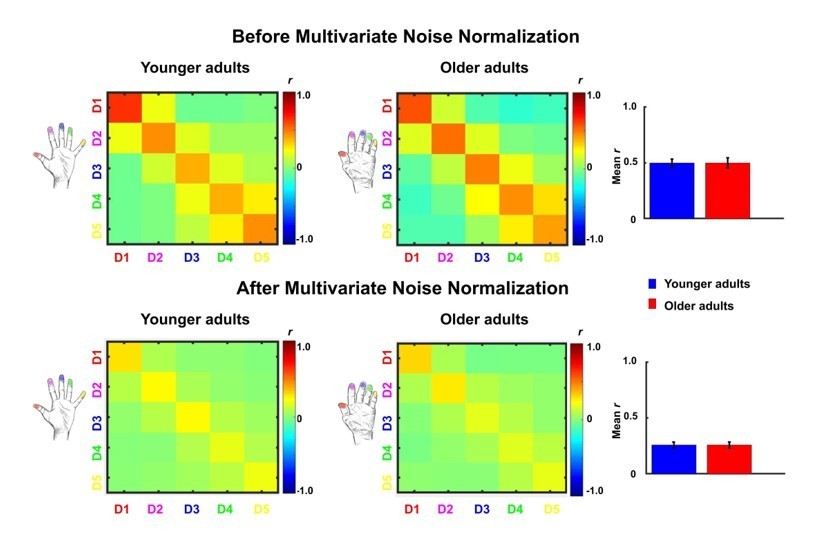
Figure 5—figure supplement 2
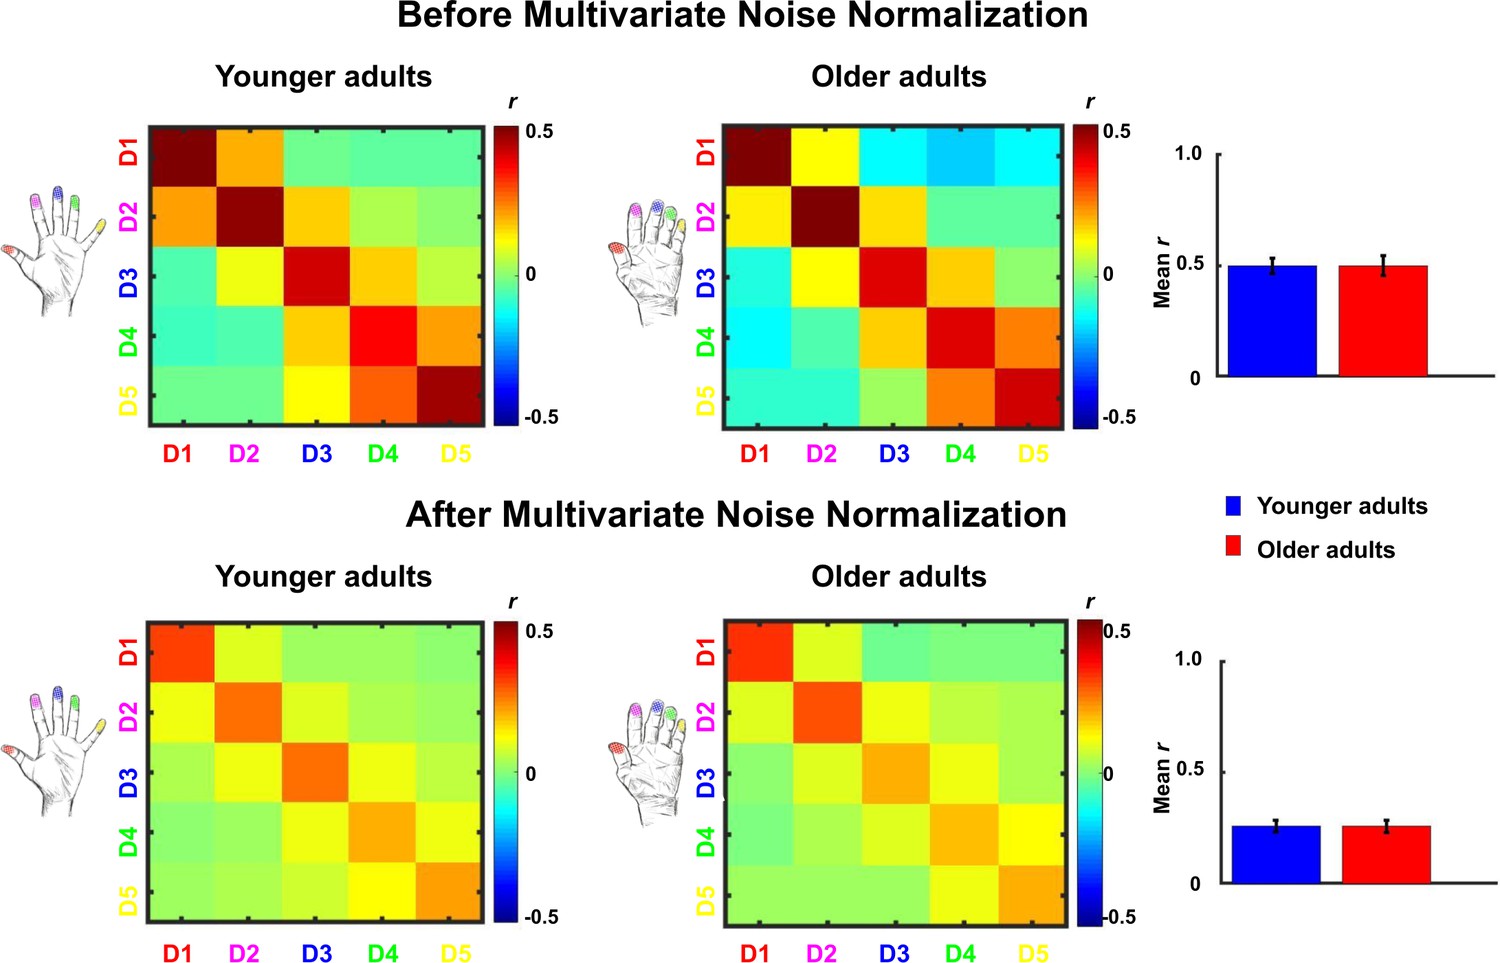
Comparison between representational similarity between distant finger representations in younger and older adults, before and after multivariate noise normalization.
Between-run representational similarity matrices of finger representations in younger and older adults before and after multivariate noise normalization. Multivariate noise normalization has previously been suggested to improve the reliability of representational similarity matrices (Walther et al., 2016), which was tested here. For improved estimates of the noise covariance matrix, we used the residuals of the general linear model, which we regularized using the same criteria as in Walther et al., 2016. Higher values indicate higher representational similarity in area 3b. Note that values in the representational similarity matrices are scaled between −0.5 and 0.5, whereas they are scaled between −1 and 1 in Figure 5. We computed the same statistics as reported in the main text with the data after multivariate noise normalization. With multivariate noise normalization, as before, the interaction between age and finger-pair was not significant (F(3,102)=0.26, p=0.85) but now also the interaction effect between age and neighbor is no longer significant (F(4)=1.14, p=0.34). This is not unexpected, since in our case, multivariate noise normalization strongly reduced the overall reliability (mean digit reliability before: 0.47 for younger adults, 0.45 for older adults, after: 0.24 for younger adults, 0.24 for older adults), which - in contrast to Walther et al., 2016 - has been reported previously (Charest et al., 2018). Bar plots show mean representational similarity (mean ± SE), averaged across fingers for younger (n = 19) and older (n = 17) adults.
Figure 6 with 1 supplement
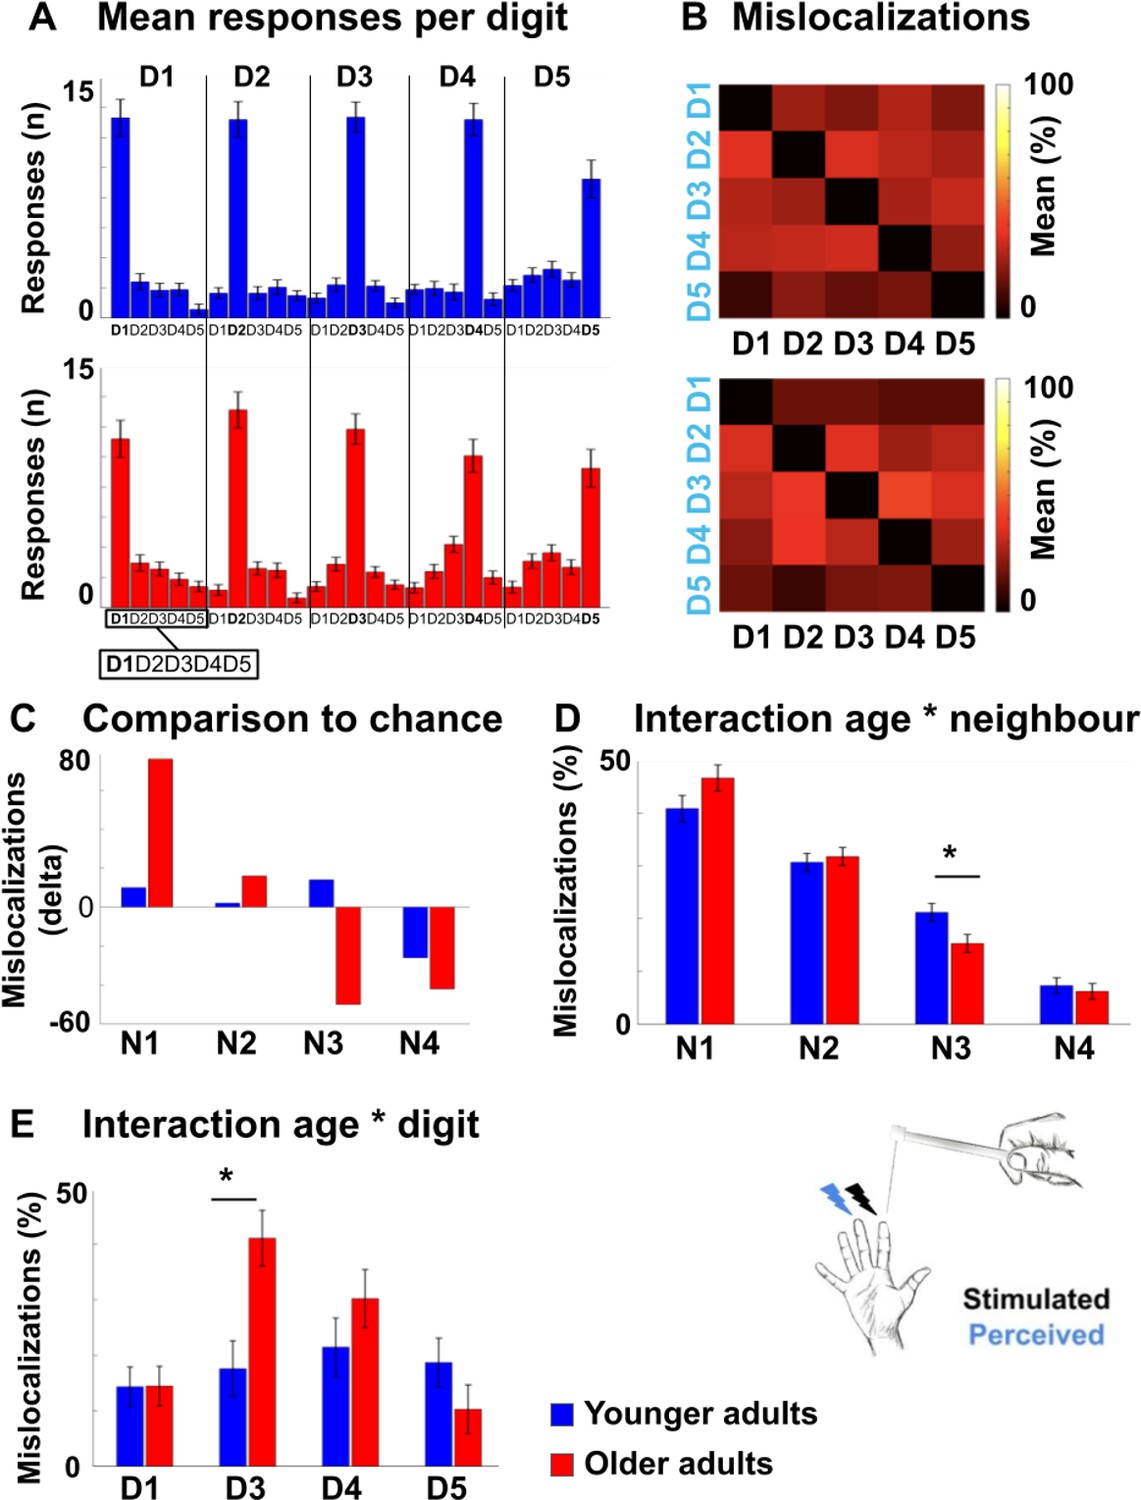
Mislocalizations reflect representational similarity of topographic fields and adjacency of cortical representations.
(A,B) Finger-specific responses to digit stimulation in younger and older adults shown as numbers of responses per digit dependent on stimulated digit (stimulated digit shown at top row, A) and as relative distribution of mislocalizations (stimulated digit shown on x-axis, perceived digit shown on y-axis, B) (mean ± SE). See Figure 6—figure supplement 1 for main effects, hit rates and response biases. (C) Difference values between the measured distribution of mislocalizations and the distribution as expected by chance for both age groups. The mislocalizations were summed for the fingers according to their distance to the stimulated finger. Raw values are shown in Figure 6—figure supplement 1. (D) Distribution of mislocalizations dependent on neighbor (N1-N4) and age group (mean ± SE and individual data). (E) Distribution of mislocalizations for D2 stimulations to each digit (mean ± SE and individual data). For complete statistics for each digit (D1-D5) see Figure 6—source data 2. * indicates significant difference at post hoc t-test at an alpha level of p<0.05. Shown are data of n = 25 younger adults and n = 25 older adults.
-
Figure 6—source data 1
Tactile misclocalizations compared to chance level.
Shown are the measured and calculated frequencies (n) of mislocalizations to fingers other than the stimulated one for younger and older adults. The absolute number (n) of mislocalizations to each neighboring finger (1 st, 2nd, 3rd, and 4th) was calculated separately for each age group and across the five stimulated digits (D1–D5). Based on the summed amount of the mislocalizations (Sum), the proportional distribution as expected by chance was estimated for comparison. The chance distribution was estimated in a proportional manner, because the combination of the frequencies of mislocalizations from all five digits (D1–D5) results in eight 1st, six 2nd, four 3rd, and two 4th neighboring fingers. In younger adults for example, the total number of mislocalizations was 942, out of which 387 were made to the 1st neighbors of the five stimulated digits (D1–D5). For D1 to D5, there are eight 1st neighbors in total, so based on chance, we would expect that 377 mislocalizations would be addressed to the 1st neighboring fingers, which is less compared to the number of observed mislocalizations.
- https://cdn.elifesciences.org/articles/60090/elife-60090-fig6-data1-v2.docx
-
Figure 6—source data 2
ANOVA results of finger-specific mislocalizations.
Shown are results from five robust ANOVAs computed with the factors age and digit on the relative distribution of mislocalizations (in %). One robust ANOVA, based on the 20% trimmed mean, was computed for each of the five stimulated fingers (D1–D5). For all five fingers (D1–D5), a main effect of digit was observed due to the higher amount of mislocalizations to nearer neighbors compared to more distant neighbors. A significant interaction between age and digit was only found for D2.
- https://cdn.elifesciences.org/articles/60090/elife-60090-fig6-data2-v2.docx
Figure 6—figure supplement 1
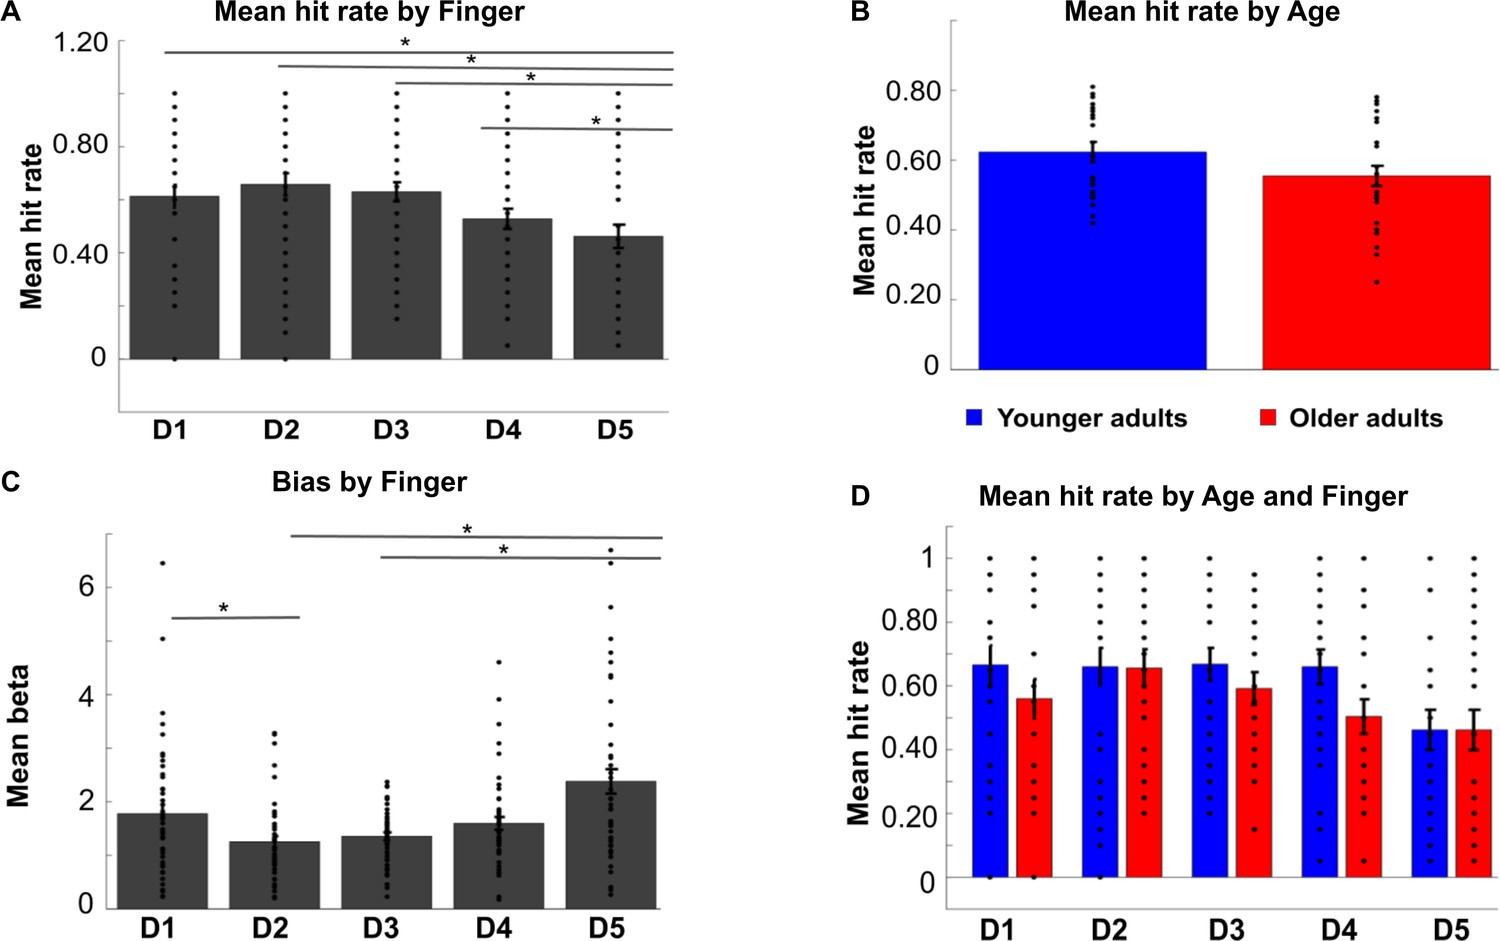
Hit rates and biases in tactile mislocalization task.
Shown are hit rates for each digit (D1–D5) across age groups (A), hit rates for each age group across digits (B), and hit rates for each digit and each age group separately (D) (mean ± SE and individual data). (C) Mean biases (± SE and individual data) for each digit (D1–D5) across age groups. The * indicates significant differences between digits at p<0.05. The ANOVA on hit rates revealed a main effect of digit (F(4,192)=3.67, p<0.01), a trend toward a main effect of age (F(1,48)=2.87, p=0.097, younger: M = 0.62 ± 0.028, older: M = 0.54 ± 0.026), but no significant interaction between digit and age (F(4,192)=.71, p=0.59). The main effect of digit was due to the lower hit rate of D5 compared to all other digits across age groups (D5 versus D1: t(98)=2.44, p<0.05, D5 versus D2: t(98)=3.24, p<.005, D5 versus D3: t(98)=2.97, p<.005, D5 versus D4: t(98)=2.03, p<0.05).
Figure 7
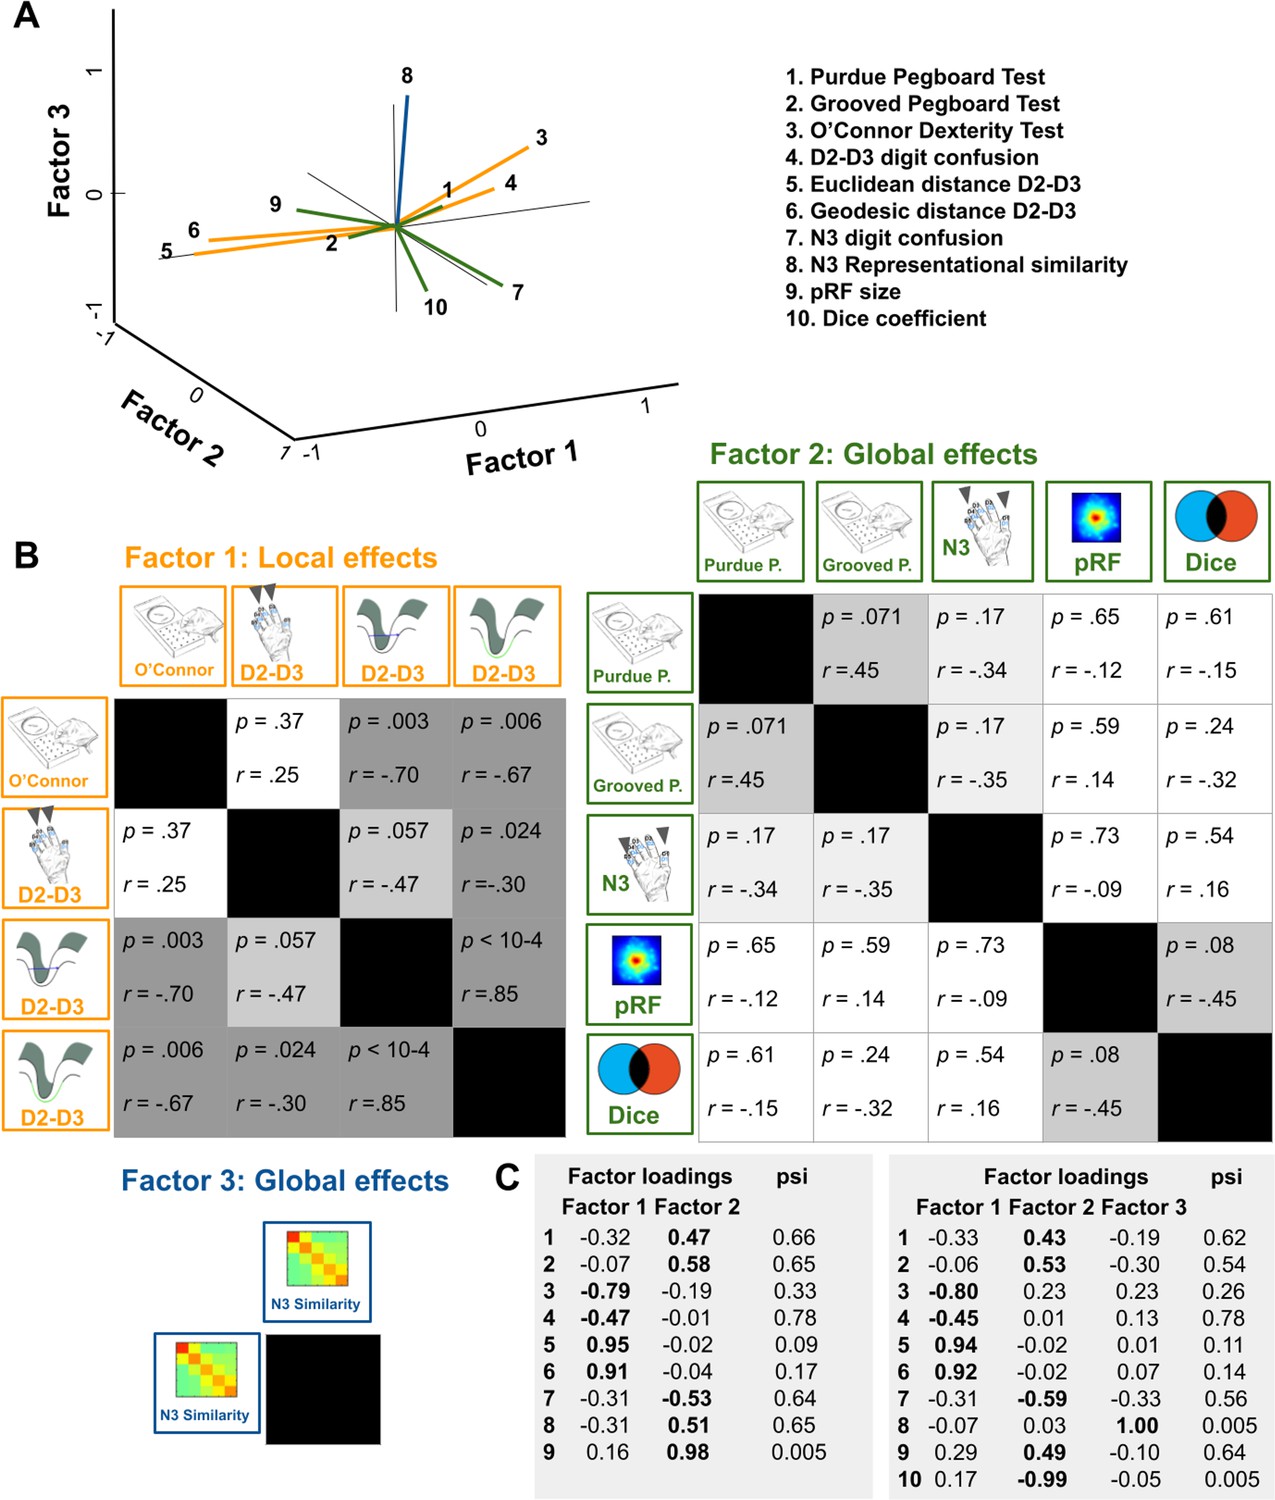
Relation between functional map architectures and behavioral phenotypes.
(A,B) With a three-factorial model, the functional data were categorized into features that link to local effects, that is that cover parts of the map (perceptual confusion between D2 and D3, cortical distance between D2 and D3, factor 1, orange lines) and those that link to global effects, that is that affect the whole map area (representational similarity to N3, pRF size, dice coefficient, factor 2, green lines, and perceptual confusion to N3, factor 3, blue line). Whereas motor performance in the O’Connor dexterity Test loaded positively onto age-related local effects (higher values in O’Connor test, which reflect better performance, relate to higher perceptual confusion between D2 and D3, and lower cortical distance between D2 and D3), performance in the Pegboard Test loaded negatively onto global effects (higher values in Purdue and Grooved Pegboard Test, which reflect worse performance, relate to lower perceptual confusion between N3). (A) factors and visualization of three-factor model, (B) p-values and correlation coefficients (r) of Pearson correlations, (C) factor loadings and psi values of two- and three-factor models. Used were data of n = 17 older adults.
Author response image 1

Author response image 2
Additional files
Download links
A two-part list of links to download the article, or parts of the article, in various formats.
Downloads (link to download the article as PDF)
Open citations (links to open the citations from this article in various online reference manager services)
Cite this article (links to download the citations from this article in formats compatible with various reference manager tools)
The organizational principles of de-differentiated topographic maps in somatosensory cortex
eLife 10:e60090.
https://doi.org/10.7554/eLife.60090


