Quantifying antibody kinetics and RNA detection during early-phase SARS-CoV-2 infection by time since symptom onset
- Ecology and Evolutionary Biology Department, University of California, Los Angeles, United States
- I-BioStat, Data Science Institute, Hasselt University, Belgium
- Evolutionary Ecology Group, University of Antwerp, Belgium
- National Marine Mammal Foundation, United States
- Biomathematics Department, University of California, Los Angeles, United States
Figures
Figure 1 with 5 supplements

Seroconversion time distributions for IgG and IgM.
(A) IgG and IgM detected using ELISA. (B) IgG and IgM detected using MCLIA. (C) IgM and (D) IgG seroconversion related to disease severity. IgG and IgM ELISA results are shown for the NP and Spike antigens, respectively, because these had the largest sample sizes. Lines indicate fitted normal distributions.
-
Figure 1—source data 1
Fitted normal distribution parameters for seroconversion time using different assays.
SD: standard deviation; ‘N too low’ indicates a sample size too small to compute a mean and SD.
- https://cdn.elifesciences.org/articles/60122/elife-60122-fig1-data1-v2.docx
Figure 1—figure supplement 1
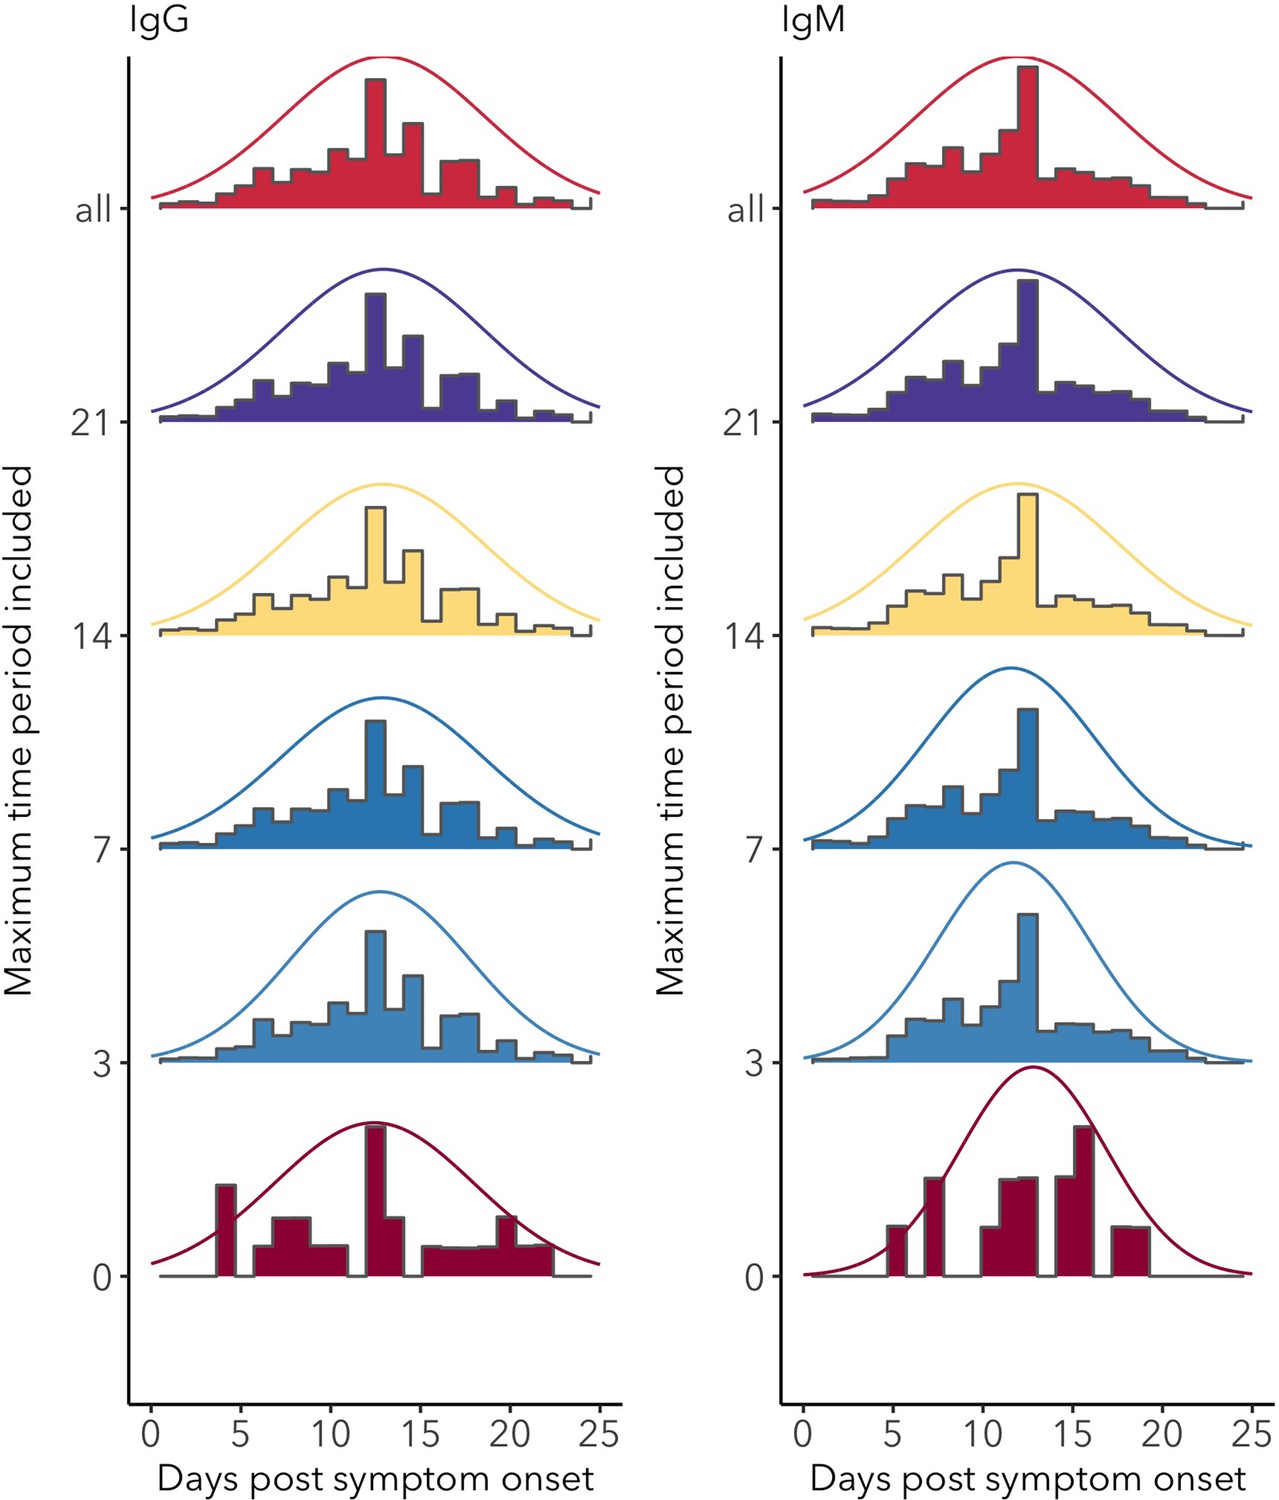
Distributions of IgG and IgM seroconversion times (including all assays) for increasing levels of data inclusion, from exact time data only (time period = 0) to the inclusion of the longest reported time periods (all).
Figure 1—figure supplement 2
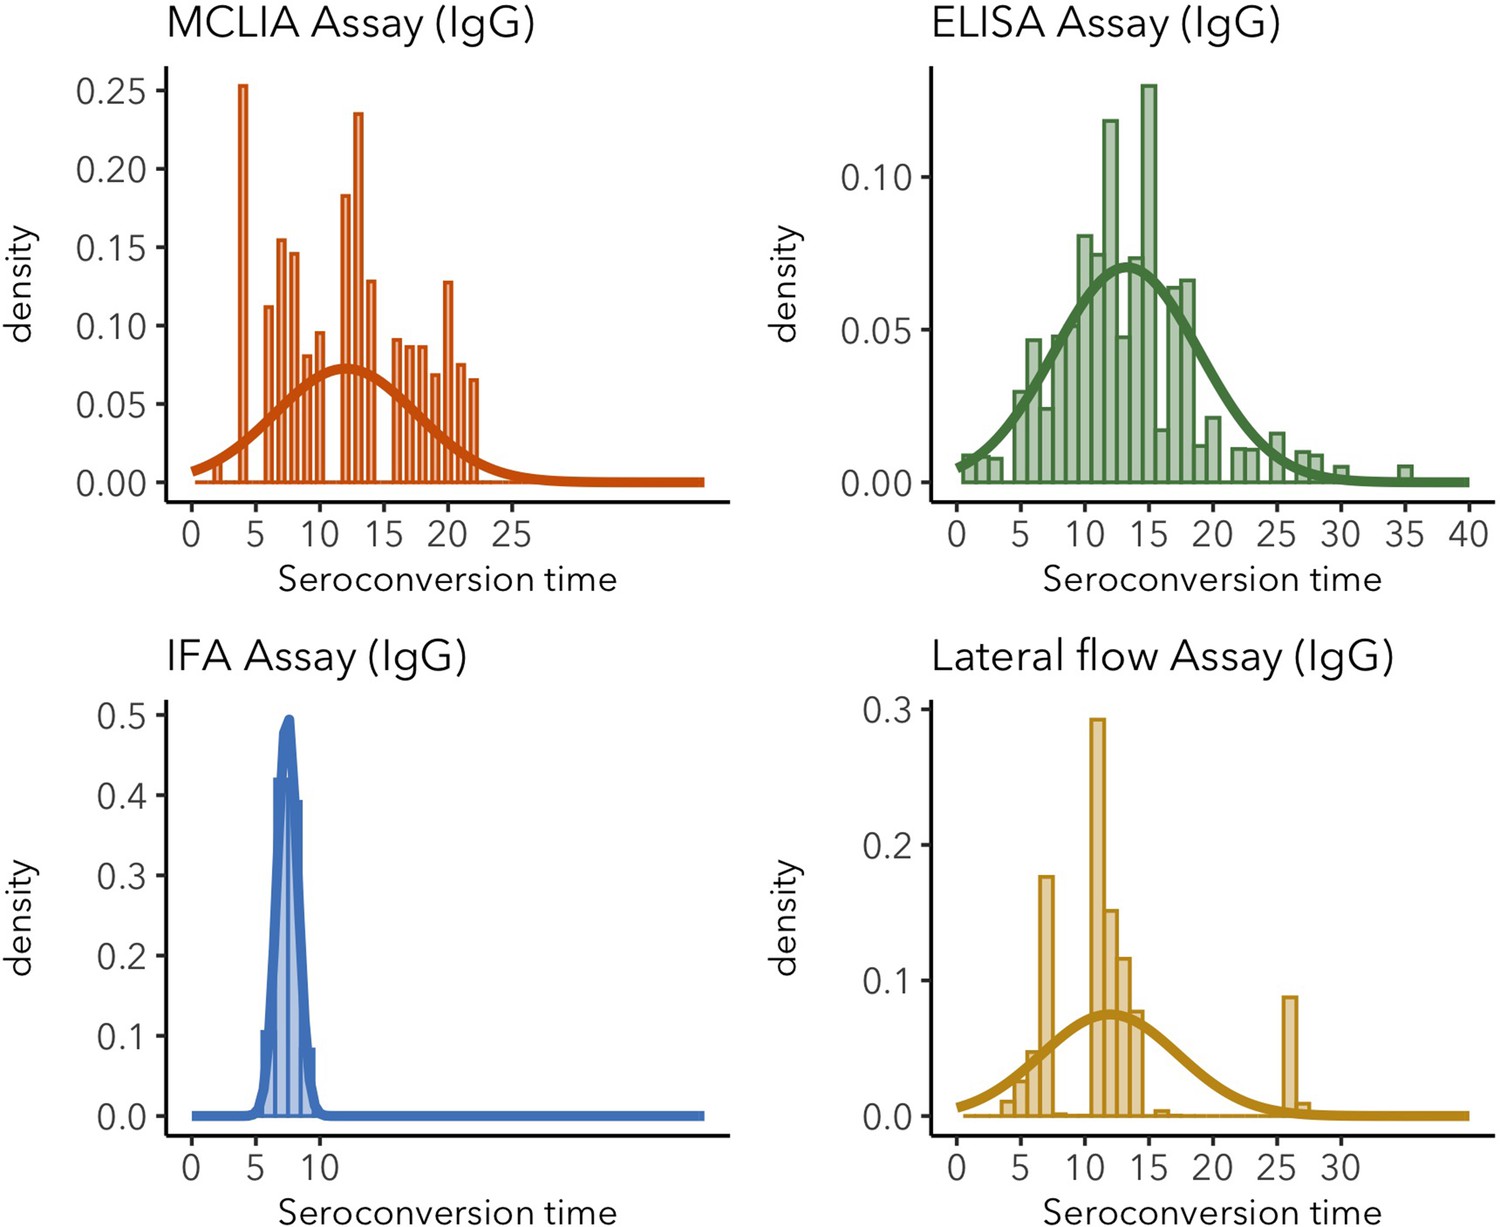
IgG seroconversion time distributions for different assays.
Sparse distributions are the result of low sample sizes in the study. These sparse results are included for informative reasons and should not be interpreted as representative of the real distribution.
Figure 1—figure supplement 3
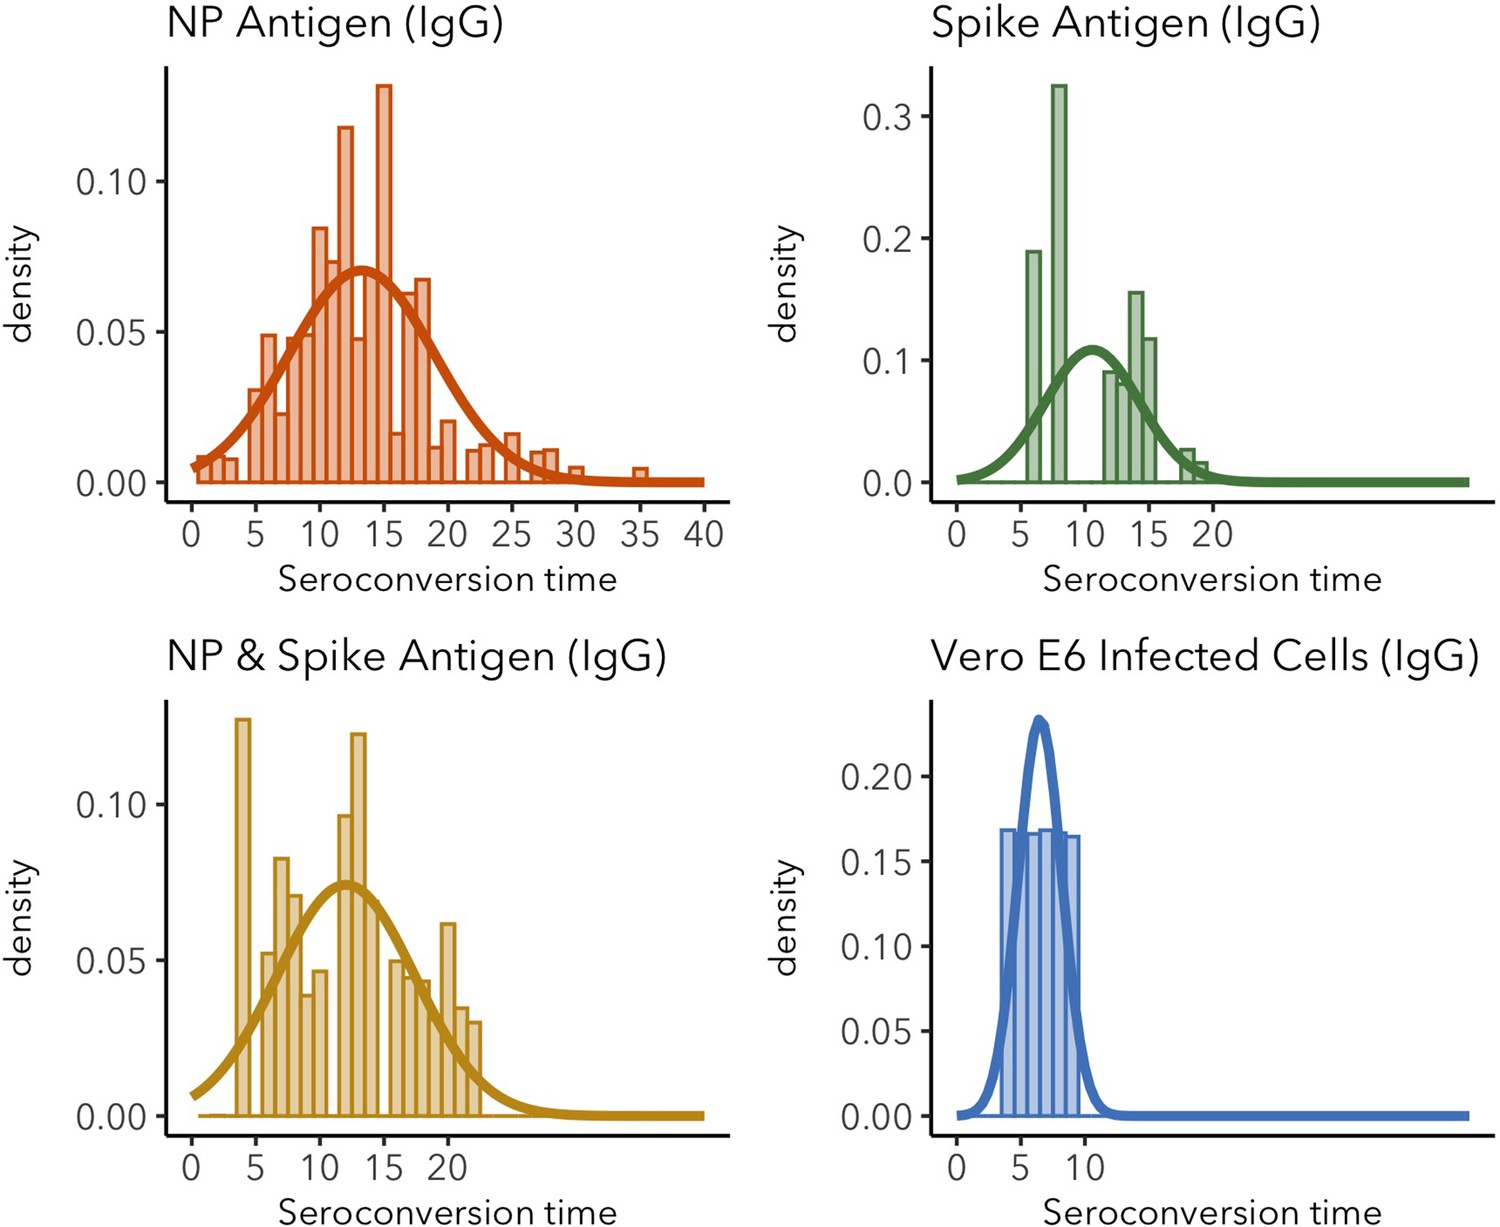
IgG seroconversion time distributions for different target antigens.
Sparse distributions are the result of low sample sizes in the study. These sparse results are included for informative reasons and should not be interpreted as representative of the real distribution.
Figure 1—figure supplement 4
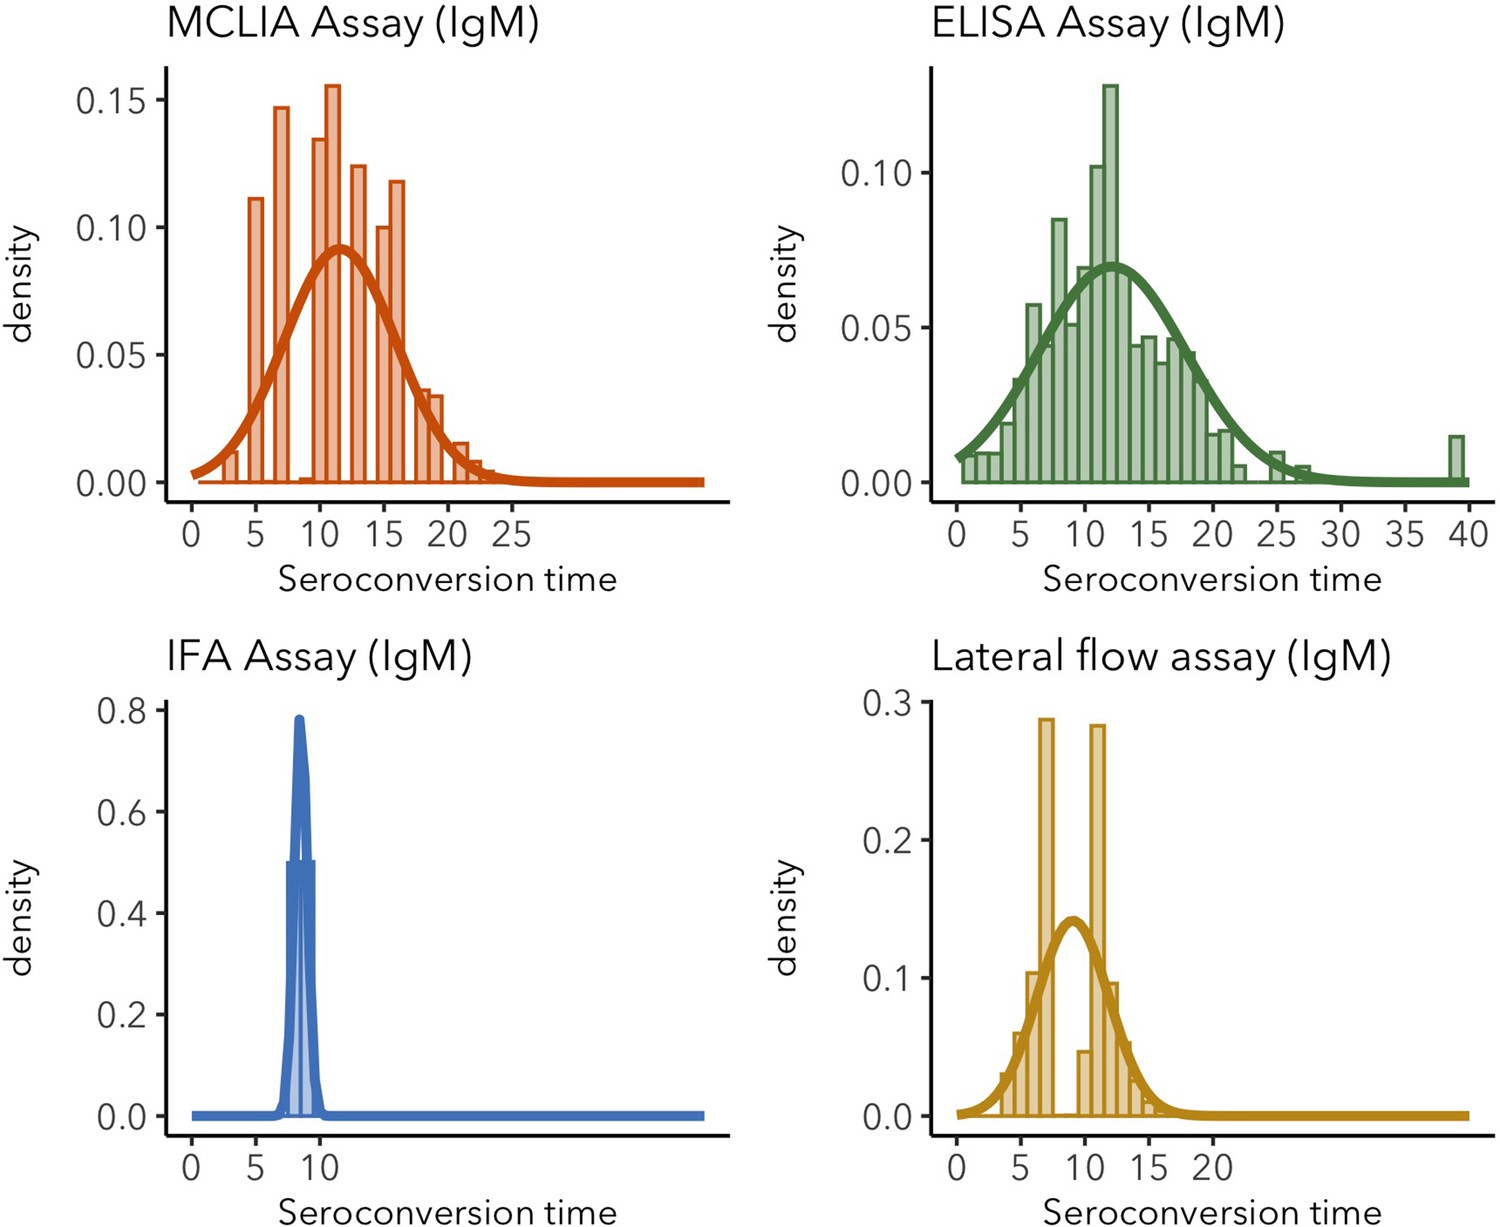
IgM seroconversion time distributions for different assays.
Sparse distributions are the result of low sample sizes in the study. These sparse results are included for informative reasons and should not be interpreted as representative of the real distribution.
Figure 1—figure supplement 5
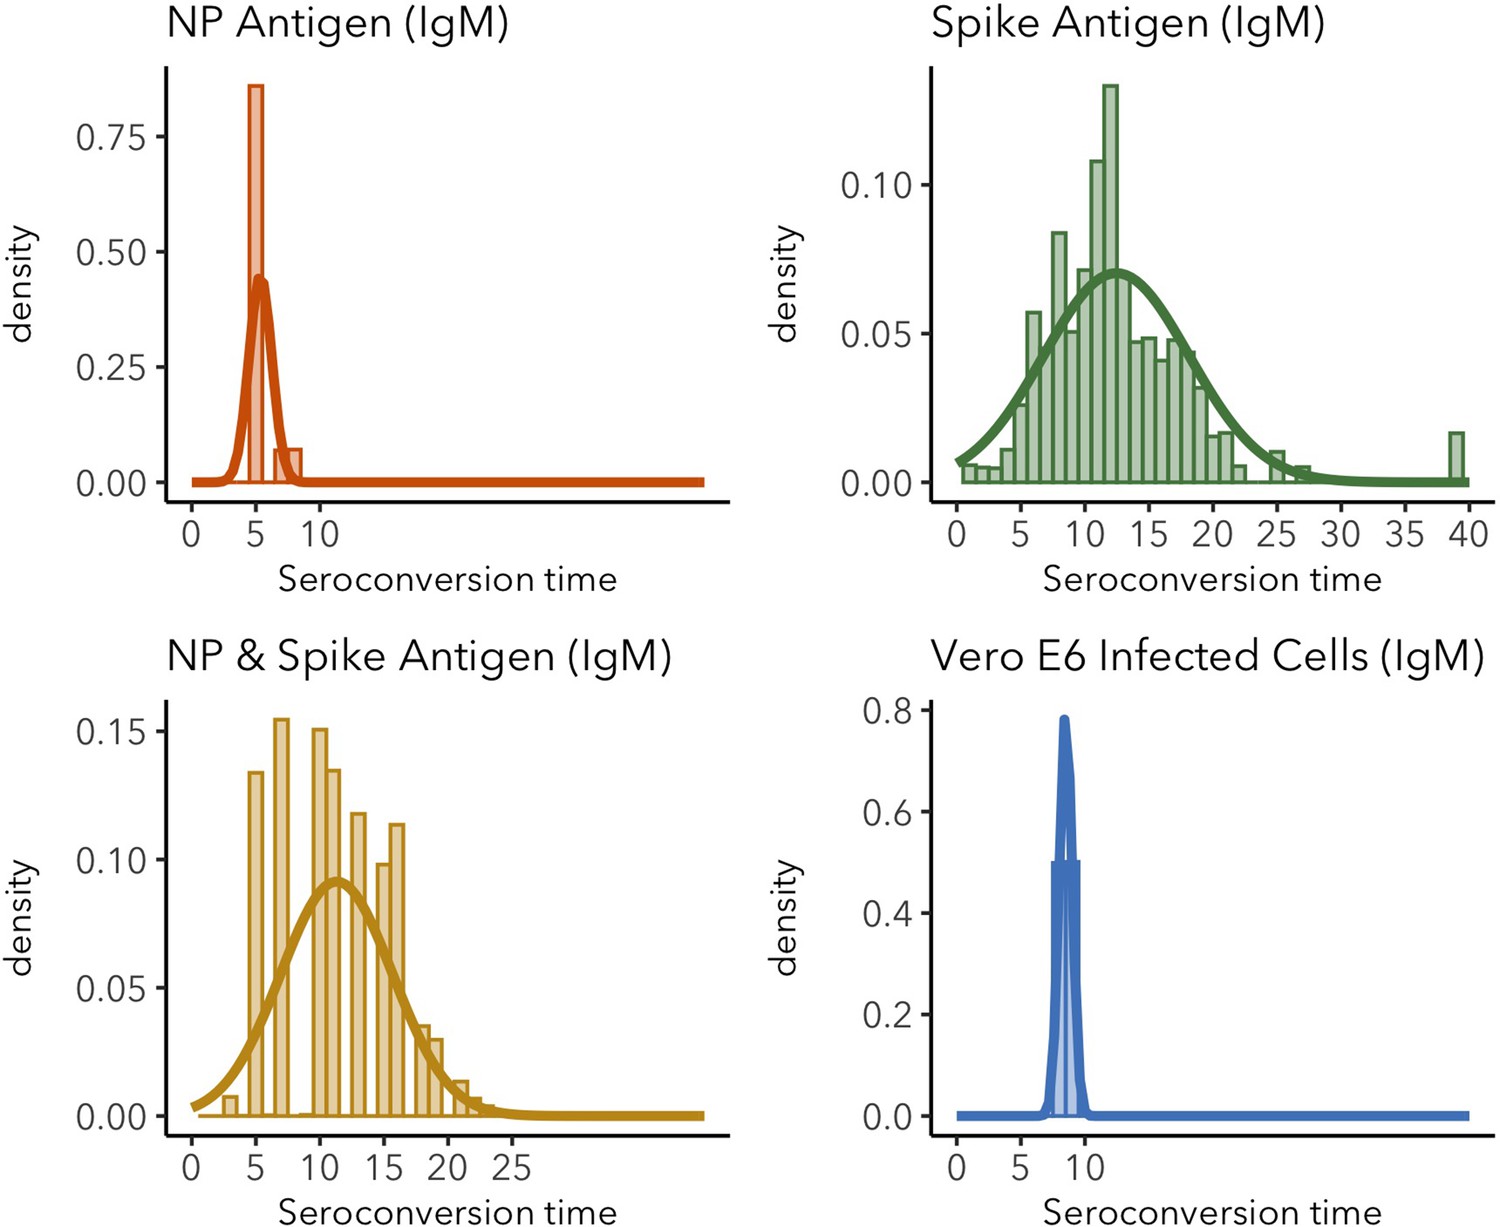
IgM seroconversion time distributions for different target antigens.
Sparse distributions are the result of low sample sizes in the study. These sparse results are included for informative reasons and should not be interpreted as representative of the real distribution.
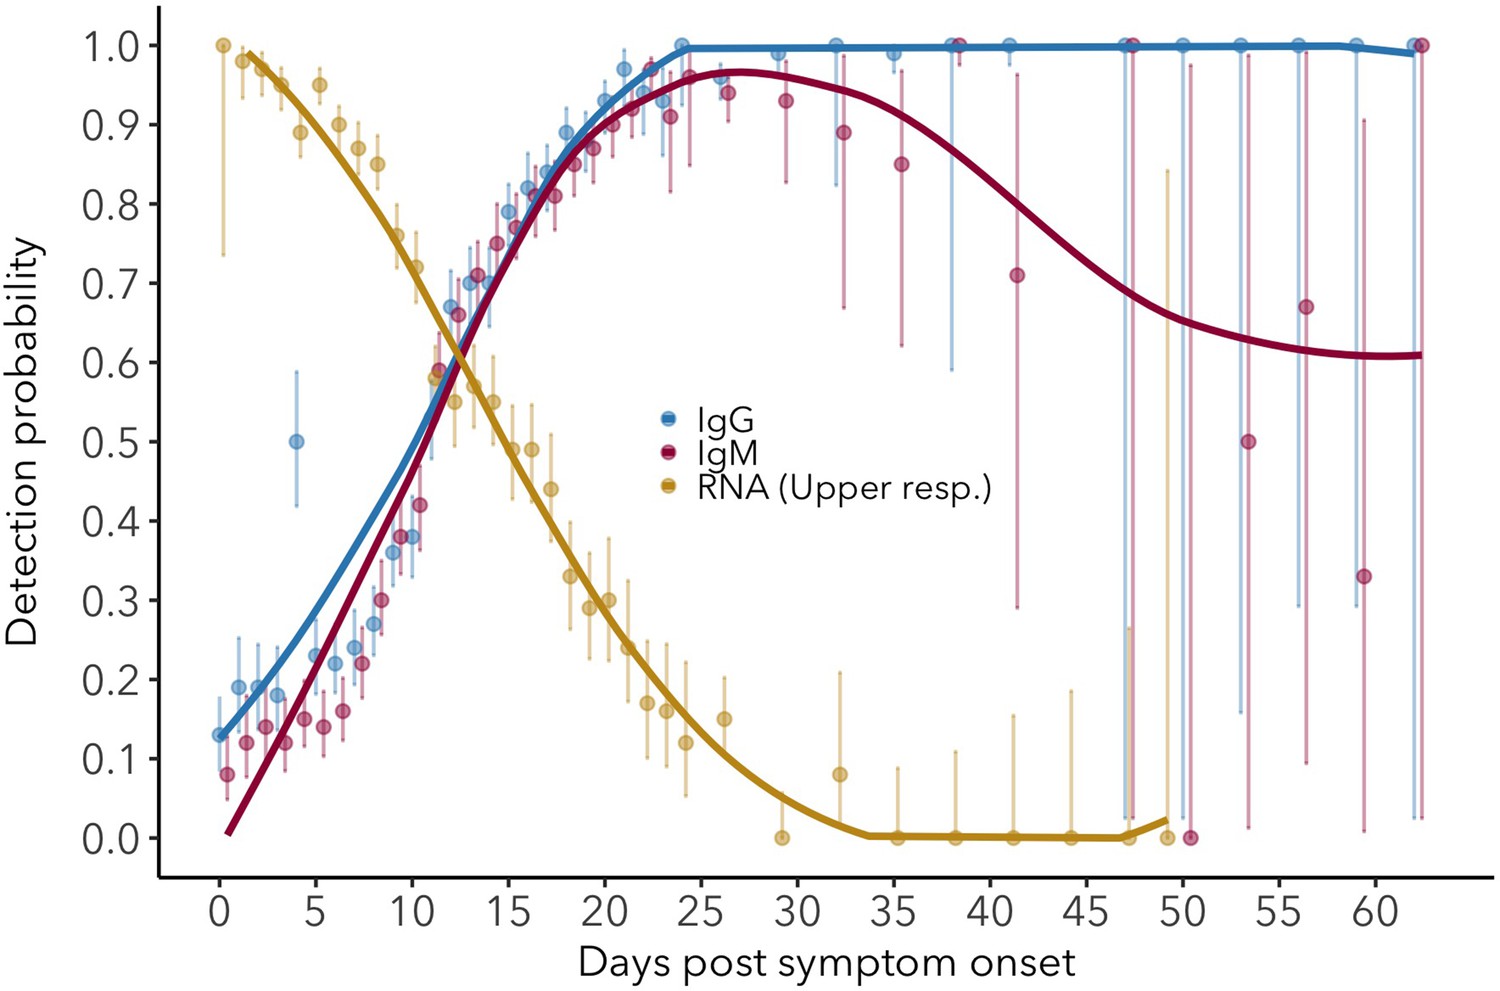
Figure 2 with 4 supplements
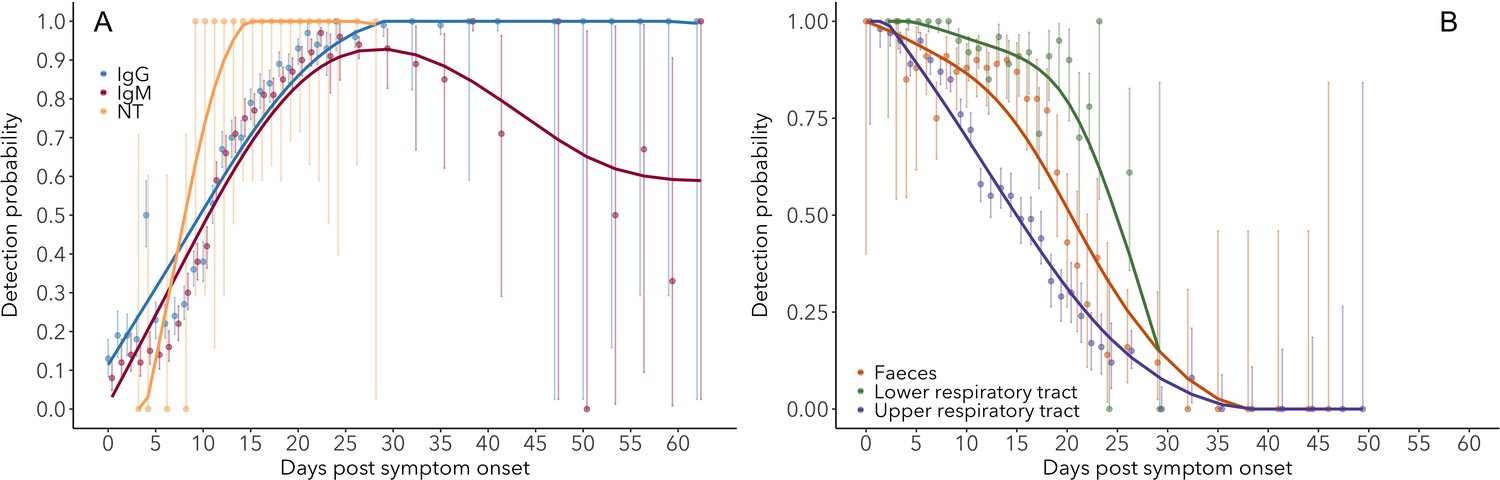
Detection probability of IgG, IgM and NT (neutralizing) antibody (A) and RNA in different sample types (B) over time since symptom onset.
Points are mean values for each day. Bold lines are flexible smoothed splines fit to the data. Error bars indicate binomial exact 95% confidence intervals of the mean, based on daily sample size. Note that error bars after day 30 tend to be large, due to the limited available data. IgG and IgM values are those detected using any assay/antigen. After day 25, results are pooled into 3-day periods in order to improve estimates.
-
Figure 2—source data 1
IgG (ELISA-NP) detection probability.
N: sample size (including interpolated samples).
- https://cdn.elifesciences.org/articles/60122/elife-60122-fig2-data1-v2.docx
-
Figure 2—source data 2
IgM (ELISA-Spike) detection probability.
N: sample size (including interpolated samples).
- https://cdn.elifesciences.org/articles/60122/elife-60122-fig2-data2-v2.docx
-
Figure 2—source data 3
RNA – upper respiratory tract detection probability.
N: sample size (including interpolated samples).
- https://cdn.elifesciences.org/articles/60122/elife-60122-fig2-data3-v2.docx
-
Figure 2—source data 4
RNA – lower respiratory tract detection probability.
N: sample size (including interpolated samples).
- https://cdn.elifesciences.org/articles/60122/elife-60122-fig2-data4-v2.docx
-
Figure 2—source data 5
RNA – feces detection probability.
N: sample size (including interpolated samples).
- https://cdn.elifesciences.org/articles/60122/elife-60122-fig2-data5-v2.docx
Figure 2—figure supplement 1
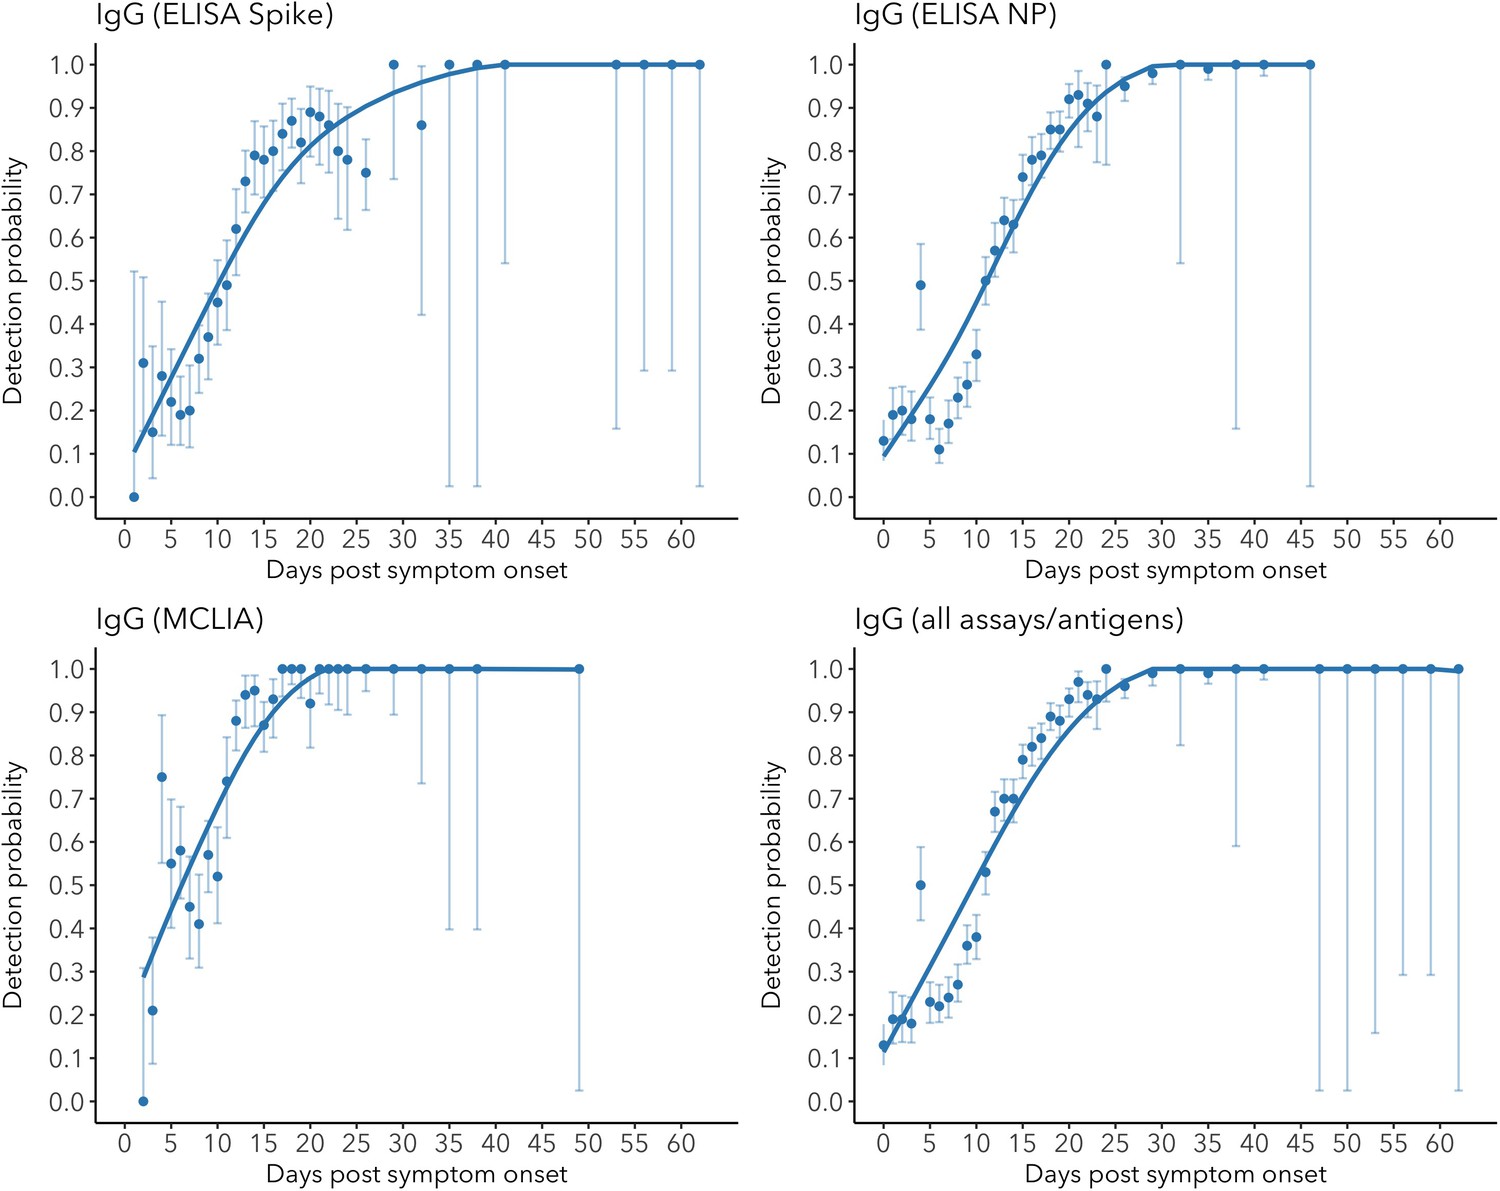
IgG detection probability for different assays/antigens.
Figure 2—figure supplement 2
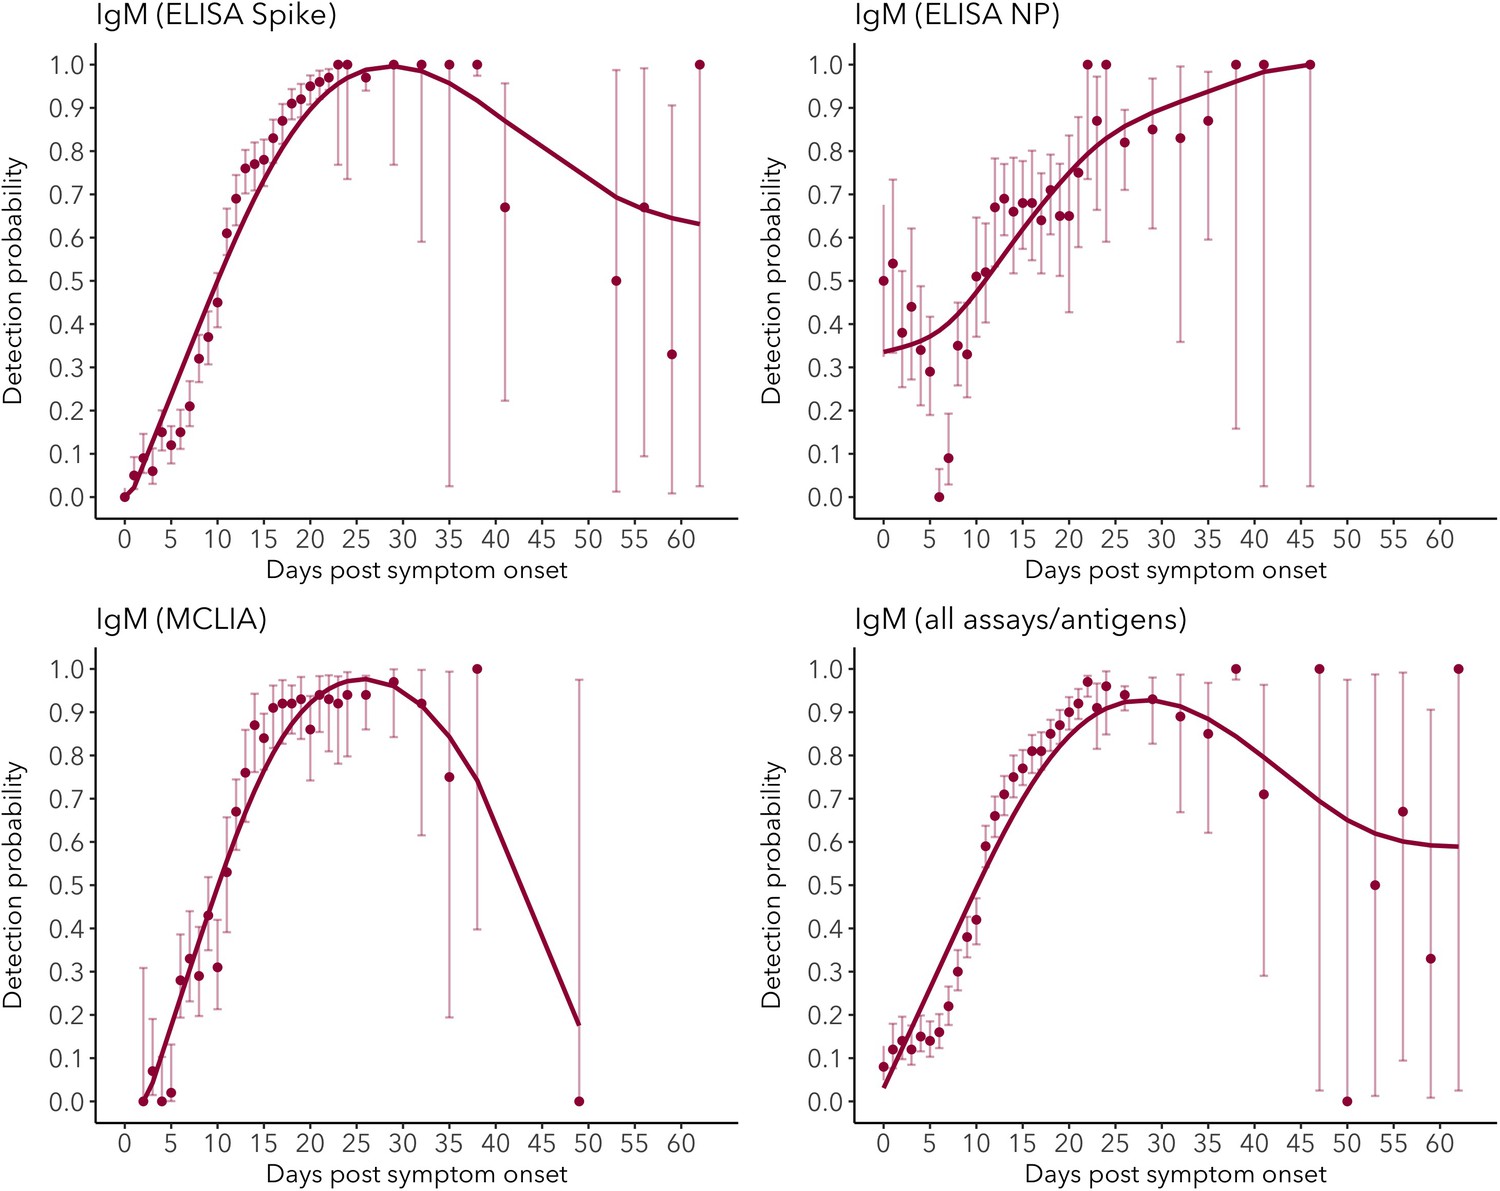
IgM detection probability for different assays/antigens.
Figure 2—figure supplement 3
Detection probability for serum IgG (ELISA-NP) and IgM (ELISA-Spike), and for viral RNA in upper respiratory tract samples.
Figure 2—figure supplement 4
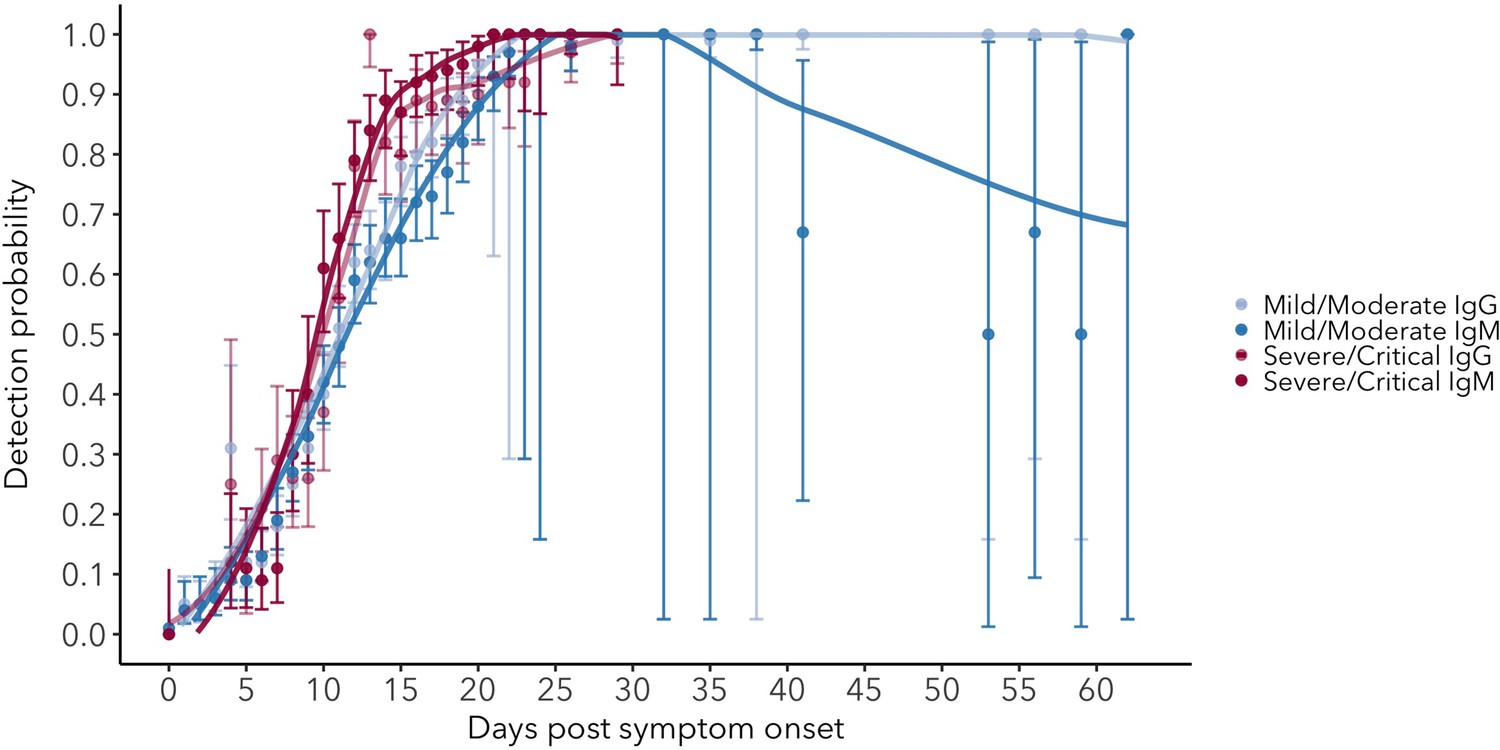
Detection probability for serum IgG and IgM in mild/moderate and severe/critical cases.
Figure 3
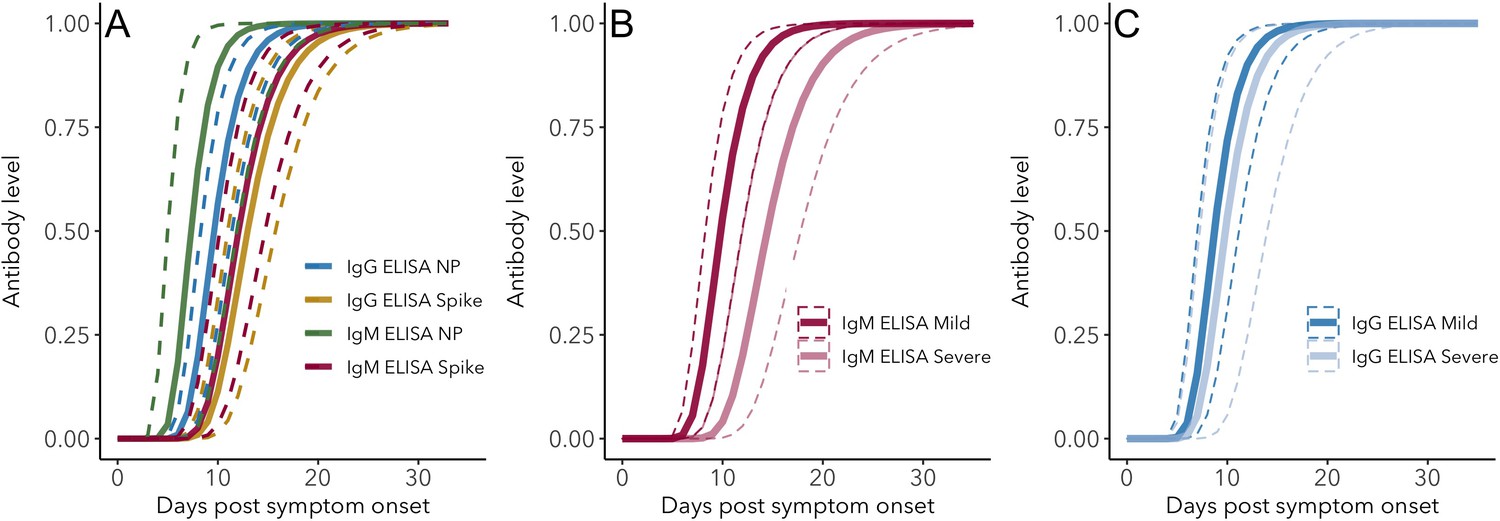
IgG and IgM antibody level kinetics for ELISA NP and Spike assays (A) and disease severity for IgM (B) and IgG (C).
Measured using ELISA Spike and ELISA NP, respectively. Fitted functions use the posterior mean values for increase rate and start of the increase phase (displacement). Dotted lines show upper and lower 95% credible intervals. Note that the upper CI of IgM ELISA severe overlaps with the lower CI of mild cases, as do the upper CIs of IgG ELISA mild and severe. In order to allow the comparison of increase rate patterns, normalized peak antibody levels were set to one for all functions.
-
Figure 3—source data 1
Peak antibody level time posterior means and 95% credible intervals (CrI).
- https://cdn.elifesciences.org/articles/60122/elife-60122-fig3-data1-v2.docx
-
Figure 3—source data 2
Peak antibody level time pairwise posterior differences.
Posterior differences between means were calculated by subtracting the posterior mean value for the antibody/assay in the second column from that of the first column, for each MCMC iteration. Differences were considered significant when zero was not included in the 95% credible interval (indicated in bold font).
- https://cdn.elifesciences.org/articles/60122/elife-60122-fig3-data2-v2.docx
-
Figure 3—source data 3
Growth rate posterior means and 95% credible intervals (CrI).
- https://cdn.elifesciences.org/articles/60122/elife-60122-fig3-data3-v2.docx
-
Figure 3—source data 4
Growth rate pairwise posterior differences.
Posterior differences between means were calculated by subtracting the posterior mean value for the antibody/assay in the second column from that of the first column, for each MCMC iteration. Differences were considered significant when zero was not included in the 95% credible interval (indicated in bold font).
- https://cdn.elifesciences.org/articles/60122/elife-60122-fig3-data4-v2.docx
Figure 4
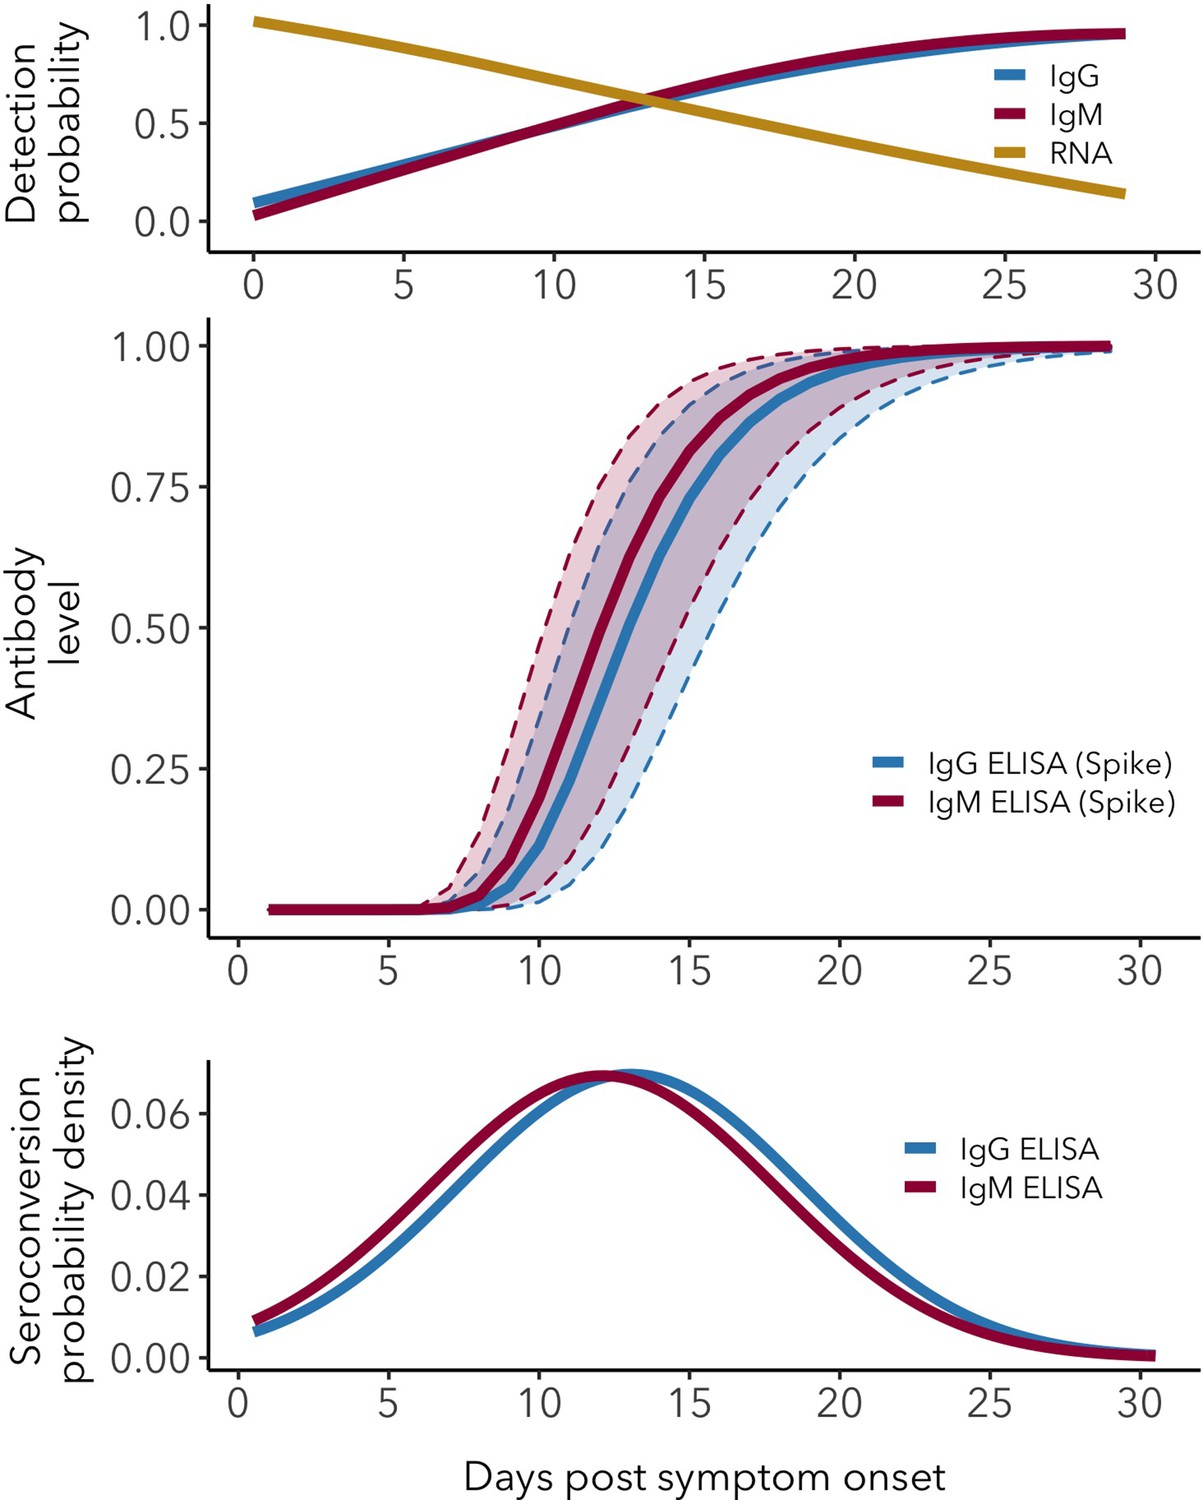
Antibody and RNA detection patterns during the early phase of SARS-CoV-2 infection.
(Top) Fitted splines for the detection probabilities of serum IgG and IgM (measured using any assay/antigen), and of RNA in upper respiratory tract samples. (Middle) Modeled IgG and IgM level kinetics with 95% credible intervals, with normalized peak antibody levels set at one to allow direct comparison of growth rates. (Bottom) Estimated distribution of observed IgG and IgM seroconversion times.
Figure 5
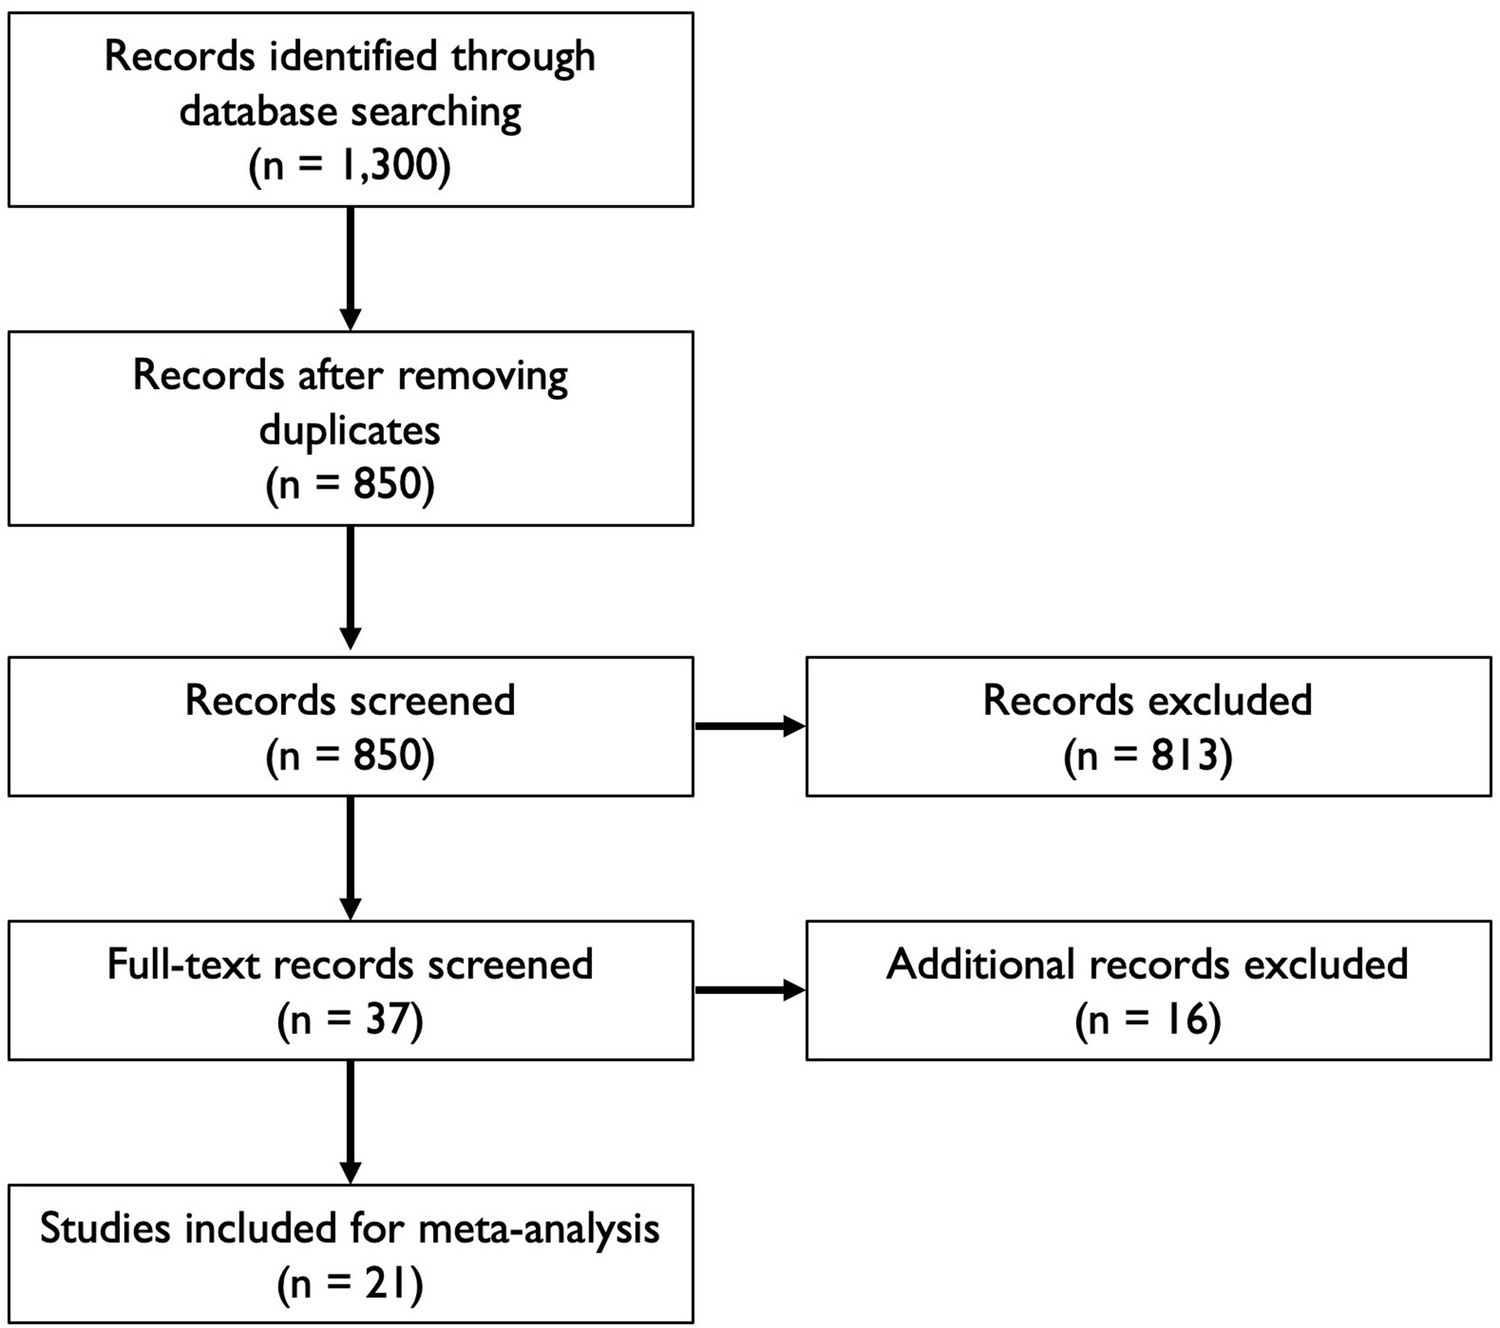
Flowchart illustrating the article selection process for the meta-analysis.
-
Figure 5—source data 1
Key features of articles used for analysis.
Note that sample sizes indicate those reported in the articles, not all of which were used for quantitative analysis.
- https://cdn.elifesciences.org/articles/60122/elife-60122-fig5-data1-v2.docx
Appendix 1—figure 1

IgG ELISA-NP fitted antibody kinetics.
Appendix 1—figure 2
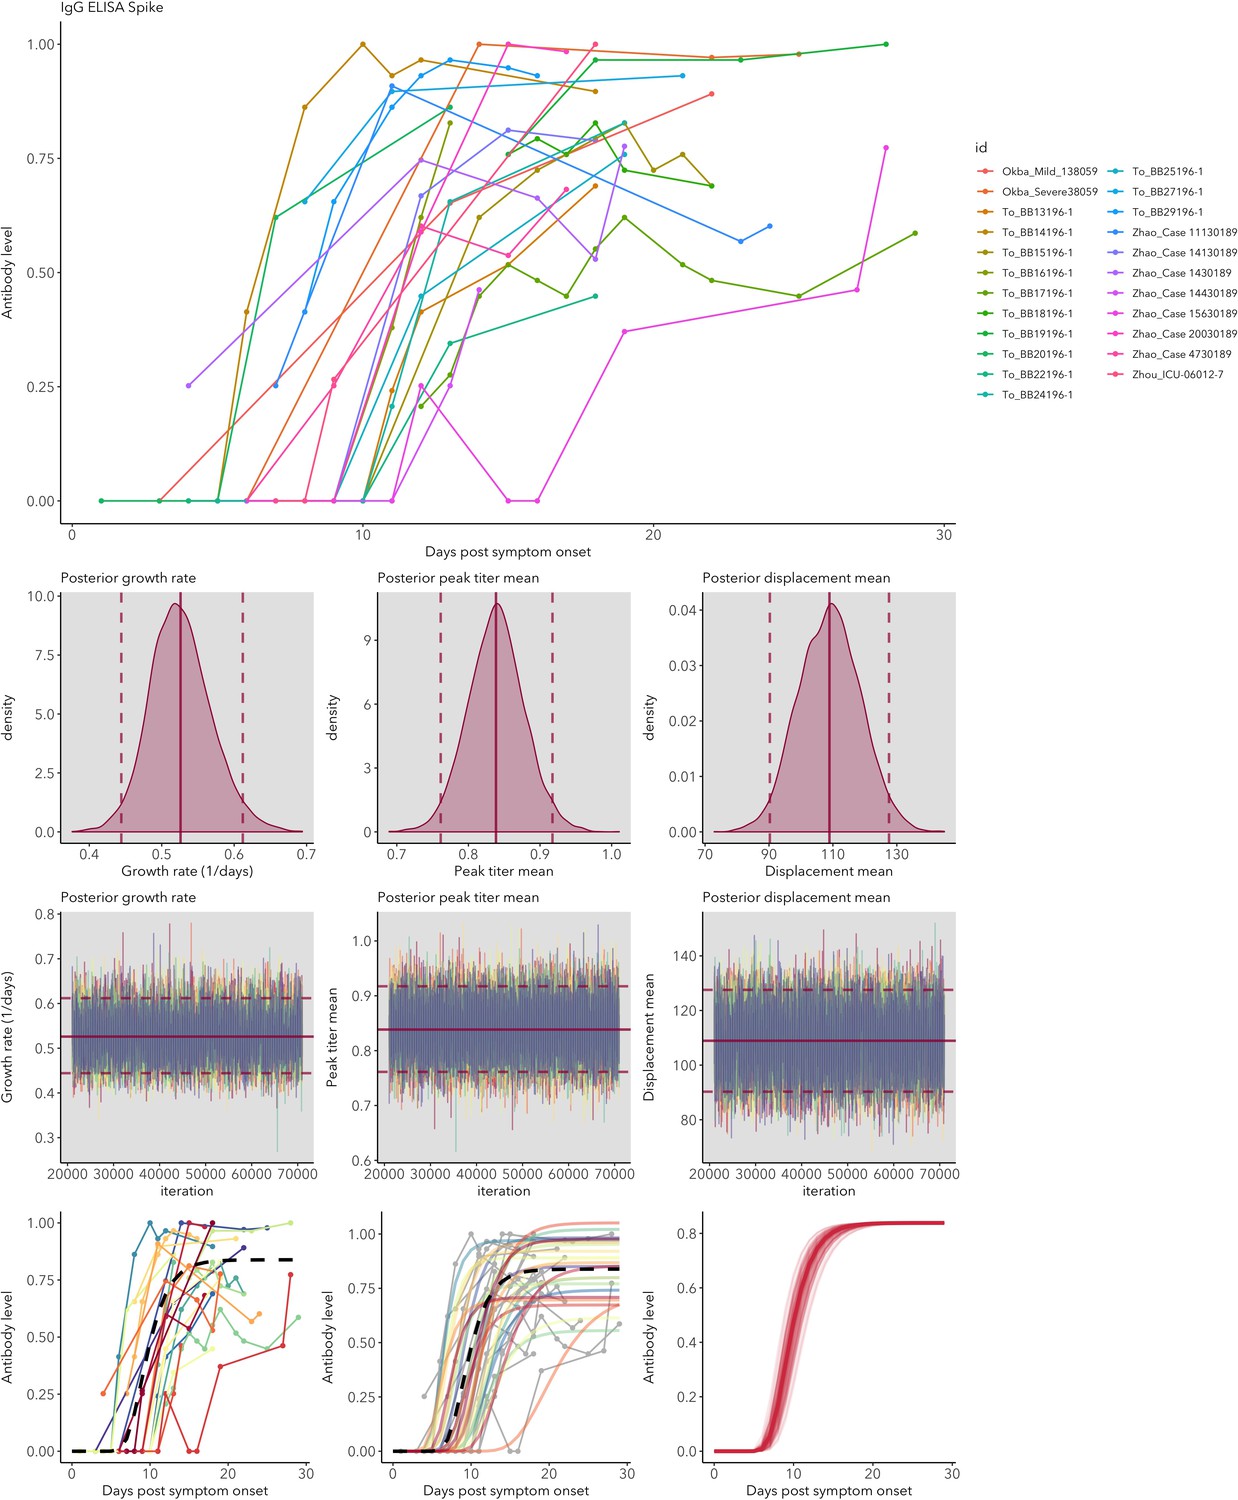
IgG ELISA-Spike fitted antibody kinetics.
Appendix 1—figure 3
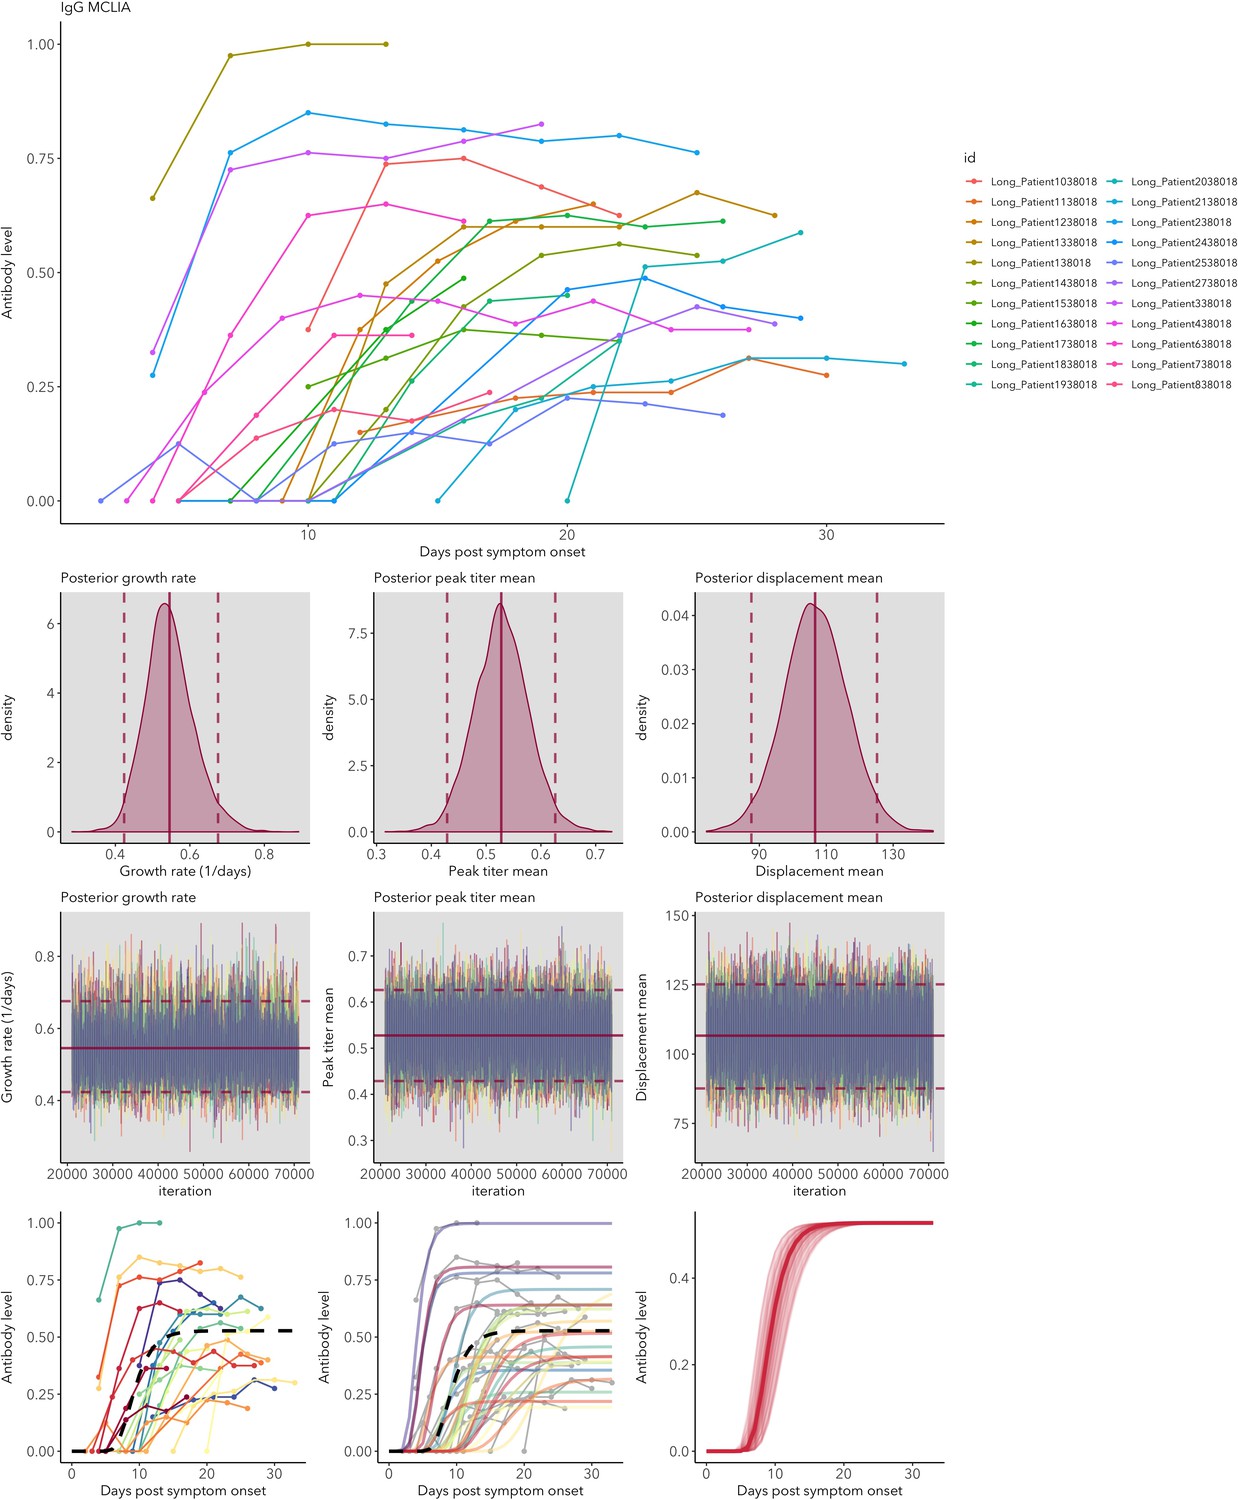
IgG MCLIA fitted antibody kinetics.
Appendix 1—figure 4
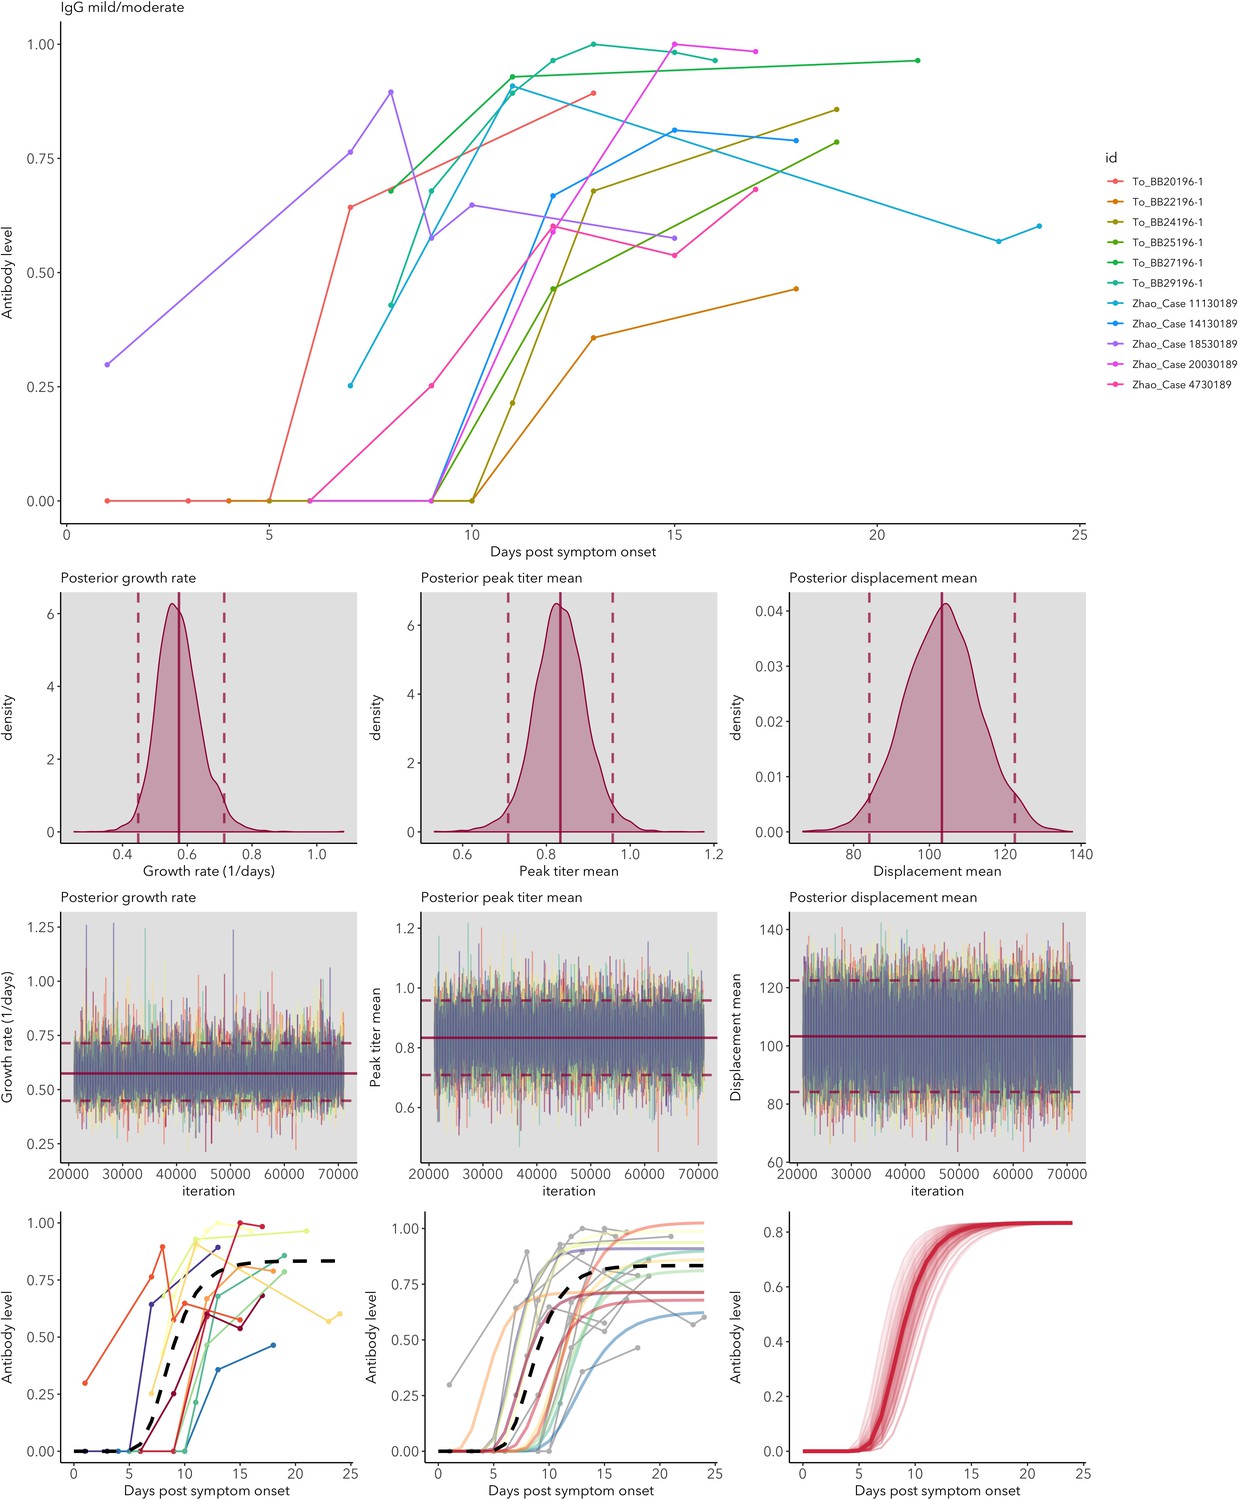
IgG mild/moderate cases fitted antibody kinetics.
Appendix 1—figure 5
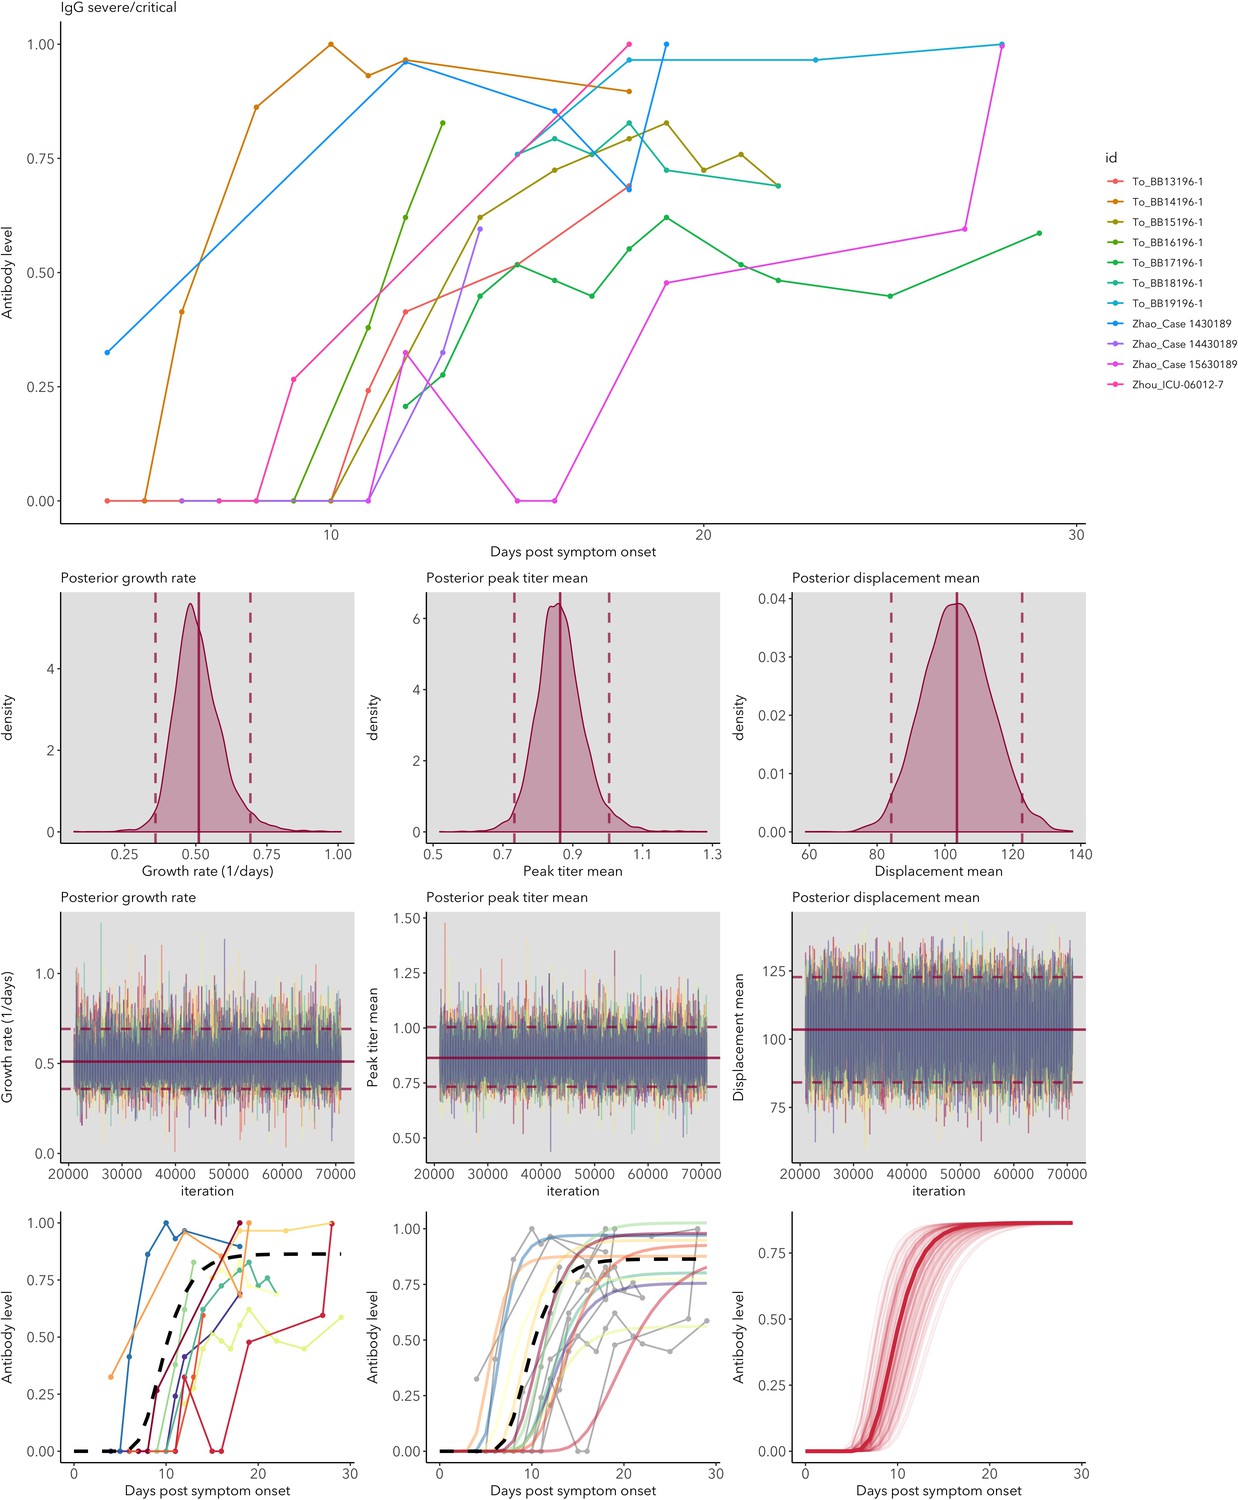
IgG severe/critical cases fitted antibody kinetics.
Appendix 1—figure 6
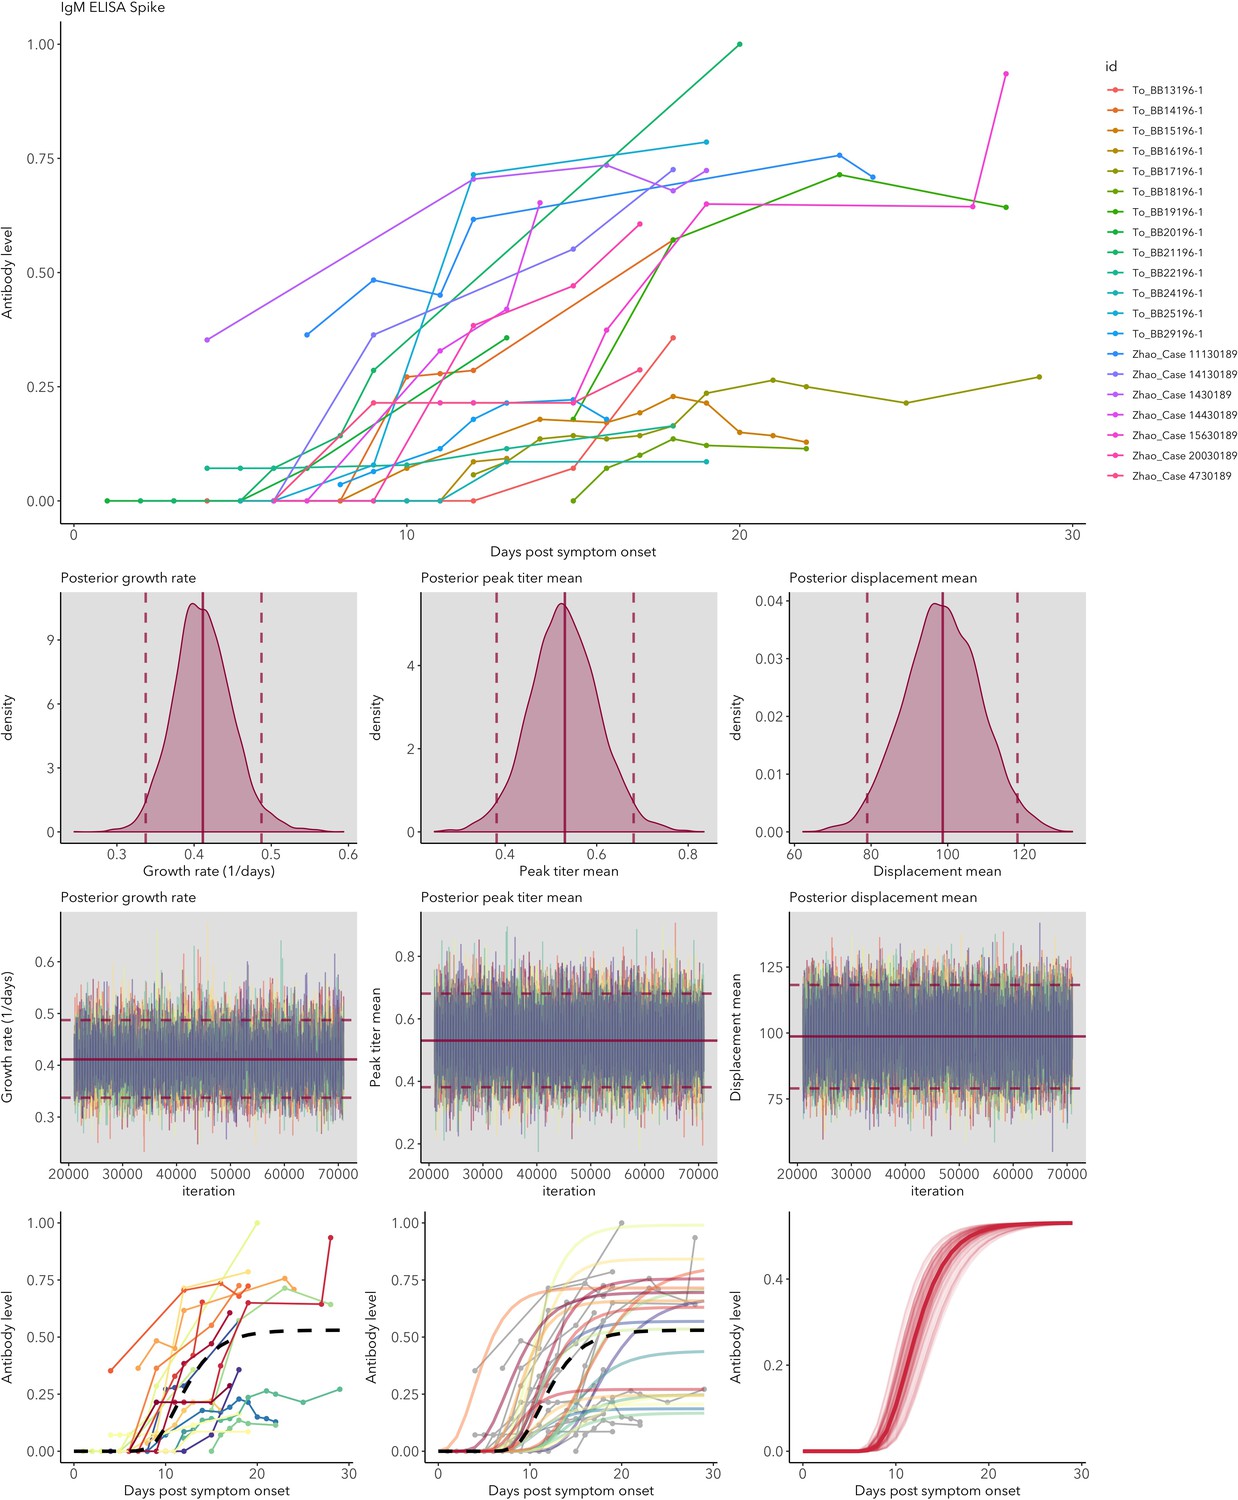
IgM ELISA-Spike fitted antibody kinetics.
Appendix 1—figure 7
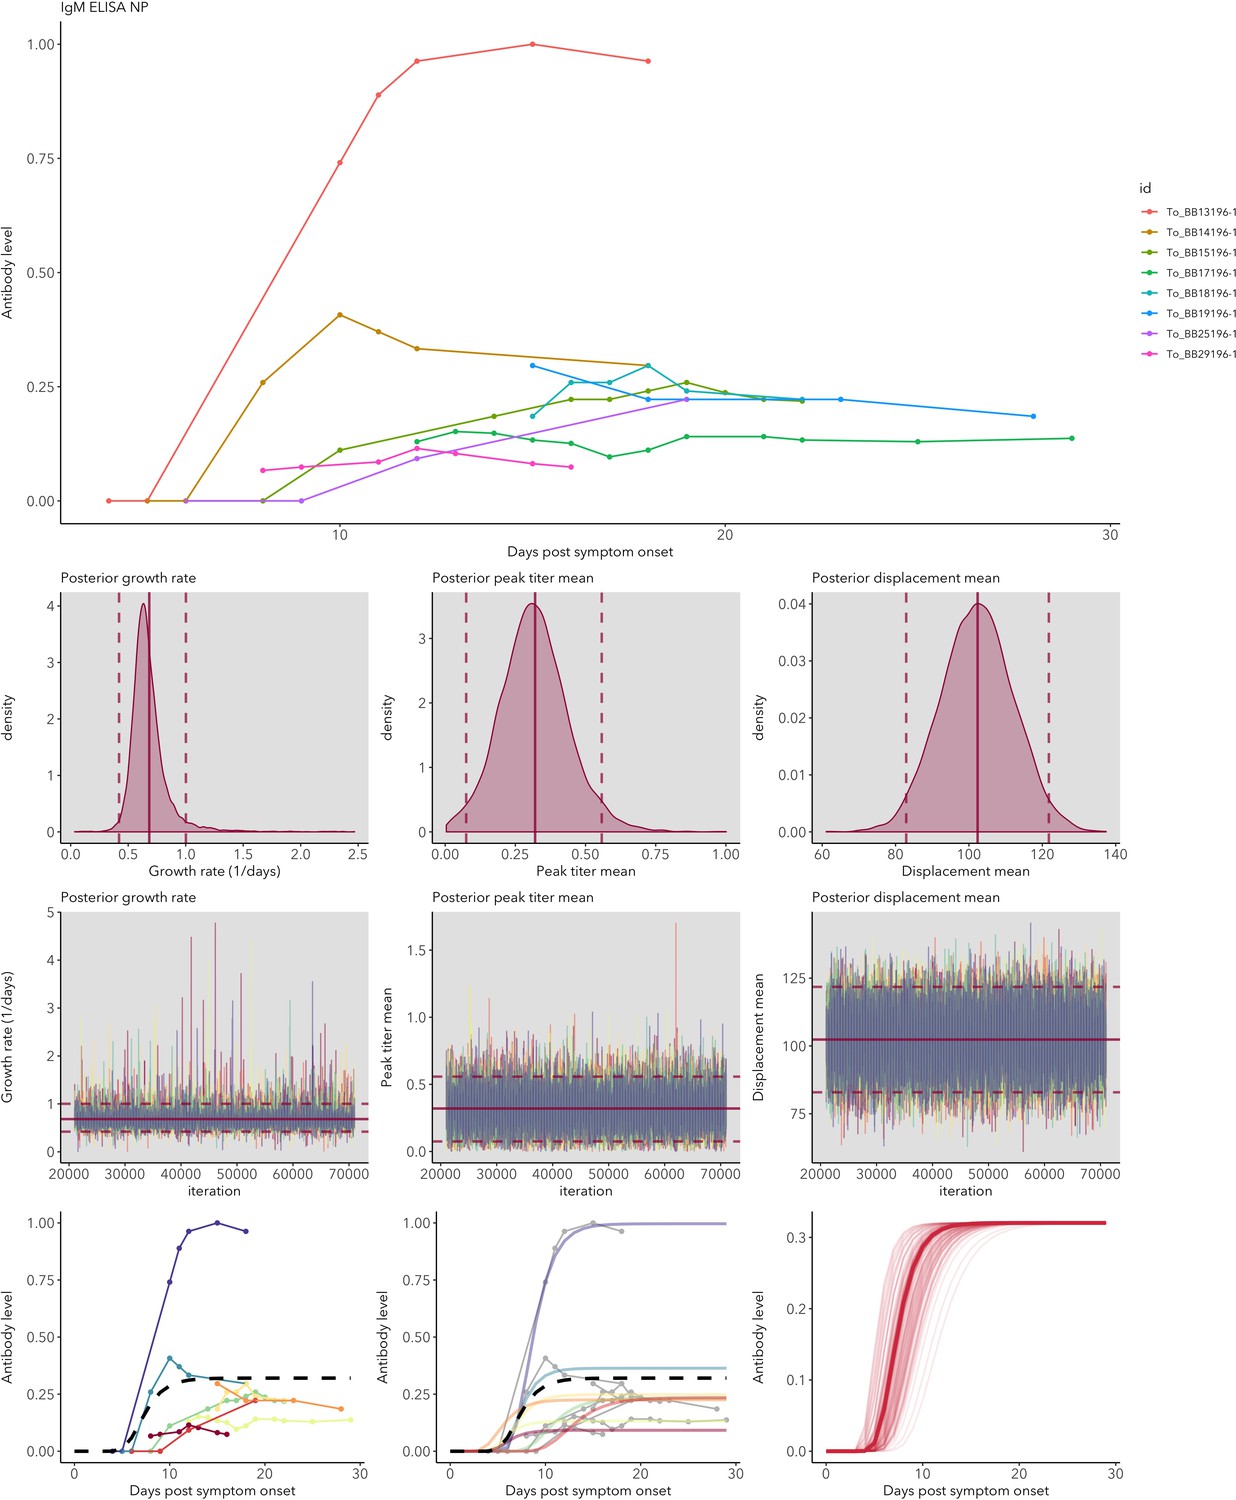
IgM ELISA-NP fitted antibody kinetics.
Appendix 1—figure 8
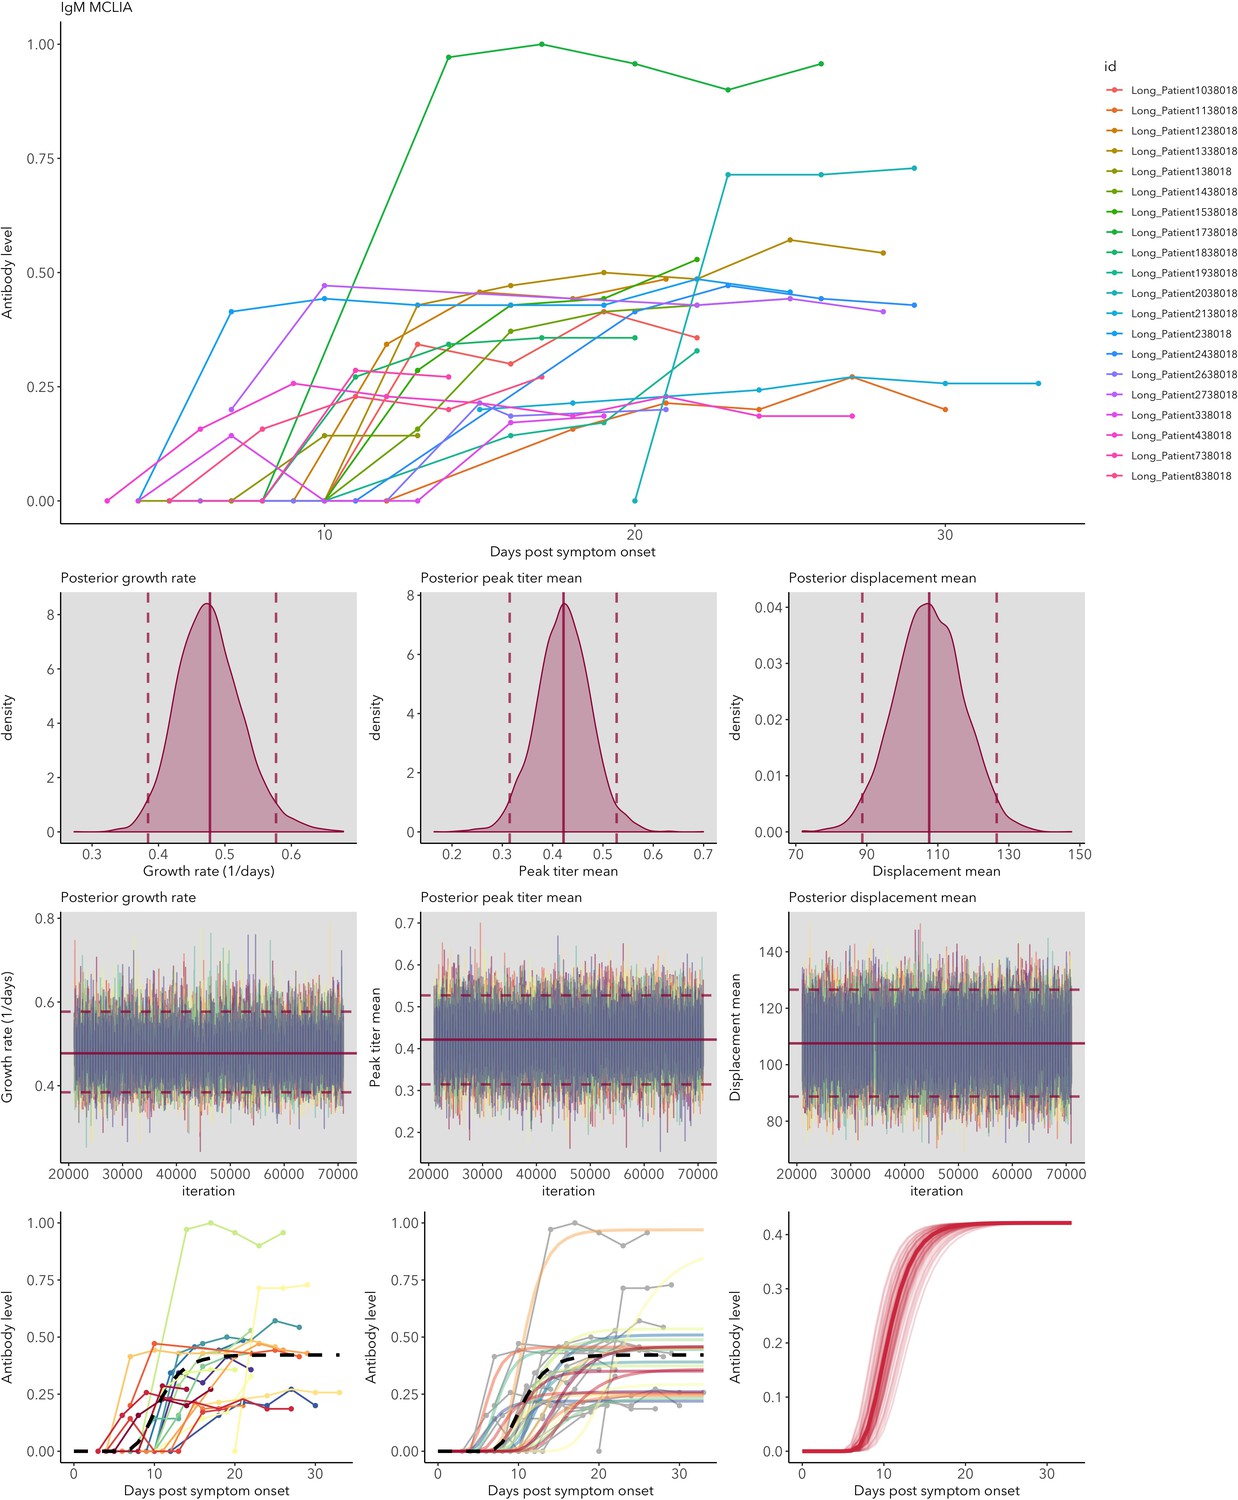
IgM MCLIA fitted antibody kinetics.
Appendix 1—figure 9
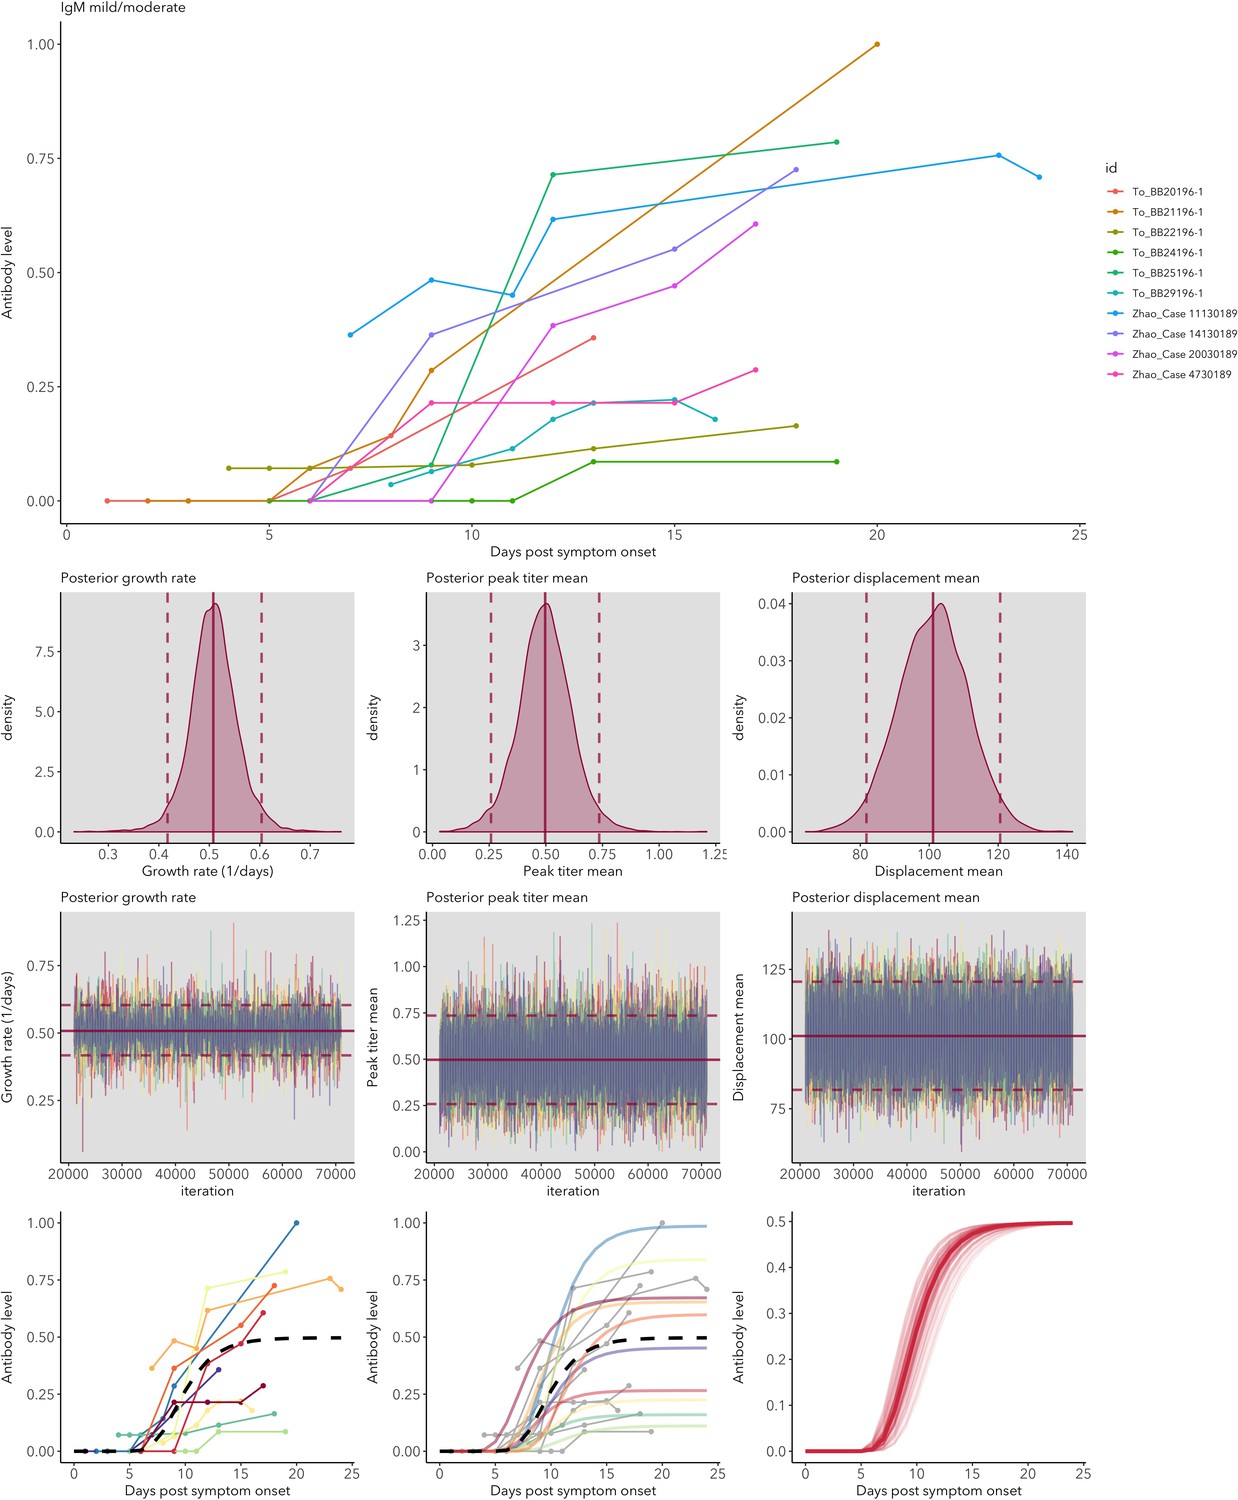
IgM mild/moderate cases fitted antibody kinetics.
Appendix 1—figure 10
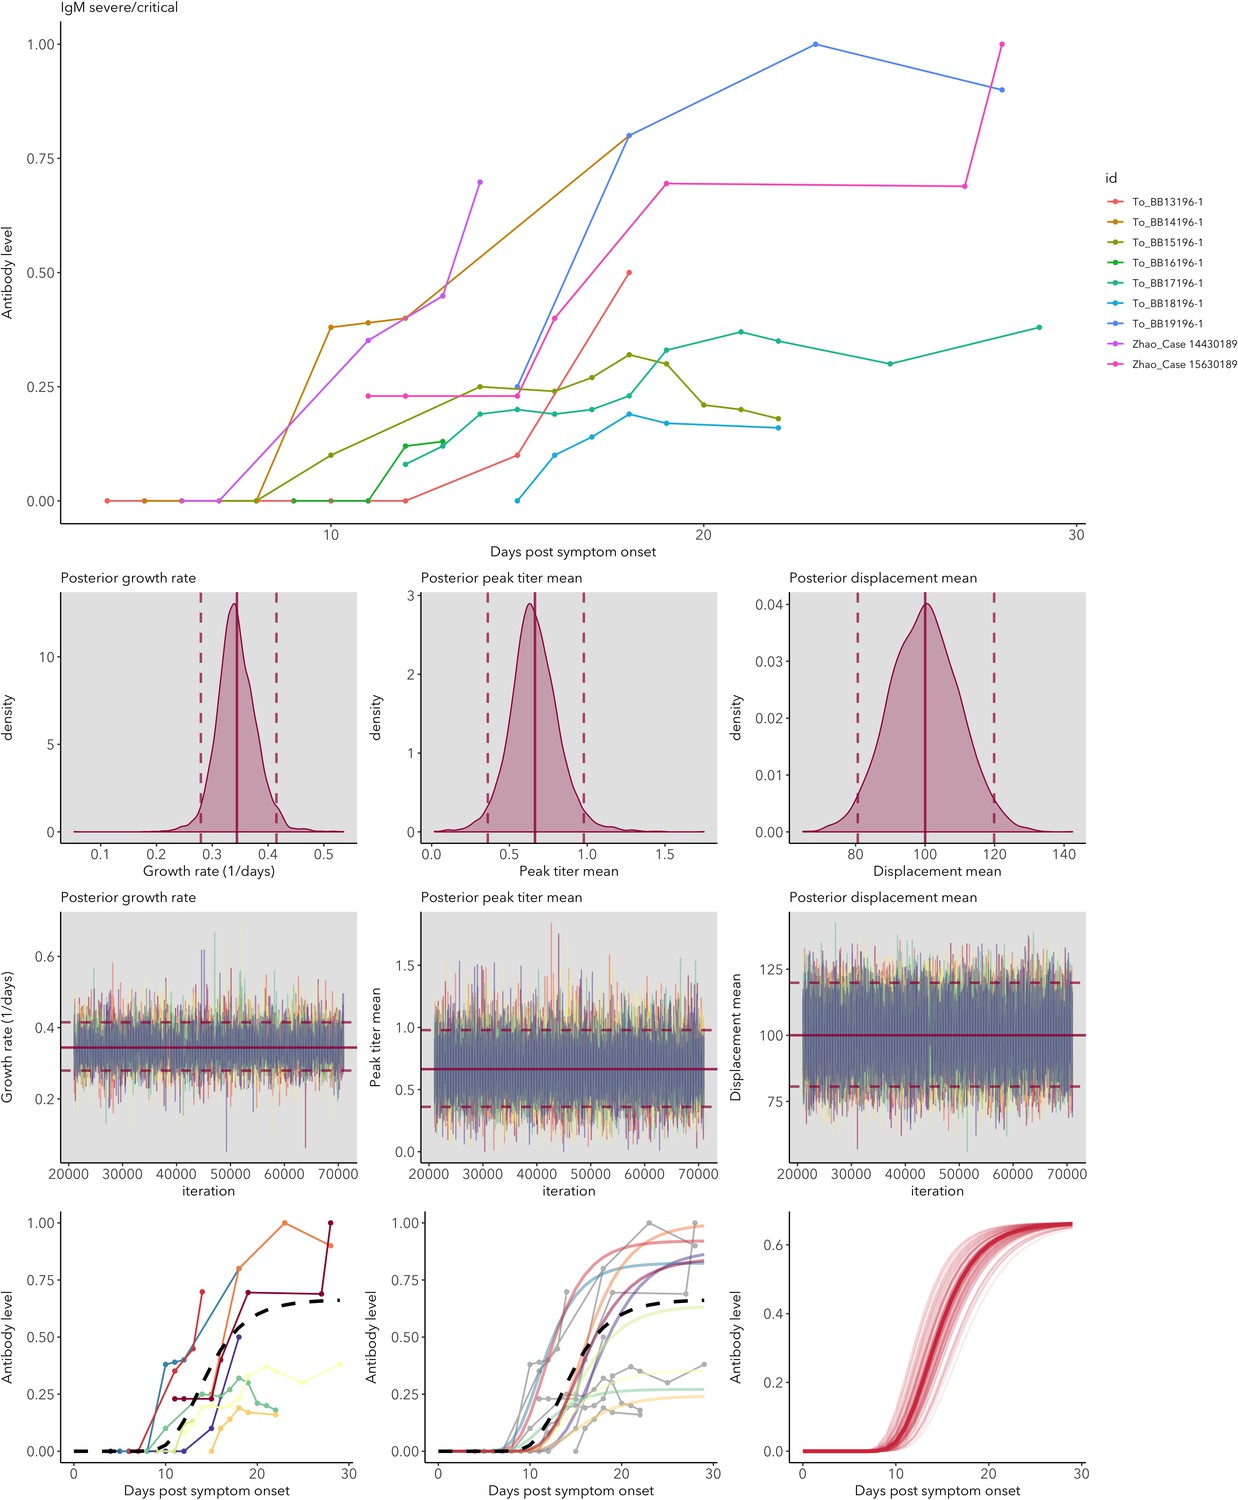
IgM severe/critical cases fitted antibody kinetics.
Tables
Table 1
Examples of how improved knowledge of antibody and RNA detection patterns can inform sampling designs.
| Question | What to test for | Optimal timing to test | Comments | Importance |
|---|---|---|---|---|
| Has an individual been exposed in the past? | IgG | 25-60(+) days post symptom onset | IgG persistence: possibly 1–2 years based on other human coronaviruses (Chang et al., 2005). | Transmission models (Weitz et al., 2020; Kucharski et al., 2020) Herd immunity (Lassaunière et al., 2020; Theel et al., 2020). |
| Is an individual currently infected? | Viral RNA | <30 days post-symptom onset | Preferable: sequential tests because of extensive variation in detection (Wölfel et al., 2020). Detection probability highest for lower respiratory tract or fecal samples, but upper respiratory tract samples are necessary to assess transmission potential. | Assess transmission risk to others; contact tracing Giordano et al., 2020; Parameterization of transmission models (Weitz et al., 2020; Kucharski et al., 2020). |
| How recently was an individual exposed? | IgM, IgG | >25 days post-symptom onset | IgG indicates exposure, which is more likely to be recent if IgM is also present, and longer ago if IgM is absent. | Recent exposure is more likely correlated with transmission risk, and is a useful measure for prioritizing contact tracing, notably for asymptomatic cases (Okba et al., 2020). |
Additional files
-
Source code 1
R code.
- https://cdn.elifesciences.org/articles/60122/elife-60122-code1-v2.zip
-
Source data 1
Extracted data used for meta-analysis.
- https://cdn.elifesciences.org/articles/60122/elife-60122-data1-v2.csv
-
Transparent reporting form
- https://cdn.elifesciences.org/articles/60122/elife-60122-transrepform-v2.docx
Download links
A two-part list of links to download the article, or parts of the article, in various formats.
Downloads (link to download the article as PDF)
Open citations (links to open the citations from this article in various online reference manager services)
Cite this article (links to download the citations from this article in formats compatible with various reference manager tools)
Quantifying antibody kinetics and RNA detection during early-phase SARS-CoV-2 infection by time since symptom onset
eLife 9:e60122.
https://doi.org/10.7554/eLife.60122


