Cytosolic calcium regulates cytoplasmic accumulation of TDP-43 through Calpain-A and Importin α3
- Department of Brain & Cognitive Sciences, DGIST, Republic of Korea
- Protein dynamics-based proteotoxicity control laboratory, Basic research lab, DGIST, Republic of Korea
- School of Biological Sciences, Seoul National University, Republic of Korea
- Dementia research group, Korea Brain Research Institute (KBRI), Republic of Korea
- Taipei Medical University/Institute of Molecular Biology, Academia Sinica, Taiwan
Figures
Figure 1 with 1 supplement
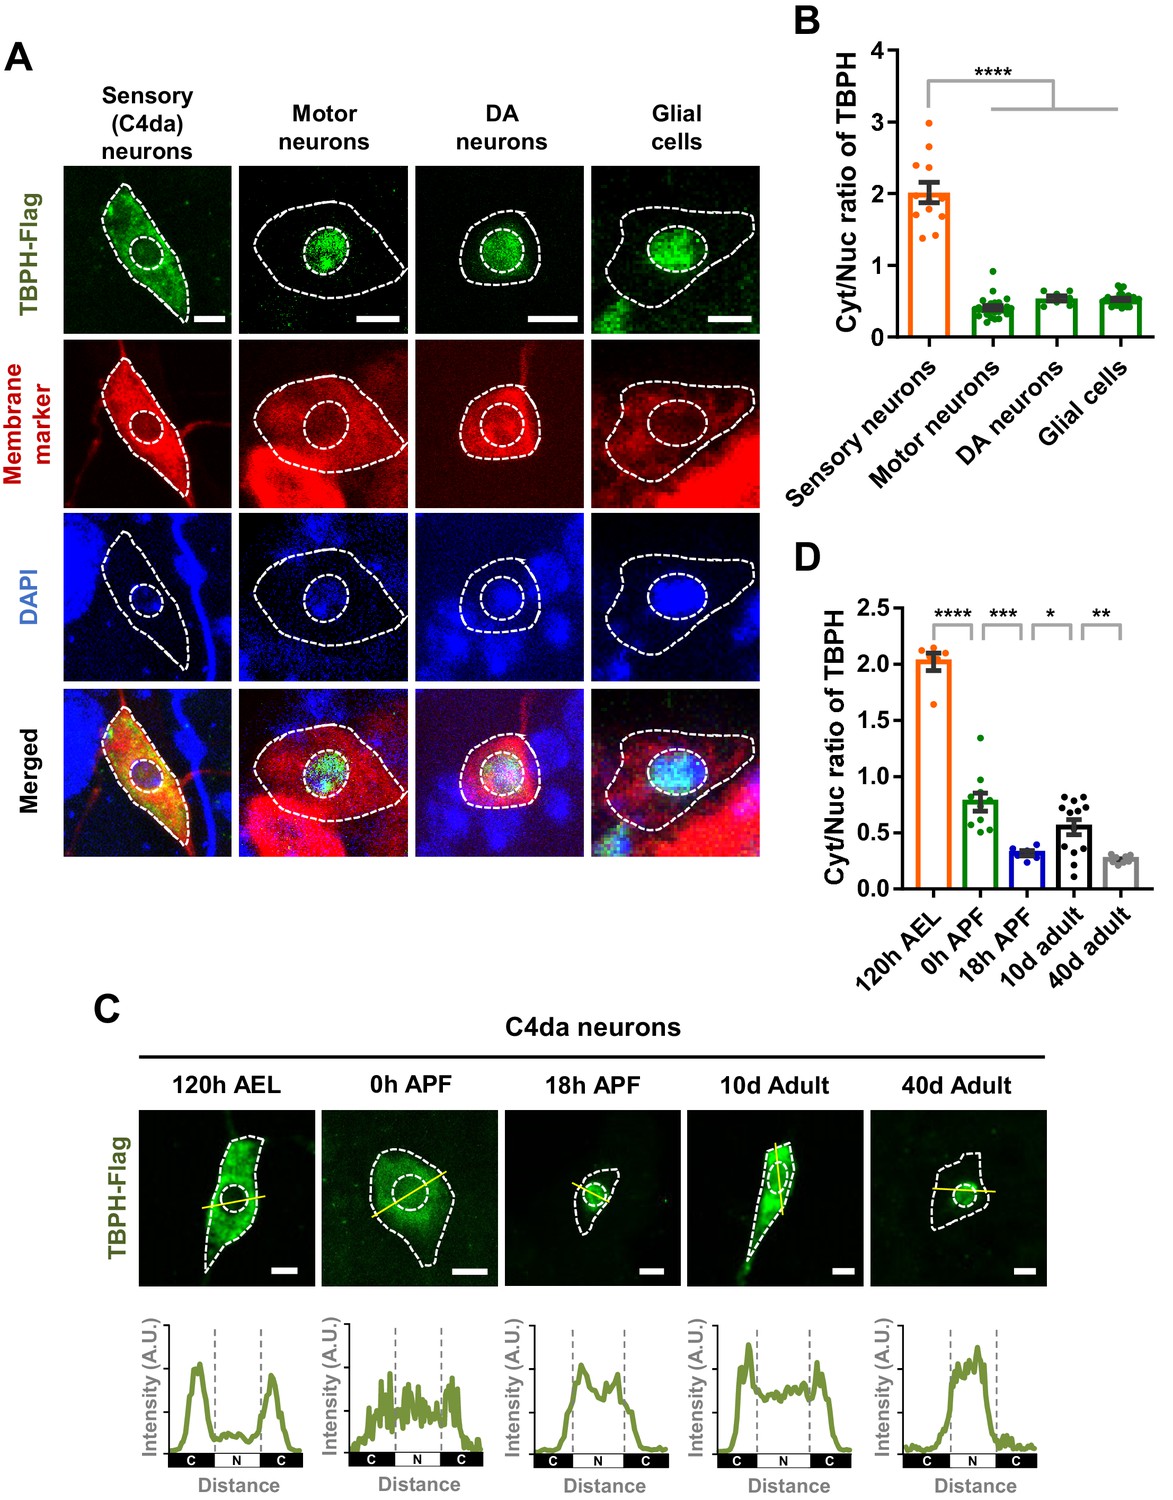
Cell type- and developmental stage-dependent variation in nucleocytoplasmic localization of TBPH.
(A) Subcellular localization of overexpressed TBPH-Flag proteins in sensory (C4da), motor, and dopaminergic (DA) neurons, and in glial cells [Genotype: Sensory (C4da) neurons, +/+;UAS-TBPH-Flag-HA/ppk1a-Gal4, Motor neurons, +/+;UAS-TBPH-Flag-HA/D42-Gal4,UAS-mCD8-RFP, DA neurons, +/+;UAS-TBPH-Flag-HA/TH-Gal4,UAS-CD4-tdTom, Glial cells, +/+;UAS-TBPH-Flag-HA/repo-Gal4,UAS-mCD8-RFP]. DAPI staining was used to mark the nuclei. Merged immunohistochemical images of TBPH proteins (green), plasma membranes (red), and DAPI (blue) are presented at the bottom. Outer and inner dashed lines indicate borders of cell bodies and nuclei, respectively (Scale bars, 5 μm). (B) Quantification of cytoplasmic/nuclear (Cyt/Nuc) ratio of TBPH-Flag proteins in four different cell types described in A. ****p<1.0×10⁻⁴ by one-way ANOVA with Tukey’s post-hoc correction; error bars, ± SEM; n = 12 for sensory neurons, n = 24 for motor neurons, n = 7 for DA neurons, n = 28 for glial cells. (C) Subcellular localization of overexpressed TBPH-Flag proteins in C4da neurons at five different developmental time points (120 hr AEL, 0 hr APF, 18 hr APF, 10-day adult, and 40-day adult) [Genotype: +/+;UAS-TBPH-Flag-HA/ppk1a-Gal4,UAS-mCD8-RFP]. Outer and inner dashed lines indicate the borders of cell bodies and nuclei, respectively (scale bars, 5 μm). The intensity profile of fluorescent signals representing TBPH proteins across cell bodies along yellow lines are presented at the bottom. The gray dashed lines mark borders of nuclei (bottom panels). (D) Quantification of Cyt/Nuc ratio of TBPH-Flag proteins at five different developmental time points described in C. ****p<1.0×10⁻⁴, ***p=0.0007, **p=0.0042, *p=0.0369 by two-tailed t-test; error bars, ± SEM; n = 6 for 120 hr AEL, n = 9 for 0 hr APF, n = 6 for 18 hr APF, n = 11 for 10-day adult, n = 8 for 40-day adult.
-
Figure 1—source data 1
Numerical data plotted in Figure 1B, D and Figure 1—figure supplement 1B.
- https://cdn.elifesciences.org/articles/60132/elife-60132-fig1-data1-v3.xlsx
Figure 1—figure supplement 1
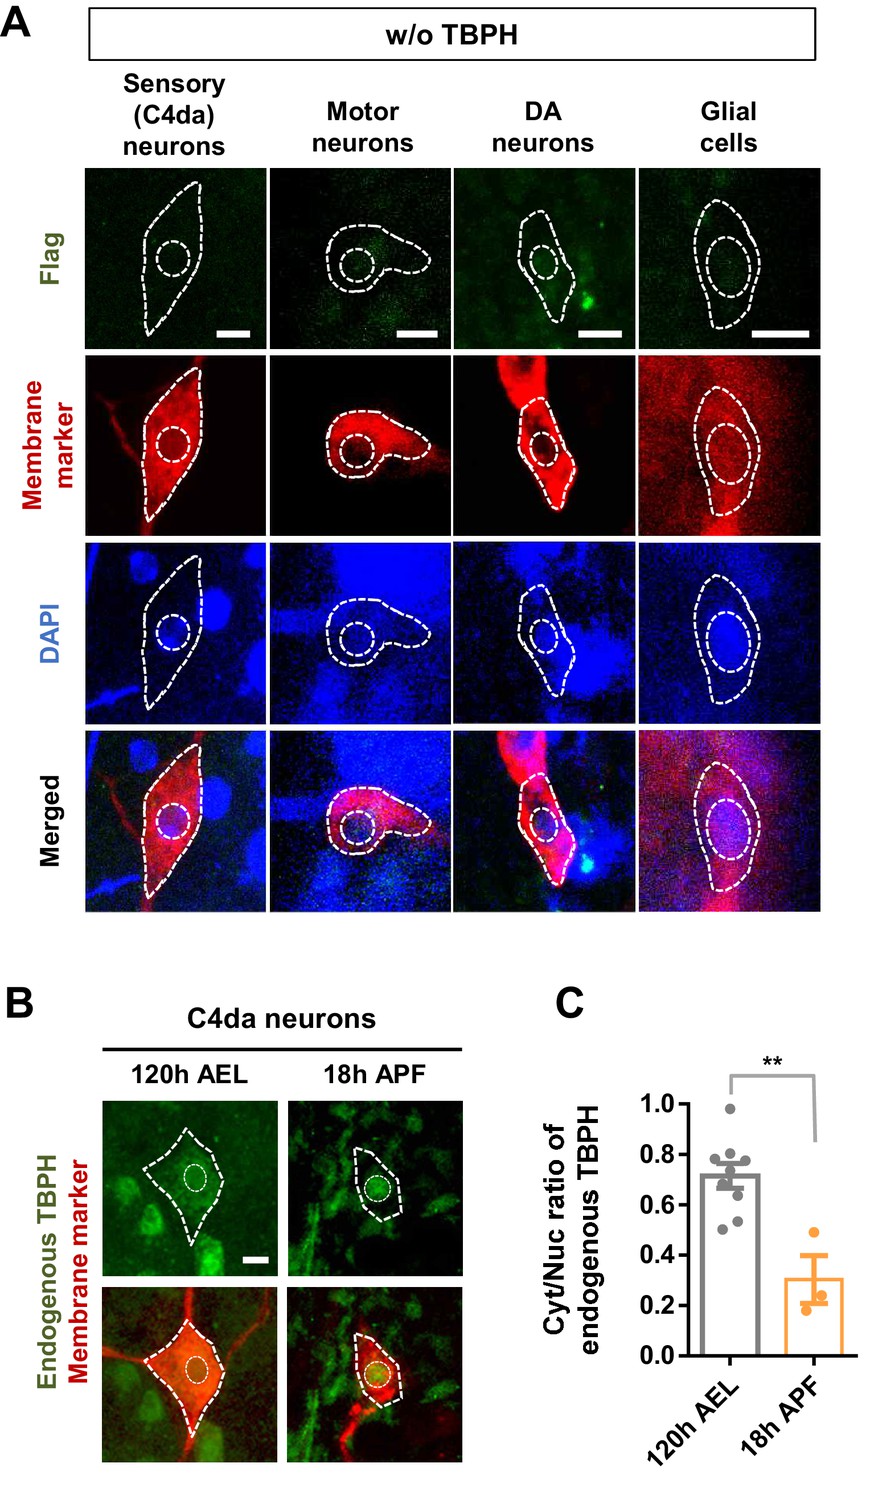
Developmental stage-dependent changes in nucleocytoplasmic localization of endogenous TBPH.
(A) Negative control for Flag immunostaining in sensory, motor, and DA neurons and glial cells at 120 hr AEL [Genotype: Sensory (C4da) neurons, +/+;ppk1a-Gal4/+, Motor neurons, +/+;D42-Gal4,UAS-mCD8-RFP/+, DA neurons, +/+;TH-Gal4,UAS-CD4-tdTom/+, Glial cells, +/+;repo-Gal4,UAS-mCD8-RFP/+]. (B) Subcellular localization of endogenous TBPH proteins in C4da neurons at 120 hr AEL and 18 hr APF. Merged images of TBPH proteins (green) and plasma membranes (red) are presented at the bottom [Genotype: +/+;UAS-mCD8-RFP/ppk1a-Gal4]. Outer and inner dashed lines indicate borders of cell bodies and nuclei, respectively (Scale bar, 5 μm). (C) Quantification of Cyt/Nuc ratio of endogenous TBPH proteins in C4da neurons at 120 hr AEL and 18 hr APF. **p=0.0021 by two-tailed t-test; error bars, ± SEM; n = 9 for 120 hr AEL, n = 3 for 18 hr APF.
Figure 2 with 4 supplements
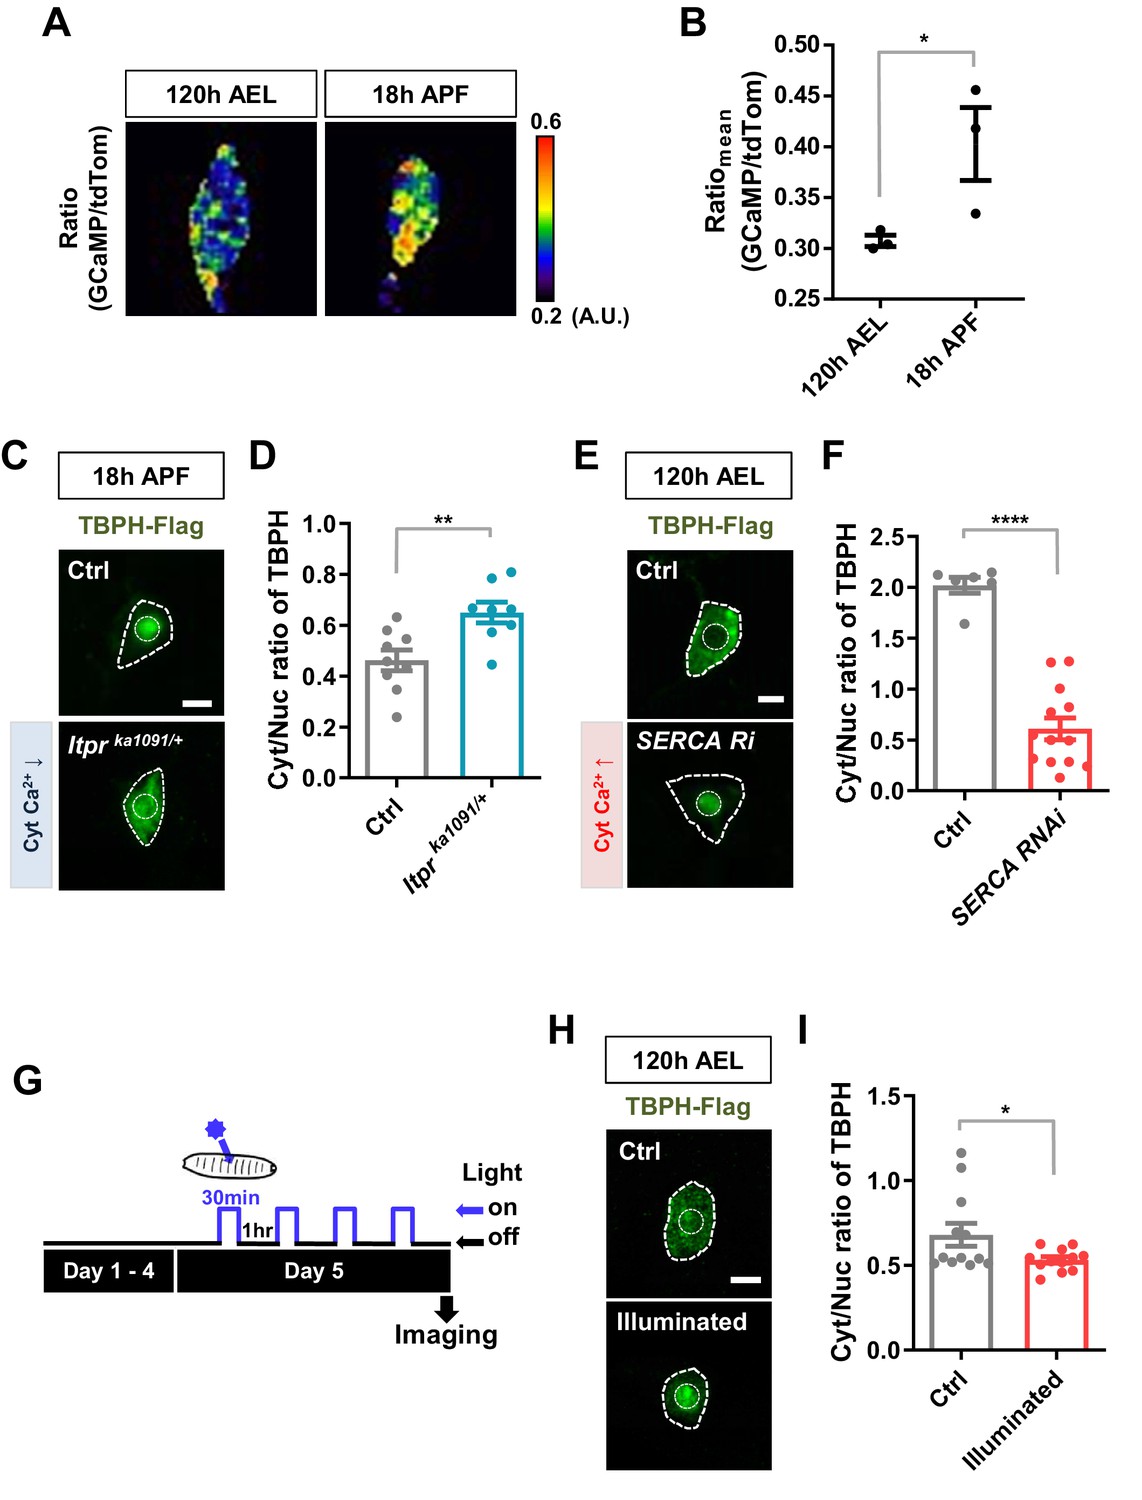
Regulation of nucleocytoplasmic translocation of TBPH by cytoplasmic calcium.
(A) Representative pseudo-colored images representing relative intensity ratios (i.e. calcium level) of GCaMP over tdTom (i.e. overexpressed membrane marker proteins used as a control) in C4da neurons at 120 hr AEL and 18 hr APF [Genotype: +/+;UAS-tdTomato P2A GCaMP5G/ppk1a-Gal4]. (B) Quantification of GCaMP/tdTom mean intensity ratios at 120 hr AEL and 18 hr APF. *p=0.0295 by one-tailed t-test; error bars,± SEM; n = 3 neurons. (C) Subcellular localization of overexpressed TBPH-Flag proteins in C4da neurons of Ctrl or Itprka1091/+ mutants (Itprka1091/+) at 18 hr APF [Genotype: Ctrl, +/+;ppk1a-Gal4,UAS-TBPH-Flag-HA/+, Itprka1091/+, +/+;ppk1a-Gal4,UAS-TBPH-Flag-HA/Itprka1091]. Outer and inner dashed lines indicate borders of cell bodies and nuclei, respectively (Scale bar, 5 μm). (D) Quantification of Cyt/Nuc ratio of TBPH-Flag proteins in C4da neurons of Ctrl or Itprka1091/+ at 18 hr APF. **p=0.0054 by two-tailed t-test; error bars,± SEM; n = 9 for Ctrl, n = 8 for Itprka1091/+. (E) Subcellular localization of overexpressed TBPH-Flag proteins in C4da neurons of Ctrl or expressing SERCA RNAi (SERCA Ri) at 120 hr AEL [Genotype: Ctrl, +/+;ppk1a-Gal4,UAS-TBPH-Flag-HA/+, SERCA Ri, UAS-SERCA RNAi/+;ppk1a-Gal4,UAS-TBPH-Flag-HA/+]. Outer and inner dashed lines indicate borders of cell bodies and nuclei, respectively (Scale bar, 5 μm). (F) Quantification of Cyt/Nuc ratio of TBPH-Flag proteins in C4da neurons of Ctrl or expressing SERCA Ri at 120 hr AEL. ****p<1.0×10⁻⁴ by two-tailed t-test; error bars,± SEM; n = 6 for Ctrl, n = 13 for SERCA Ri. (G) Experimental scheme of optogenetics. The blue light (470 nm) was applied four times to the larvae at 5 days AEL to optogenetically stimulate C4da neurons expressing channelrhodopsin. (H) Subcellular localization of overexpressed TBPH-Flag proteins in C4da neurons of Ctrl (not illuminated) or illuminated larvae [Genotype: 20XUAS-Chr2.T159C-HA/+;UAS-ChR2.S/ppk1a-Gal4,UAS-TBPH-Flag-HA]. Outer and inner dashed lines indicate borders of cell bodies and nuclei, respectively (scale bar, 5 μm). (I) Quantification of Cyt/Nuc ratio of TBPH-Flag proteins in C4da neurons of Ctrl (not illuminated) or illuminated larvae. *p=0.0447 by two-tailed t-test; error bars, ± SEM; n = 12 neurons.
-
Figure 2—source data 1
Numerical data plotted in Figure 2b, D, F, I and Figure 2—figure supplement 1B, D, G, I, J and 2B.
- https://cdn.elifesciences.org/articles/60132/elife-60132-fig2-data1-v3.xlsx
Figure 2—figure supplement 1
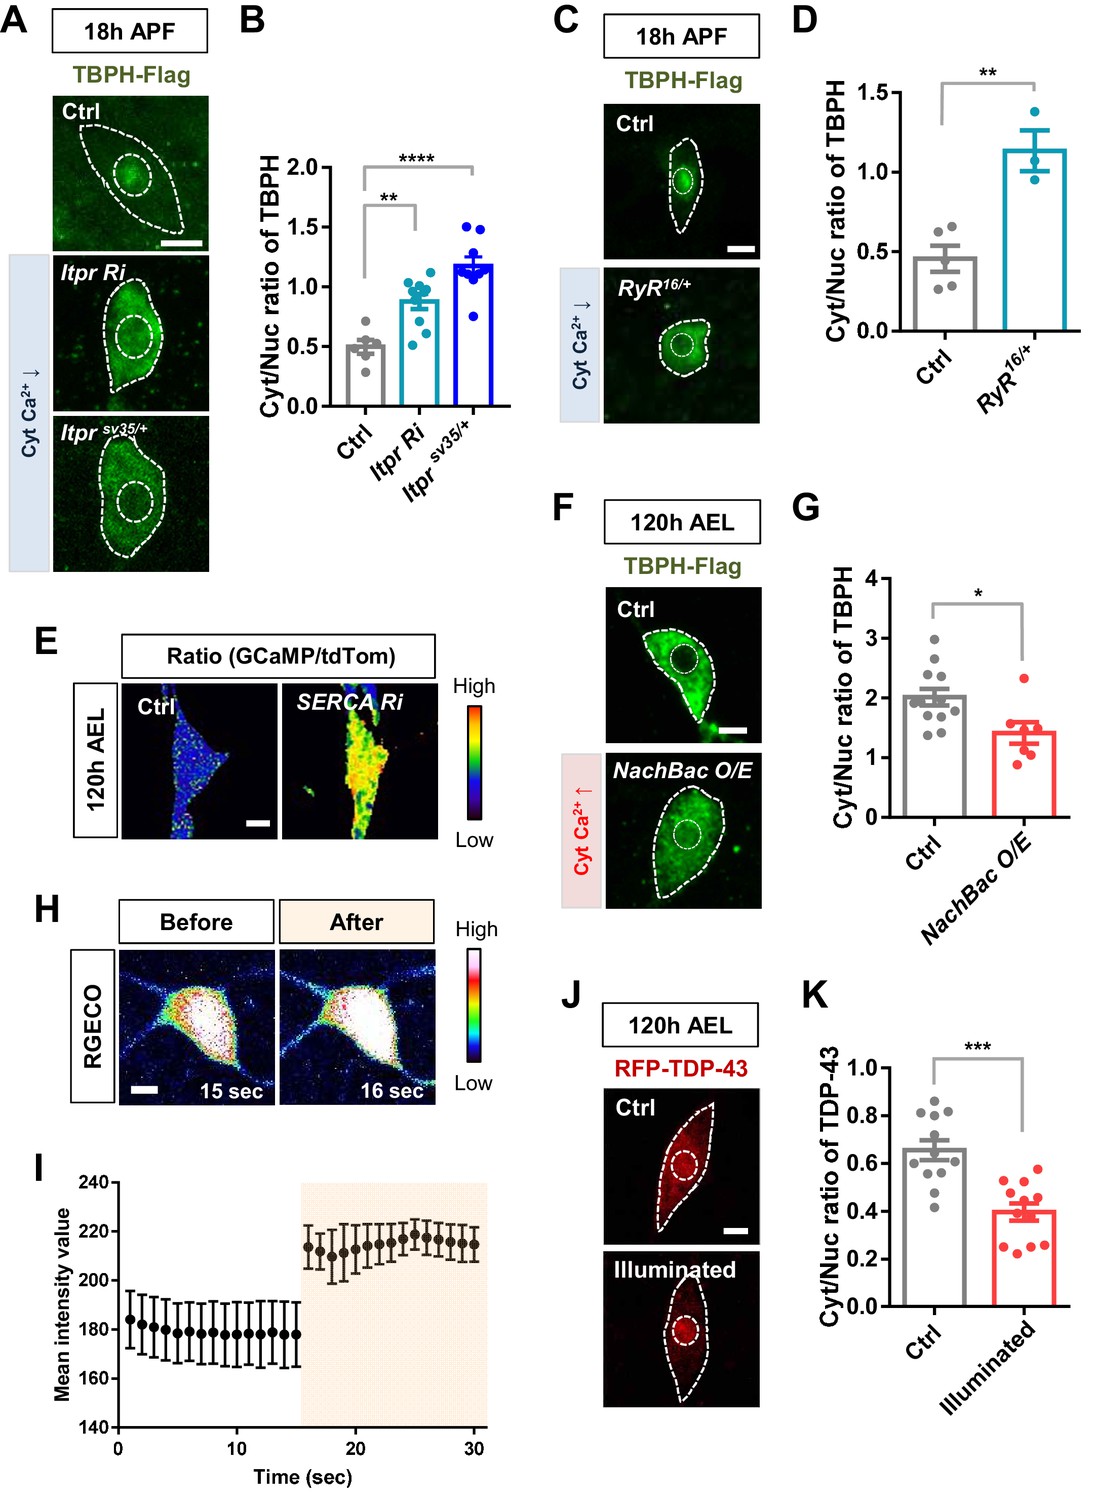
Regulation of nucleocytoplasmic translocation of TBPH/TDP-43 by cytoplasmic calcium.
(A) Subcellular localization of overexpressed TBPH-Flag proteins in C4da neurons of Ctrl, Itpr RNAi, or Itprsv35/+ mutants (Itprsv35/+) at 18 hr APF [Genotype: Ctrl, +/+;ppk1a-Gal4,UAS-TBPH-Flag-HA/+, Itpr Ri, +/Itpr RNAi;ppk1a-Gal4,UAS-TBPH-Flag-HA/+, Itprsv35/+, +/+;ppk1a-Gal4,UAS-TBPH-Flag-HA/Itprsv35]. Outer and inner dashed lines indicate borders of cell bodies and nuclei, respectively (scale bar, 5 μm). (B) Quantification of Cyt/Nuc ratio of TBPH-Flag proteins in C4da neurons of Ctrl, Itpr Ri, or Itprsv35/+ at 18 hr APF. ****p<1.0×10⁻⁴, **p=0.0012 by two-tailed t-test; error bars, ± SEM; n = 6 for Ctrl, n = 10 for Itpr Ri, n = 9 for Itprsv35/+. (C) Subcellular localization of overexpressed TBPH-Flag proteins in C4da neurons of Ctrl or RyR16/+ mutants (RyR16/+) at 18 hr APF [Genotype: Ctrl, +/+;ppk1a-Gal4,UAS-TBPH-Flag-HA/+, RyR16/+, RyR16/+;ppk1a-Gal4,UAS-TBPH-Flag-HA/+]. Outer and inner dashed lines indicate borders of cell bodies and nuclei, respectively (scale bar, 5 μm). (D) Quantification of Cyt/Nuc ratio of TBPH-Flag proteins in C4da neurons of Ctrl or RyR16/+ at 18 hr APF. **p=0.0033 by two-tailed t-test; error bars,± SEM; n = 5 for Ctrl, n = 3 for RyR16/+. (E) Representative pseudo-colored images representing relative intensity ratios of GCaMP over tdTom in C4da neurons at 120 hr AEL and 18 hr APF [Genotype: Ctrl, +/+;UAS-tdTomato P2A GCaMP5G/ppk1a-Gal4, SERCA Ri, UAS-SERCA RNAi/+;UAS-tdTomato P2A GCaMP5G/ppk1a-Gal4] (scale bar, 5 μm). (F) Subcellular localization of overexpressed TBPH-Flag proteins in C4da neurons of Ctrl or overexpressing NachBac (NachBac O/E) at 120 hr AEL [Genotype: Ctrl, +/+;ppk1a-Gal4,UAS-TBPH-Flag-HA/+, NachBac O/E, +/+;ppk1a-Gal4,UAS-TBPH-Flag-HA/UAS-NachBac]. Outer and inner dashed lines indicate borders of cell bodies and nuclei, respectively (scale bar, 5 μm). (G) Quantification of Cyt/Nuc ratio of TBPH-Flag proteins in C4da neurons of Ctrl or overexpressing NachBac at 120 hr AEL. *p=0.0188 by two-tailed t-test; error bars,± SEM; n = 12 for Ctrl, n = 8 for NachBac O/E. (H) Representative pseudo-colored images of RGECO expressed in C4da neurons before (15 s) and after (16 s) optogenetic stimulation with blue light (470 nm) at 120 hr AEL. RGECO fluorescent proteins were used as an intracellular calcium indicator [Genotype: UAS-R-GECO1-IR1,UAS-R-GECO1.L-IR2/20XUAS-ChR2.T159C-HA;UAS-ChR2.S/ppk1a-Gal4] (scale bar, 5 μm). (I) Quantification of mean fluorescence intensity of RGECO expressed in C4da neurons before and after optogenetic stimulation in H. n = 3 neurons. (J) Subcellular localization of overexpressed RFP-TDP-43 proteins in C4da neurons of Ctrl (not illuminated) or illuminated larvae [Genotype: 20XUAS-ChR2.T159C-HA/+;UAS-3xMyc-RFP-TDP-43/ppk1a-Gal4]. Outer and inner dashed lines indicate borders of cell bodies and nuclei, respectively (scale bar, 5 μm). (K) Quantification of Cyt/Nuc ratio of RFP-TDP-43 proteins in C4da neurons of Ctrl (not illuminated) or illuminated larvae. ***p=0.0001 by two-tailed t-test; error bars, ± SEM; n = 12.
Figure 2—figure supplement 2
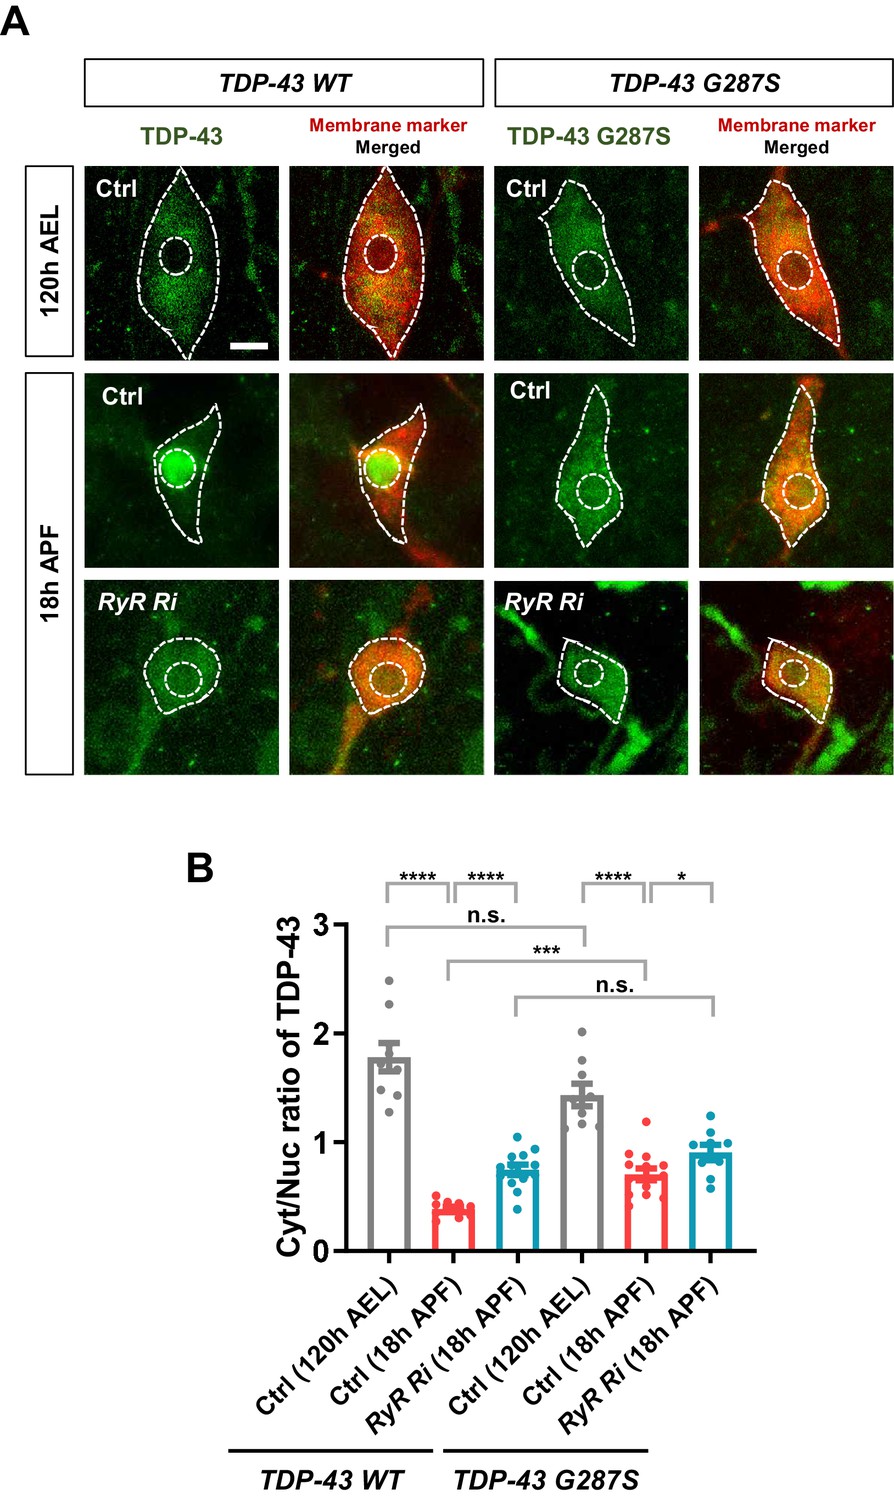
Developmentally regulated nucleocytoplasmic translocation of TDP-43 and ALS-linked TDP-43 G287S modulated by cytoplasmic calcium.
(A) Subcellular localization of TDP-43 WT or TDP-43 G287S proteins in C4da neurons of Ctrl or RyR RNAi at 120 hr AEL and 18 hr APF. [Genotype: TDP-43 WT (Ctrl), UAS-TDP-43-WT/+;ppk1a-Gal4,UAS-CD8-RFP/+, TDP-43 WT (RyR Ri), UAS-TDP-43-WT/RyR RNAi;ppk1a-Gal4,UAS-CD8-RFP/+, TDP-43 G287S (Ctrl), UAS-TDP-43 G287S/+;ppk1a-Gal4,UAS-CD8-RFP/+, TDP-43 G287S (RyR Ri), UAS-TDP-43 G287S/RyR RNAi;ppk1a-Gal4,UAS-CD8-RFP/+]. Outer and inner dashed lines indicate borders of cell bodies and nuclei, respectively (scale bar, 5 μm). (B) Quantification of Cyt/Nuc ratio of TDP-43 WT or G287S proteins in C4da neurons of Ctrl or RyR Ri at 18 hr APF. ****p<1.0×10⁻⁴, ***p=0.0001, *p=0.0322, N.S., not significant, p=0.0648 by two-tailed t-test; error bars,± SEM; from left to right, n = 9 for TDP-43 WT (Ctrl, 120 hr AEL), n = 10 for TDP-43 WT (Ctrl, 18 hr APF), n = 13 for TDP-43 WT (RyR Ri, 18 hr APF), n = 9 for TDP-43 G287S (Ctrl, 120 hr AEL), n = 14 for TDP-43 G287S (Ctrl, 18 hr APF), n = 9 for TDP-43 G287S (RyR Ri, 18 hr APF).
Figure 2—video 1
Rolling response of larva upon optogenetic stimulation of C4da neurons expressing channelrhodopsin [Genotype: 20XUAS-ChR2.T159C-HA/+;UAS-ChR2.S/ppk1a-Gal4].
Figure 2—video 2
Monitoring dynamic changes of intracellular calcium level in a C4da neuron before and after optogenetic stimulation.
RGECO fluorescent proteins were used as an intracellular calcium indicator [Genotype: UAS-R-GECO1-IR1,UAS-R-GECO1.L-IR2/20XUAS-ChR2.T159C-HA;UAS-ChR2.S/ppk1a-Gal4] (scale bar, 5 μm).
Figure 3
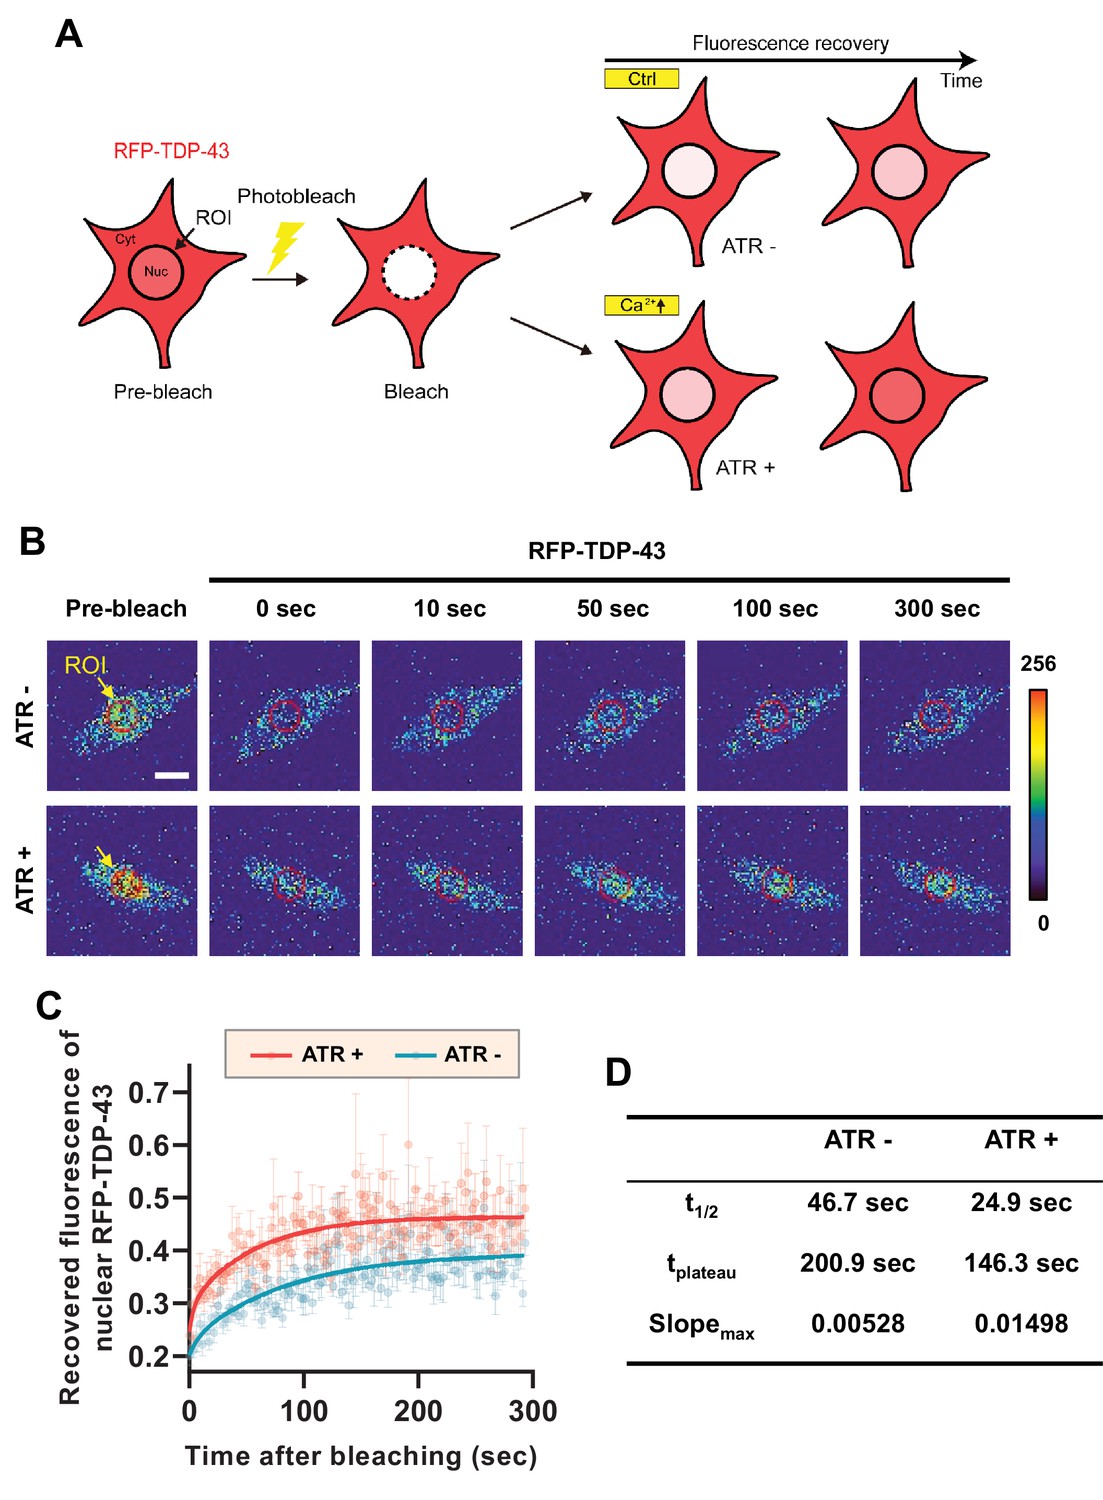
Optogenetic stimulation facilitates nuclear import of RFP-TDP-43 in C4da neurons.
(A) An experimental scheme of fluorescence recovery after photobleaching (FRAP) analysis of RFP-TDP-43 in the nucleus to assess its nuclear import after optogenetic stimulation. (B) Time-lapsed images of RFP-TDP-43 (pseudo-colored image) nuclear import dynamics in C4da neurons. Nuclear area is selected as region of interest (ROI) (scale bar, 5 μm). (C) FRAP analysis comparing recovery kinetics of RFP-TDP-43 signal in the nucleus of C4da neurons of larvae raised in food with no ATR (ATR -) or with ATR (ATR +) at 120 hr AEL [Genotype: 20XUAS-ChR2.T159C-HA/+;UAS-3xMyc-RFP-TDP-43/ppk1a-Gal4]. error bars,± SEM; n = 5 for ATR-, n = 7 for ATR+. (D) Analysis of FRAP data from C.
-
Figure 3—source data 1
Numerical data plotted in Figure 3C.
- https://cdn.elifesciences.org/articles/60132/elife-60132-fig3-data1-v3.xlsx
Figure 4 with 2 supplements
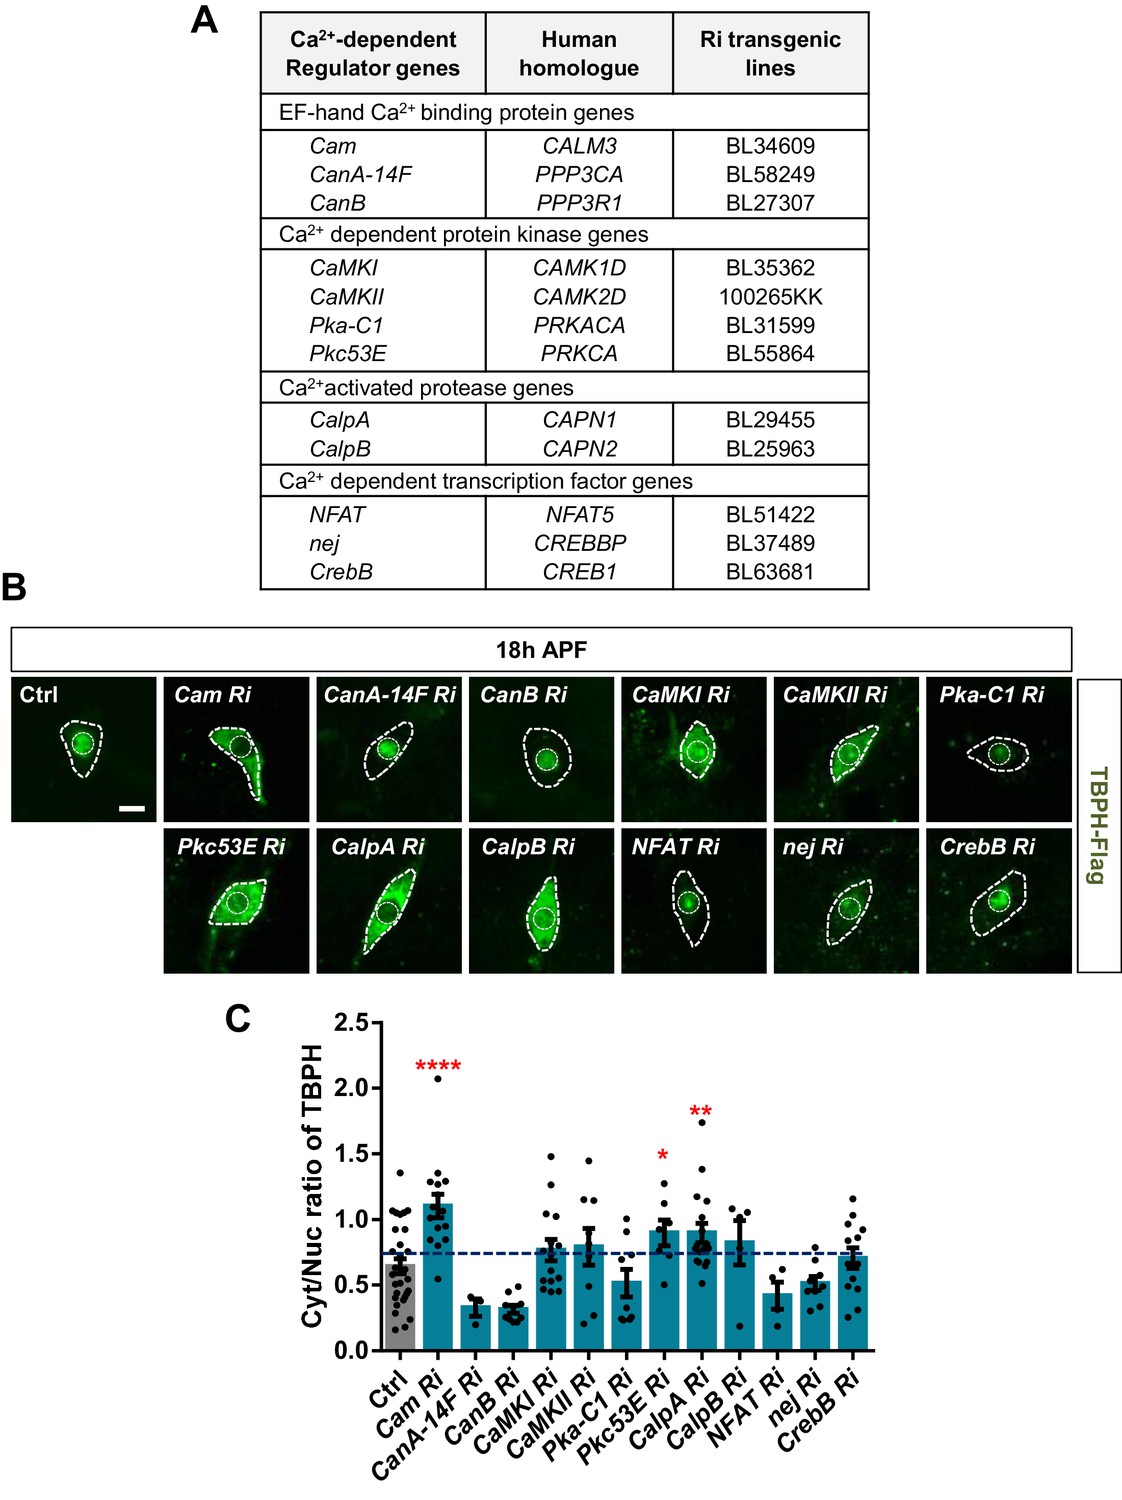
Identification of calcium-dependent regulators associated with nucleocytoplasmic translocation of TBPH by a genetic screen.
(A) List of calcium-dependent regulators screened in this study. (B) Subcellular localization of overexpressed TBPH-Flag proteins co-overexpressed with denoted RNAi (Ri) transgenes in C4da neurons at 18 hr APF [Genotype: Ctrl, +/+;ppk1a-Gal4,UAS-TBPH-Flag-HA/+, Cam Ri, +/+;ppk1a-Gal4,UAS-TBPH-Flag-HA/UAS-Cam RNAi, CanA-14F Ri, UAS-CanA-14F RNAi/+;ppk1a-Gal4,UAS-TBPH-Flag-HA/+, CanB Ri, +/+;ppk1a-Gal4,UAS-TBPH-Flag-HA/UAS-CanB RNAi, CaMKI Ri, +/+;ppk1a-Gal4,UAS-TBPH-Flag-HA/UAS-CaMKI RNAi/+, CaMKII Ri, UAS-CaMKII RNAi/+;ppk1a-Gal4,UAS-TBPH-Flag-HA/+, Pka-C1 Ri, +/+;ppk1a-Gal4,UAS-TBPH-Flag-HA/UAS-Pka-C1 RNAi, Pkc53E Ri, +/+;ppk1a-Gal4,UAS-TBPH-Flag-HA/UAS-Pkc53E RNAi, CalpA Ri, +/+;ppk1a-Gal4,UAS-TBPH-Flag-HA/UAS-CalpA RNAi, CalpB Ri, +/+;ppk1a-Gal4,UAS-TBPH-Flag-HA/UAS-CalpB RNAi, NFAT Ri, +/+;ppk1a-Gal4,UAS-TBPH-Flag-HA/UAS-NFAT RNAi, nej Ri, +/+;ppk1a-Gal4,UAS-TBPH-Flag-HA/UAS-nej RNAi, CrebB Ri, UAS-CrebB RNAi/+;ppk1a-Gal4,UAS-TBPH-Flag-HA/+]. Outer and inner dashed lines indicate borders of cell bodies and nuclei, respectively (scale bar, 5 μm). (C) Quantification of Cyt/Nuc ratio of TBPH-Flag proteins in C4da neurons expressing denoted transgenes described in B. ****p<1.0×10⁻⁴, **p=0.0053, *p=0.0276 by one-tailed t-test; error bars, ± SEM; n = 29 for Ctrl, n = 15 for Cam Ri, n = 3 for CanA-14F Ri, n = 10 for CanB Ri, n = 15 for CaMKI Ri, n = 9 for CaMKII Ri, n = 9 for Pka-C1 Ri, n = 7 for Pkc53E Ri, n = 17 for CalpA Ri, n = 5 for CalpB Ri, n = 4 for NFAT Ri, n = 9 for nej Ri, n = 13 for CrebB Ri.
-
Figure 4—source data 1
Numerical data plotted in Figure 4C and Figure 4—figure supplement 1C and 2B.
- https://cdn.elifesciences.org/articles/60132/elife-60132-fig4-data1-v3.xlsx
Figure 4—figure supplement 1
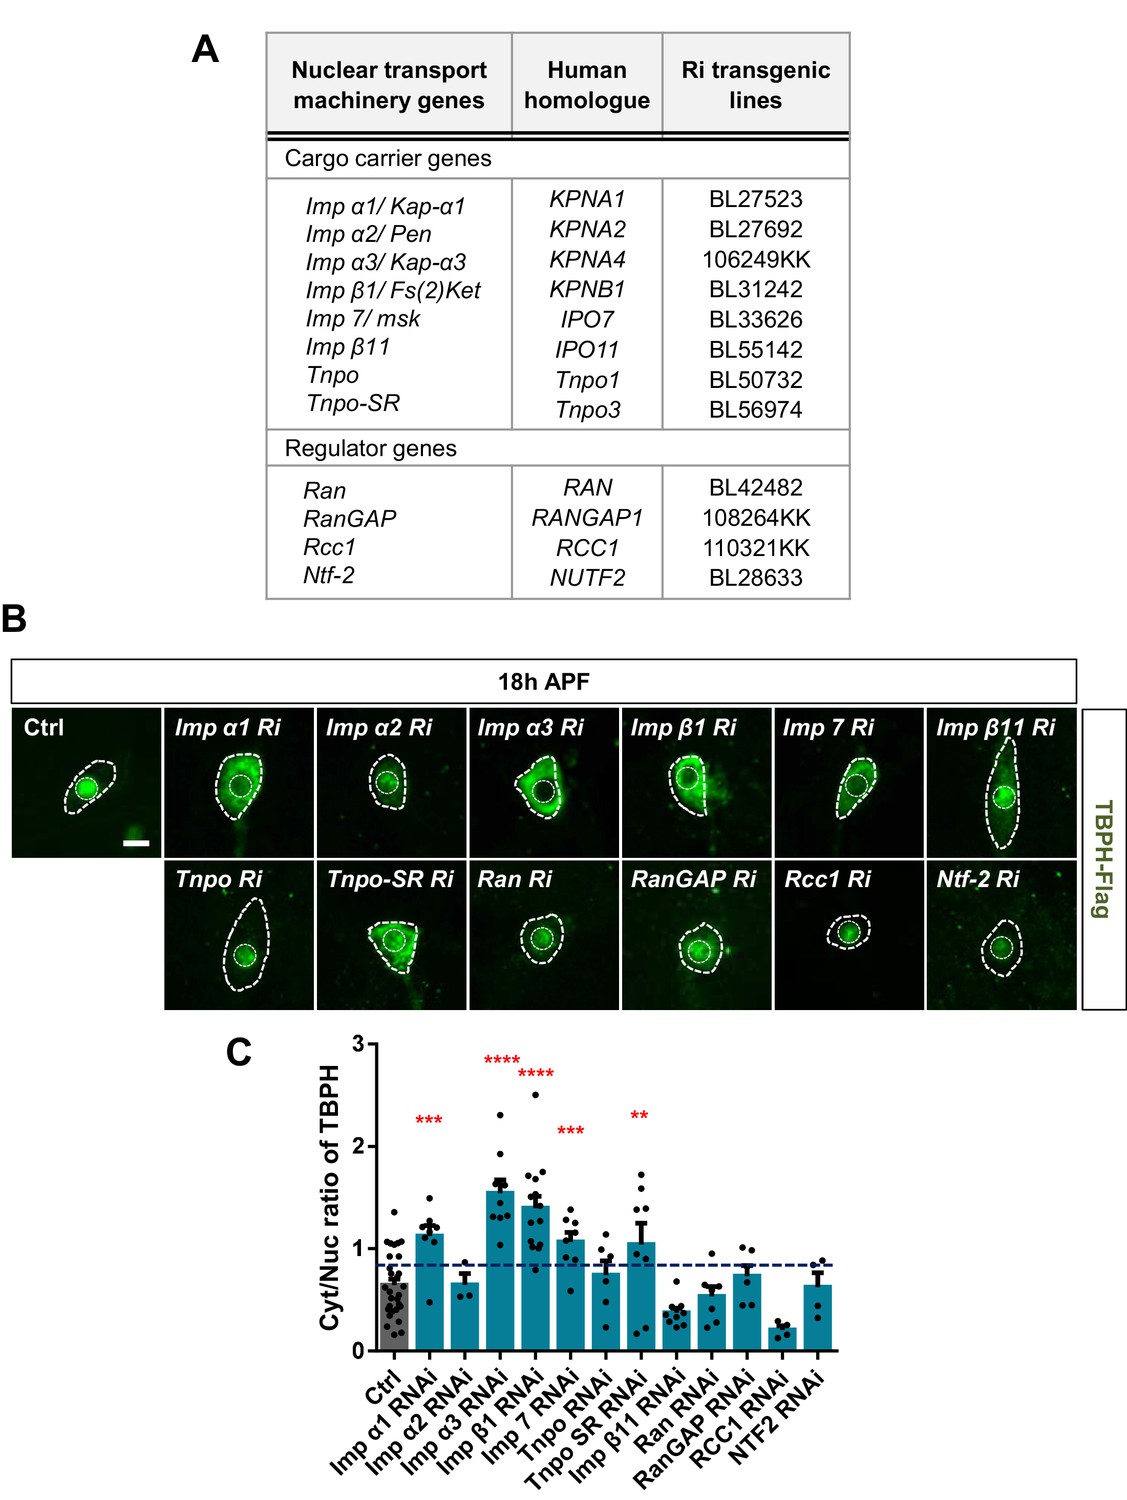
Identification of nuclear import components associated with nucleocytoplasmic translocation of TBPH by a genetic screen.
(A) List of nuclear import components screened in this study. (B) Subcellular localization of overexpressed TBPH-Flag proteins co-overexpressed with denoted RNAi (Ri) transgenes in C4da neurons at 18 hr APF [Genotype: Ctrl, +/+;ppk1a-Gal4,UAS-TBPH-Flag-HA/+, Imp α1 Ri, +/+;ppk1a-Gal4,UAS-TBPH-Flag-HA/UAS-Imp α1 RNAi, Imp α2 Ri, +/+;ppk1a-Gal4,UAS-TBPH-Flag-HA/UAS-Imp α2 RNAi, Imp α3 Ri, UAS-Imp α3 RNAi/+;ppk1a-Gal4,UAS-TBPH-Flag-HA/+, Imp β1 Ri, +/+;ppk1a-Gal4,UAS-TBPH-Flag-HA/UAS-Imp β1 RNAi, Imp 7 Ri, +/+;ppk1a-Gal4,UAS-TBPH-Flag-HA/UAS-Imp 7 RNAi, Imp β11 Ri, UAS-Imp β11 RNAi/+;ppk1a-Gal4,UAS-TBPH-Flag-HA/+, Tnpo Ri, +/+;ppk1a-Gal4,UAS-TBPH-Flag-HA/UAS-Tnpo RNAi, Tnpo-SR Ri, UAS-Tnpo-SR RNAi/+;ppk1a-Gal4,UAS-TBPH-Flag-HA/+, Ran Ri, UAS-Ran RNAi/+;ppk1a-Gal4,UAS-TBPH-Flag-HA/+, RanGAP Ri, +/+;ppk1a-Gal4,UAS-TBPH-Flag-HA/UAS-RanGAP RNAi, Rcc1 Ri, UAS-Rcc1 RNAi/+;ppk1a-Gal4,UAS-TBPH-Flag-HA/+, Ntf-2 Ri, +/+;ppk1a-Gal4,UAS-TBPH-Flag-HA/UAS-Ntf-2 RNAi]. Outer and inner dashed lines indicate the border of the cell body and nucleus, respectively (scale bar, 5 μm). (C) Quantification of Cyt/Nuc ratio of TBPH-Flag proteins in C4da neurons expressing denoted transgenes described in B. The blue line indicates 30% increase in the Cyt/Nuc ratio of TBPH compared with that in Ctrl. ****p<1.0×10⁻⁴, ***p<1.0 ×10⁻³, **p<0.01 by one-tailed t-test; error bars , ± SEM; n = 29 for Ctrl, n = 8 for Imp α1 Ri, n = 3 for Imp α2 Ri, n = 9 for Imp α3 Ri, n = 14 for Imp β1 Ri, n = 8 for Imp7 Ri, n = 9 for Impβ11 Ri, n = 6 for Tnpo Ri, n = 8 for Tnpo-SR Ri, n = 7 for Ran Ri, n = 6 for RanGAP Ri, n = 4 for Rcc1 Ri, n = 4 for Ntf-2 Ri.
Figure 4—figure supplement 2
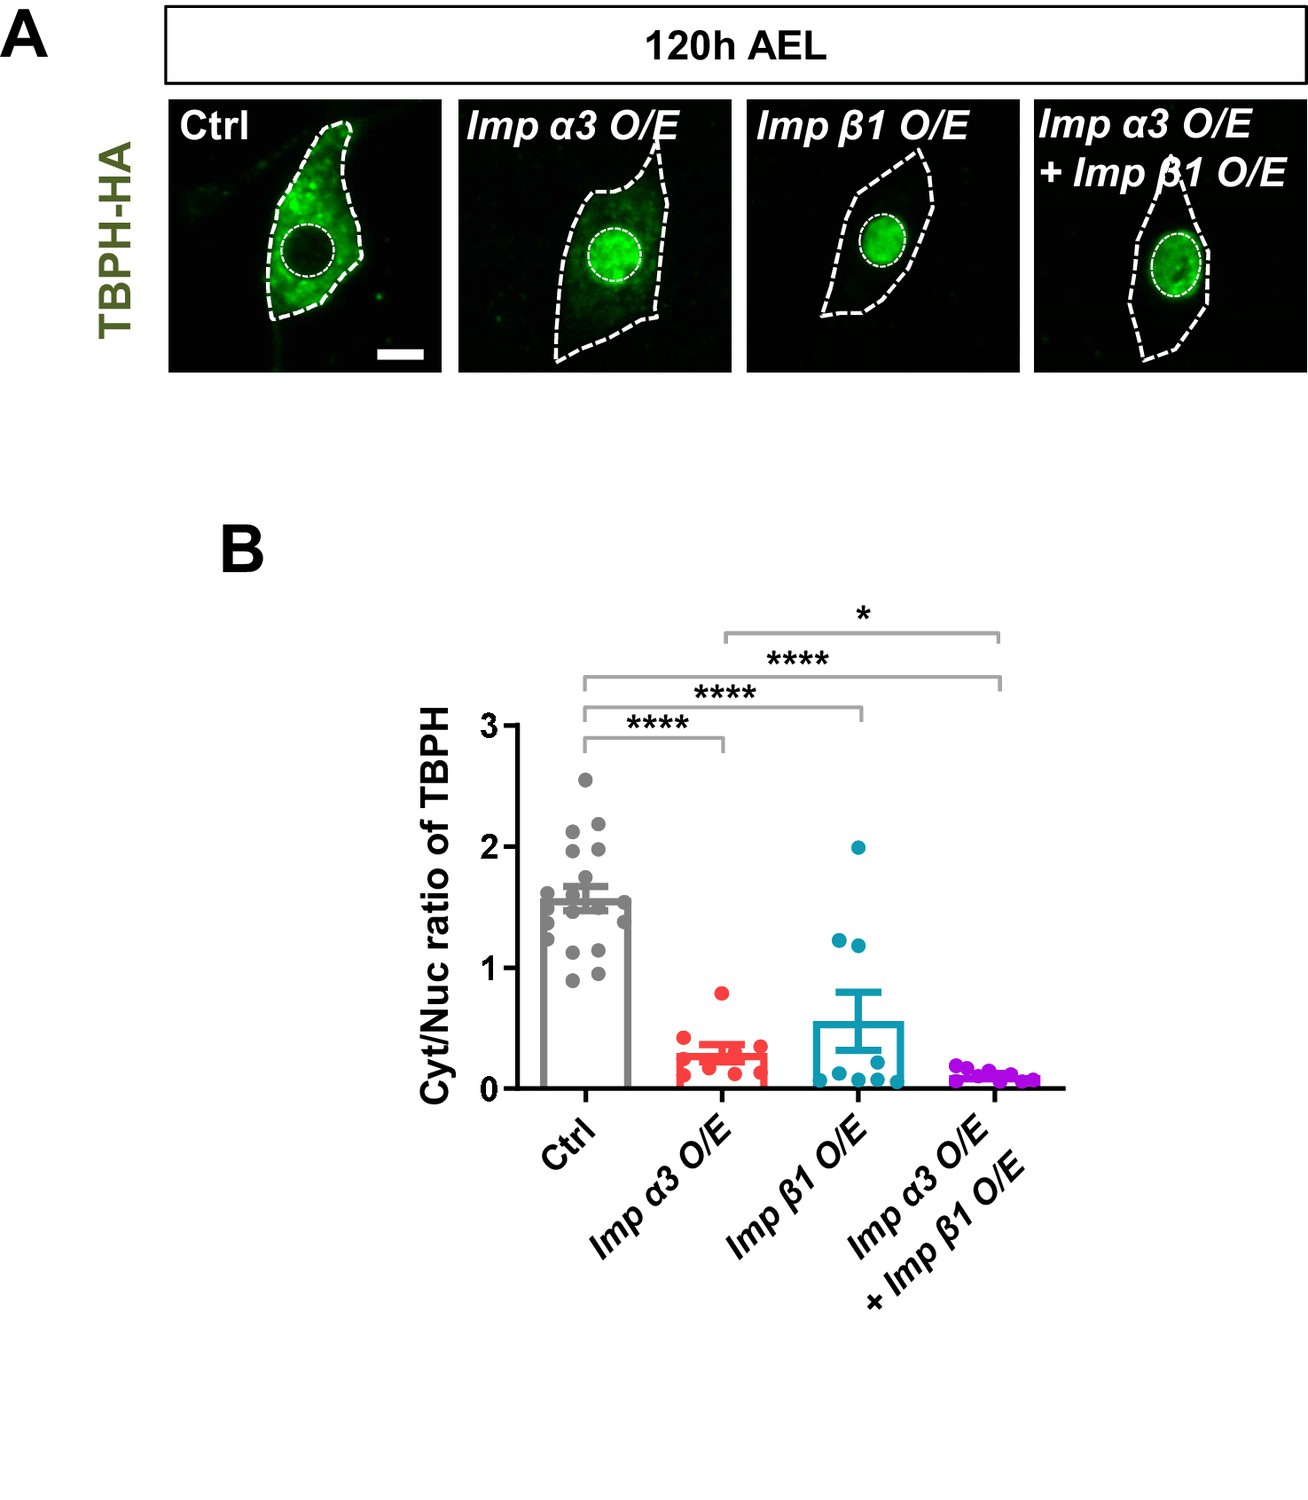
Regulation of TBPH nuclear import by Imp α3 and Imp β1.
(A) Subcellular localization of overexpressed TBPH-HA proteins in C4da neurons of Ctrl or overexpressing Imp α3 (Imp α3 O/E), Imp β1 (Imp β1 O/E), or both (Imp α3 O/E + Imp β1 O/E) at 120 hr AEL [Genotype: Ctrl, +/+;ppk1a-Gal4,UAS-TBPH-Flag-HA/+, Imp α3 O/E, UAS-2xFlag-Imp α3/+;ppk1a-Gal4,UAS-TBPH-Flag-HA/+, Imp β1 O/E, UAS-V5-Imp β1/+;ppk1a-Gal4,UAS-TBPH-Flag-HA/+, Imp α3 O/E + Imp β1 O/E, UAS-2xFlag-Imp α3/UAS-V5-Imp β1;ppk1a-Gal4,UAS-TBPH-Flag-HA/+]. Outer and inner dashed lines indicate borders of cell bodies and nuclei, respectively (scale bar, 5 μm). (B) Quantification of Cyt/Nuc ratio of TBPH-HA proteins in C4da neurons of Ctrl or overexpressing Imp α3, Imp β1, or both Imp α3 and Imp β1 at 120 hr AEL. ****p<1.0×10⁻⁴, *p<0.05 by two-tailed t-test; error bars, ± SEM; n = 19 for Ctrl, n = 9 for Imp α3 O/E, Imp β1 O/E, and Imp α3 O/E + Imp β1 O/E.
Figure 5 with 1 supplement
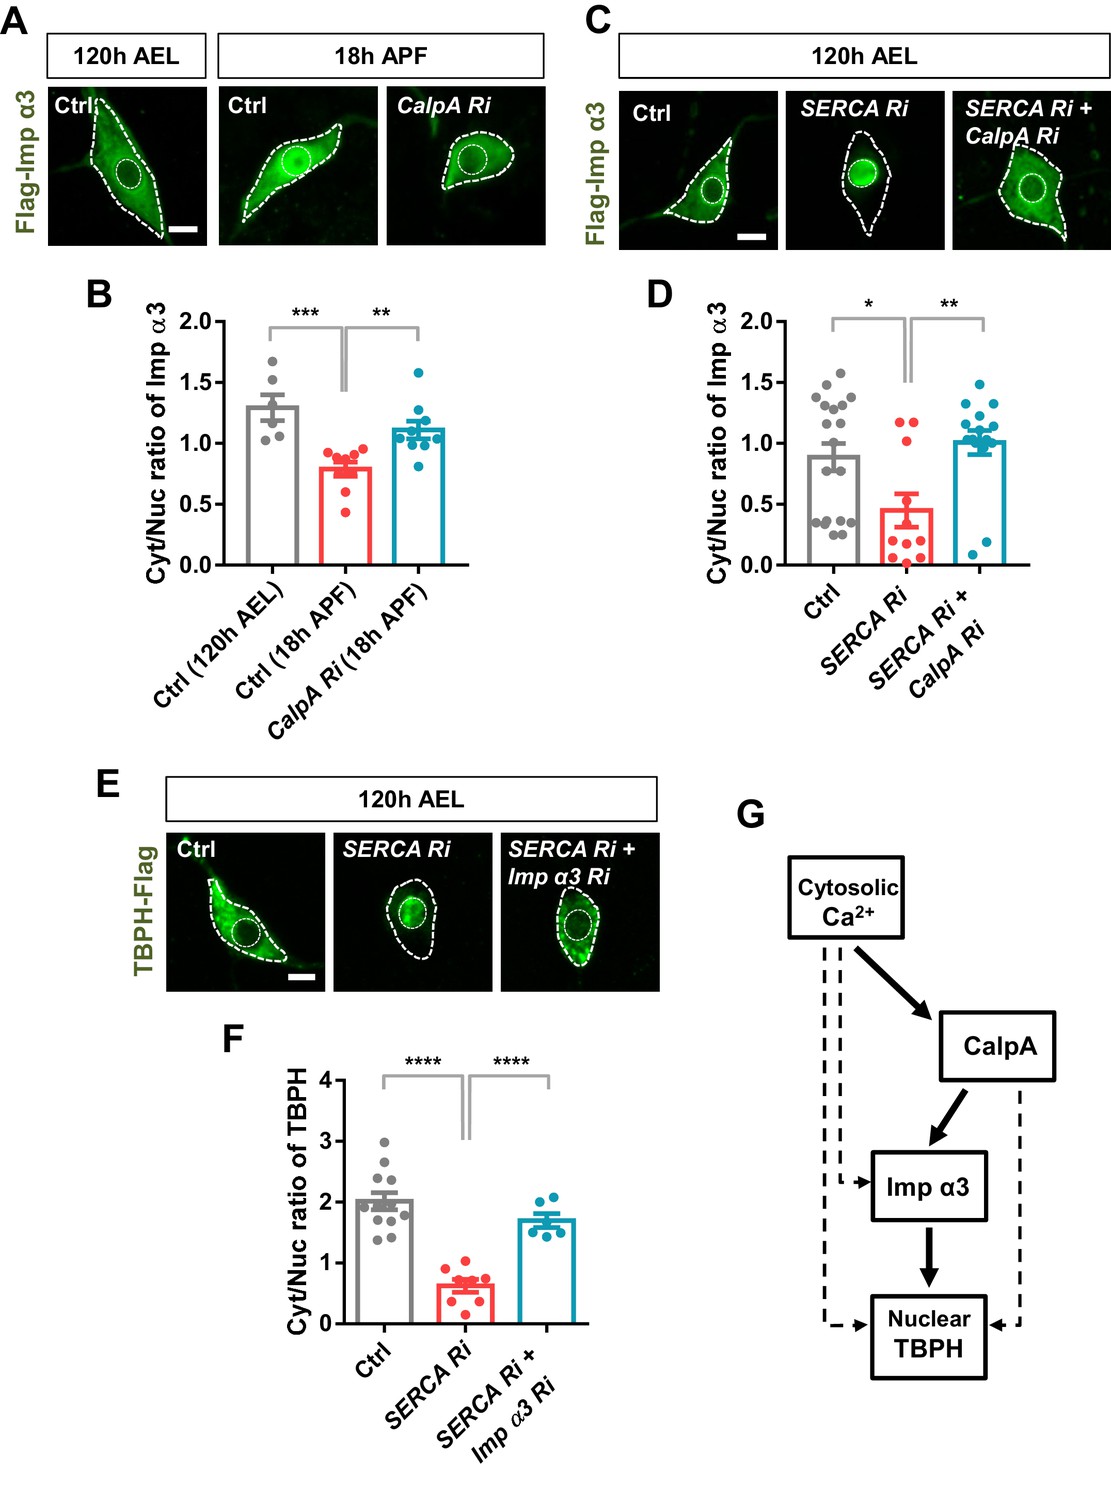
Regulation of nucleocytoplasmic translocation of TBPH by the calcium-CalpA-Imp α3 pathway.
(A) Subcellular localization of overexpressed Flag-Imp α3 proteins in C4da neurons of Ctrl (at 120 hr AEL and 18 hr APF) or with CalpA knockdown (CalpA Ri) at 18 hr APF [Genotype: Ctrl, UAS-2xFlag-Imp α3/+;ppk1a-Gal4/+, CalpA Ri, UAS-2xFlag-Imp α3;ppk1a-Gal4/UAS-CalpA RNAi]. Outer and inner dashed lines indicate borders of cell bodies and nuclei, respectively (scale bar, 5 μm). (B) Quantification of Cyt/Nuc ratio of Flag-Imp α3 proteins in C4da neurons of Ctrl (at 120 hr AEL and 18 hr APF) or with CalpA knockdown (CalpA Ri) at 18 hr APF. ***p=0.0005, **p=0.0031 by two-tailed t-test; error bars, ± SEM; n = 6 for Ctrl of 120 hr AEL, n = 9 for Ctrl and CalpA Ri of 18 hr APF. (C) Subcellular localization of overexpressed Flag-Imp α3 proteins in C4da neurons of Ctrl or expressing SERCA Ri or both SERCA Ri and CalpA Ri at 120 hr AEL [Genotype: Ctrl, UAS-2xFlag-Imp α3/+;ppk1a-Gal4/+, SERCA Ri, UAS-2xFlag-Imp α3/UAS-SERCA RNAi;ppk1a-Gal4/+, SERCA Ri + CalpA Ri, UAS-2xFlag-Imp α3/UAS-SERCA RNAi;ppk1a-Gal4/UAS-CalpA RNAi]. Outer and inner dashed lines indicate borders of cell bodies and nuclei, respectively (scale bar, 5 μm). (D) Quantification of Cyt/Nuc ratio of Flag-Imp α3 proteins in C4da neurons of Ctrl or expressing SERCA Ri or both SERCA Ri and CalpA Ri at 120 hr AEL. **p=0.0024, *p=0.0219 by two-tailed t-test; error bars, ± SEM; n = 19 for Ctrl, n = 11 for SERCA Ri, n = 15 for SERCA Ri + CalpA Ri. (E) Subcellular localization of overexpressed TBPH-Flag proteins in C4da neurons of Ctrl or expressing SERCA Ri or both SERCA Ri and Imp α3 Ri at 120 hr AEL [Genotype: Ctrl, +/+;ppk1a-Gal4,UAS-TBPH-Flag-HA/+, SERCA Ri, UAS-SERCA RNAi/+;ppk1a-Gal4,UAS-TBPH-Flag-HA/+, SERCA Ri + Imp α3 Ri, UAS-SERCA RNAi/UAS-Imp α3 RNAi;ppk1a-Gal4,UAS-TBPH-Flag-HA/+]. Outer and inner dashed lines indicate borders of cell bodies and nuclei, respectively (scale bar, 5 μm). (F) Quantification of Cyt/Nuc ratio of TBPH-Flag proteins in C4da neurons of Ctrl or expressing SERCA Ri or both SERCA Ri and Imp α3 Ri at 120 hr AEL. ****p<1.0×10⁻⁴ by two-tailed t-test; error bars, ± SEM; n = 12 for Ctrl, n = 8 for SERCA Ri, n = 6 for SERCA Ri + Imp α3 Ri. (G) A schematic model for the regulatory mechanism of nucleocytoplasmic TBPH involving the cytosolic calcium-CalpA-Imp α3 pathway. Arrows indicate experimentally validated functional links, and dashed lines indicate possible alternative paths in addition to the validated cytosolic calcium-CalpA-Imp α3 pathway.
-
Figure 5—source data 1
Numerical data plotted in Figure 5B, D, F and Figure 5—figure supplement 1B.
- https://cdn.elifesciences.org/articles/60132/elife-60132-fig5-data1-v3.xlsx
Figure 5—figure supplement 1
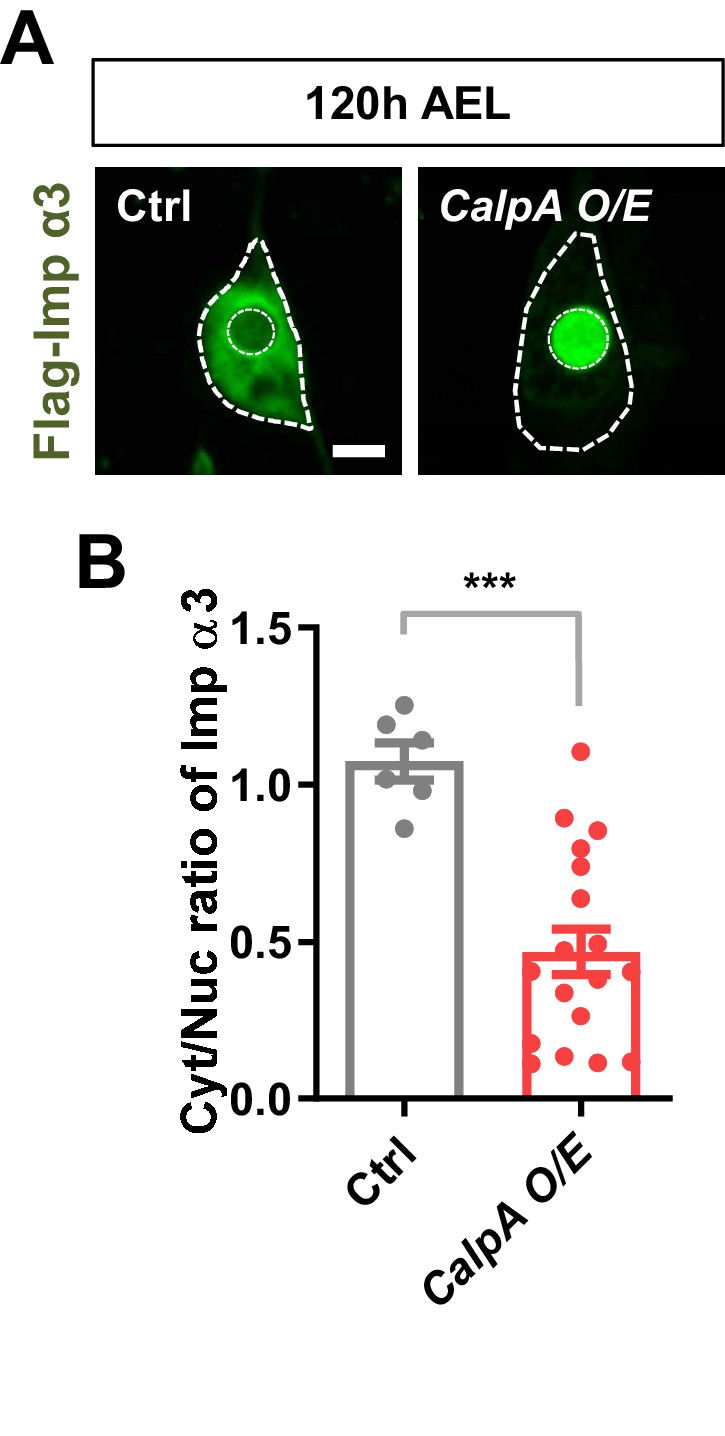
Nuclear translocation of Imp α3 in C4da neurons overexpressing CalpA.
(A) Subcellular localization of overexpressed Flag-Imp α3 proteins in C4da neurons of Ctrl or overexpressing CalpA (CalpA O/E) at 120 hr AEL [Genotype: Ctrl, UAS-2xFlag-Imp α3/+;ppk1a-Gal4/+, CalpA OE, UAS-2xFlag-Imp α3/UAS-CalpA-2xMyc;ppk1a-Gal4/+]. Outer and inner dashed lines indicate borders of cell bodies and nuclei, respectively (scale bar, 5 μm). (B) Quantification of Cyt/Nuc ratio of Flag-Imp α3 proteins in C4da neurons of Ctrl or overexpressing CalpA at 120 hr AEL. ***p=0.0001 by two-tailed t-test; error bars, ± SEM; n = 6 for Ctrl, n = 18 for CalpA O/E.
Figure 6 with 3 supplements
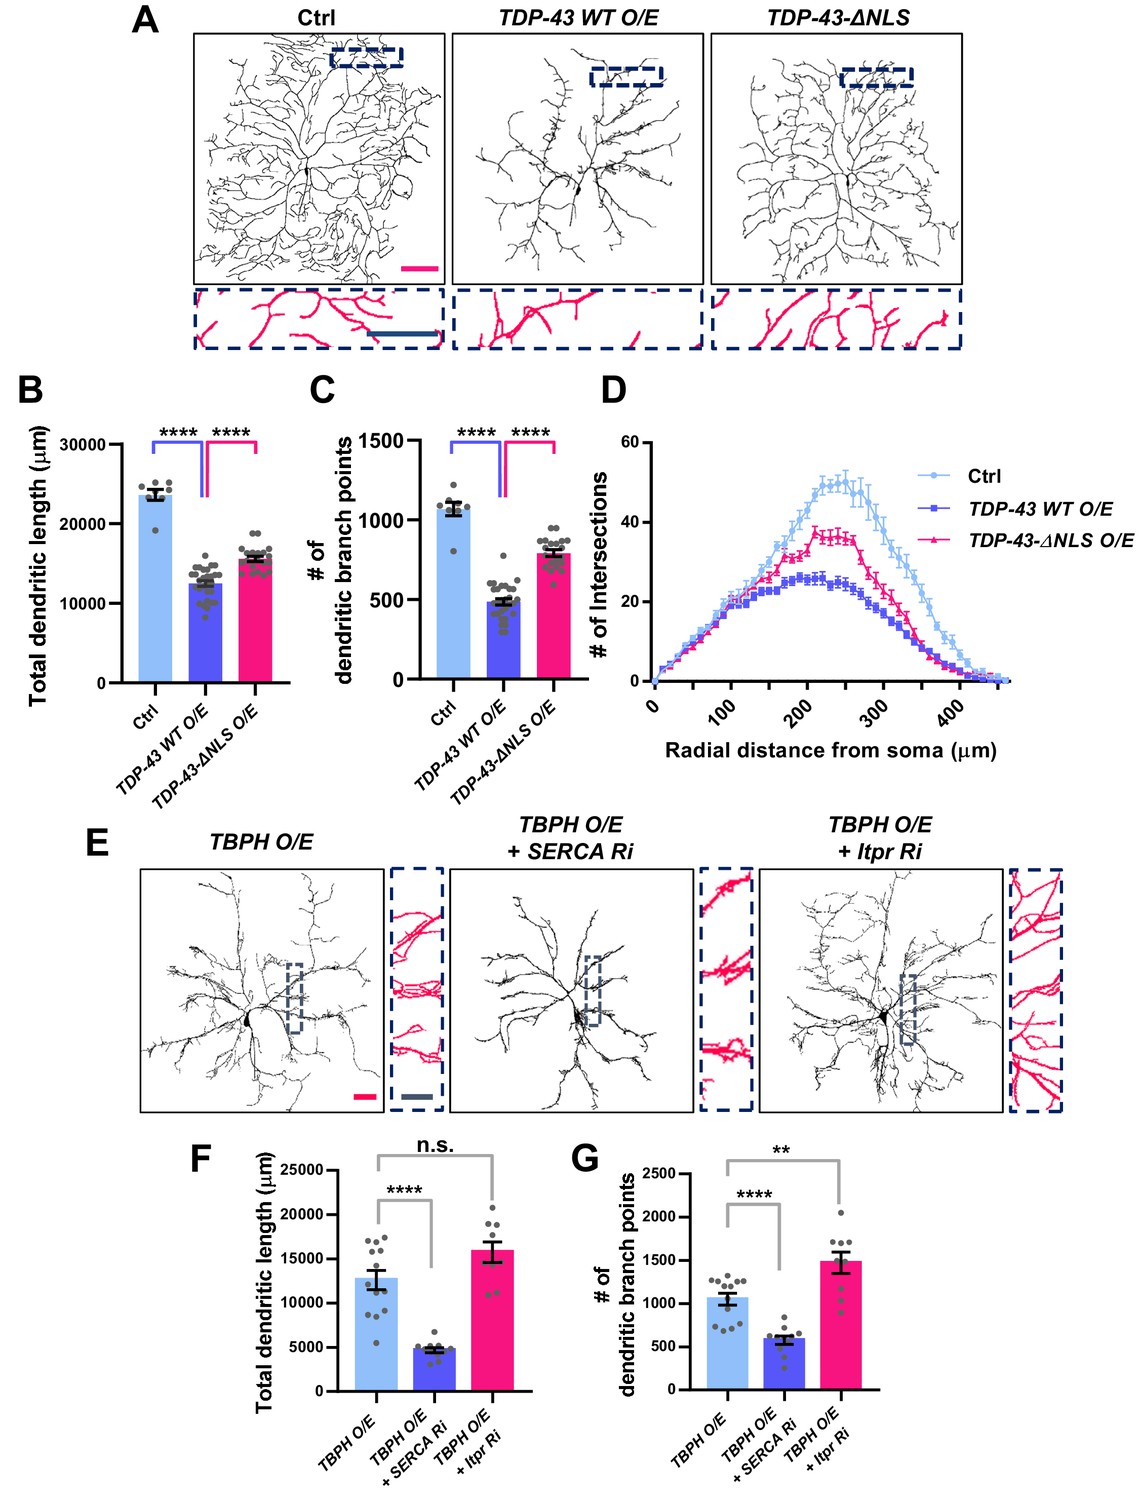
Significant alteration in the dendrite arborization of larval C4da neurons resulted from an untimely nuclear mis-localization of TBPH/TDP-43.
(A) Skeletonized dendrite images of C4da neurons of larvae with denoted genotypes [Genotype: Ctrl, +/+;ppk1a-Gal4,UAS-CD4-tdGFP/+, TDP-43 WT O/E, UAS-TDP-43/+;ppk1a-Gal4, UAS-CD4-tdGFP/+, TDP-43-ΔNLS O/E, UAS-TDP-43-ΔNLS/+;ppk1a-Gal4, UAS-CD4-tdGFP/+]. Magnified images are presented at the bottom (Red scale bar, 100 μm; Blue scale bar, 50 μm). (B) Quantification of total dendritic length in neurons expressing the denoted transgenes. ****p<1.0×10⁻⁴ by two-tailed t-test; error bars, ± SEM; n = 8 for Ctrl, n = 20 for TDP-43 WT O/E, n = 12 for TDP-43-ΔNLS O/E. (C) Quantification of the number of dendritic branch points in neurons expressing the denoted transgenes. ****p<1.0×10⁻⁴ by two-tailed t-test; error bars, ± SEM; n = 8 for Ctrl, n = 20 for TDP-43 WT O/E, n = 12 for TDP-43-ΔNLS O/E. (D) Sholl analysis of neurons expressing the denoted transgenes. (E) Skeletonized dendrite images of C4da neurons of larvae with denoted genotypes [Genotype: TBPH O/E, UAS-TBPH/+;ppk1a-Gal4,UAS-CD4-tdGFP/+, TBPH O/E + SERCA Ri, UAS-TBPH/UAS-SERCA RNAi;ppk1a-Gal4,UAS-CD4-tdGFP/+, TBPH O/E + Itpr Ri, UAS-TBPH/UAS-Itpr RNAi;ppk1a-Gal4,UAS-CD4-tdGFP/+]. Magnified images are presented at the right side (Red scale bar, 40 μm; Blue scale bar, 20 μm). (F) and (G) Quantifications of total dendritic length (F) and number of dendritic branch points (G) in neurons expressing the denoted transgenes. ****p<1.0×10⁻⁴, **p=0.0045, n.s., not significant, p=0.0655 by two-tailed t-test; error bars, ± SEM; n = 13 for TBPH O/E, n = 11 for TBPH O/E + SERCA Ri, n = 9 for TBPH O/E + Itpr Ri.
-
Figure 6—source data 1
Numerical data plotted in Figure 6B, C, F, G and Figure 6—figure supplement 1B, C, E, F and 2D, E.
- https://cdn.elifesciences.org/articles/60132/elife-60132-fig6-data1-v3.xlsx
Figure 6—figure supplement 1
Dendritic defects induced by TBPH overexpression can be mitigated by reducing TBPH nuclear localization in C4da neurons.
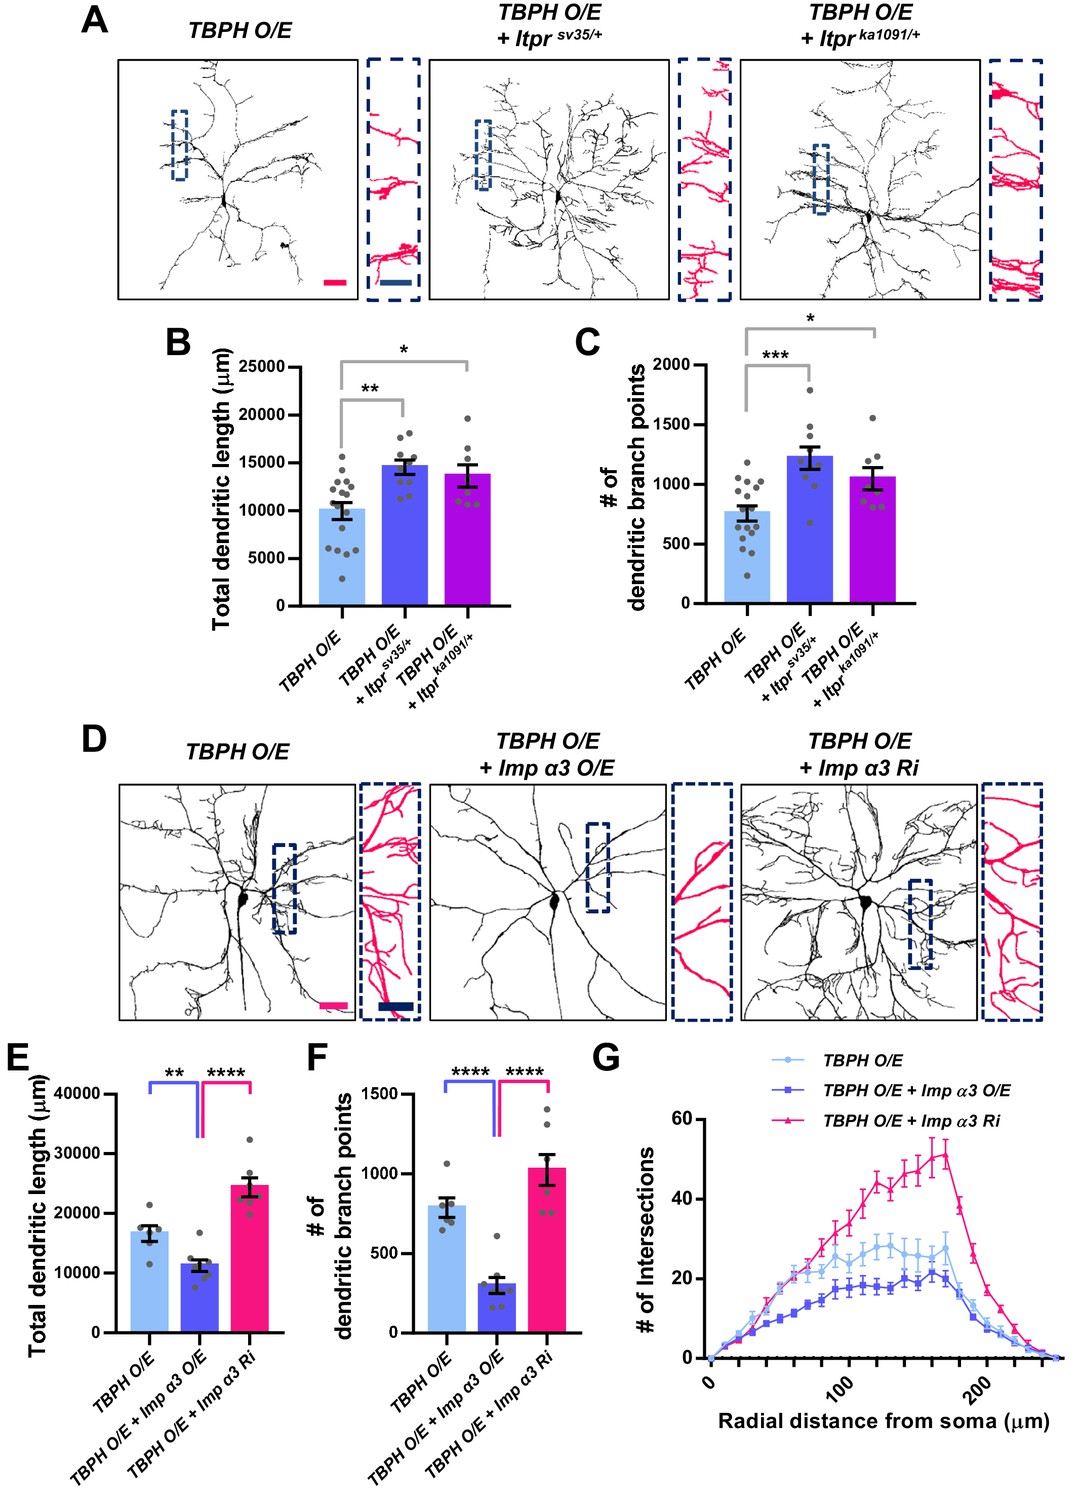
(A) Skeletonized dendrite images of C4da neurons of larvae with denoted genotypes [Genotype: TBPH O/E, UAS-TBPH/+;ppk1a-Gal4,UAS-CD4-tdGFP/+, TBPH O/E + Itprsv35/+, UAS-TBPH/+;ppk1a-Gal4,UAS-CD4-tdGFP/Itprsv35, TBPH O/E + Itprka1091/+, UAS-TBPH/+;ppk1a-Gal4,UAS-CD4-tdGFP/Itprka1091]. Magnified images are presented at the right side (Red scale bar, 40 μm; Blue scale bar, 20 μm). (B) and (C) Quantifications of total dendritic length (B) and number of dendritic branch points (C) in neurons expressing the denoted transgenes. ***p=0.0003, **p=0.0016, *p<0.05 by two-tailed t-test; error bars, ± SEM; n = 17 for TBPH O/E, n = 10 for TBPH O/E + Itprsv35/+, n = 8 for TBPH O/E + Itprka1091/+. (D) Skeletonized dendrite images of C4da neurons of larvae with denoted genotypes [Genotype: TBPH O/E, UAS-TBPH/+;ppk1a-Gal4,UAS-CD4-tdGFP/+, TBPH O/E + Imp α3 O/E, UAS-TBPH/UAS-Imp α3;ppk1a-Gal4,UAS-CD4-tdGFP/+, TBPH O/E + Imp α3 Ri, UAS-TBPH/UAS-Imp α3 RNAi;ppk1a-Gal4,UAS-CD4-tdGFP/+]. Magnified images are presented at the right side (Red scale bar, 40 μm; Blue scale bar, 20 μm). (E) and (F) Quantifications of total dendritic length (E) and number of dendritic branch points (F) in neurons expressing the denoted transgenes. ****p<1.0×10⁻⁴, **p=0.0056 by two-tailed t-test; error bars, ± SEM; n = 6 for TBPH O/E, n = 8 for TBPH O/E + Imp α3 O/E, n = 7 for TBPH O/E + Imp α3 Ri. (G) Sholl analysis of neurons expressing the denoted transgenes.
Figure 6—figure supplement 2
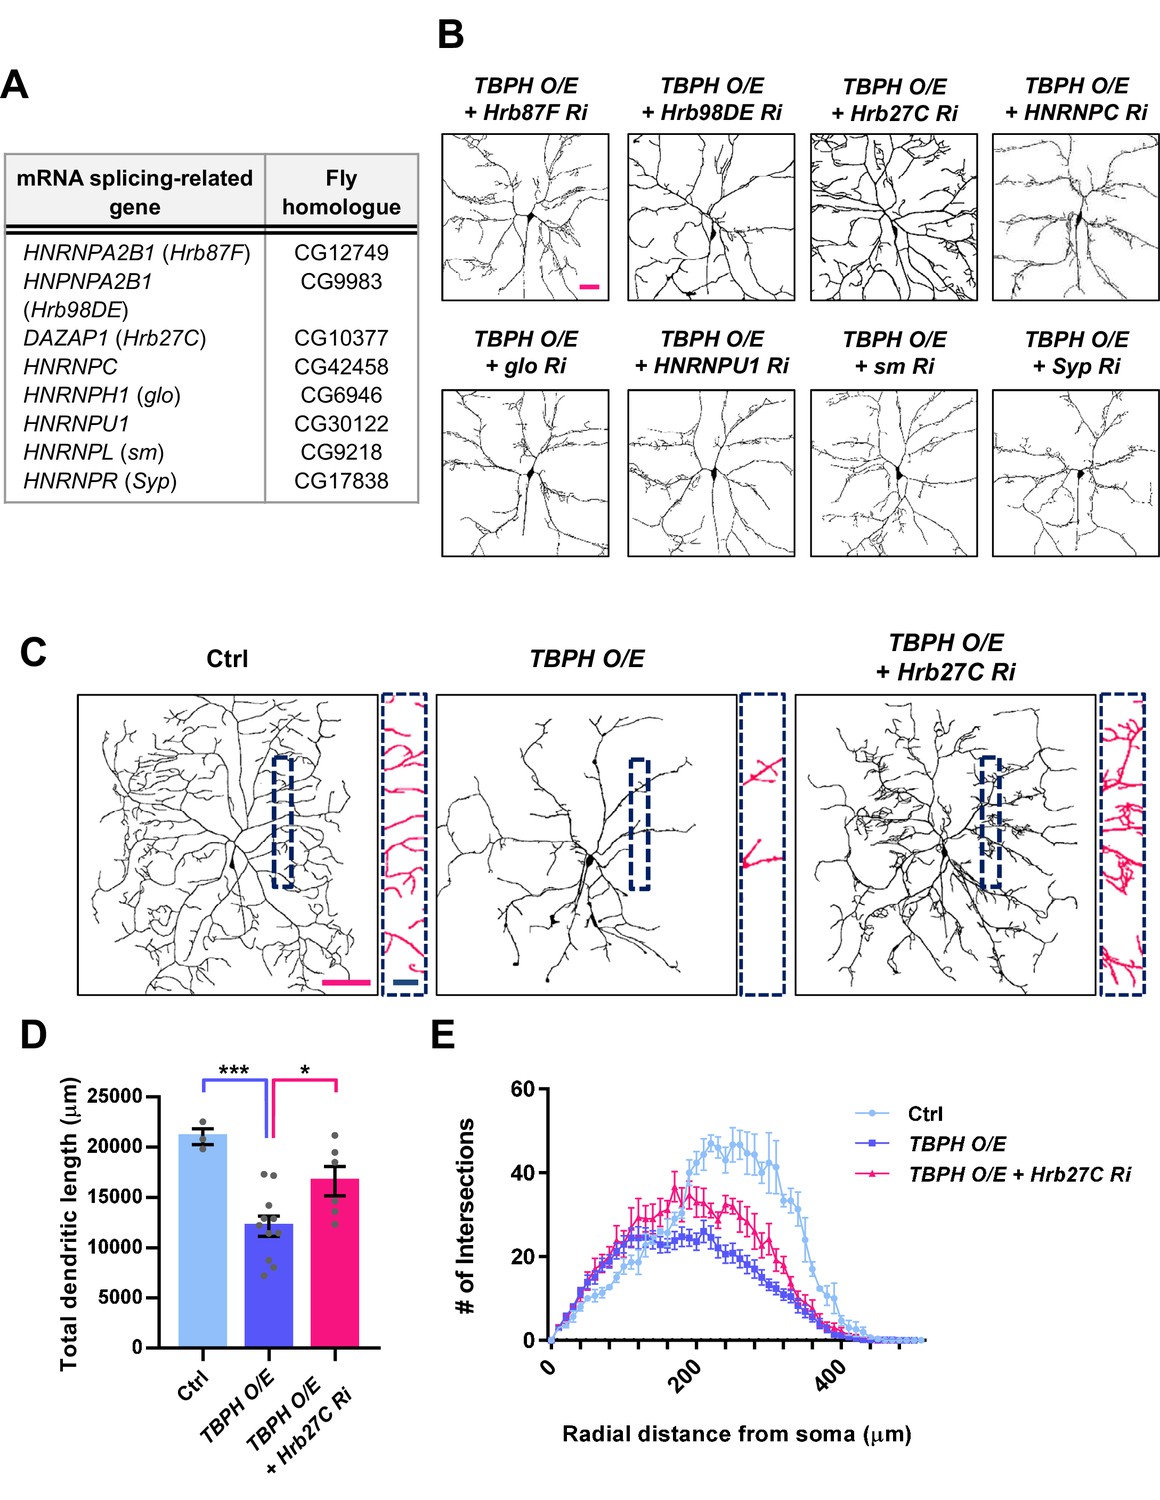
Restoration of dendrite arborization pattern in larval C4da neurons overexpressing TBPH by knockdown of a splicing factor Hrb27C.
(A) A list of splicing factors screened in this study. (B) Skeletonized dendrite images of C4da neurons of larvae with denoted genotypes [Genotype: TBPH O/E + Hrb87F Ri, UAS-Hrb87F RNAi/UAS-TBPH;ppk1a-Gal4,UAS-CD4-tdGFP/+, TBPH O/E + Hrb98DE Ri, UAS-TBPH/+;UAS-Hrb98DE RNAi, ppk1a-Gal4,UAS-CD4-tdGFP/+, TBPH O/E + Hrb27C Ri, UAS-Hrb27C RNAi/UAS-TBPH;ppk1a-Gal4,UAS-CD4-tdGFP/+, TBPH O/E + HNPNPC Ri, UAS-HNRNPC RNAi/UAS-TBPH;ppk1a-Gal4,UAS-CD4-tdGFP/+, TBPH O/E + glo Ri, UAS-TBPH/+;UAS-glo RNAi/ppk1a-Gal4,UAS-CD4-tdGFP, TBPH O/E + HNRNPU1 Ri, UAS-HNRNPU1 RNAi/UAS-TBPH;ppk1a-Gal4,UAS-CD4-tdGFP/+, TBPH O/E + sm Ri, UAS-sm RNAi/UAS-TBPH;ppk1a-Gal4,UAS-CD4-tdGFP/+, TBPH O/E + Syp Ri, UAS-Syp RNAi/UAS-TBPH;ppk1a-Gal4,UAS-CD4-tdGFP/+] (scale bar 40 μm). (C) Skeletonized dendrite images of C4da neurons of larvae with denoted genotypes. Magnified images are presented at the bottom [Genotype: Ctrl, +/+;ppk1a-Gal4,UAS-CD4-tdGFP/UAS-Luciferase, TBPH O/E, UAS-TBPH/+;ppk1a-Gal4,UAS-CD4-tdGFP/UAS-Luciferase, TBPH O/E + Hrb27C Ri, UAS-Hrb27C RNAi/UAS-TBPH;ppk1a-Gal4,UAS-CD4-tdGFP/+] (Red scale bar, 100 μm; Blue scale bar, 25 μm). (D) Quantification of total dendritic length in neurons expressing the denoted transgenes. ***p=0.0008, *p=0.0209 by two-tailed t-test; error bars, ± SEM; n = 3 for Ctrl, n = 11 for TBPH O/E, n = 6 for TBPH O/E + Hrb27C Ri. (E) Sholl analysis of neurons expressing the denoted transgenes.
Figure 6—figure supplement 3
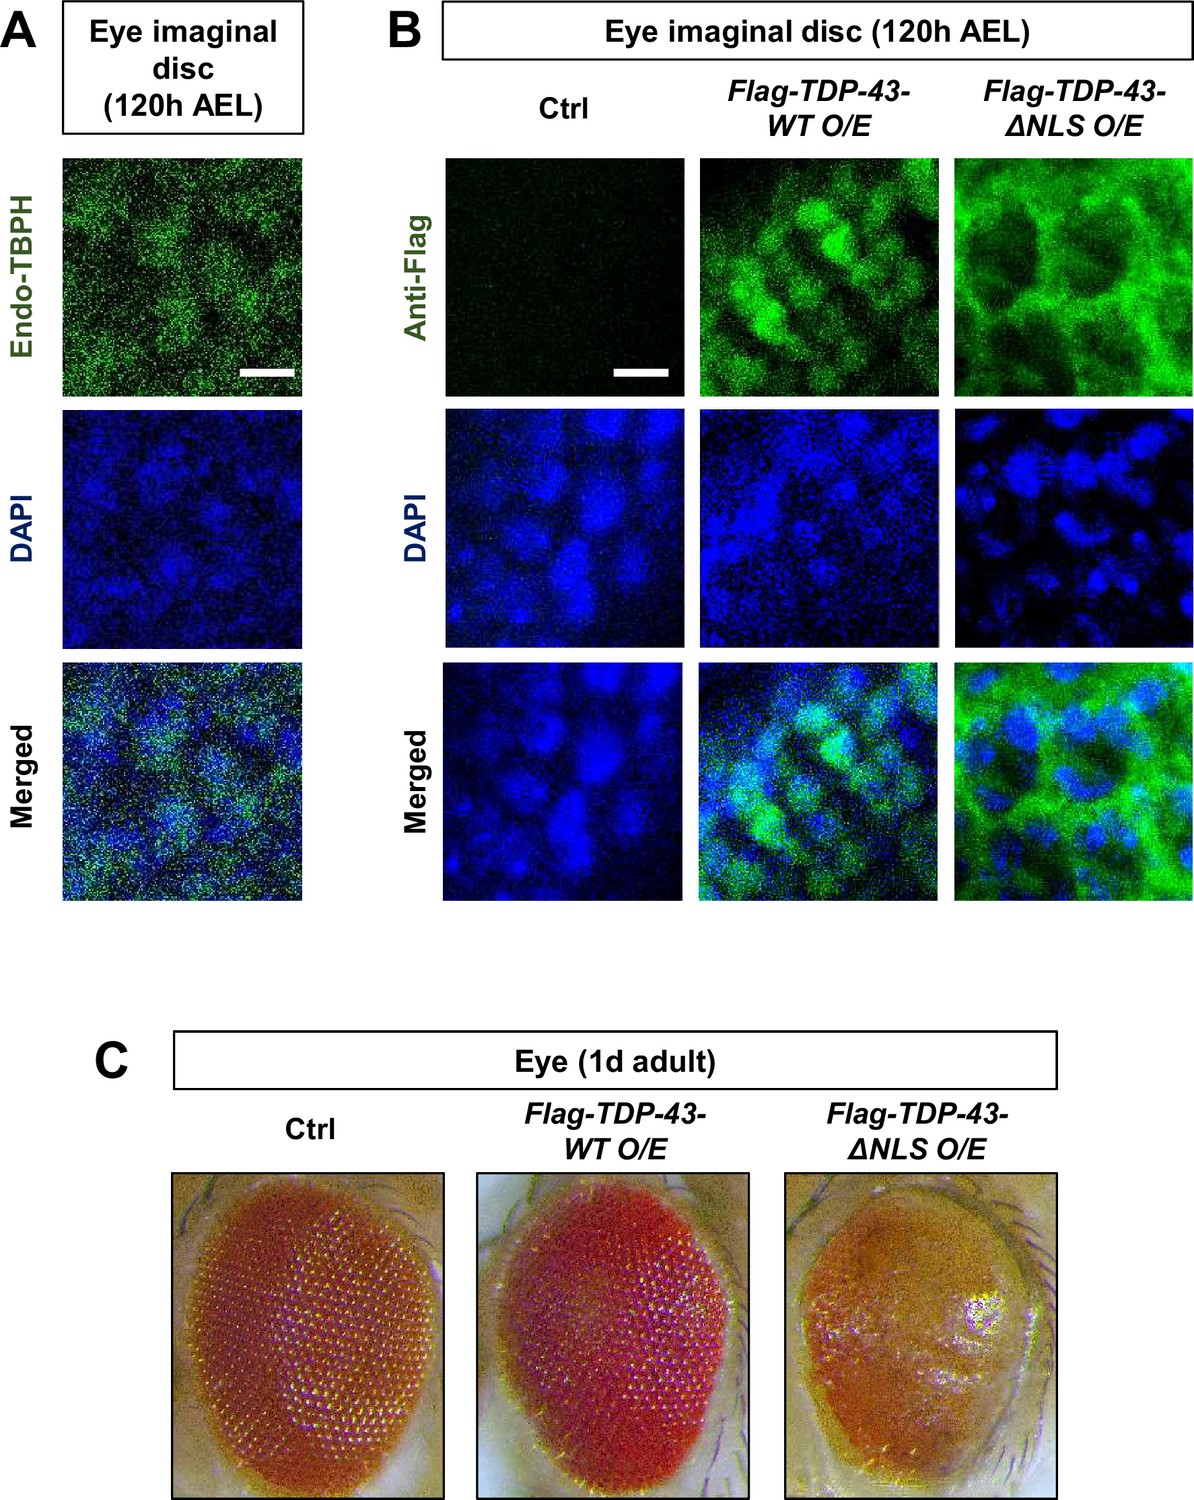
Cytoplasmic mis-localization of TDP-43 is associated with retinal degeneration.
(A) Subcellular localization of endogenous TBPH proteins in eye imaginal disc at 120 hr AEL. Scale bar, 5 μm. (B) Subcellular localization of Flag-TDP-43 and Flag-TDP-43 ΔNLS proteins in eye imaginal disc at 120 hr AEL [Genotype: Ctrl, Gmr-gal4/UAS-empty, Flag-TDP-43-WT O/E, Gmr-gal4/UAS-Flag-TDP-43-WT O/E, Flag-TDP-43-ΔNLS O/E, Gmr-gal4/UAS-Flag-TDP-43-ΔNLS O/E]. (C) Retinal images of flies 1 day post-eclosion. Genotypes are the same as in (B).
Figure 7 with 4 supplements
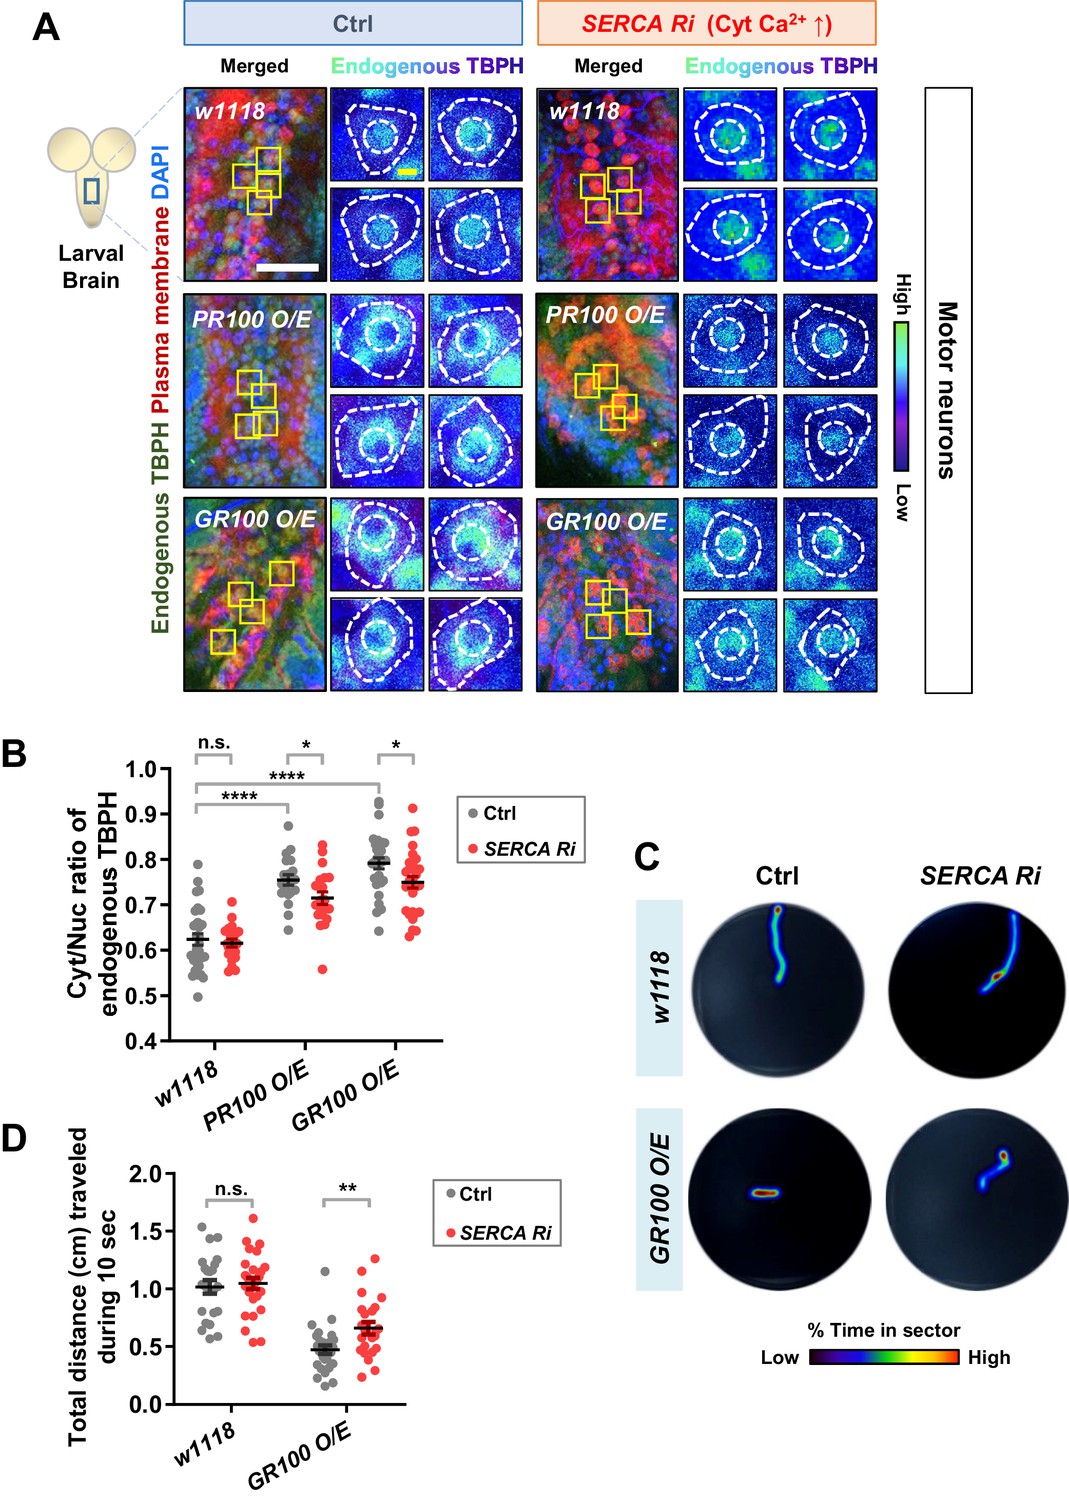
Restoration of aberrant TBPH localization and defective larval locomotion in C9orf72 ALS models by increased cytosolic calcium.
(A) Subcellular localization of endogenous TBPH proteins in larval motor neurons of w1118 or overexpressing PR100 or GR100, accompanied by concomitant expression of 40DUAS control vector (Ctrl) or SERCA Ri (SERCA Ri) at 120 hr AEL [Genotype: w1118 in Ctrl, 40DUAS/+;D42-Gal4,UAS-mCD8-RFP/+, PR100 O/E in Ctrl, 40DUAS/UAS-poly-PR.PO-100;D42-Gal4,UAS-mCD8-RFP/+, GR100 O/E in Ctrl, 40DUAS/UAS-poly-GR.PO-100;D42-Gal4,UAS-mCD8-RFP/+, w1118 in SERCA Ri, UAS-SERCA RNAi/+;D42-Gal4,UAS-mCD8-RFP/+, PR100 O/E in SERCA Ri, UAS-SERCA RNAi/UAS-poly-PR.PO-100;D42-Gal4,UAS-mCD8-RFP/+, GR100 O/E in SERCA Ri, UAS-SERCA RNAi/UAS-poly-GR.PO-100;D42-Gal4,UAS-mCD8-RFP/+]. Merged immunohistochemical images of endogenous TBPH proteins (green), plasma membranes (red), and DAPI (blue) are presented on the left side. Four neurons from the A3-A5 region of the VNC are selected as representative images (marked by yellow squares) and their enlarged images are shown on the right. Outer and inner dashed lines indicate borders of cell bodies and nuclei, respectively (yellow scale bar, 5 μm). (B) Quantification of Cyt/Nuc ratio of endogenous TBPH proteins in larval motor neurons expressing denoted transgenes described in A. N.S., not significant, p>0.05, ****p<1.0×10⁻⁴, *p<0.05 by two-tailed t-test; error bars, ± SEM; n = 30 for w1118 in Ctrl, n = 20 for PR100 O/E in Ctrl, n = 30 for GR100 O/E in Ctrl; n = 20 for w1118 in SERCA Ri, n = 20 for PR100 O/E in SERCA Ri, n = 30 for GR100 O/E in SERCA Ri. (C) Heat maps showing residence probability during traveling of larvae [Genotype: w1118 in Ctrl, 40DUAS/+;D42-Gal4,UAS-mCD8-RFP/+, w1118 in SERCA Ri, UAS-SERCA RNAi/+;D42-Gal4,UAS-mCD8-RFP/+, GR100 O/E in Ctrl, 40DUAS/UAS-poly-GR.PO-100;D42-Gal4,UAS-mCD8-RFP/+, GR100 O/E in SERCA Ri, UAS-SERCA RNAi/UAS-poly-GR.PO-100;D42-Gal4,UAS-mCD8-RFP/+] monitored in the 90 mm Petri dish until the larvae reached the edge of Petri dish or for up to 60 s. (D) Quantification of total distances traveled during 10 s for larvae expressing denoted genotypes in motor neurons described in C. n.s., not significant, p>0.05, **p=0.0048 by two-tailed t-test; error bars, ± SEM; n = 23 for w1118 in Ctrl, n = 28 for GR100 O/E in Ctrl; n = 28 for w1118 in SERCA Ri, n = 23 for GR100 O/E in SERCA Ri.
-
Figure 7—source data 1
Numerical data plotted in Figure 7B, D and Figure 7—figure supplement 4B.
- https://cdn.elifesciences.org/articles/60132/elife-60132-fig7-data1-v3.xlsx
Figure 7—figure supplement 1
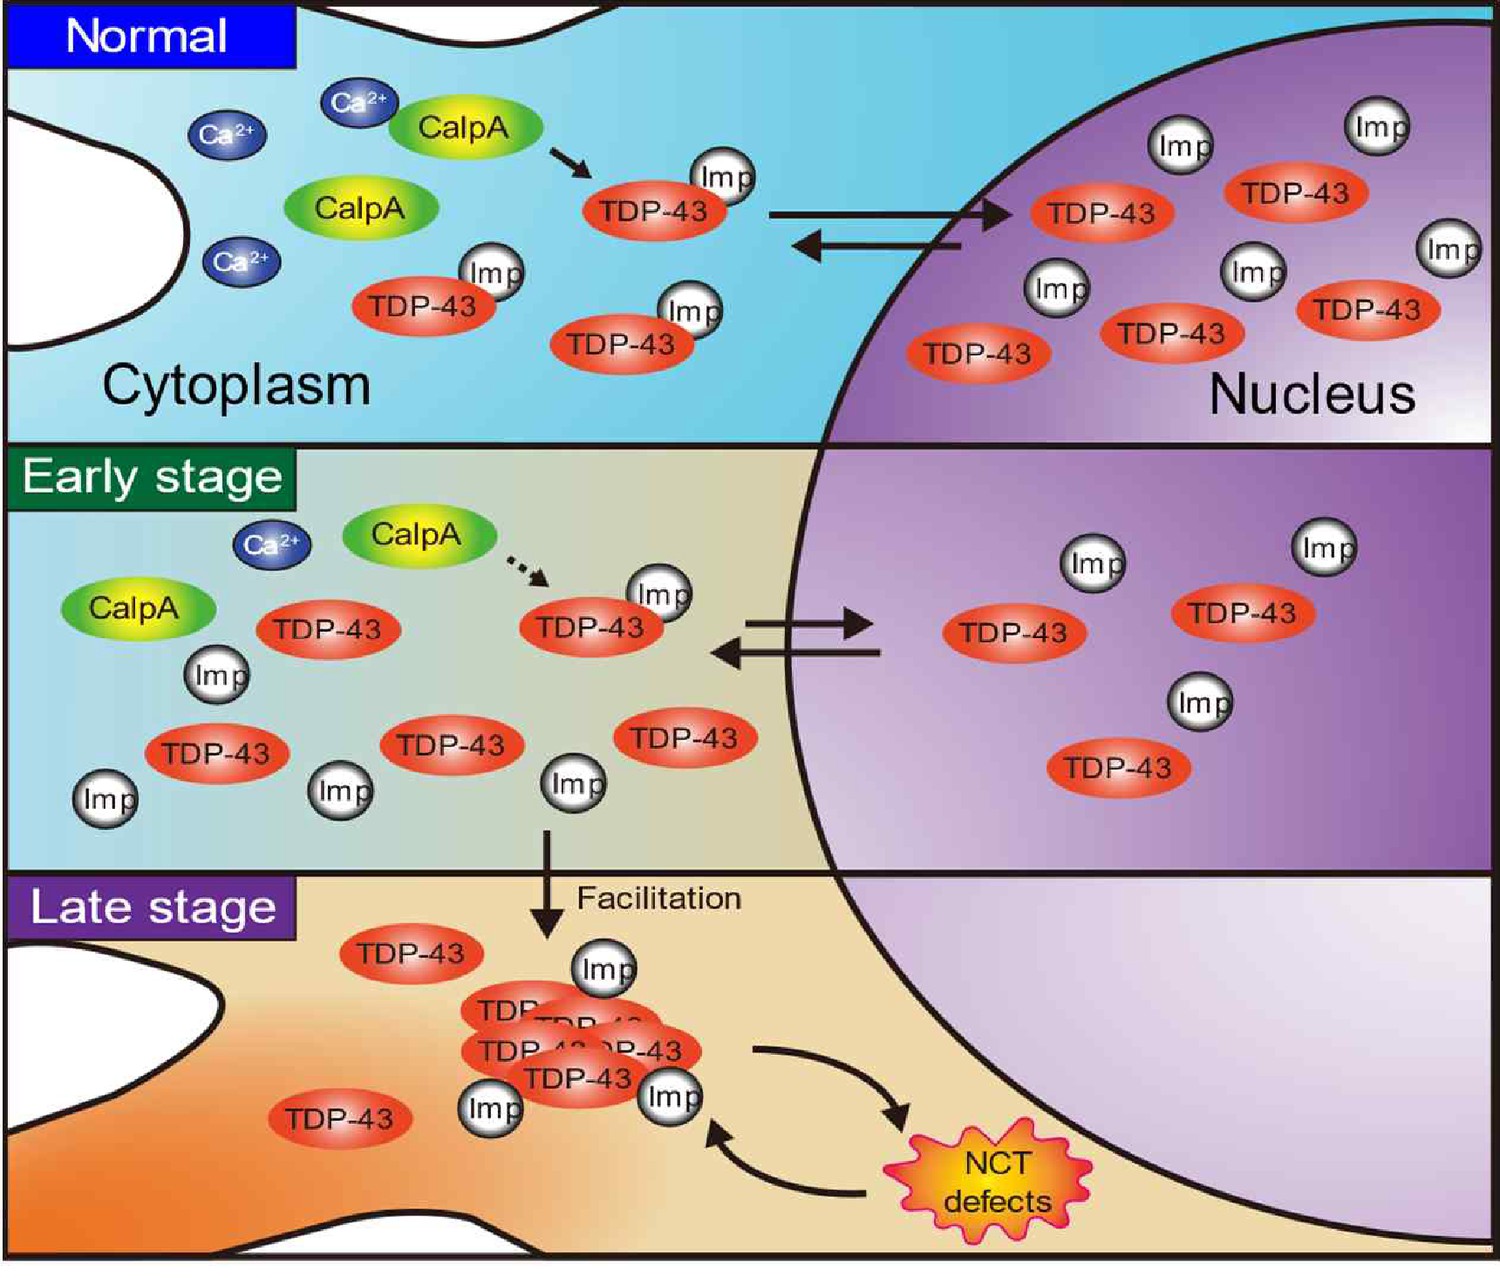
A schematic illustration visualizing how our finding of the calcium-Calpain-A-Importin α3 pathway extends the current feedback cycle of TDP-43 aggregation and NCT defects during ALS pathogenesis.
Figure 7—figure supplement 2
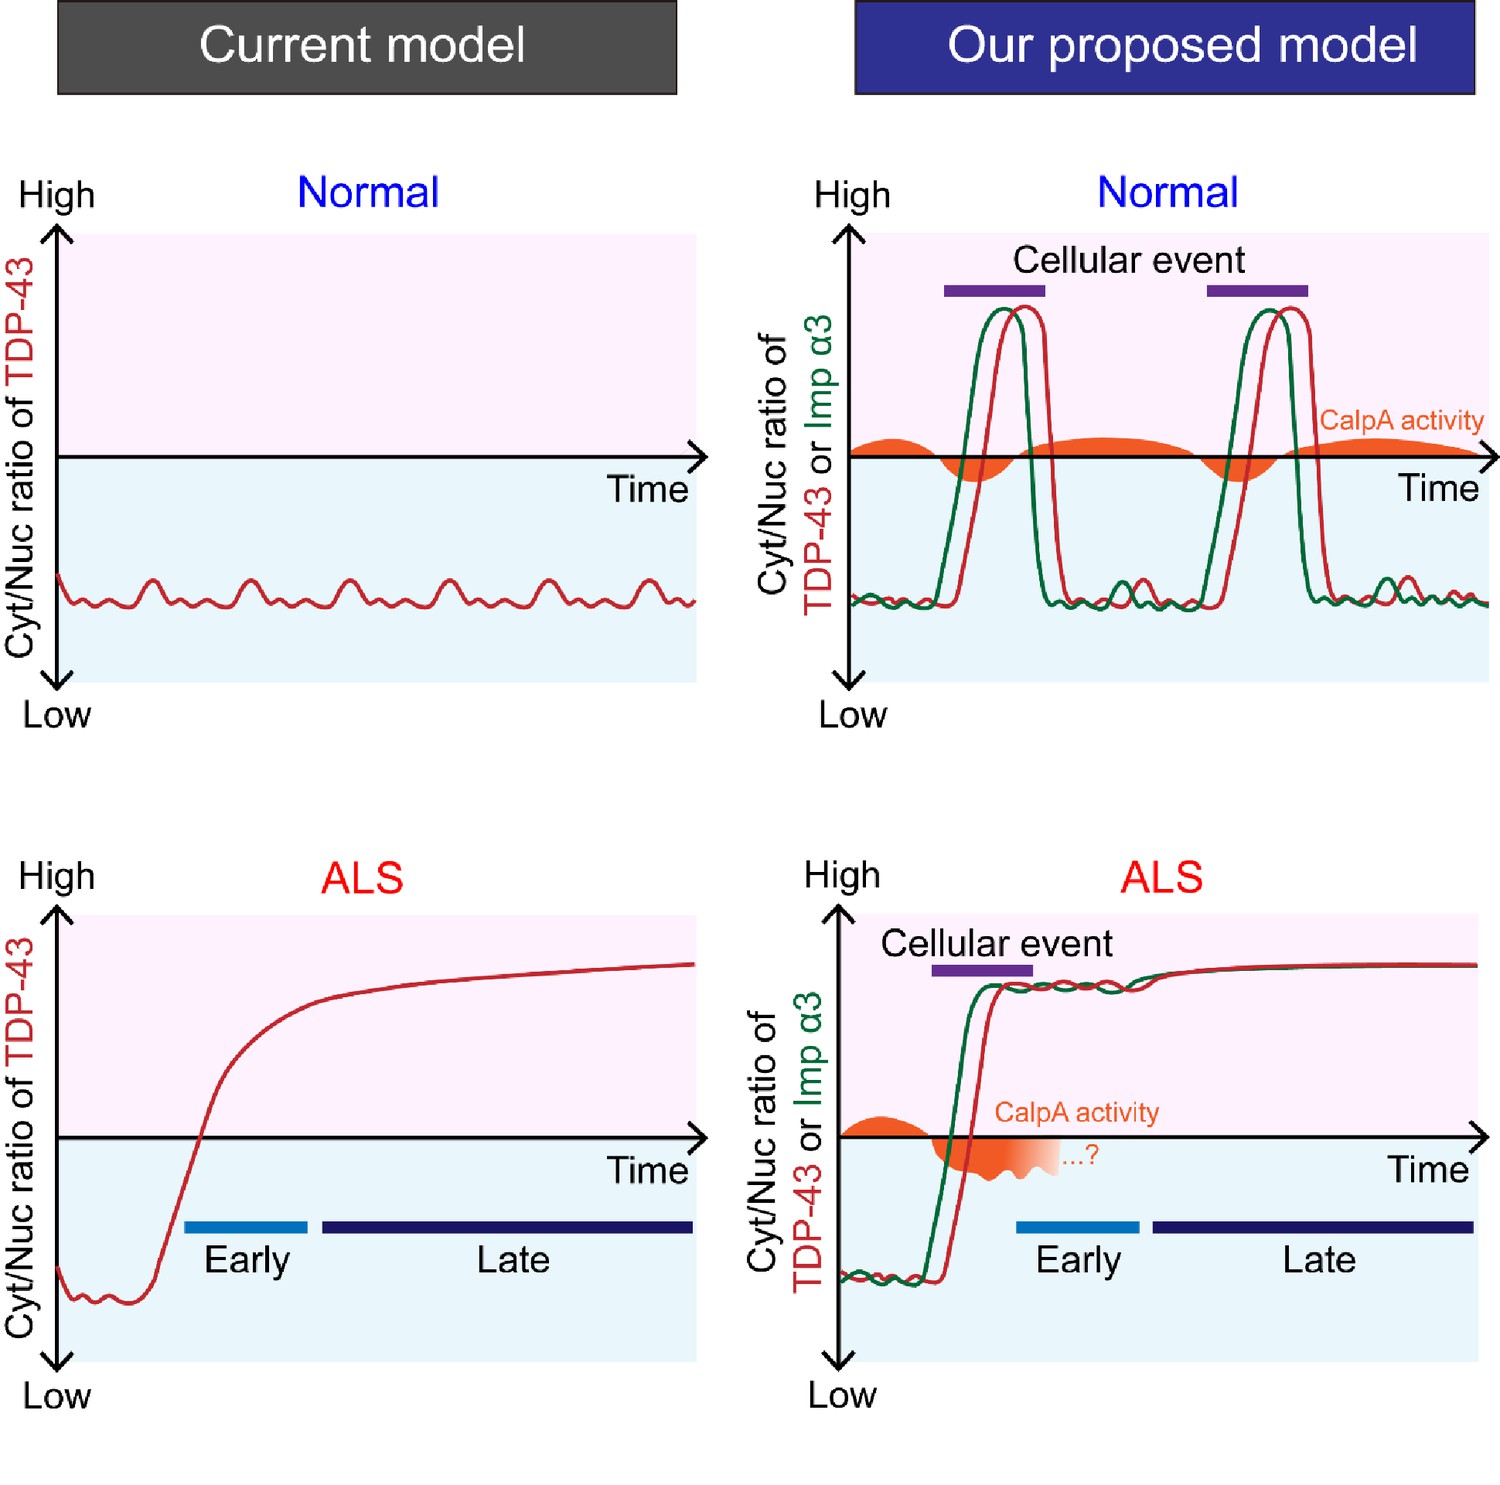
A schematic illustration showing the conceptual differences in understanding TDP-43 pathology between a previous model and our proposed model.
In our model, cellular events contribute to the cytoplasmic accumulation of TDP-43 through the calcium-CalpA-Imp α3 pathway.
Figure 7—figure supplement 3
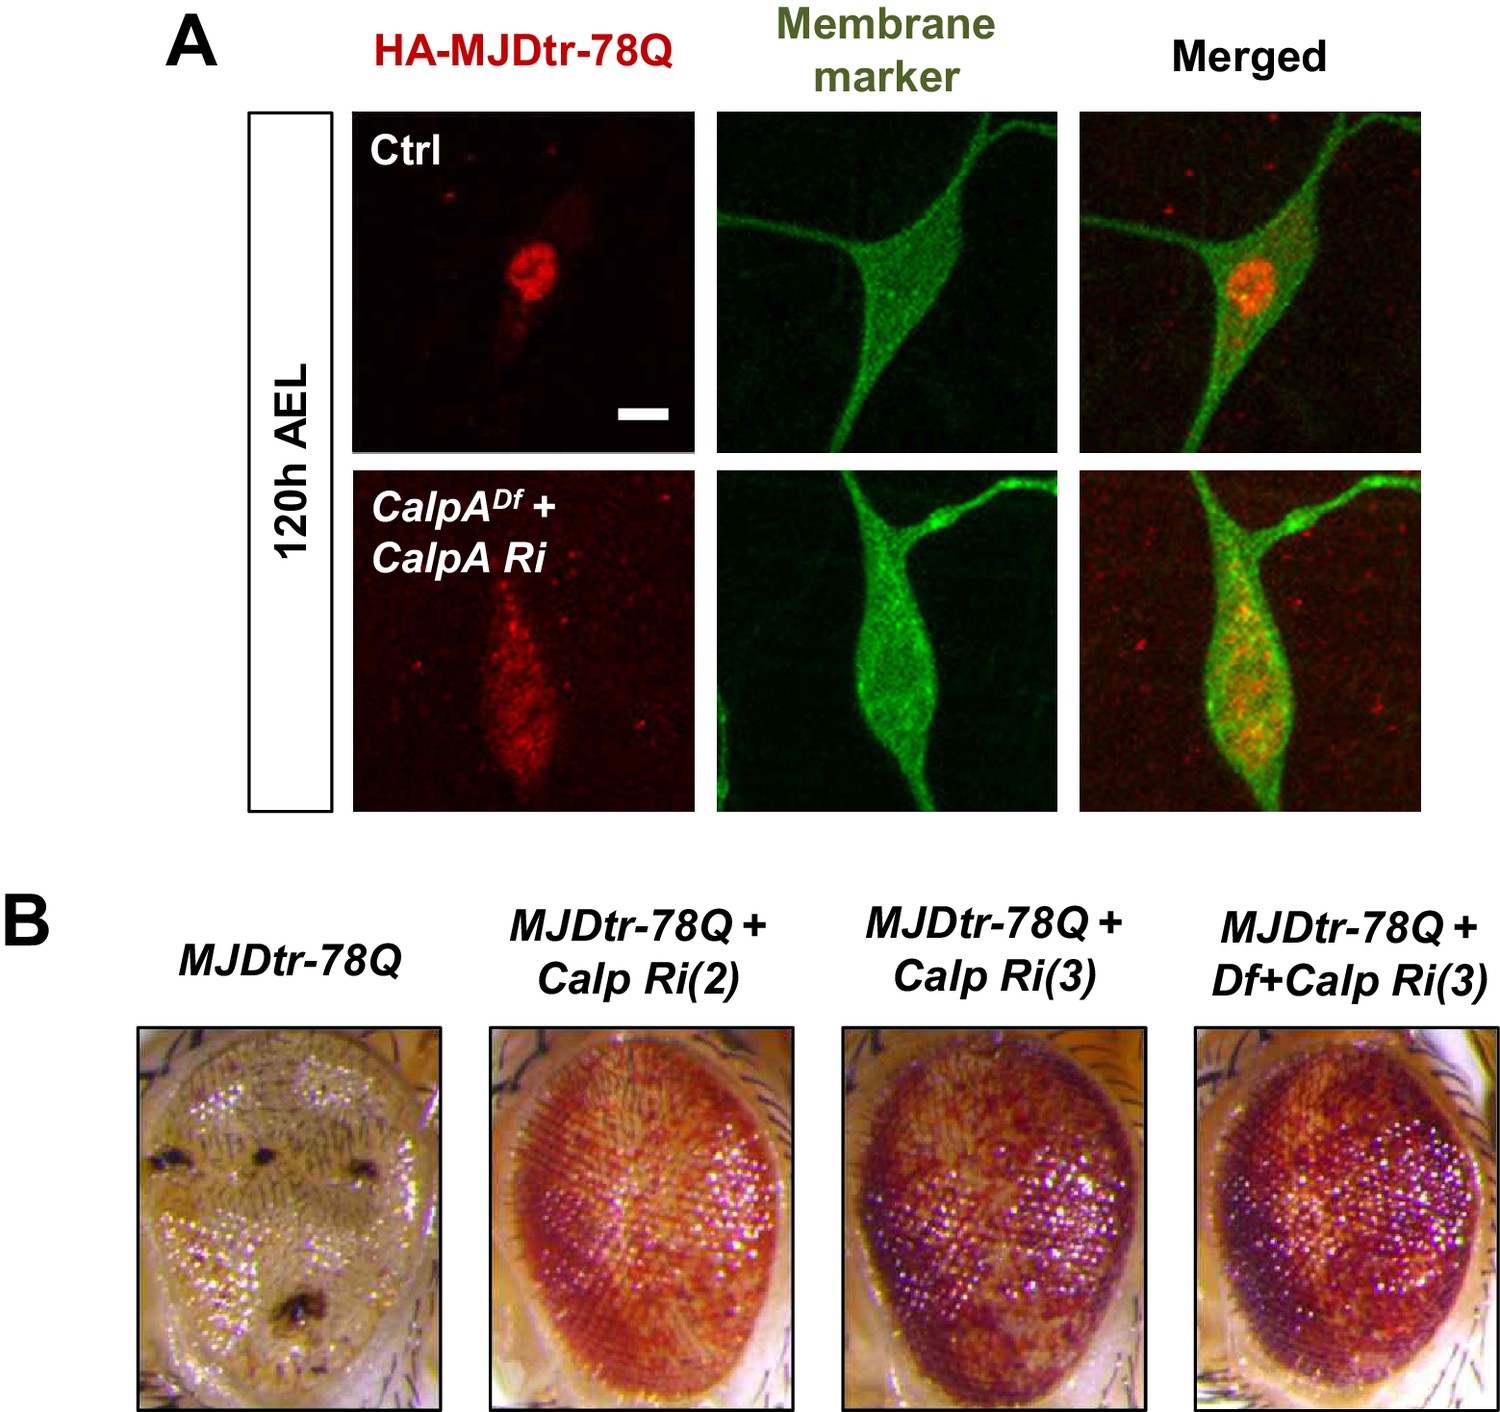
Subcellular localization change of polyQ proteins and restoration of polyQ-induced retinal degeneration via knockdown of CalpA.
(A) Subcellular localization of overexpressed HA-MJDtr-78Q proteins in C4da neurons with the following genotypes: [Genotype: Ctrl, UAS-HA-MJDtr-78Qs/+;ppk1a-Gal4, UAS-mCD8-GFP/+, CalpADf + CalpA Ri, CalpA Df(2R)BSC26/UAS HA-MJDtr-78Qs;ppk1a-Gal4, UAS-mCD8-GFP/CalpA Ri]. (B) Retinal images of flies with the following genotypes: [Genotype: MJDtr-78Q, GMR-Gal4, UAS-HA-MJDtr-78Qs/+, MJDtr-78Q+Calp Ri (2), GMR-Gal4, UAS-HA-MJDtr-78Qs/CalpA Ri, MJDtr-78Q+Calp Ri (3), GMR-Gal4, UAS-HA-MJDtr-78Qs/+;CalpA Ri/+, MJDtr-78Q+Df+Calp Ri (3), GMR-Gal4, UAS-HA-MJDtr-78Qs/CalpADf(2R)BSC26;CalpA Ri/+].
Figure 7—figure supplement 4
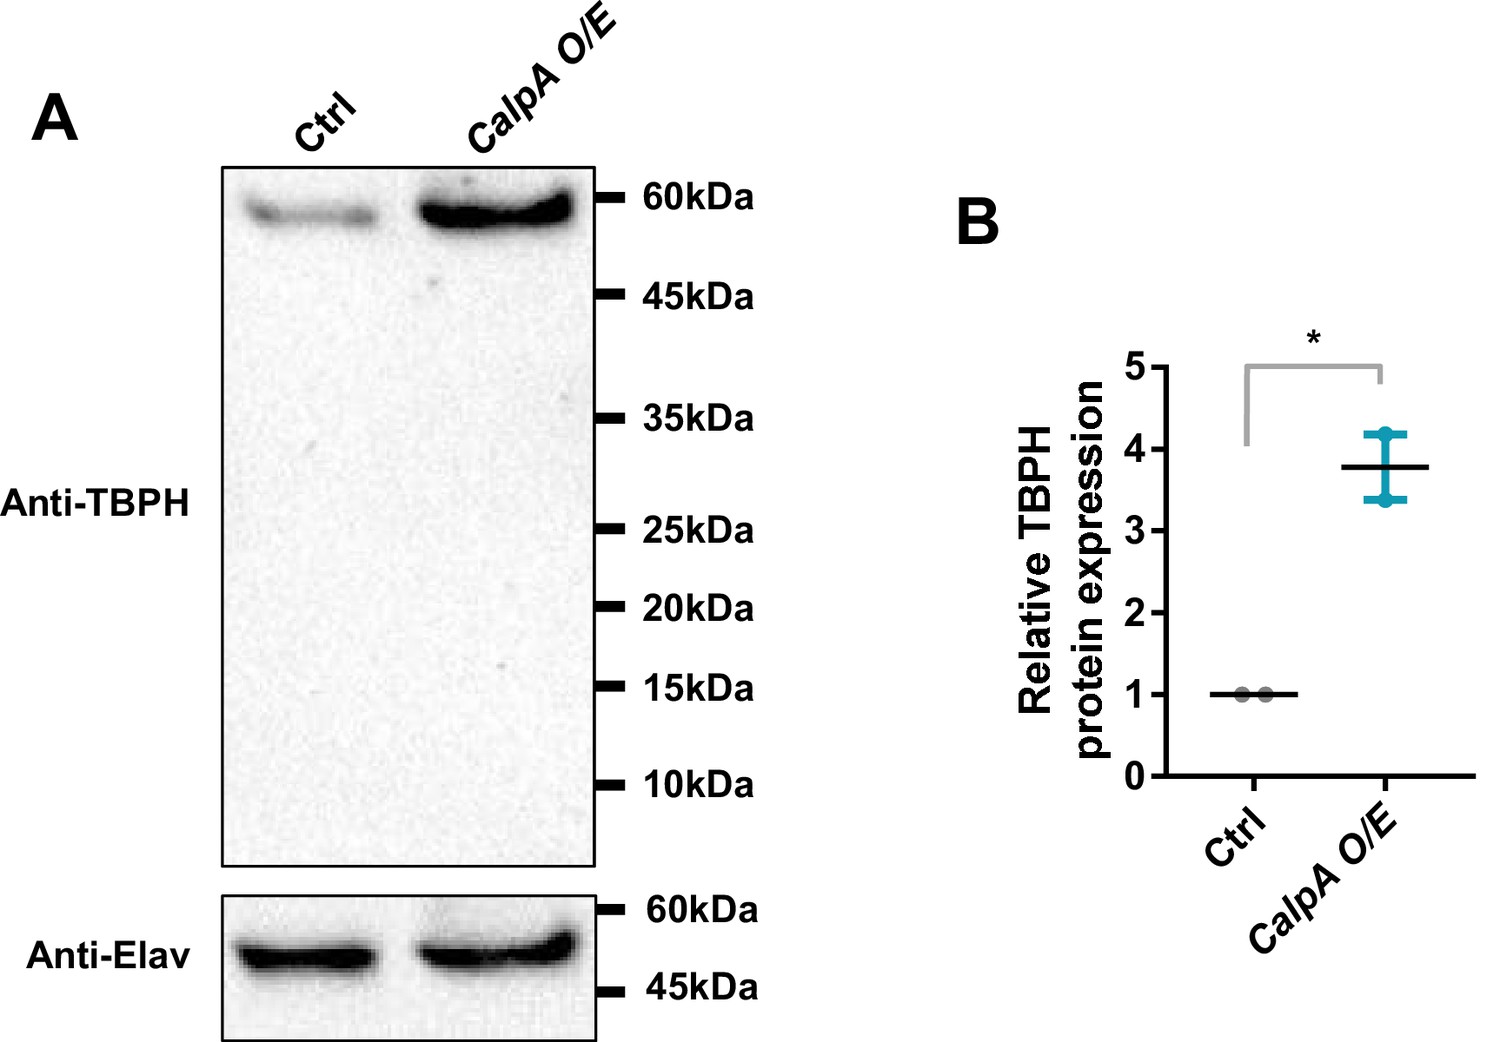
CalpA overexpression increases the amount of TBPH protein without shifting its size.
(A) Representative images from western blot analysis of lysates from adult fly heads [Genotype: Ctrl, +/+;elav-Gal4/UAS-Luciferase, Calp O/E, UAS-CalpA-2xMyc/+;elav-Gal4/+]. TBPH proteins (58 kDa) are immunoblotted using endogenous TBPH antibody. Elav (50 kDa) proteins are used as a loading control. (B) Quantification of the amount of endogenous TBPH normalized to controls. *p=0.0206 by two-tailed t-test; error bars, ± SEM; n = 2 blots.
Tables
Key resources table
| Reagent type (species) or resource | Designation | Source or reference | Identifiers | Additional information |
|---|---|---|---|---|
| Genetic reagent (D. melanogaster) | w1118 | Bloomington Drosophila Stock Center (BDSC) | RRID:BDSC_5905 | |
| Genetic reagent (D. melanogaster) | D42-Gal4 | BDSC | RRID:BDSC_8816 | |
| Genetic reagent (D. melanogaster) | TH-Gal4 | BDSC | RRID:BDSC_8848 | |
| Genetic reagent (D. melanogaster) | repo-Gal4 | BDSC | RRID:BDSC_7415 | |
| Genetic reagent (D. melanogaster) | UAS-mCD8-RFP | BDSC | RRID:BDSC_27399 | |
| Genetic reagent (D. melanogaster) | UAS-CD4-tdTom | BDSC | RRID:BDSC_35841 | |
| Genetic reagent (D. melanogaster) | Itprka1091/+ | BDSC | RRID:BDSC_30739 | |
| Genetic reagent (D. melanogaster) | Itprsv35/+ | BDSC | RRID:BDSC_30740 | |
| Genetic reagent (D. melanogaster) | 20XUAS-ChR2.T159C-HA | BDSC | RRID:BDSC_52258 | |
| Genetic reagent (D. melanogaster) | UAS-Chr2.s | BDSC | RRID:BDSC_9681 | |
| Genetic reagent (D. melanogaster) | RyR16/+ | BDSC | RRID:BDSC_6812 | |
| Genetic reagent (D. melanogaster) | UAS-NachBac | BDSC | RRID:BDSC_9467 | |
| Genetic reagent (D. melanogaster) | UAS-R-GECO1-IR1,UAS-R-GECO1.L-IR2 | BDSC | RRID:BDSC_52222 | |
| Genetic reagent (D. melanogaster) | UAS-Cam RNAi | BDSC | RRID:BDSC_34609 | |
| Genetic reagent (D. melanogaster) | UAS-CanA-14F RNAi | BDSC | RRID:BDSC_58249 | |
| Genetic reagent (D. melanogaster) | UAS-CanB RNAi | BDSC | RRID:BDSC_27307 | |
| Genetic reagent (D. melanogaster) | UAS-CaMKI RNAi | BDSC | RRID:BDSC_35362 | |
| Genetic reagent (D. melanogaster) | UAS-Pka-C1 RNAi | BDSC | RRID:BDSC_31599 | |
| Genetic reagent (D. melanogaster) | UAS-Pkc53E RNAi | BDSC | RRID:BDSC_55864 | |
| Genetic reagent (D. melanogaster) | UAS-CalpA RNAi | BDSC | RRID:BDSC_29455 | |
| Genetic reagent (D. melanogaster) | UAS-CalpB RNAi | BDSC | RRID:BDSC_25963 | |
| Genetic reagent (D. melanogaster) | UAS-NFAT RNAi | BDSC | RRID:BDSC_51422 | |
| Genetic reagent (D. melanogaster) | UAS-nej RNAi | BDSC | RRID:BDSC_37489 | |
| Genetic reagent (D. melanogaster) | UAS-CrebA RNAi | BDSC | RRID:BDSC_27648 | |
| Genetic reagent (D. melanogaster) | UAS-CrebB RNAi | BDSC | RRID:BDSC_63681 | |
| Genetic reagent (D. melanogaster) | UAS-Imp α1 RNAi | BDSC | RRID:BDSC_27523 | |
| Genetic reagent (D. melanogaster) | UAS-Imp α2 RNAi | BDSC | RRID:BDSC_27692 | |
| Genetic reagent (D. melanogaster) | UAS-Imp α3 RNAi | BDSC | RRID:BDSC_27535 | |
| Genetic reagent (D. melanogaster) | UAS-Imp β1 RNAi | BDSC | RRID:BDSC_31242 | |
| Genetic reagent (D. melanogaster) | UAS-Imp 7 RNAi | BDSC | RRID:BDSC_33626 | |
| Genetic reagent (D. melanogaster) | UAS-Imp β11 RNAi | BDSC | RRID:BDSC_55142 | |
| Genetic reagent (D. melanogaster) | UAS-Tnpo RNAi | BDSC | RRID:BDSC_50732 | |
| Genetic reagent (D. melanogaster) | UAS-Tnpo-SR RNAi | BDSC | RRID:BDSC_56974 | |
| Genetic reagent (D. melanogaster) | UAS-Ran RNAi | BDSC | RRID:BDSC_42482 | |
| Genetic reagent (D. melanogaster) | UAS-Ntf-2 RNAi | BDSC | RRID:BDSC_28633 | |
| Genetic reagent (D. melanogaster) | UAS-Luciferase | BDSC | RRID:BDSC_35788 | |
| Genetic reagent (D. melanogaster) | UAS-Hrb87F RNAi | BDSC | RRID:BDSC_52937 | |
| Genetic reagent (D. melanogaster) | UAS-HNPNPC RNAi | BDSC | RRID:BDSC_42506 | |
| Genetic reagent (D. melanogaster) | UAS-glo RNAi | BDSC | RRID:BDSC_33668 | |
| Genetic reagent (D. melanogaster) | UAS-Syp RNAi | BDSC | RRID:BDSC_56972 | |
| Genetic reagent (D. melanogaster) | UAS-poly-PR.PO-100 | BDSC | RRID:BDSC_58698 | |
| Genetic reagent (D. melanogaster) | UAS-poly-GR.PO-100 | BDSC | RRID:BDSC_58696 | |
| Genetic reagent (D. melanogaster) | Gmr-Gal4 | BDSC | RRID:BDSC_1104 | |
| Genetic reagent (D. melanogaster) | UAS-MJD-tr78Q | BDSC | RRID:BDSC_8150 | |
| Genetic reagent (D. melanogaster) | Df(2R)BSC26 | BDSC | RRID:BDSC_6866 | |
| Genetic reagent (D. melanogaster) | UAS-SERCA RNAi | Vienna Drosophila Resource Center (VDRC) | VDRC: 107446; RRID:FlyBase_FBst0479267 | |
| Genetic reagent (D. melanogaster) | UAS-Itpr RNAi | VDRC | VDRC: 106982; RRID:FlyBase_FBst0478805 | |
| Genetic reagent (D. melanogaster) | UAS-RyR RNAi | VDRC | VDRC: 109631; RRID:FlyBase_FBst0481295 | |
| Genetic reagent (D. melanogaster) | UAS-CaMKII RNAi | VDRC | VDRC: 100265; RRID:FlyBase_FBst0472139 | |
| Genetic reagent (D. melanogaster) | UAS-Imp α3 RNAi | VDRC | VDRC: 106249; RRID:FlyBase_FBst0478074 | |
| Genetic reagent (D. melanogaster) | UAS-RanGAP RNAi | VDRC | VDRC: 108264; RRID:FlyBase_FBst0480076 | |
| Genetic reagent (D. melanogaster) | UAS-Rcc1 RNAi | VDRC | VDRC: 110321; RRID:FlyBase_FBst0481896 | |
| Genetic reagent (D. melanogaster) | UAS-Hrb98DE RNAi | VDRC | VDRC: 29524; RRID:FlyBase_FBst0458009 | |
| Genetic reagent (D. melanogaster) | UAS-Hrb27C RNAi | VDRC | VDRC: 101555; RRID:FlyBase_FBst0473428 | |
| Genetic reagent (D. melanogaster) | UAS-HNRNPU1 RNAi | VDRC | VDRC:106984; RRID:FlyBase_FBst0478807 | |
| Genetic reagent (D. melanogaster) | UAS-Sm RNAi | VDRC | VDRC:108351; RRID:FlyBase_FBst0480162 | |
| Genetic reagent (D. melanogaster) | UAS-CalpA RNAi | VDRC | VDRC:101294; RRID:FlyBase_FBst0473167 | |
| Genetic reagent (D. melanogaster) | 40DUAS | VDRC | VDRC ID: 60101 | |
| Genetic reagent (D. melanogaster) | UAS-TBPH-Flag-HA | Bangalore Fly Resource Center | Drosophila Protein interaction Map (DPiM) | |
| Genetic reagent (D. melanogaster) | ppk1a-Gal4 | Han et al., 2011; Yuh Nung Jan (University of California, San Francisco (UCSF)) | ||
| Genetic reagent (D. melanogaster) | UAS-tdTomato P2A GCaMP5G, attp1 | Daniels et al., 2014; Barry Ganetzky (University of Wisconsin-Madison) | ||
| Genetic reagent (D. melanogaster) | UAS-3xMyc-RFP-TDP-43 | Wang et al., 2011; Brian D. McCabe, (Swiss Federal Institute of Technology (EPFL)) | ||
| Genetic reagent (D. melanogaster) | UAS-TBPH | Wang et al., 2011; Brian D. McCabe, (Swiss Federal Institute of Technology (EPFL)) | ||
| Genetic reagent (D. melanogaster) | UAS-TDP-43 WT | Voigt et al., 2010; Aaron Voigt (University Hospital, RWTH Aachen University) | ||
| Genetic reagent (D. melanogaster) | UAS-TDP-43 G287S | Voigt et al., 2010; Aaron Voigt (University Hospital, RWTH Aachen University) | ||
| Genetic reagent (D. melanogaster) | UAS-Flag-TDP-43 | Miguel et al., 2011; Magalie Lecourtois (University of Rouen) | ||
| Genetic reagent (D. melanogaster) | UAS-Flag-TDP-43-ΔNLS | Miguel et al., 2011; Magalie Lecourtois (University of Rouen) | ||
| Genetic reagent (D. melanogaster) | UAS-2xFlag-Imp α3 (vk00002) | This paper | SB Lab (DGIST) | |
| Genetic reagent (D. melanogaster) | UAS-V5-Imp β1 (vk00002) | This paper | SB Lab (DGIST) | |
| Genetic reagent (D. melanogaster) | UAS-CalpA-2xMyc (vk00002) | This paper | SB Lab (DGIST) | |
| Genetic reagent (D. melanogaster) | UAS-empty | Park et al., 2020 | SB Lab (DGIST) | |
| Antibody | Mouse monoclonal anti-Flag (DYKDDDDK) | Wako | Cat#: 012–22384; RRID:AB_10659717 | IHC (1:400) |
| Antibody | Rat monoclonal anti-HA | Roche | Cat#: 11867423001; RRID:AB_390918 | IHC (1:200) |
| Antibody | Rabbit anti-TBPH | LTK BioLaboratories, Taiwan; (Lin et al., 2011); C.-K. James Shen (Taipei Medical University) | IHC (1:100) | |
| Antibody | Rabbit polyclonal anti-TDP-43 | Proteintech | Cat#: 10782–2-AP, RRID:AB_615042 | IHC (1:400) |
| Antibody | Goat polyclonal anti-mouse Alexa Fluor 647 | Invitrogen | Cat#: A21236; RRID:AB_2535805 | IHC (1:400) |
| Antibody | Goat polyclonal anti-rat Alexa Fluor 647 | Jackson Immunoresearch Laboratories | Cat#: 112-605-003; RRID:AB_2338393 | IHC (1:200) |
| Antibody | Goat polyclonal anti-rabbit Alexa Fluor 647 | Invitrogen | Cat#: A21244; RRID:AB_2535812 | IHC (1:400) |
| Antibody | Goat polyclonal anti-HRP Alexa Fluor 488 | Jackson Immunoresearch Laboratories | Cat#: 123-545-021; RRID:AB_2338965 | IHC (1:400) |
| Antibody | Goat polyclonal anti-HRP Cy3 | Jackson Immunoresearch Laboratories | Cat#: 123-165-021; RRID:AB_2338959 | IHC (1:400) |
| Recombinant DNA reagent | Plasmid: UAS-2xFlag-Imp α3 | This paper | ||
| Recombinant DNA reagent | Plasmid: UAS-V5-Imp β1 | This paper | ||
| Recombinant DNA reagent | Plasmid: UAS-CalpA-2xMyc | This paper | ||
| Chemical compound, drug | All-trans-retinal (ATR) powder | Sigma-Aldrich | Cat#: R2500; CAS: 116-31-4 | 1 mM |
| Software, algorithm | Zen | Zeiss | RRID:SCR_013672 | |
| Software, algorithm | ImageJ | NIH | RRID:SCR_003070 | |
| Software, algorithm | ImageJ Ratio Plus (plug in) | NIH | PMID:22051797 | |
| Software, algorithm | GraphPad Prism | GraphPad Software | RRID:SCR_002798 | |
| Software, algorithm | EthoVision XT | Noldus Information Technology | RRID:SCR_000441 | |
| Software, algorithm | Adobe photoshop | Adobe | RRID:SCR_014199 | |
| Other | Flouro-Box | Neo Science | FLB-001B |
Additional files
Download links
A two-part list of links to download the article, or parts of the article, in various formats.
Downloads (link to download the article as PDF)
Open citations (links to open the citations from this article in various online reference manager services)
Cite this article (links to download the citations from this article in formats compatible with various reference manager tools)
Cytosolic calcium regulates cytoplasmic accumulation of TDP-43 through Calpain-A and Importin α3
eLife 9:e60132.
https://doi.org/10.7554/eLife.60132


