Emotional learning retroactively promotes memory integration through rapid neural reactivation and reorganization
- State Key Laboratory of Cognitive Neuroscience and Learning & IDG/McGovern Institute for Brain Research, Beijing Normal University, China
- Beijing Key Laboratory of Brain Imaging and Connectomics, Beijing Normal University, China
- Donders Institute for Brain, Cognition and Behaviour, Radboud University Medical Center, Netherlands
- School of Education, Chongqing Normal University, China
- Chinese Institute for Brain Research, China
Figures
Figure 1 with 6 supplements
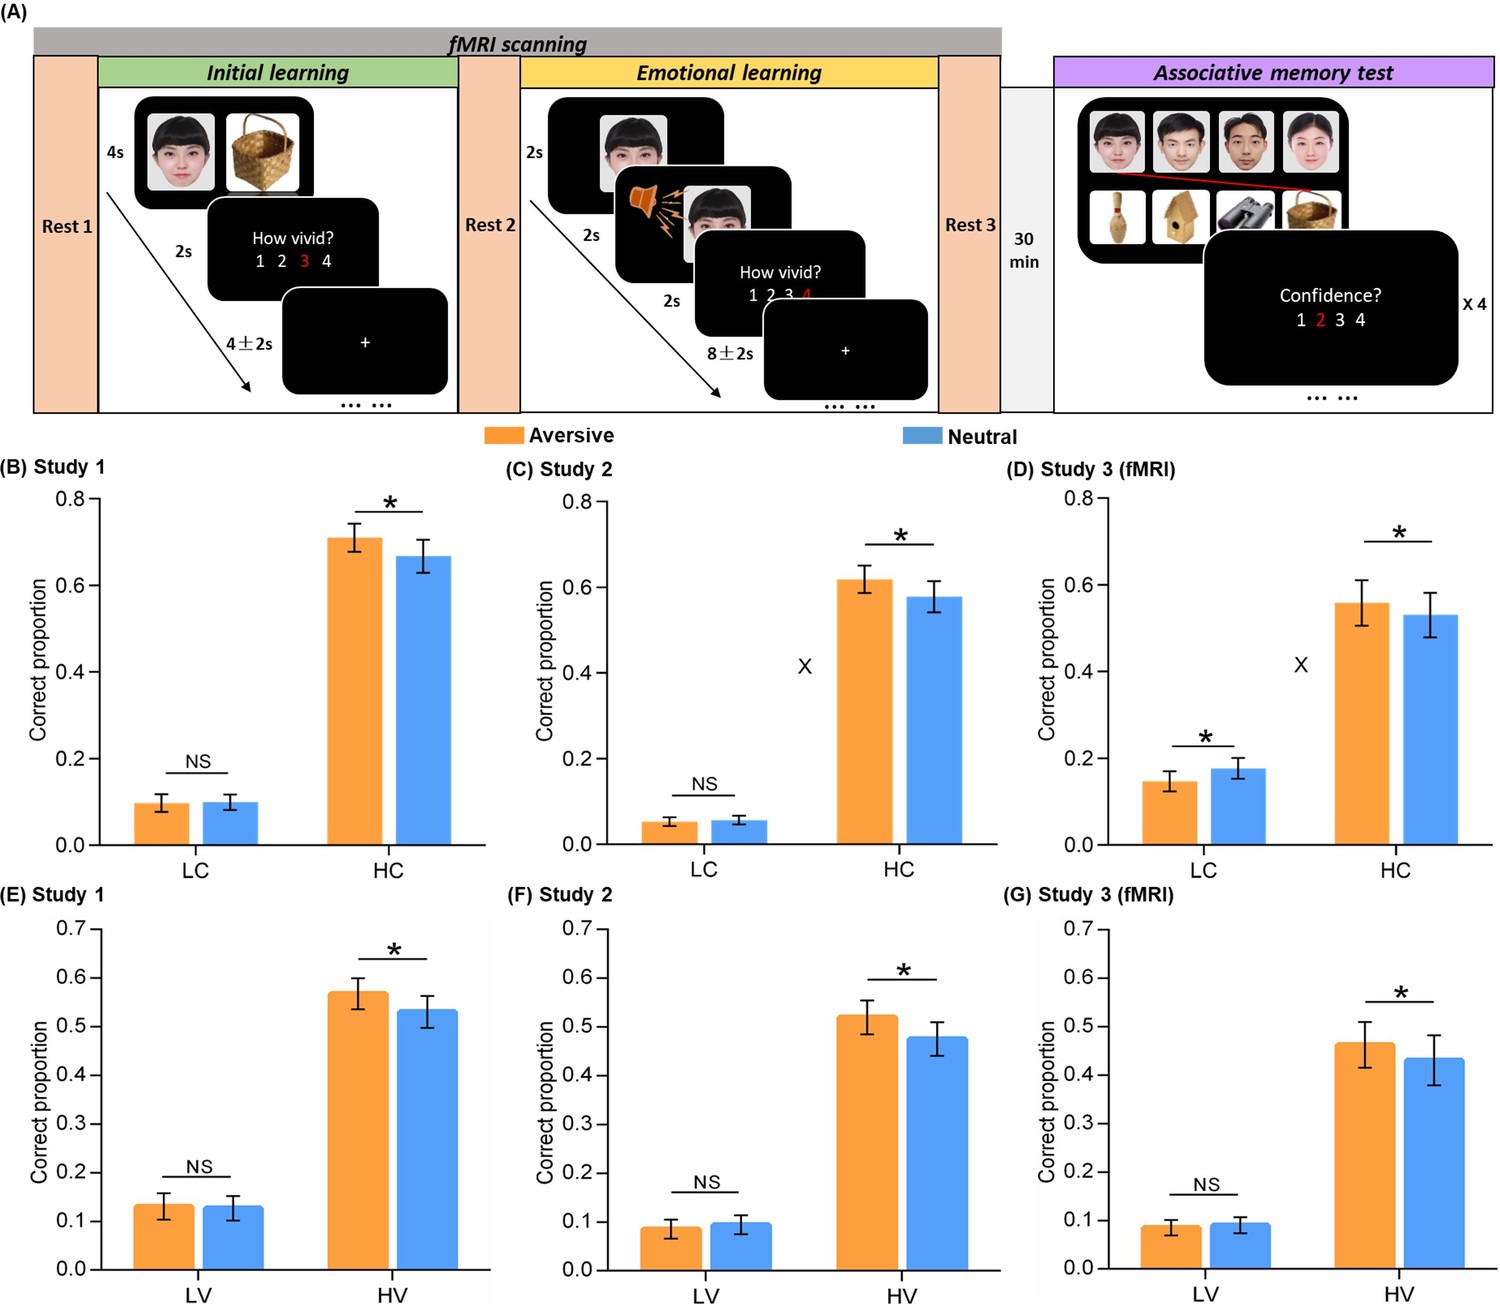
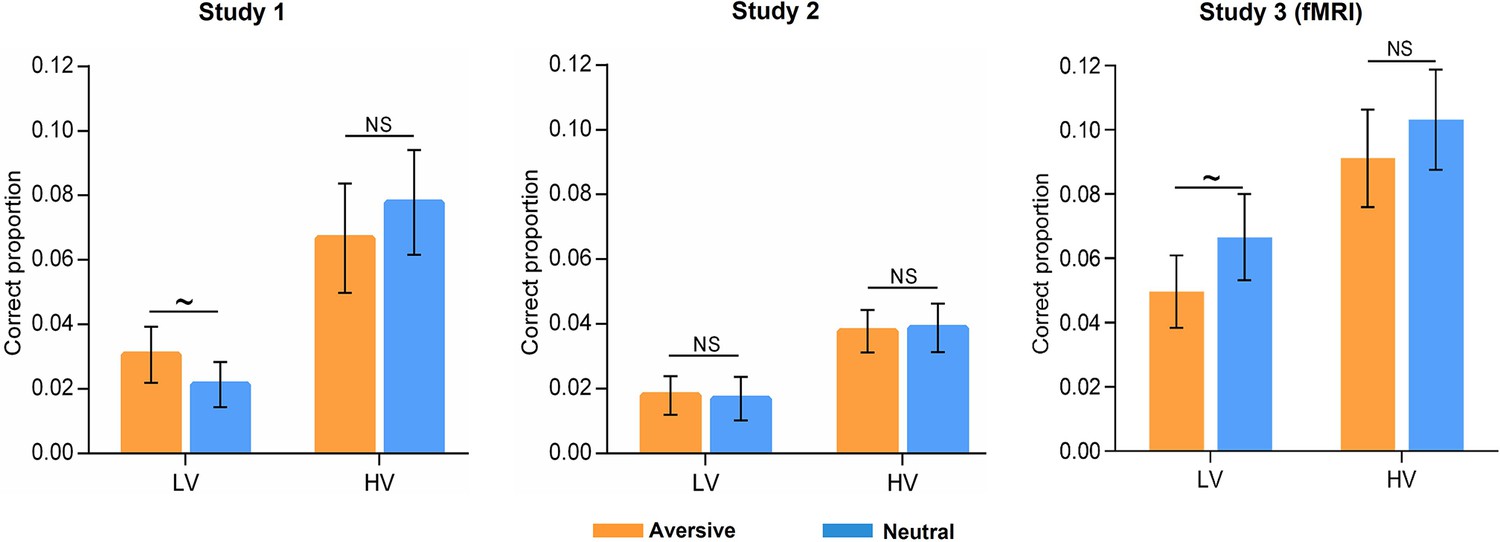
Experimental design and behavioral performance.
(A) The experiment consisted of three phases. During the initial learning phase, participants were instructed to vividly imagine each face and its paired object interacting with each other. During the emotional learning phase, each face from initial learning was presented again and then paired with either an aversive scream or a neutral voice. Participants were also instructed to imagine each face and its paired voice interacting. After a 30-min delay, participants performed a recognition memory test for face-object associations by matching each face (top) with one of the four objects (bottom). (B, C, D) Associative memory performance as a function of confidence ratings and emotional conditions in Study 1 (n=30), 2 (n=28), and 3 (fMRI, n=28). Bar graphs depict averaged correct proportion for face-object associations remembered with low (LC) and high (HC) confidence in aversive and neutral conditions separately. (E, F, G) High-confidence memory performance as a function of vividness ratings and emotional conditions in Study 1, 2, and 3 (fMRI). Bar graphs depict averaged correct proportion for face-object associations remembered with high confidence, which were rated with low (LV) and high (HV) vividness during the initial learning phase in aversive and neutral conditions separately. Error bars represent standard error of mean. ‘X’ indicates significant interaction (p<0.05). Notes: NS, non-significant; *p<0.05; two-tailed tests. The sample sizes are 30, 28 and 28 participants separately in Study 1, 2 and 3, unless otherwise noted in the following figure legends.
Figure 1—figure supplement 1
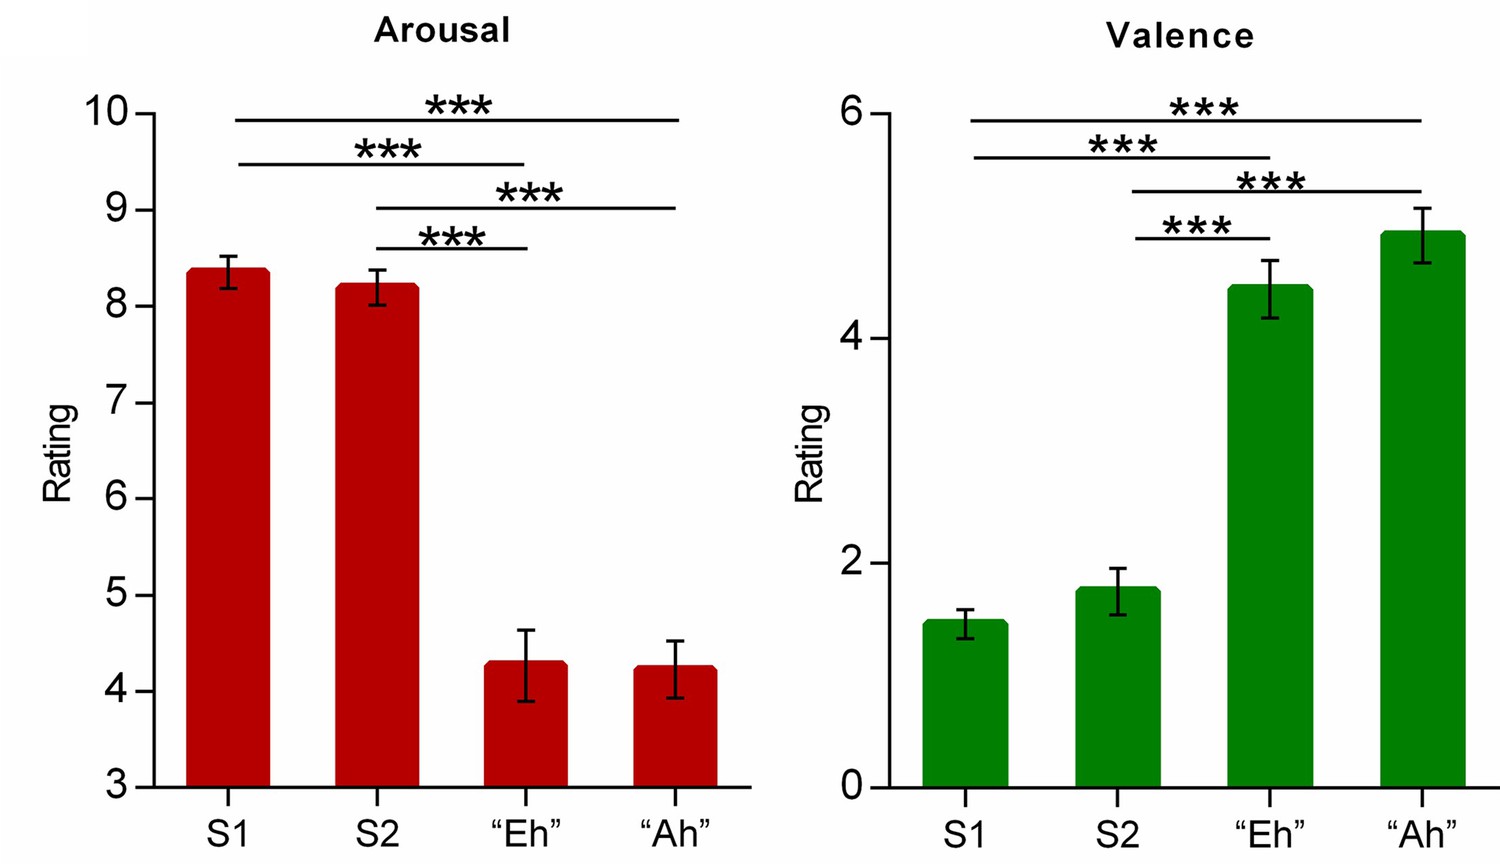
Emotional ratings on the four voices.
Bar graphs depict averaged arousal (left) and valence (right) ratings of each voice clip in a pilot experiment with independent subjects (n=19). Error bars represent standard error of mean. Notes: S1, Scream 1; S2, Scream 2; ***p<0.001; two-tailed tests.
Figure 1—figure supplement 2
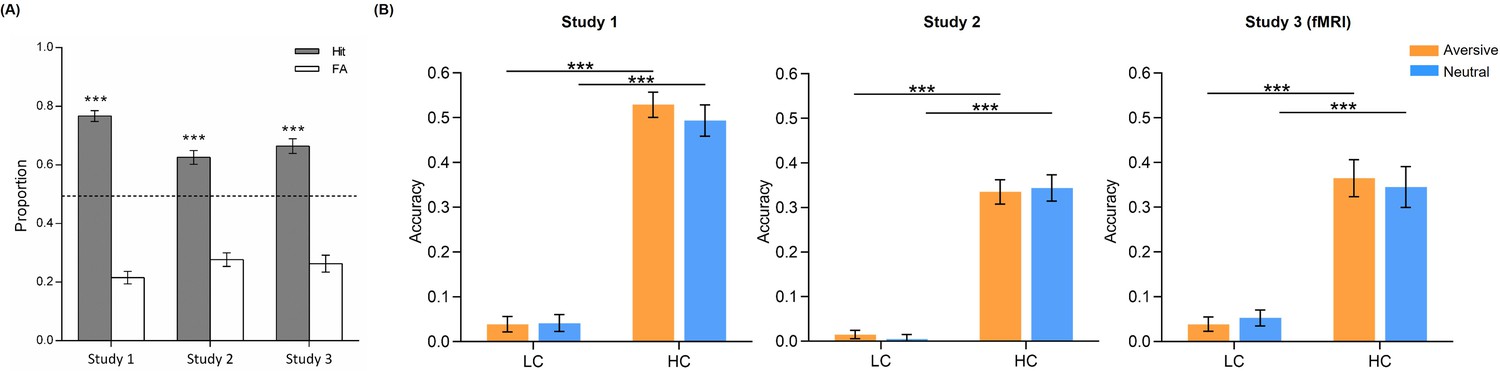
Face item memory performance.
(A) Item memory performances in Study 1 (n=30), 2 (n=27, data from one participant was missing due to an equipment failure with stimuli presentation software), and 3 (fMRI, n=28). About 30 min after the emotional learning phase, a face item memory test was administered outside the scanner prior to the face-object associative memory test. A total of 144 faces (72 learnt ones randomly intermixed with 72 novel foils) were presented on the screen one by one. Participants were instructed to make two-alternative forced-choice to indicate whether the presented face was old or new. Bar graphs depict averaged proportions for hit (gray) and false alarm (FA; white) responses in Study 1, 2, and 3 (fMRI). The dashed line represents the chance level (50%). (B) Item memory performance as a function of confidence ratings and emotional conditions in the three studies. Bar graphs depict averaged accuracies (i.e., hit minus false alarm) for face items remembered with low (LC) and high (HC) confidence in aversive and neutral conditions separately. Error bars represent standard error of mean. Notes: ***p<0.001; two-tailed tests.
Figure 1—figure supplement 3
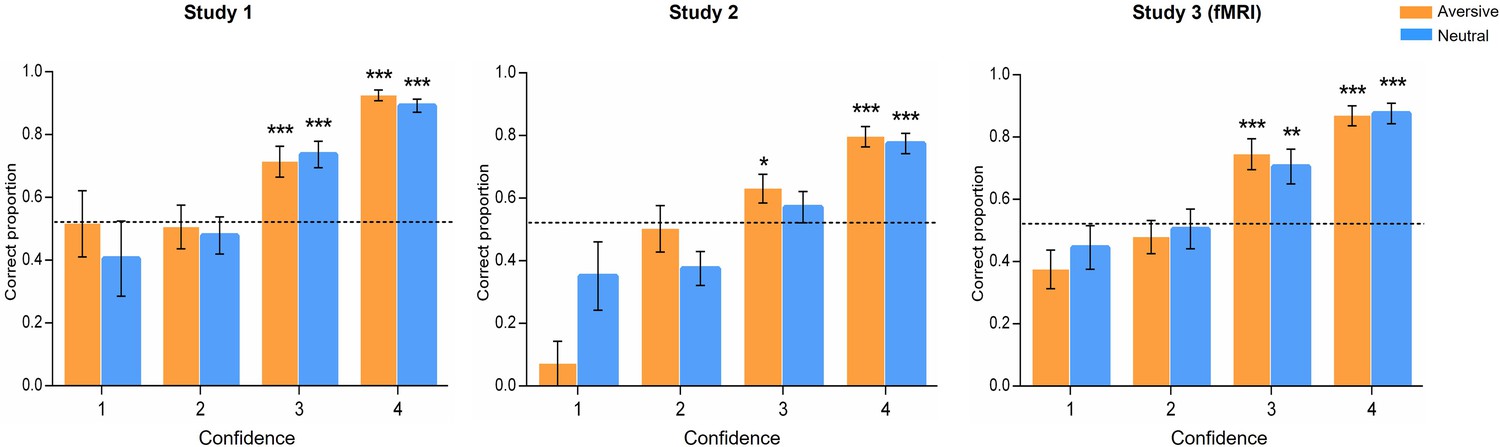
Associative memory performances on the four confidence levels.
Associative memory performances on each confidence rating, with 1 corresponding to very unconfident and 4 corresponding to very confident, in the three studies. Bar graphs depict averaged correctness (i.e. correct responses/all responses in each confidence level) for face-object associations in aversive and neutral conditions. In Study 1, separate one-sample t-tests on each confidence level revealed that the proportion of correctly remembered face-object associations with a 4 (t(28) = 23.00, p<0.001) or 3 (t(29) = 5.02, p<0.001) rating was significantly higher than chance level. However, the proportion of remembered associations with a 2 (t(26) = –0.29, p=0.771) or 1 (t(13) = –0.02, p=0.983) rating was not reliably different from chance. In Study 2, the proportion of correctly remembered face-object associations with a 4 (t(27) = 8.59, p<0.001) or 3 (t(27) = 2.09, p=0.047) rating was significantly higher than chance. The proportion of remembered associations with a 2 (t(24) = –2.30, p=0.031) or 1 (t(9) = –2.68, p=0.025) rating was even lower than chance. In Study 3, the proportion of correctly remembered face-object associations with a 4 (t(26) = 12.48, p<0.001) or 3 (t(27) = 3.83, p=0.001) rating was significantly higher than chance. The proportion of remembered associations with a 2 (t(25) = –0.52, p=0.607) or 1 (t(17) = –2.53, p=0.022) rating was not different from or even lower than chance. The dashed lines represent the chance level [(1/4+1/3+1/2+1)/4*100%=52%] based on our test by matching 4 sets of face-object pairings at a time. Error bars represent standard error of mean. Notes: *p<0.05, **p<0.01, ***p<0.001; two-tailed t-tests.
Figure 1—figure supplement 4

Relationships between vividness ratings and confidence ratings.
Trial-level relationships between vividness ratings during initial learning and subsequent confidence ratings during memory test in the three studies. Blue lines indicate the best linear fit and blue ribbons indicate 95% confidence intervals. Notes: ***p<0.001.
Figure 1—figure supplement 5
Low-confidence memory performance as a function of vividness and emotion.
Bar graphs depict averaged correct proportion for face-object associations remembered with low confidence, which were rated with low (LV) and high (HV) vividness during initial learning phase in aversive and neutral conditions separately. Paired t-tests in the three studies analyses revealed a trending but not significant emotion effect (i.e. aversive vs. neutral) for low-vividness encoded associations in Study 1 (t(29) = 1.97, p=0.058), which was not replicated by Study 2 (t(27) = 0.27, p=0.787) nor Study 3 (t(27) = –1.74, p=0.094). No significant emotion effect for high-vividness encoded associations was observed in three studies (Study 1: t(29) = –0.98, p=0.334; Study 2: t(27) = –0.15, p=0.886; Study 3: t(27) = –1.10, p=0.283). Error bars represent standard error of mean. Notes: NS, non-significant; ~p < 0.10; two-tailed tests.
Figure 1—figure supplement 6
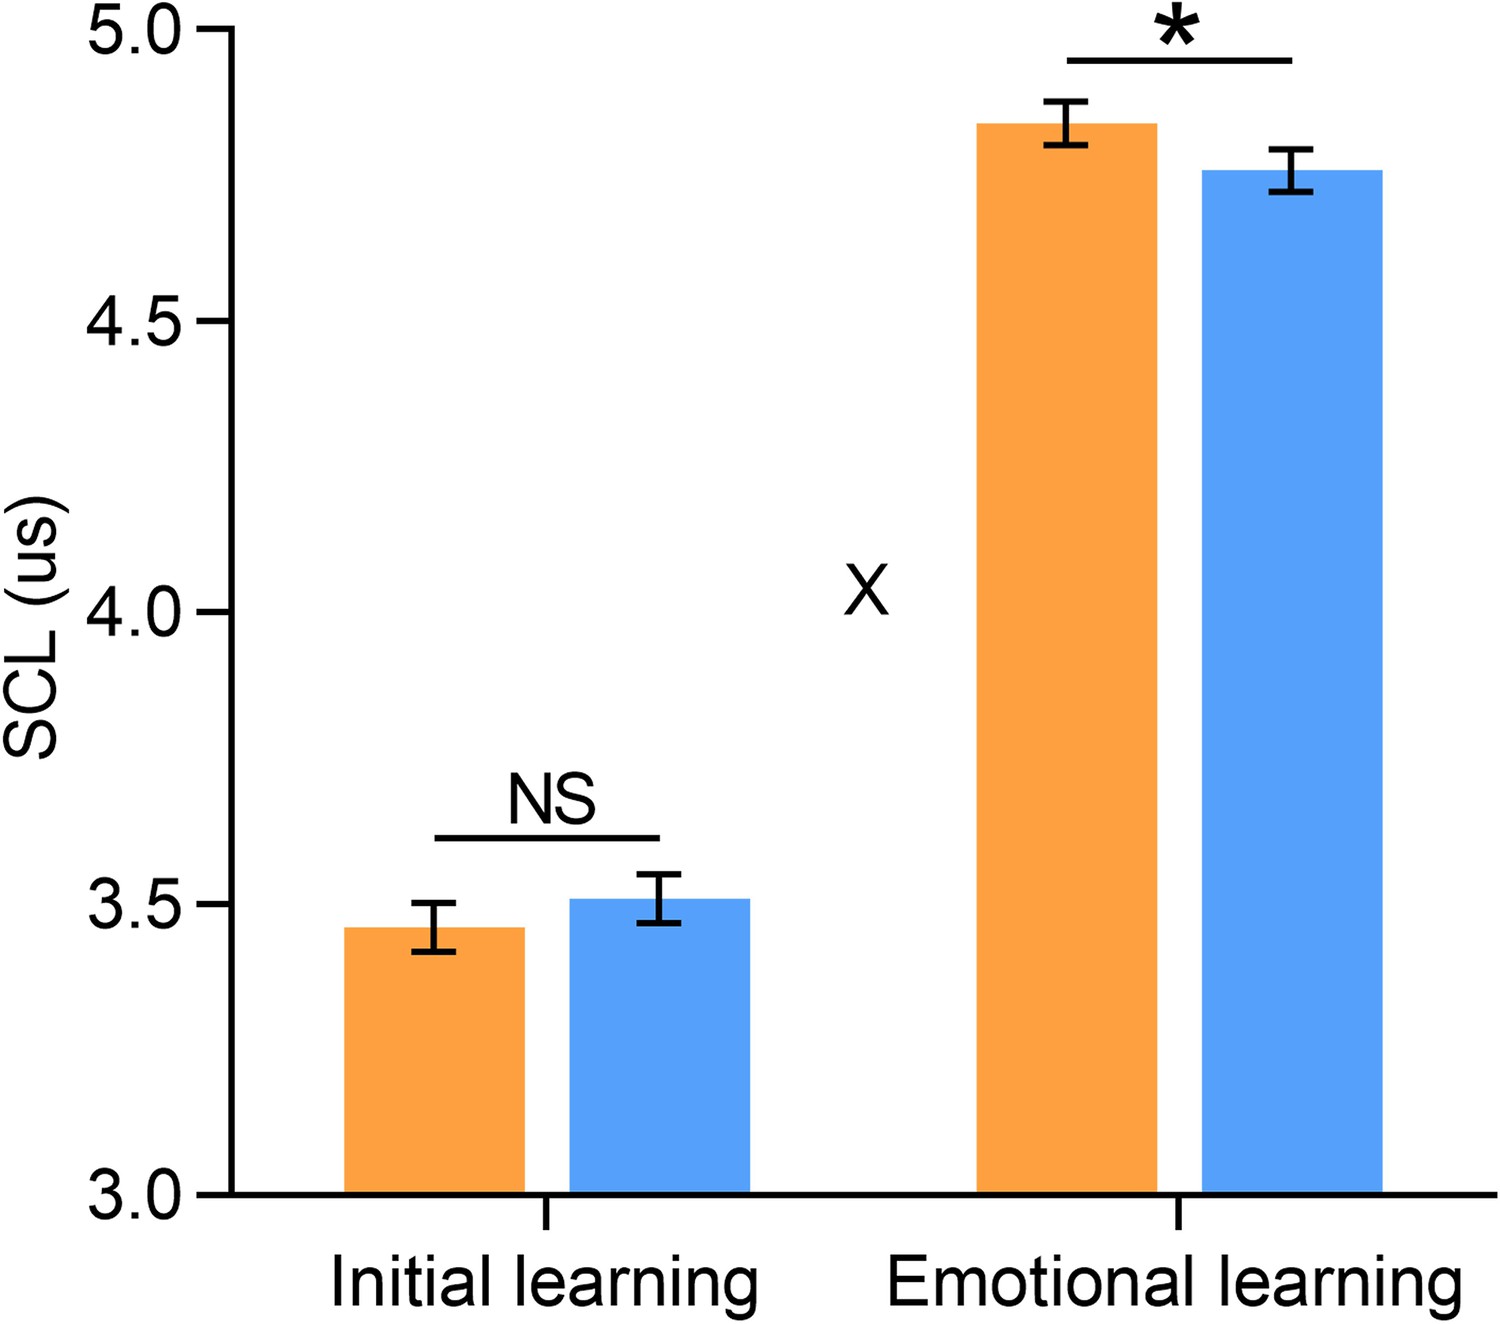
Skin conductance levels (SCLs) in Study 3 (fMRI).
Bar graphs depict averaged SCLs in aversive and neutral conditions during initial and emotional learning phases separately (n=20, data from 8 participants were incomplete due to an equipment failure with Biopac MP 150 System). Error bars represent standard error of mean. ‘X’ indicates significant interaction (p<0.05). Notes: NS, non-significant; *p<0.05; two-tailed tests.
Figure 2 with 6 supplements
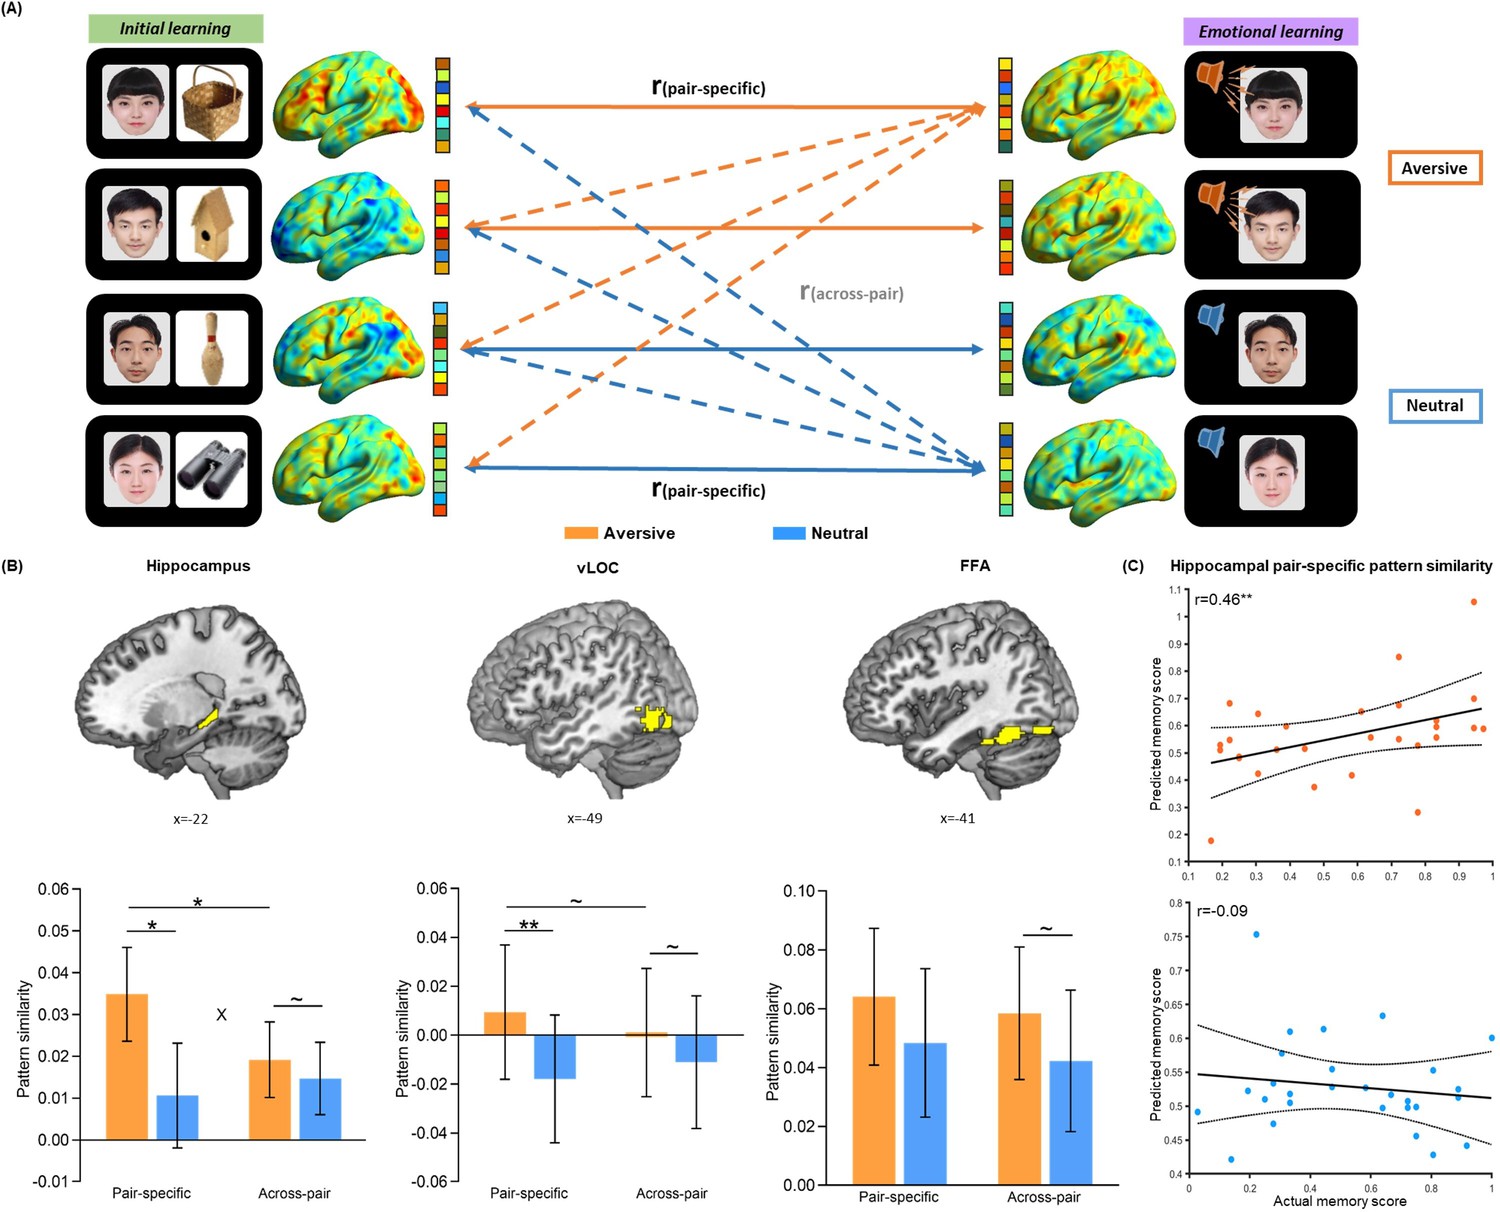
Trial-level neural reactivation of initial learning activity during emotional learning.
(A) An illustration of trial-level reactivation analysis. Example data was from one subject. During initial learning (left), sagittal views of activation maps for four trials were shown. During emotional learning (right), sagittal views of activation maps for the corresponding trials with two in aversive condition and two in neutral condition were shown. Solid lines indicate correlations for pair-specific similarity measure and dash lines indicate correlations for across-pair similarity measure. These correlations from each similarity measure were then averaged across trials for each participant in aversive and neutral conditions separately. (B) Bar graphs depict the average pair-specific and across-pair pattern similarities in aversive and neutral conditions for the bilateral hippocampus (left), bilateral ventral LOC (vLOC, middle) and bilateral FFA (right) ROIs. ‘X’ indicates a significant interaction (p<0.05). Error bars represent standard error of mean (n=28). (C) Scatter plots depict correlations of observed associative memory performance (i.e. remembered with high confidence) with predicted memory outcome from machine learning prediction analysis based on hippocampal pair-specific pattern similarity in aversive and neutral conditions. Dashed lines indicate 95% confidence intervals, and solid lines indicate the best linear fit. Dots represent data from each participant (n=28). Notes: ~p < 0.10; *p<0.05; **p<0.01; two-tailed tests.
Figure 2—figure supplement 1
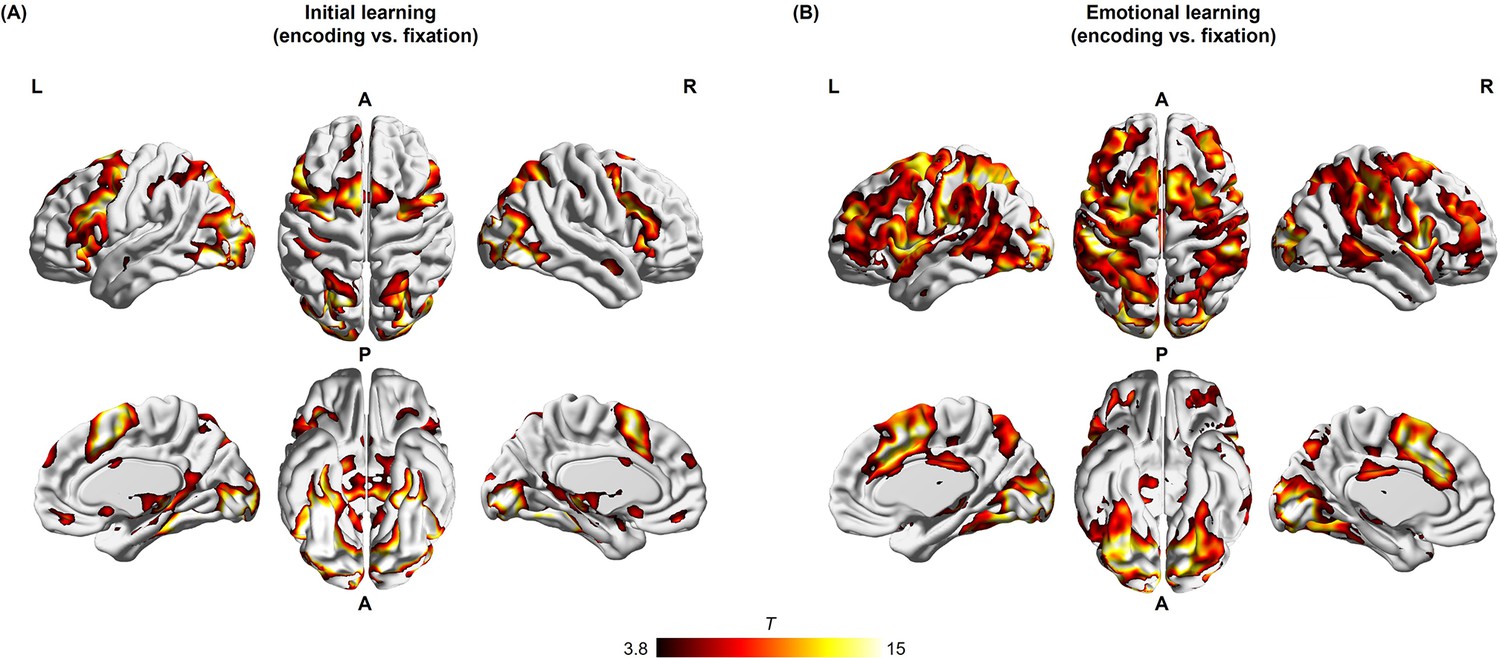
Brain systems involved in memory encoding effect during initial and emotional learning phases.
Widespread brain activation associated with an encoding effect (i.e. all encoding trials with 2 s duration from onset of each face-object/ face-voice association vs. fixation) during (A) the initial learning phase, and (B) the emotional learning phase. Significant clusters, at a height threshold of p<0.0001 and an extent threshold of p<0.05 with family-wise error correction for multiple comparisons based on nonstationary suprathreshold cluster-size distributions computed by Monte Carlo simulations, were shown. Notes: L, left; R, right; A, anterior; P, posterior. Color bar represents t values.
Figure 2—figure supplement 2
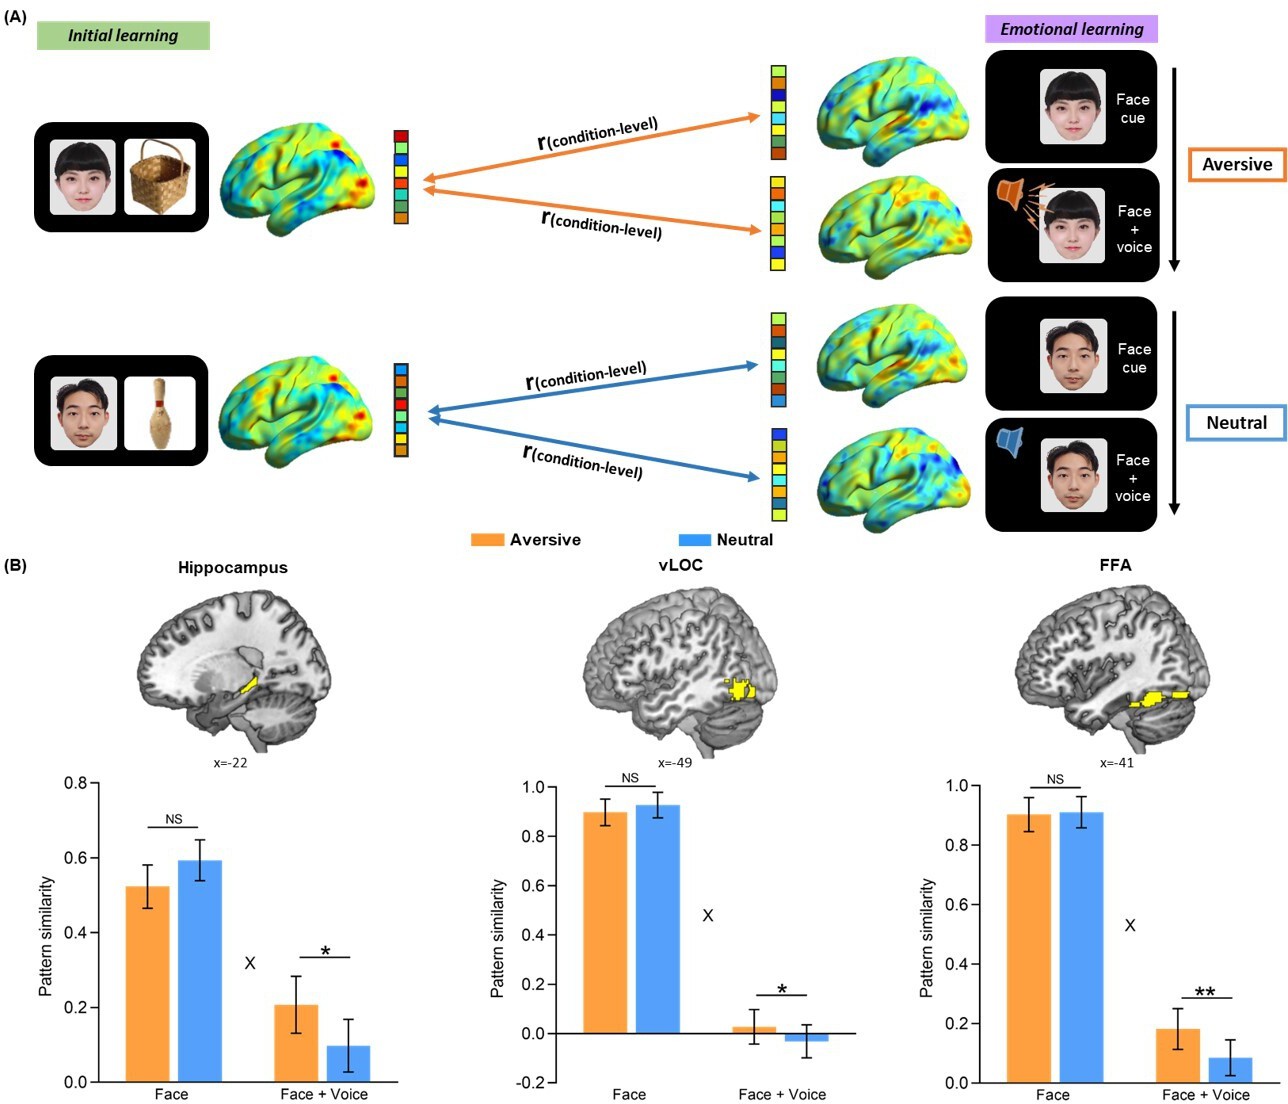
Condition-level neural reactivation of initial learning activity during emotional learning.
(A) An illustration of condition-level reactivation analysis. Example data was from one subject. (B) Bar graphs depict the average pattern similarities in aversive and neutral conditions during the presentation of face cues only (i.e. Face cue) and face-voice associations (i.e. Face +Voice) separately for the bilateral hippocampus (left), bilateral vLOC (middle) and bilateral FFA (right) (i.e. the same ROIs used in trial-level pattern similarity analysis). The similarities were entered into separate 2 (Emotion: aversive vs. neutral) by 2 (Presentation: face cue vs. face-voice association) repeated-measures ANOVAs for each ROI. These analyses revealed significant Emotion-by-Presentation interaction effects in the three ROIs (hippocampus: F(1, 27)=5.68, p=0.024, partial η2=0.17; vLOC: F(1, 27)=5.33, p=0.029, partial η2=0.17; FFA: F(1, 27)=5.61, p=0.025, partial η2=0.17). Error bars represent standard error of mean. ‘X’ indicates significant interaction (p<0.05). Notes: NS, non-significant; *p<0.05; **p<0.01; two-tailed t-tests.
Figure 2—figure supplement 3
Trial-level pattern similarity analysis approach.
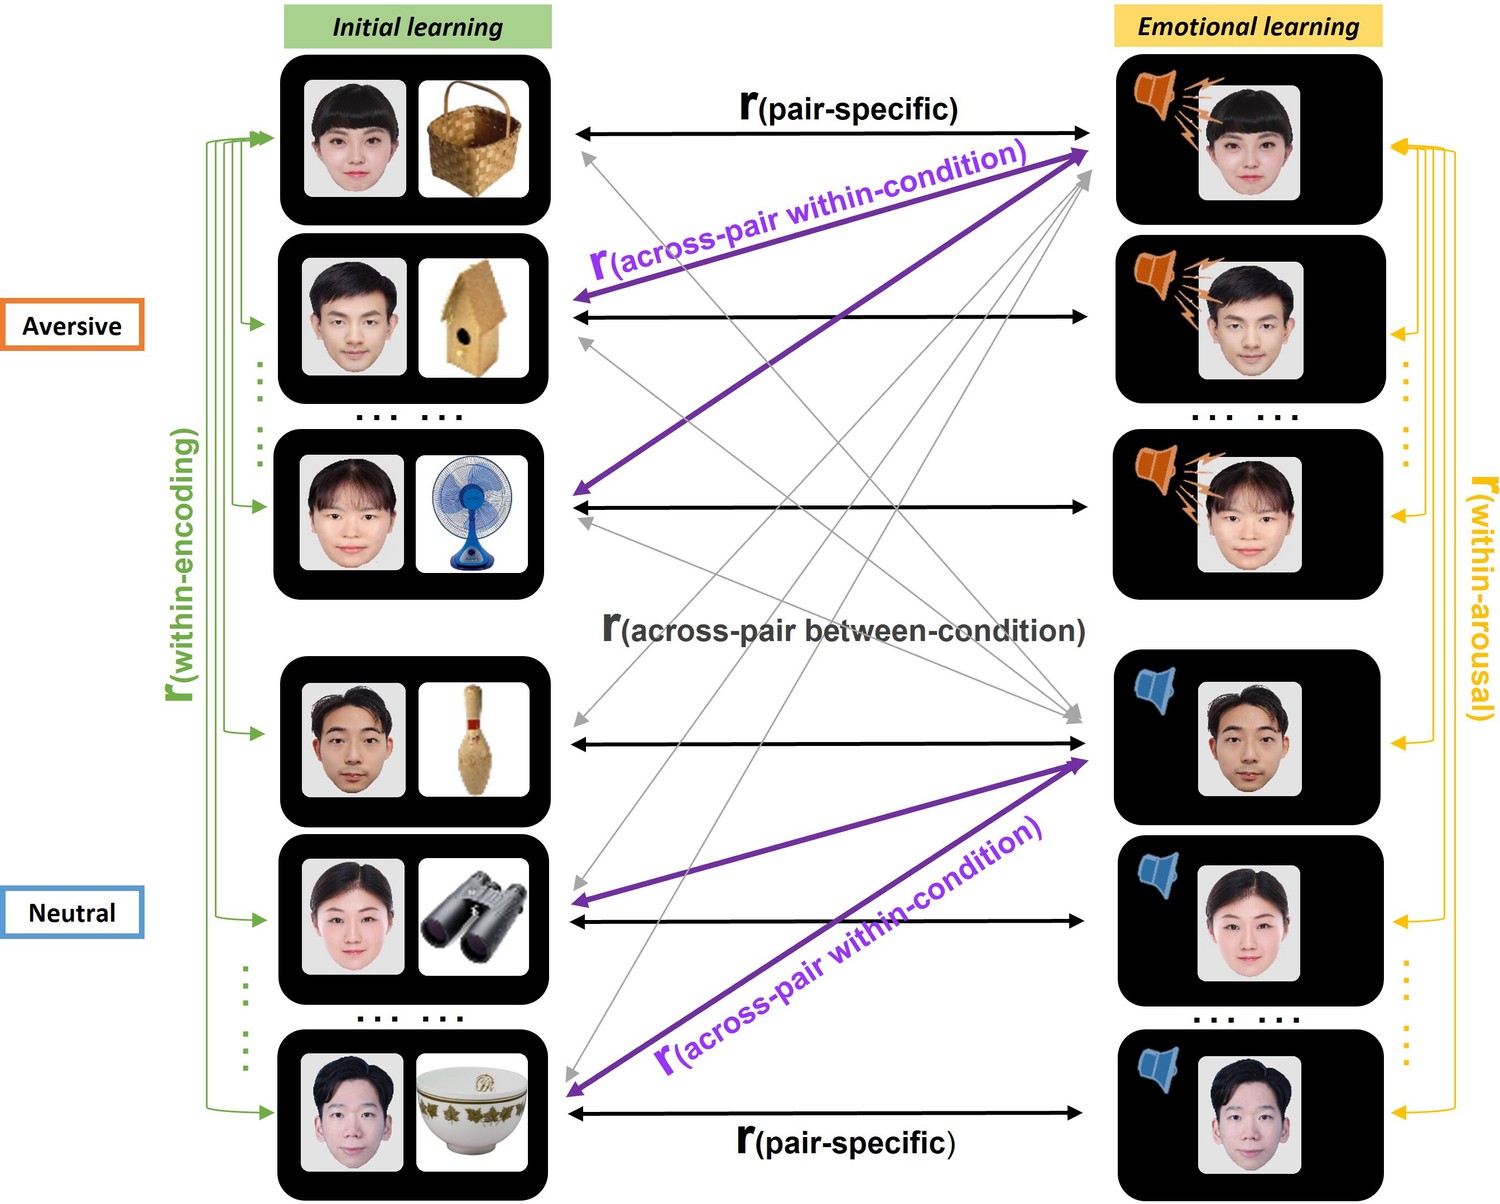
Several similarity measures were computed for each trial. (1) Pair-specific similarity (black) was computed by correlating each face-voice pair’s multivoxel activity pattern during emotional learning with its corresponding pattern of face-object pair during initial learning. (2) Across-pair within-condition similarity (purple) was computed by averaging all correlations between each face-voice pair’s pattern and the patterns of all other different face-object pairs within the same aversive (or neutral) condition. (3) Across-pair between-condition similarity (grey) was computed by averaging all correlations between each face-voice pair’s pattern and the patterns of all other different face-object pairs from the different condition. (4) Within-encoding similarity (green) was computed by averaging all correlations between each face-object pair’s pattern and the patterns of all other face-object pairs within initial learning phase. (5) Within-arousal similarity (yellow) was computed by averaging all correlations between each face-voice pair’s pattern and the patterns of all other face-voice pairs within emotional learning phase. These correlations from each similarity measure were then averaged across trials for each participant in aversive and neutral conditions separately.
Figure 2—figure supplement 4
Additional trial-level pattern similarity results.
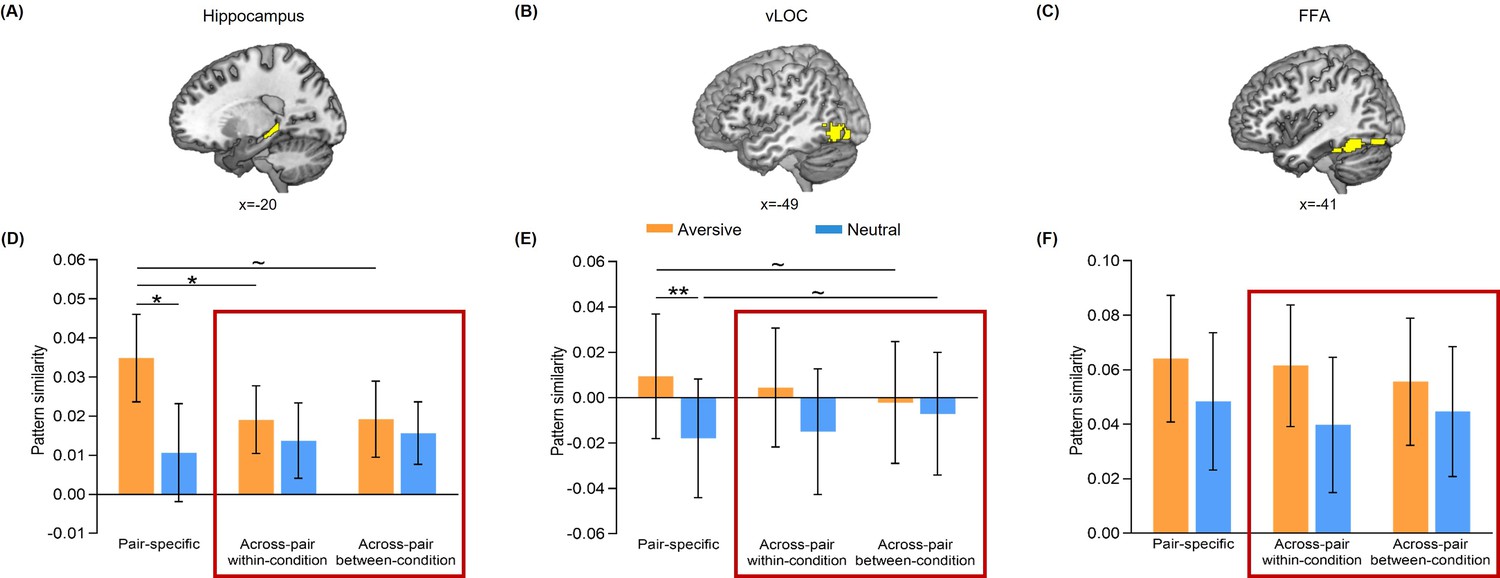
(A–C) The bilateral hippocampal, vLOC and FFA ROIs used in trial-level pattern similarity analyses. (D–F) Bar graphs depict the average pair-specific, across-pair within-condition and across-pair between-condition pattern similarities in aversive and neutral conditions for the three ROIs. We conducted separate 2 (Emotion: aversive vs. neutral) by 3 (Measure: pair-specific vs. across-pair within-condition vs. across-pair between-condition) repeated-measures ANCOVA on each ROI, with individual’s univariate activation differences (i.e. aversive vs. neutral) in both initial and emotional learning phases as two covariates of no interest. For hippocampal pattern similarity, this analysis revealed a significant main effect of Emotion (F(1, 25)=11.10, p=0.003, partial η2=0.31) and an Emotion-by-Measure interaction (F(2, 50)=3.72, p=0.031, partial η2=0.13), but no main effect of Measure (F(2, 50)=0.62, p=0.541, partial η2=0.02). For vLOC pattern similarity, it also revealed a significant main effect of Emotion (F(1, 25)=8.45, p=0.008, partial η2=0.25), but neither a main effect of Measure (F(2,50) = 0.16, p=0.849, partial η2=0.01) nor an Emotion-by-Measure interaction (F(2, 50)=1.87, p=0.165, partial η2=0.07). For FFA pattern similarity, it revealed neither main effects of Emotion (F(1, 25)=2.30, p=0.142, partial η2=0.08) and Measure (F(2,50) = 0.53, p=0.591, partial η2=0.02) nor their interaction effect (F(2, 50)=0.06, p=0.938, partial η2=0.003). Bar graphs inside the red frame depict the average across-pair within-condition and across-pair between-condition pattern similarities in aversive and neutral conditions separately for the three ROIs. To directly compare the two across-pair similarities, we further conducted separate 2 (Emotion: aversive vs. neutral) by 2 (Measure: across-pair within-condition vs. across-pair between-condition) repeated-measures ANCOVA on each ROI, with above-mentioned covariates of no interest. Error bars represent standard error of mean. Notes: ~p < 0.10; *p<0.05; **p<0.01; two-tailed tests.
Figure 2—figure supplement 5
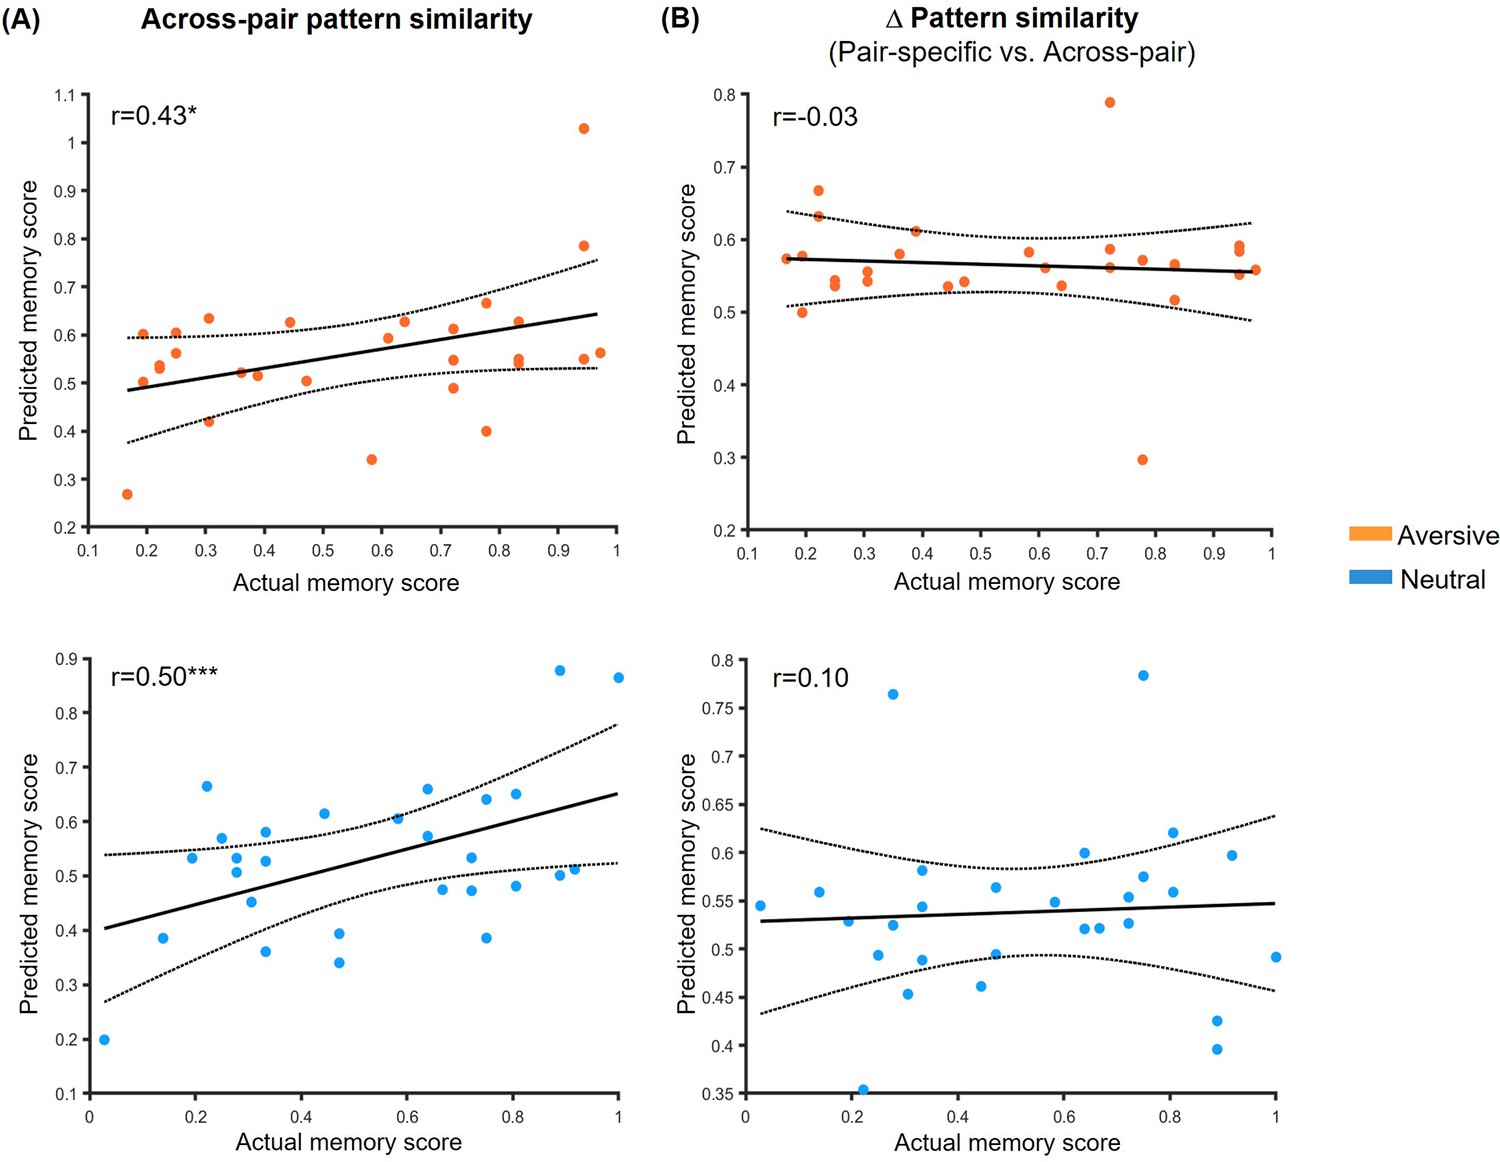
Prediction relationships between hippocampal between-phases pattern similarity and associative memory performance.
(A) Scatter plots depict correlations between observed memory performance (i.e. face-object associative memory with high confidence) and predicted outcomes from machine-learning prediction analysis based on across-pair pattern similarity in aversive and neutral conditions. (B) Correlations between observed memory performance and predicted outcomes based on pair-specific (vs. across-pair) similarity. Dashed lines indicate 95% confidence intervals, and solid lines indicate the best linear fit. Notes: *p<0.05; ***p<0.001; the p values were calculated using permutation tests (i.e. 1000 times); two-tailed tests.
Figure 2—figure supplement 6
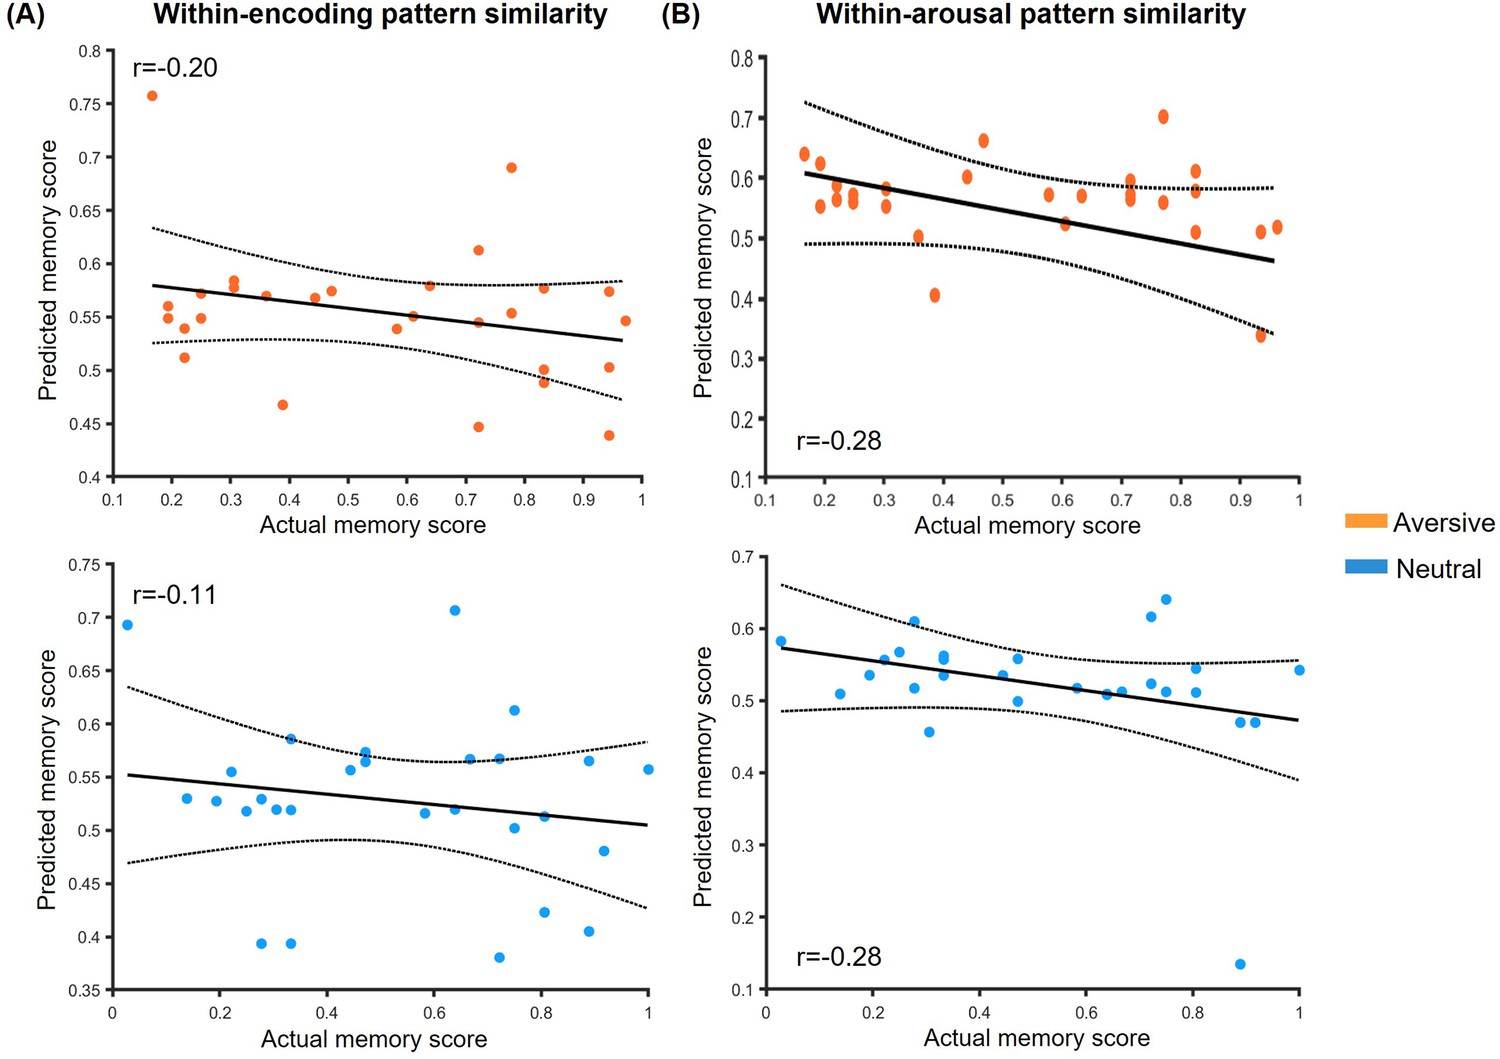
Prediction relationships between hippocampal within-phase pattern similarity and associative memory performance.
(A) Scatter plots depict correlations between observed memory performance (i.e. face-object associative memory with high confidence) and predicted outcomes from machine-learning prediction analysis based on within-encoding pattern similarity in aversive and neutral conditions. (B) Scatter plots depict correlations between observed memory performance and predicted outcomes based on within-arousal pattern similarity in aversive and neutral conditions. Dashed lines indicate 95% confidence intervals, and solid lines indicate the best linear fit. Notes: the p values were calculated using permutation tests (i.e. 1000 times); two-tailed tests.
Figure 3 with 3 supplements
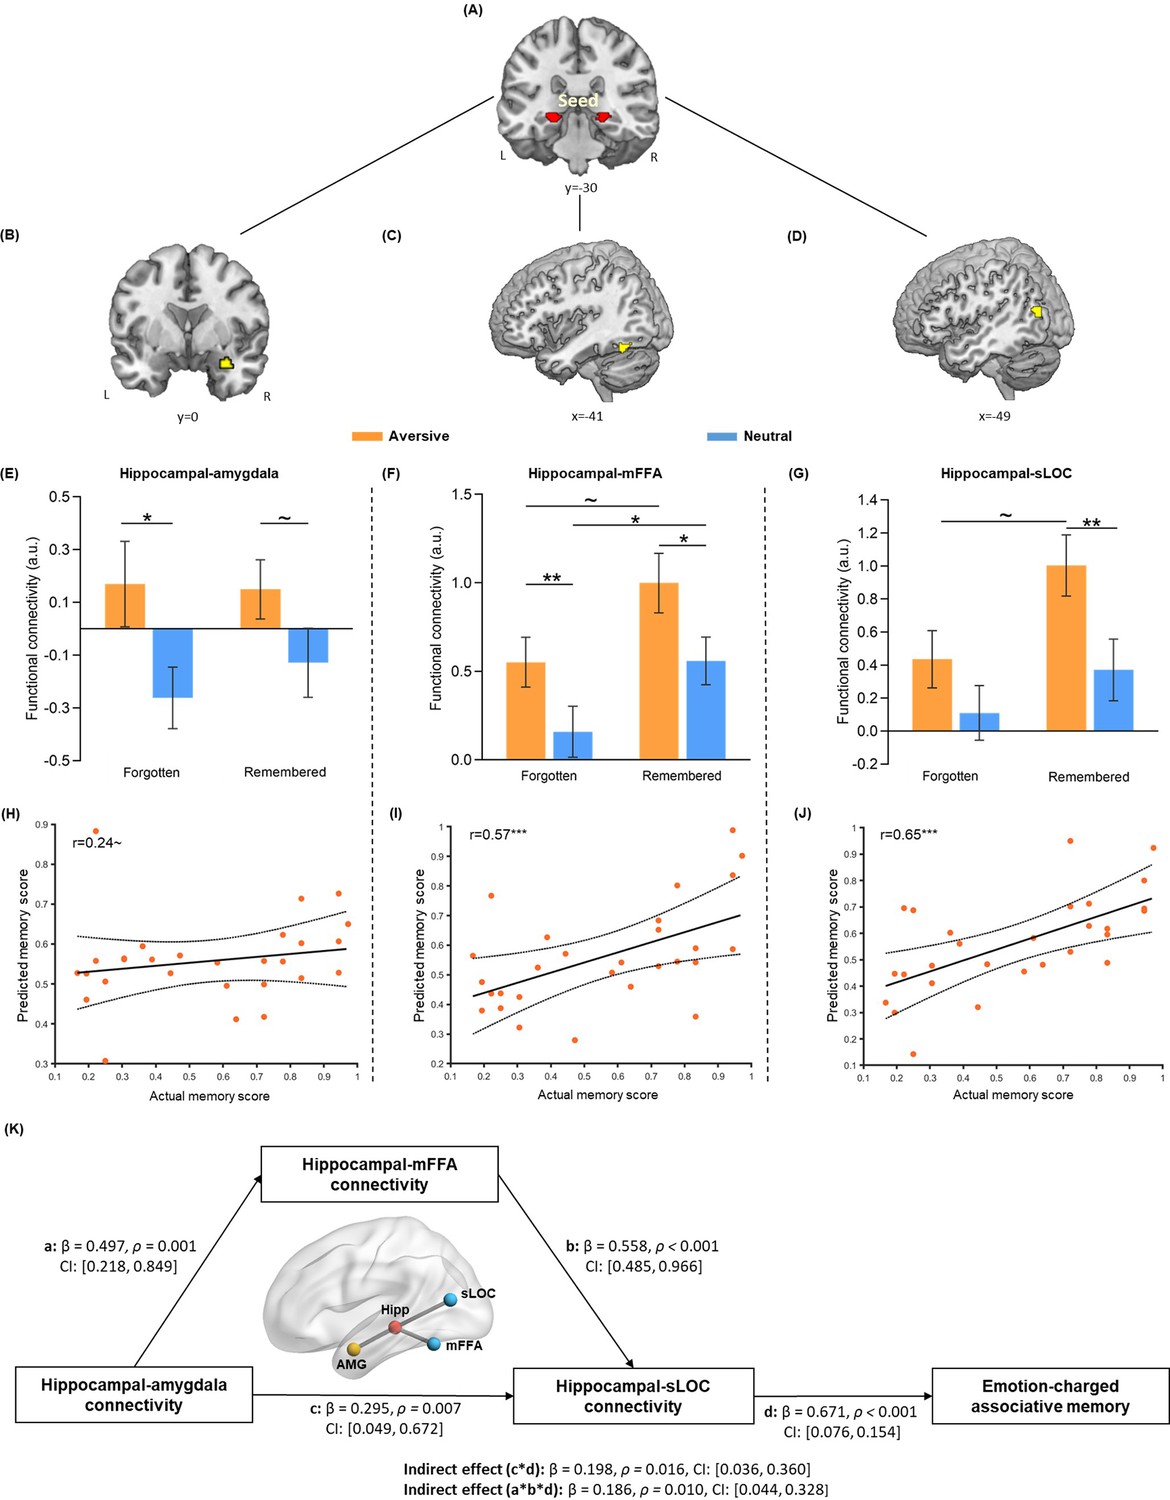
Hippocampal connectivity with the amygdala and neocortical regions during emotional learning phase accounting for emotion-charged retroactive memory enhancement.
(A) The bilateral hippocampal seed used in task-dependent gPPI functional connectivity analysis (i.e. the same hippocampal ROI used in pattern similarity analysis). (B–D) Significant clusters in the right amygdala, left middle FFA (mFFA) and left superior LOC (sLOC) regions, showing greater functional coupling with the hippocampus in the aversive (vs. neutral) condition during emotional learning (n=28). (E–G) Bar graphs depict averaged hippocampal connectivity with the amygdala, mFFA and sLOC for face-object associations remembered with high confidence and forgotten in aversive and neutral conditions separately. Error bars represent standard error of mean (n=27, one participant had no forgotten trial in the neutral condition). (H–J) Scatter plots depict correlations of observed memory performance (i.e. remembered with high confidence) with predicted memory outcome from prediction analysis based on hippocampal-amygdala, hippocampal-mFFA and hippocampal-sLOC connectivity (i.e. remembered with high confidence vs. forgotten) in the aversive condition. Dashed lines indicate 95% confidence intervals, and solid lines indicate the best linear fit. Dots represent data from each participant (n=28). (K) The mediating effect of hippocampal-mFFA/sLOC connectivity on the positive association between hippocampal-amygdala connectivity and emotion-charged associative memory (n=28). Paths are marked with standardized coefficients. Solid lines indicate significant paths. Notes: ~p < 0.08; *p<0.05; **p<0.01; ***p<0.001; two-tailed tests.
Figure 3—figure supplement 1
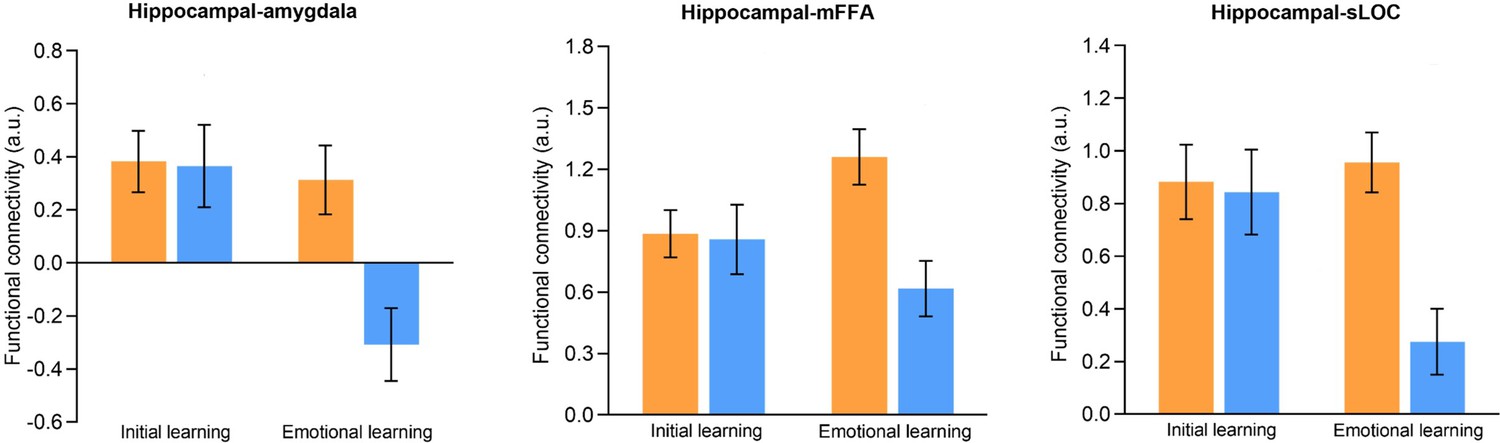
Hippocampal connectivity in aversive and neutral conditions during initial and emotional learning phases.
Bar graphs depict averaged hippocampal connectivity with the right amygdala, left mFFA and left sLOC in aversive and neutral conditions during initial and emotional learning phases separately. Error bars represent standard error of mean.
Figure 3—figure supplement 2
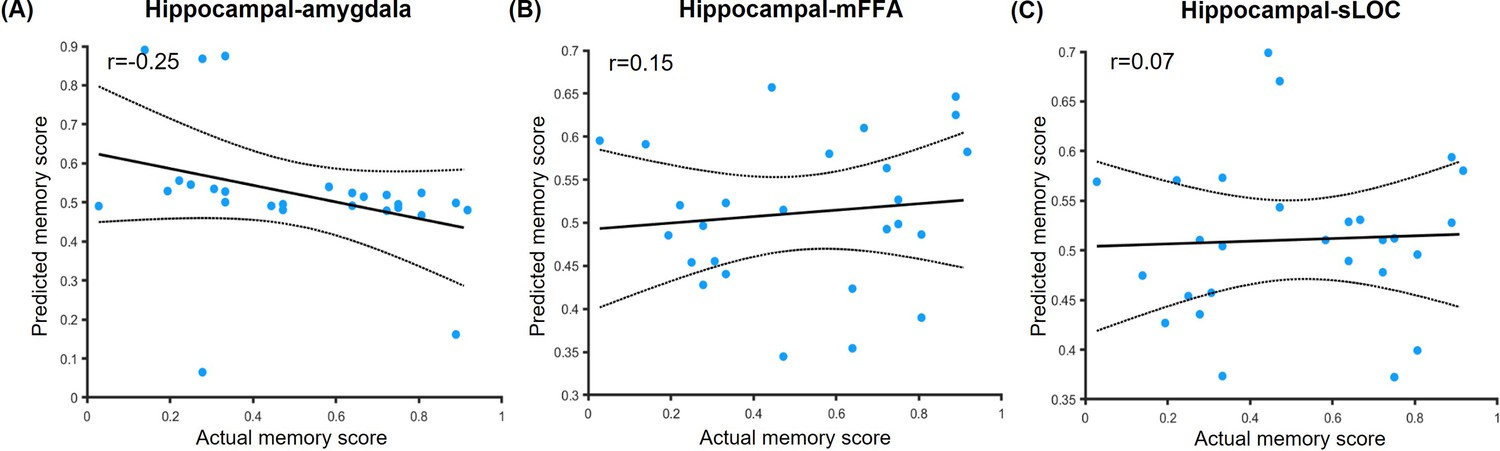
Prediction relationships between hippocampal connectivity and associative memory performance in the neutral condition.
Scatter plots depict correlations of observed associative memory performance (i.e. remembered with high confidence) with predicted outcomes from prediction analysis based on (A) hippocampal-amygdala connectivity (i.e. remembered with high confidence vs. forgotten), (B) hippocampal-mFFA connectivity and (C) hippocampal-sLOC connectivity in the neutral condition. Dashed lines indicate 95% confidence intervals, and solid lines indicate the best linear fit. Dots represent data from each participant (n=27, one participant had no forgotten trial in the neutral condition). Notes: the p values were calculated using permutation tests (i.e. 1000 times); two-tailed tests.
Figure 3—figure supplement 3

Alternative models for the relationships among hippocampal connectivity and associative memory in the aversive condition.
(A) Model 1 with hippocampal-mFFA and -sLOC connectivity as separate mediators showed no any reliable mediating effect, including (i) indirect effect (c*d): β=0.153, p=0.138, 95% CI: [–0.049, 0.356], (ii) indirect effect (a*e): β=0.133, p=0.247, 95% CI: [–0.092, 0.358], (iii) indirect effect (a*b*c): β=0.144, p=0.116, 95% CI: [–0.035, 0.324]. (B) Model 2 with hippocampal-sLOC and -mFFA connectivity as separate mediators showed no any reliable mediating effect, including (i) indirect effect (c*d): β=0.037, p=0.542, 95% CI: [–0.082, 0.157], (ii) indirect effect (a*e): β=0.298, p=0.078, 95% CI: [–0.034, 0.629], (iii) indirect effect (a*b*c): β=0.096, p=0.298, 95% CI: [–0.084, 0.276]. (C) Model 3 with hippocampal-amygdala connectivity as a mediator showed no any reliable mediating effect, including (i) indirect effect (c*d): β=–0.012, p=0.866, 95% CI: [–0.153, 0.128], (ii) indirect effect (a*e): β=0.366, p=0.069, 95% CI: [–0.029, 0.761], (iii) indirect effect (a*b*c): β=–0.020, p=0.836, 95% CI: [–0.212, 0.171]. (D) Model 4 with hippocampal-amygdala connectivity as a moderator did not show significant moderating effect (β=0.047, p=0.818, 95% CI: [–0.056, 0.058]). Paths are marked with standardized coefficients. Significant paths in the model are shown as solid lines, whereas non-significant paths are shown as dashed lines. Notes: two-tailed tests.
Figure 4 with 1 supplement
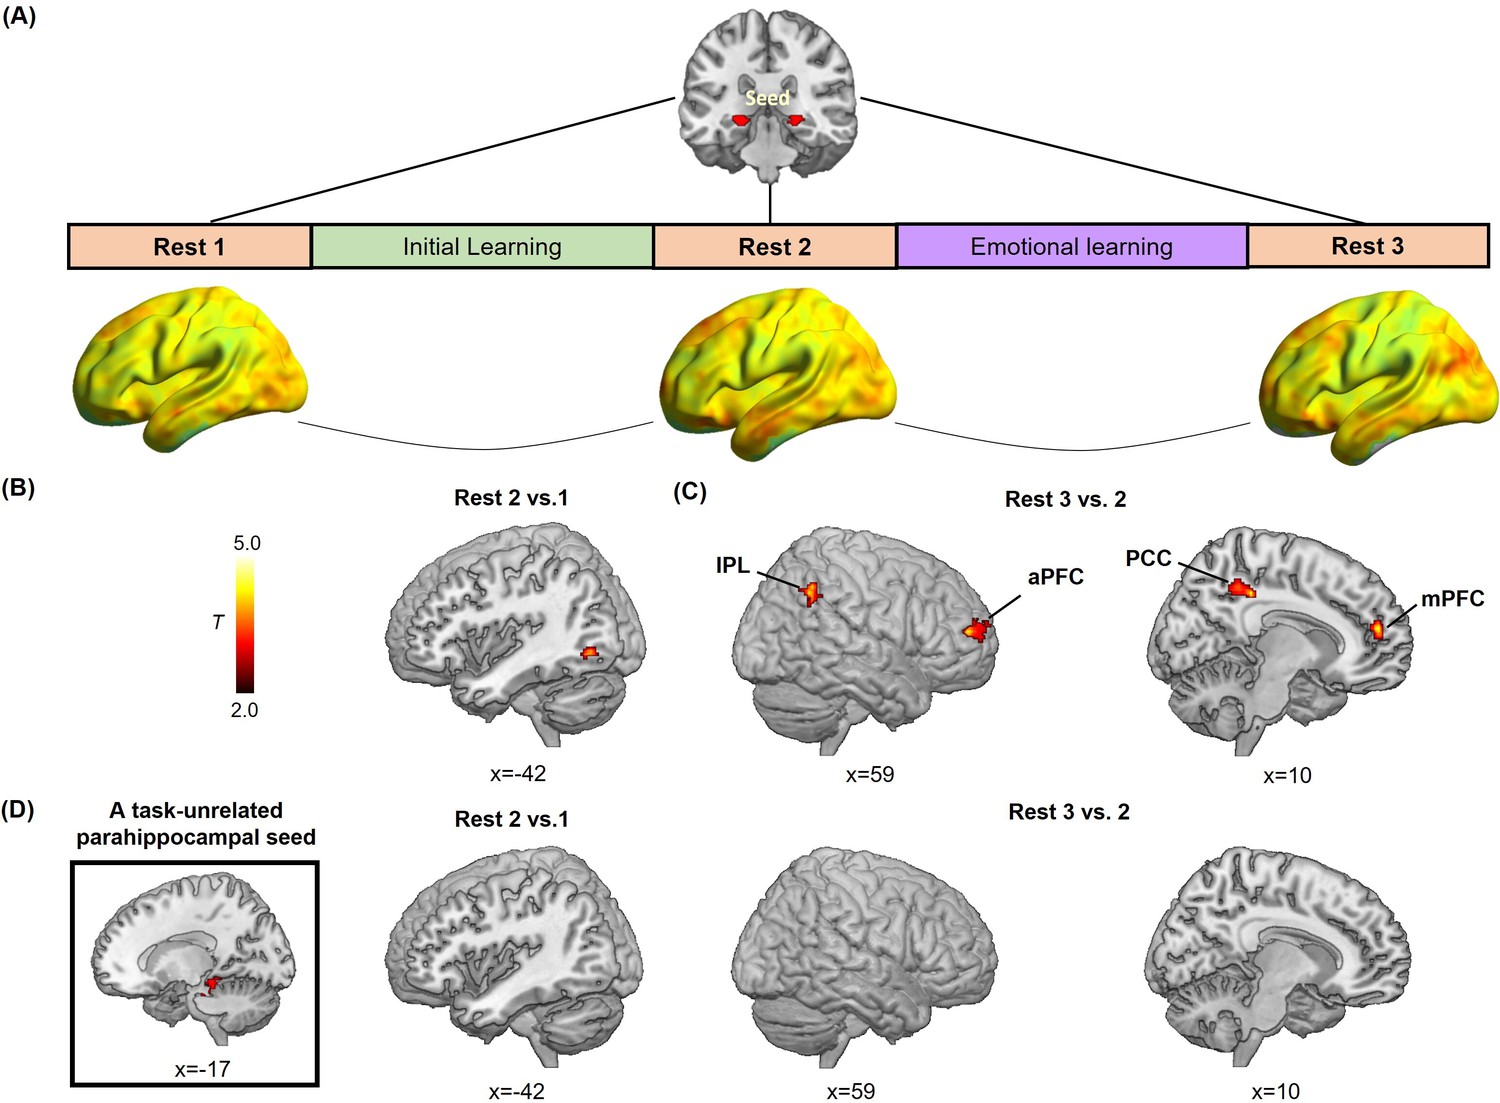
Hippocampal- and parahippocampal-neocortical connectivity at post-learning rests in relation to emotion-charged retroactive memory enhancement.
(A) An illustration of hippocampal-seeded functional connectivity analyses, and sagittal views of hippocampal connectivity maps at the group level for three rest scans (n=27, data from one participant during Rest 2 was incomplete due to hardware malfunction). (B) Significant cluster in the left inferior LOC (iLOC), showing its greater connectivity with the hippocampus at Rest 2 (vs. Rest 1) in positive relation to memory in the aversive but not neutral condition. The iLOC ROI was constrained by the LOC mask, same with pattern similarity analysis. (C) Significant clusters in the bilateral inferior parietal lobule (IPL), the right anterior prefrontal cortex (aPFC), the right posterior cingulate cortex (PCC) and the right medial prefrontal cortex (mPFC), showing their greater connectivity with the hippocampus at Rest 3 (vs. Rest 2) in positive relation to memory in the aversive but not neutral condition. (D) A task-unrelated parahippocampal seed used in parallel control connectivity analyses (n=27), showing no reliable cluster under above-mentioned contrasts. Notes: Color bar represents T values.
Figure 4—figure supplement 1
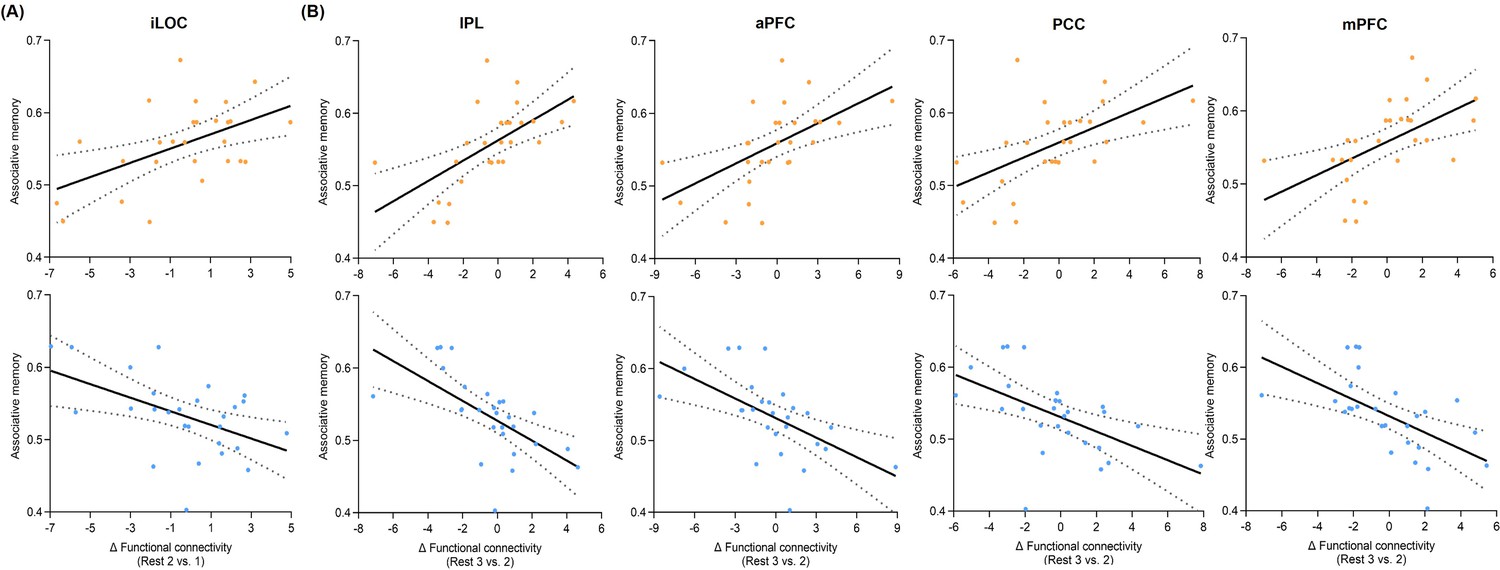
Post-encoding hippocampal connectivity changes in relation to memory performances in aversive and neutral conditions.
Scatter plots depict partial correlations of (A) hippocampal-iLOC and (B) hippocampal-IPL/aPFC/PCC/mPFC connectivity changes with memory in the aversive condition controlling for neutral memory (upper, orange), and partial correlations of these hippocampal connectivity changes with memory in the neutral condition controlling for aversive memory (lower, blue). All memory performances used here are memory accuracies with high confidence. Dashed lines indicate 95% confidence intervals, and solid lines indicate the best linear fit. Dots represent data from each participant (n=27).
Author response image 1

Post-encoding hippocampal connectivity changes in relation to memory difference (i.e., aversive vs. neutral).
(A) Significant cluster in the lateral occipital cortex (LOC), showing its greater connectivity with the hippocampus at Rest 2 (vs. Rest 1) in positive relation to the memory difference. (B) Significant clusters in the right anterior prefrontal cortex (aPFC), the bilateral inferior parietal lobule (IPL) extending into angular gyrus and the right posterior cingulate cortex (PCC), showing their greater connectivity with the hippocampus at Rest 3 (vs. Rest 2) in positive relation to the memory difference. Notes: Color bars represent T values; two-tailed tests.
Author response image 2
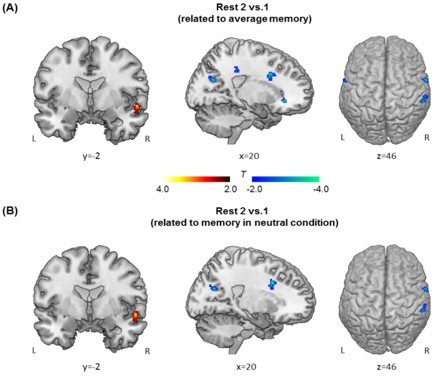
Hippocampal connectivity changes from baseline rest (Rest 1) to post-initial-learning rest (Rest 2) in relation with general/non-arousal memory performance.
(A) Significant clusters show their greater connectivity with the hippocampus at Rest 2 relative to Rest 1, with average memory across aversive and neutral conditions as the covariate of interest. (B) Significant clusters show their greater connectivity with the hippocampus at Rest 2 relative to Rest 1, with memory in neutral condition as the covariate of interest. Notes: Color bars represent T values; L, left; R, right.
Author response image 3
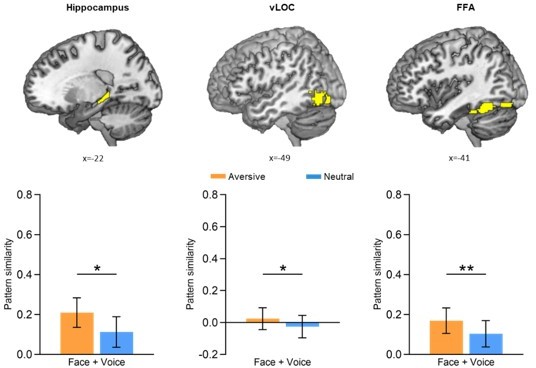
Additional condition-level pattern similarity results.
Bar graphs depict the average pattern similarities in aversive and neutral conditions during the presentations of face-voice associations (i.e., Face + Voice) separately for the bilateral hippocampus, bilateral ventral LOC (vLOC) and bilateral FFA. Error bars represent standard error of mean. Notes: *p < 0.05; **p < 0.01; two-tailed t-tests.
Tables
Author response table 1
Post-encoding PPA connectivity changes in negative relation to memory in the aversive but not neutral condition.
| Brain Regions | Hemisphere | T values | MNI Coordinates | ||
| X | Y | Z | |||
| Rest 2 vs. Rest 1 | |||||
| Angular | R | -4.74 | 44 | -58 | 40 |
| Precuneus | R | -7.12 | 10 | -52 | 28 |
| Rest 3 vs. Rest 2 | |||||
| Superior frontal gyrus | L | -4.93 | -20 | -4 | 74 |
| Inferior frontal gyrus | L | -5.38 | -36 | 30 | 14 |
| Inferior Parietal Lobule | L | -4.61 | -40 | -50 | 58 |
| Supramarginal gyrus | L | -4.83 | -52 | -30 | 28 |
| Precentral gyrus | L | -8.48 | -50 | 0 | 6 |
| L | -4.62 | -34 | -2 | 62 | |
| Lingual gyrus | L | -5.17 | -12 | -90 | -8 |
Author response table 2
Hippocampal connectivity changes at post-initial-learning rest (Rest 2 vs.1).
| Brain Regions | Hemisphere | T values | MNI Coordinates | ||
| X | Y | Z | |||
| Related to average memory | |||||
| Superior temporal gyrus | R | 3.69 | 54 | 0 | -6 |
| Superior temporal pole | R | 3.99 | 54 | 16 | -20 |
| Insula | L | -3.62 | -38 | 14 | 10 |
| Cuneus | R | -3.84 | 20 | -66 | 24 |
| Supramarginal gyrus | R | -3.46 | 58 | -32 | 36 |
| Postcentral gyrus | L | -3.65 | -54 | -8 | 22 |
| R | -3.76 | 64 | 0 | 20 | |
| Related to memory in the neutral condition | |||||
| Superior temporal gyrus | R | 3.87 | 54 | 0 | -6 |
| Thalamus | R | 3.56 | 20 | -16 | 6 |
| Postcentral gyrus | R | -3.57 | 64 | 0 | 20 |
| Cuneus | R | -3.57 | 20 | -66 | 24 |
| Supramarginal gyrus | R | -3.36 | 58 | -32 | 36 |
Author response table 3
A set of fMRI studies with moderate sample size (N = 16 to 35).
| Author | Journal | Year | Sample Size (effective) | Main conclusion | Correlations(including mediating effects) | |
|---|---|---|---|---|---|---|
| 1 | Günseli, Aly | eLife | 2020 | N=29 | Hippocampus and vmPFC support memory-guided attention. | Correlation between vmPFC activity and hippocampal activity by skipped_pearson_correlation.m function (Figure 3B). |
| 2 | Keogh, Bergmann, Pearson | eLife | 2020 | N=32 | Cortical excitability is linked to individual differences in the strength of mental imagery. | Spearman rank correlations between cortical excitability and imagery strength (Figure 3 and also see Study design in Materials and methods). |
| 3 | Liu et al. | Nature Communication | 2016 | N=18 | Consolidation reconfigures neural pathways underlying the suppression of emotional memories. | Correlations between hippocampal functional connectivity/ pattern dissimilarity and behavioral suppression score by prediction analyses (Figure 4 and 6). |
| 4 | Gruber et al. | Neuron | 2016 | N=19 | Post-learning hippocampal dynamics predict reward-related memory advantages. | Pearson’s correlations between hippocampal functional connectivity/ reactivation and memory benefits (Figure 2B and 3C). |
| 5 | Schlichting, Preston | PNAs | 2014 | N=35 | Memory reactivation and hippocampal–neocortical functional connectivity during rest support subsequent learning. | Partial correlations between FFA reactivation/FFA-HPC connectivity and memory performance (Figure 2 and 3). |
| 6 | Wimmer, Shohamy | Science | 2012 | N=28 | Hippocampal activation, reactivation, and coupling predict decision bias. | Mediating effects of visual reactivation on the relationship between hippocampal activity and striatum activity. |
| 7 | Tambini, Ketz, Davachi | Neuron | 2010 | N=16 | Offline hippocampal-cortical interactions relate to subsequent associative memory. | Pearson’s correlations between offline hippocampal−LO correlations and associative memory (Figure 3D). |
Author response table 4
Statistical power for each significant correlation in main results (two-tailed tests).
| Correlations | Sample Size(n) | Significance Criterion(α) | Effect size(r) | Power(1-β) | |
|---|---|---|---|---|---|
| Pattern similarity | Correlation between pair-specific pattern similarity and associative memory in aversive condition (Figure 3C) | 28 | 0.05 | 0.46 | 0.72 |
| Task-dependent functional connectivity | Correlation between hippocampal-FFA connectivity and associative memory in aversive condition (Figure 5E) | 0.57 | 0.91 | ||
| Correlation between hippocampal-LOC connectivity and associative memory in aversive condition (Figure 5F) | 0.65 | 0.98 |
Additional files
-
Supplementary file 1
Acoustic characteristics of the four voice clips.
- https://cdn.elifesciences.org/articles/60190/elife-60190-supp1-v3.docx
-
Supplementary file 2
Brain regions involved in emotional effect on condition-level reactivation.
- https://cdn.elifesciences.org/articles/60190/elife-60190-supp2-v3.docx
-
Supplementary file 3
Brain regions involved in emotional effect on hippocampal connectivity during emotional learning.
- https://cdn.elifesciences.org/articles/60190/elife-60190-supp3-v3.docx
-
Supplementary file 4
Post-encoding hippocampal connectivity changes in positive relation to memory in the aversive condition but negative in the neutral condition.
- https://cdn.elifesciences.org/articles/60190/elife-60190-supp4-v3.docx
-
MDAR checklist
- https://cdn.elifesciences.org/articles/60190/elife-60190-mdarchecklist1-v3.docx
Download links
A two-part list of links to download the article, or parts of the article, in various formats.
Downloads (link to download the article as PDF)
Open citations (links to open the citations from this article in various online reference manager services)
Cite this article (links to download the citations from this article in formats compatible with various reference manager tools)
Emotional learning retroactively promotes memory integration through rapid neural reactivation and reorganization
eLife 11:e60190.
https://doi.org/10.7554/eLife.60190


