MYC regulates ribosome biogenesis and mitochondrial gene expression programs through its interaction with host cell factor–1
- Department of Cell and Developmental Biology, Vanderbilt University School of Medicine, United States
- Department of Biostatistics, Vanderbilt University Medical Center, United States
- Center for Quantitative Sciences, Vanderbilt University Medical Center, United States
- Department of Cancer Biology, Thomas Jefferson University, United States
- Center for Innovative Technology (CIT), Vanderbilt University, United States
- Department of Chemistry, Vanderbilt University, United States
- Department of Oncology, Mayo Clinic, United States
- Department of Biochemistry, Vanderbilt University School of Medicine, United States
Figures
Figure 1 with 2 supplements
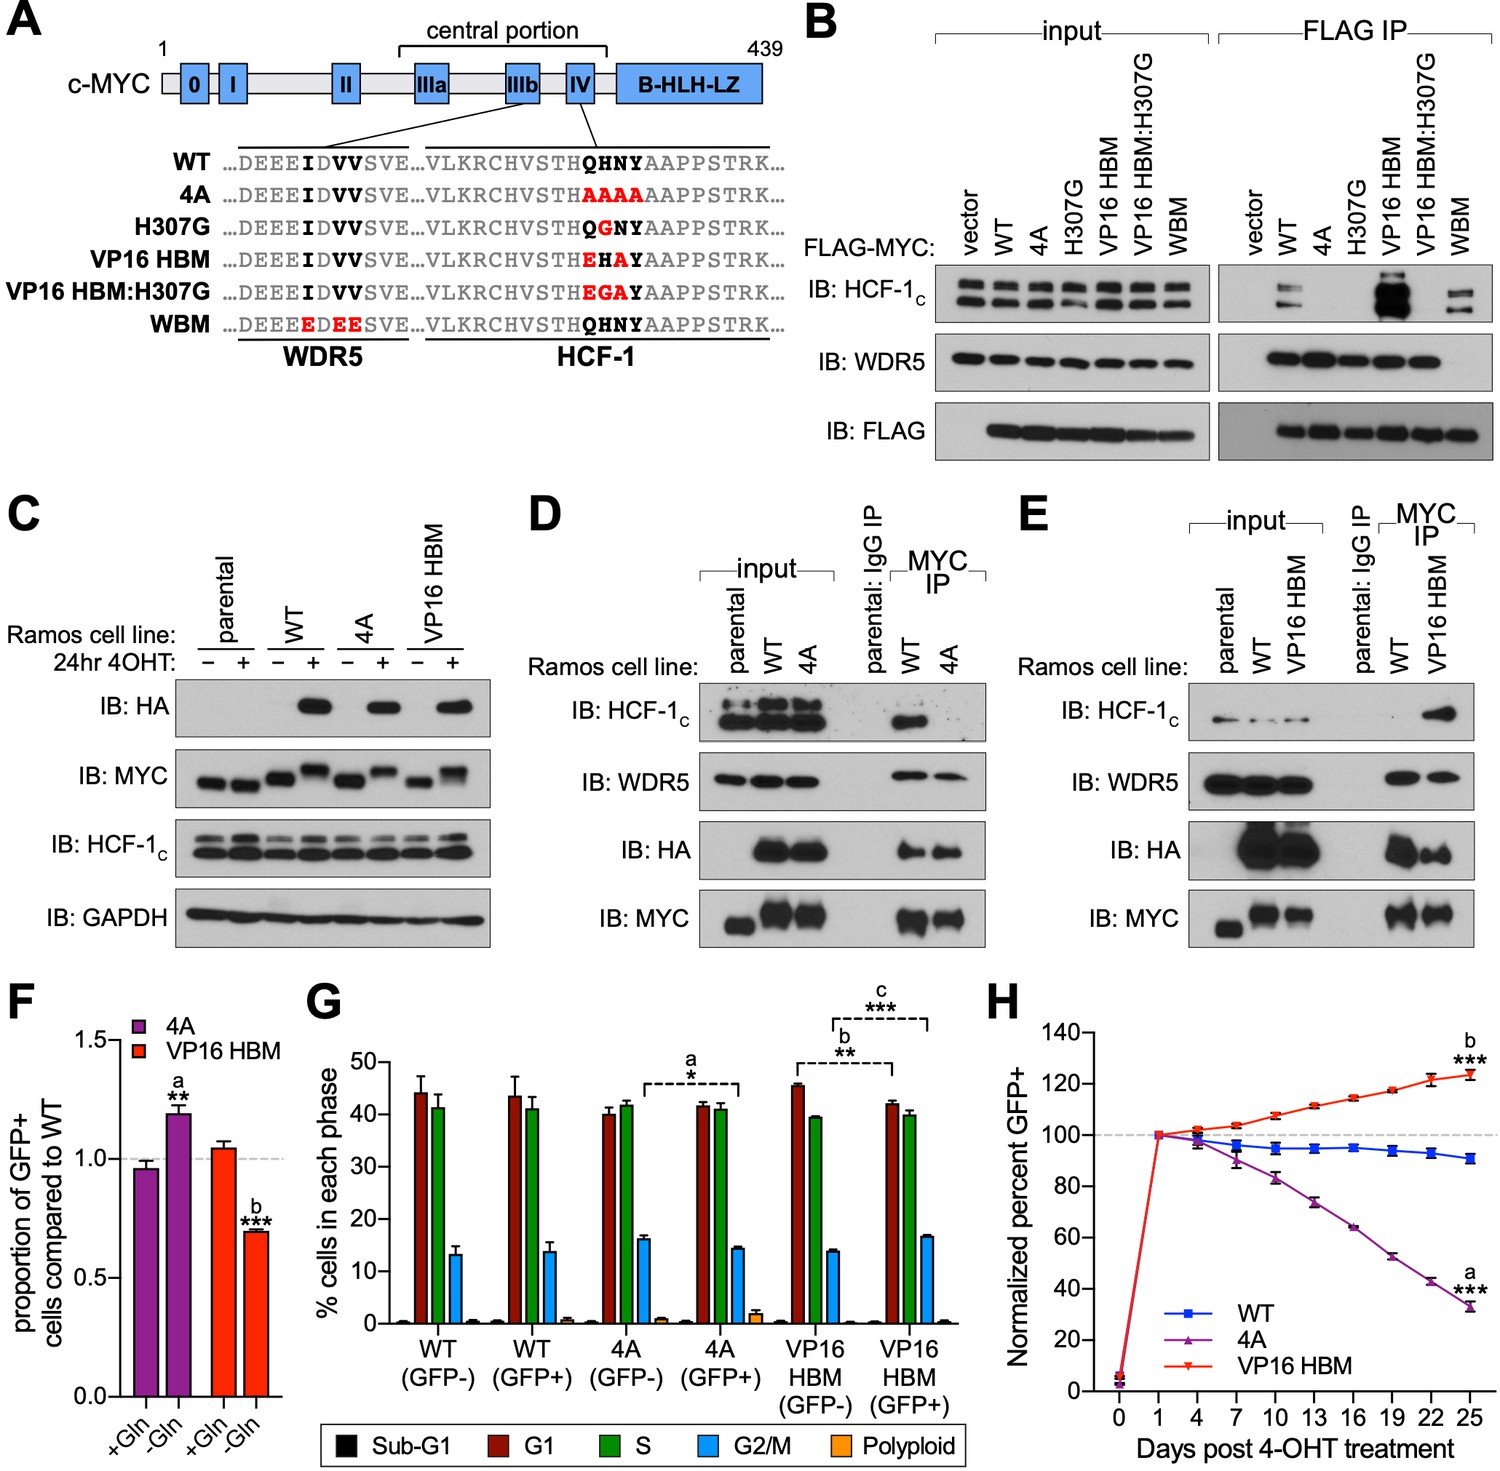
A gain- and loss-of-function system to study the MYC–host cell factor (HCF)–1 interaction.
(A) Schematic of MYC, depicting the location of the six MYC boxes (Mb0–MbIV). MbIIIb carries a WDR5-binding motif (WBM). MbIV contains an HCF-1-binding motif (HBM). Residues relevant to the WBM or HBM are in bold, and residues mutated in this study are in red. (B) FLAG-tagged full-length MYC proteins carrying the mutations described in (A) were transiently expressed in 293T cells, recovered by anti-FLAG immunoprecipitation (IP), and the input, or IP eluates, probed for the presence of HCF-1C, WDR5, or FLAG-tagged proteins by western blotting. (C) Western blot of lysates from parental (CRE-ERT2) or switchable Ramos cells (wild-type [WT], 4A, or VP16 HBM) ±20 nM 4-OHT for 24 hr. Blots were probed with antibodies against the HA tag, MYC, HCF-1C, and GAPDH. (D and E) Parental or switchable Ramos cells (WT, 4A, or VP16 HBM) were treated with 20 nM 4-OHT for 24 hr, lysates prepared, and IP performed using anti-IgG or anti-MYC antibodies. Input lysates and IP eluates were probed using antibodies against HCF-1C, WDR5, HA tag, and MYC by western blotting. All lines in these experiments express CRE-ERT2. (F) Switchable Ramos cell lines were pulsed with 20 nM 4-OHT for 2 hr to switch ~50% of cells, propagated for 3 days, and grown for 16 hr in media with or without glutamine. The impact of glutamine deprivation was measured by flow cytometry to determine the proportion of green fluorescent protein (GFP)-positive (switched) cells. For each of the mutants, the proportion of GFP-positive cells was normalized to that for WT cells. Shown are the mean and standard error for three biological replicates. Student’s t-test between +Gln and −Gln was used to calculate p-values; a = 0.0066, b = 0.0002. (G) Switchable Ramos cells were pulsed with 4-OHT as in (F), grown for 7 days, and cell cycle distribution determined by propidium iodide (PI) staining and flow cytometry, binning cells according to whether they expressed GFP (GFP+, switched) or not (GFP−, unswitched). Shown are the mean and standard error for three biological replicates. Student’s t-test between GFP− and GFP+ cells was used to calculate p-values; a = 0.033, b = 0.0041, c = 0.0006. (H) Switchable Ramos cells were pulsed with 4-OHT as in (F), and the proportion of GFP-positive cells measured by flow cytometry 24 hr after treatment and every 3 days following. For each of the replicates, the proportion of GFP-positive cells is normalized to that on day 1. Shown are the mean and standard error for three biological replicates. Student’s t-test between WT and each of the mutants at day 25 was used to calculate p-values; a = 0.000028, b = 0.00026.
-
Figure 1—source data 1
Raw data for MYC mutant growth curves.
- https://cdn.elifesciences.org/articles/60191/elife-60191-fig1-data1-v1.xlsx
Figure 1—figure supplement 1
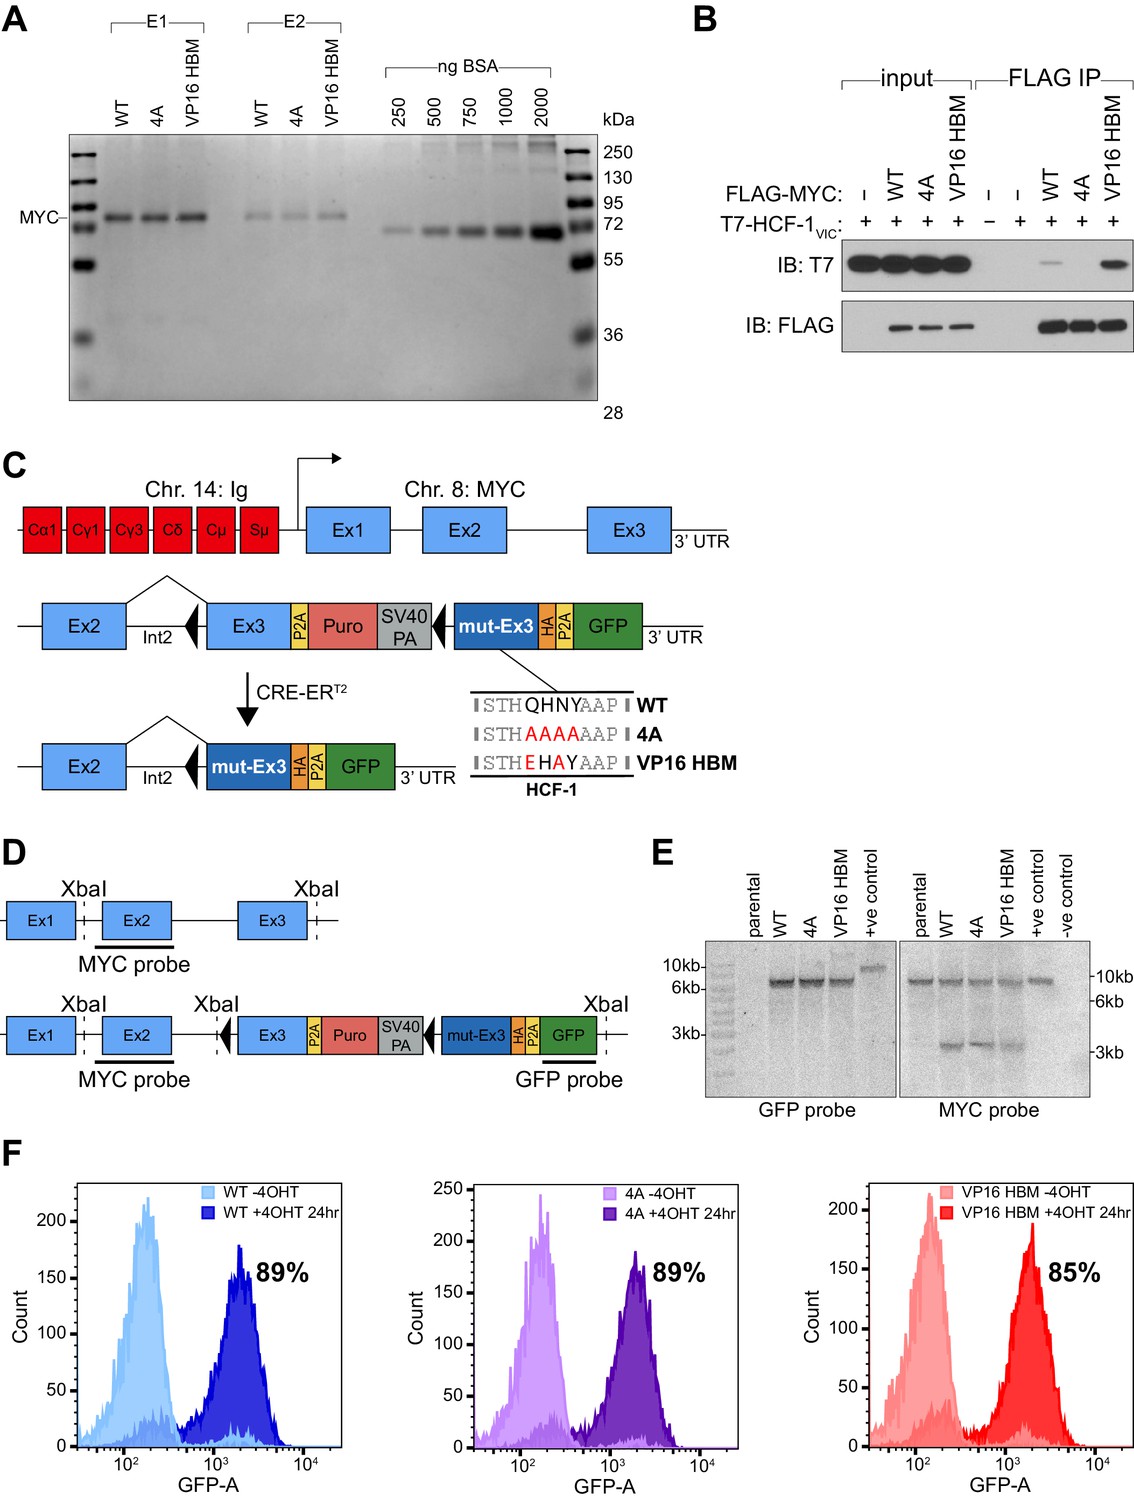
Validation of MYC mutants and switchable Ramos cell lines.
(A) Recombinant FLAG-tagged MYC was purified from E. coli (Rosetta) cells by nickel affinity chromatography. Shown are proteins from two sequential elutions with imidazole-containing buffer (E1 and E2), which were resolved by SDS-PAGE alongside a bovine serum albumin (BSA) standard and detected by Coomassie staining. (B) In vitro transcribed/translated T7-tagged host cell factor (HCF)–1VIC was incubated with recombinant FLAG-tagged MYC, either wild-type (WT) or mutant (4A or VP16 HCF-1-binding motif [HBM]), and IP performed using anti-FLAG M2 agarose. Western blot of the input lysate, and the IP eluate, was probed using antibodies against the T7 and FLAG tags. (C) The translocated MYC locus from Ramos cells is depicted at top, with chromosome 14 (red) and 8 (blue) elements indicated. Beneath is a representation of the locus modification, in either the unswitched (middle) or switched (bottom) states. This switchable allele contains a WT exon 3, a P2A-linked puromycin cassette, and a SV40 polyadenylation (SV40 PA) signal, all of which are flanked by LoxP sites (black triangles). Downstream of the LoxP-flanked region is an HA-tagged mutant exon 3 (mut-Ex3) and a P2A-linked green fluorescent protein (GFP) cassette, with the endogenous 3’ untranslated region (UTR) intact. Activation of CRE-ERT2 results in excision of WT exon 3 and its replacement with mutant exon 3 which carries sequences encoding either WT or mutant (4A or VP16 HBM) MYC protein. (D) Comparison of the structure of the parental (non-modified) MYC allele (top) compared to the switchable MYC allele (bottom). XbaI sites used for digestion of genomic DNA in Southern blot are highlighted, as are the complementary sites for the MYC and GFP probes. The expected products of XbaI digestion for the parental line are 6784 bp for the MYC probe (which detects both the translocated and non-translocated alleles) and nothing for the GFP probe; for correctly engineered lines the expected sizes are 6784 bp and 2942 bp for the MYC probe, and 6624 bp for the GFP probe. (E) Southern blot using GFP and MYC probes on XbaI-digested gDNA from unswitched parental or switchable cells (WT, 4A, and VP16 HBM), with digested positive and negative control plasmids. (F) Switchable cells were treated with or without 20 nM 4-OHT (24 hr), fixed using 1% formaldehyde, and subject to flow cytometry. The GFP profiles of the −4-OHT and +4-OHT cells are shown overlaid onto the same axes, with the approximate percentage of GFP-positive cells for 24 hr +4-OHT shown.
Figure 1—figure supplement 2
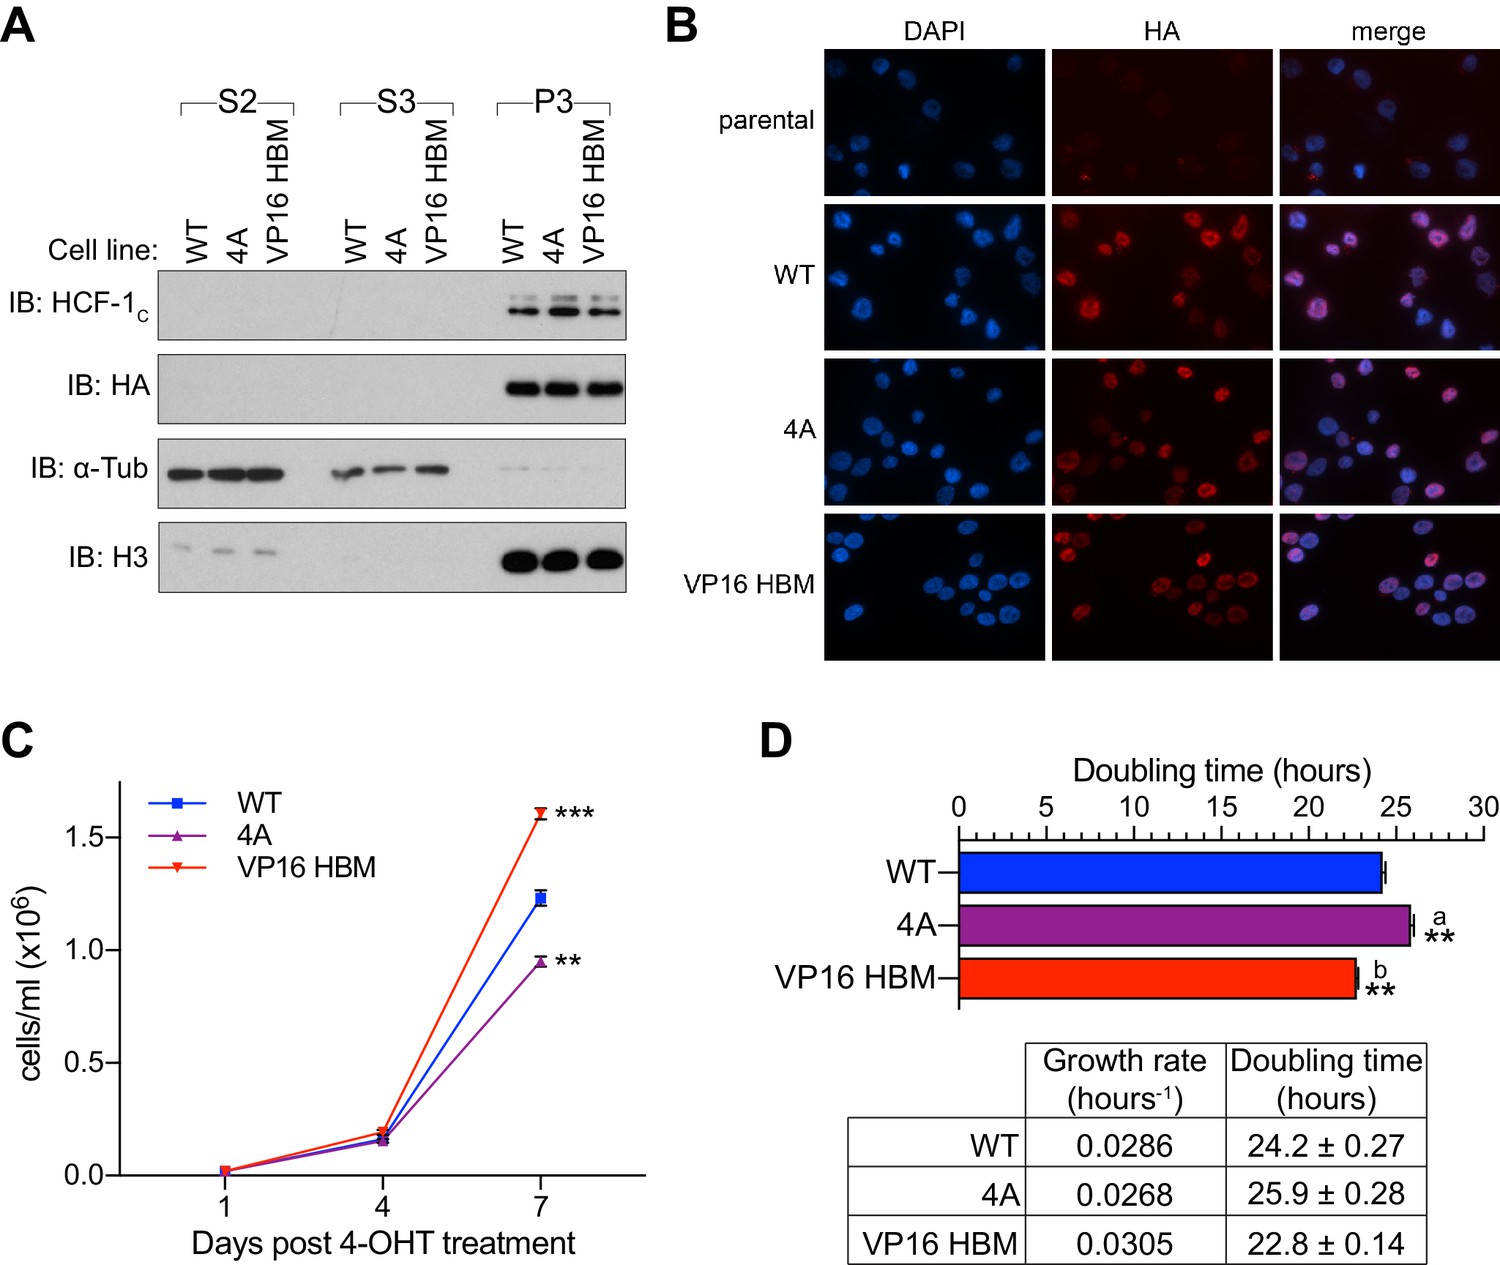
Localization of MYC mutants and their impact on cell doubling time.
(A) Chromatin fractionation of switchable Ramos cells was performed after a 24 hr treatment with 20 nM 4-OHT. S2 reflects the cytosolic, S3 the non-chromatin nuclear, and P3 the chromatin-bound fraction. Each fraction was probed using antibodies against host cell factor (HCF)–1C, HA, α-Tubulin, and H3. (B) Immunofluorescence of cells that had been switched for 24 hr as in (A), using a DAPI DNA stain and an antibody against the HA tag on switched MYC proteins. (C) Switchable Ramos cell lines were treated with 20 nM 4-OHT for 16 hr, then re-plated 24 hr later at a density of 2 × 10⁴ cells/ml. The number of cells, including both green fluorescent protein (GFP)– and GFP+, was counted at 3 and 6 days following re-plating. Shown are the mean and standard error for three biological replicates. Student’s t-test between wild-type (WT) and mutant cells was used to calculate p-values; **=0.0023, ***=0.00087. (D) Using the difference in cell number between day 1 and day 7 from (C), we calculated growth rate and subsequently the approximate doubling time for each cell line following switching. Bar graph shows the mean and standard error for the three biological replicates. Student’s t-test between WT and mutant cells was used to calculate p-values; a = 0.002, b = 0.0012. Table below shows the mean growth rates and doubling time ± standard deviation.
Figure 2 with 1 supplement
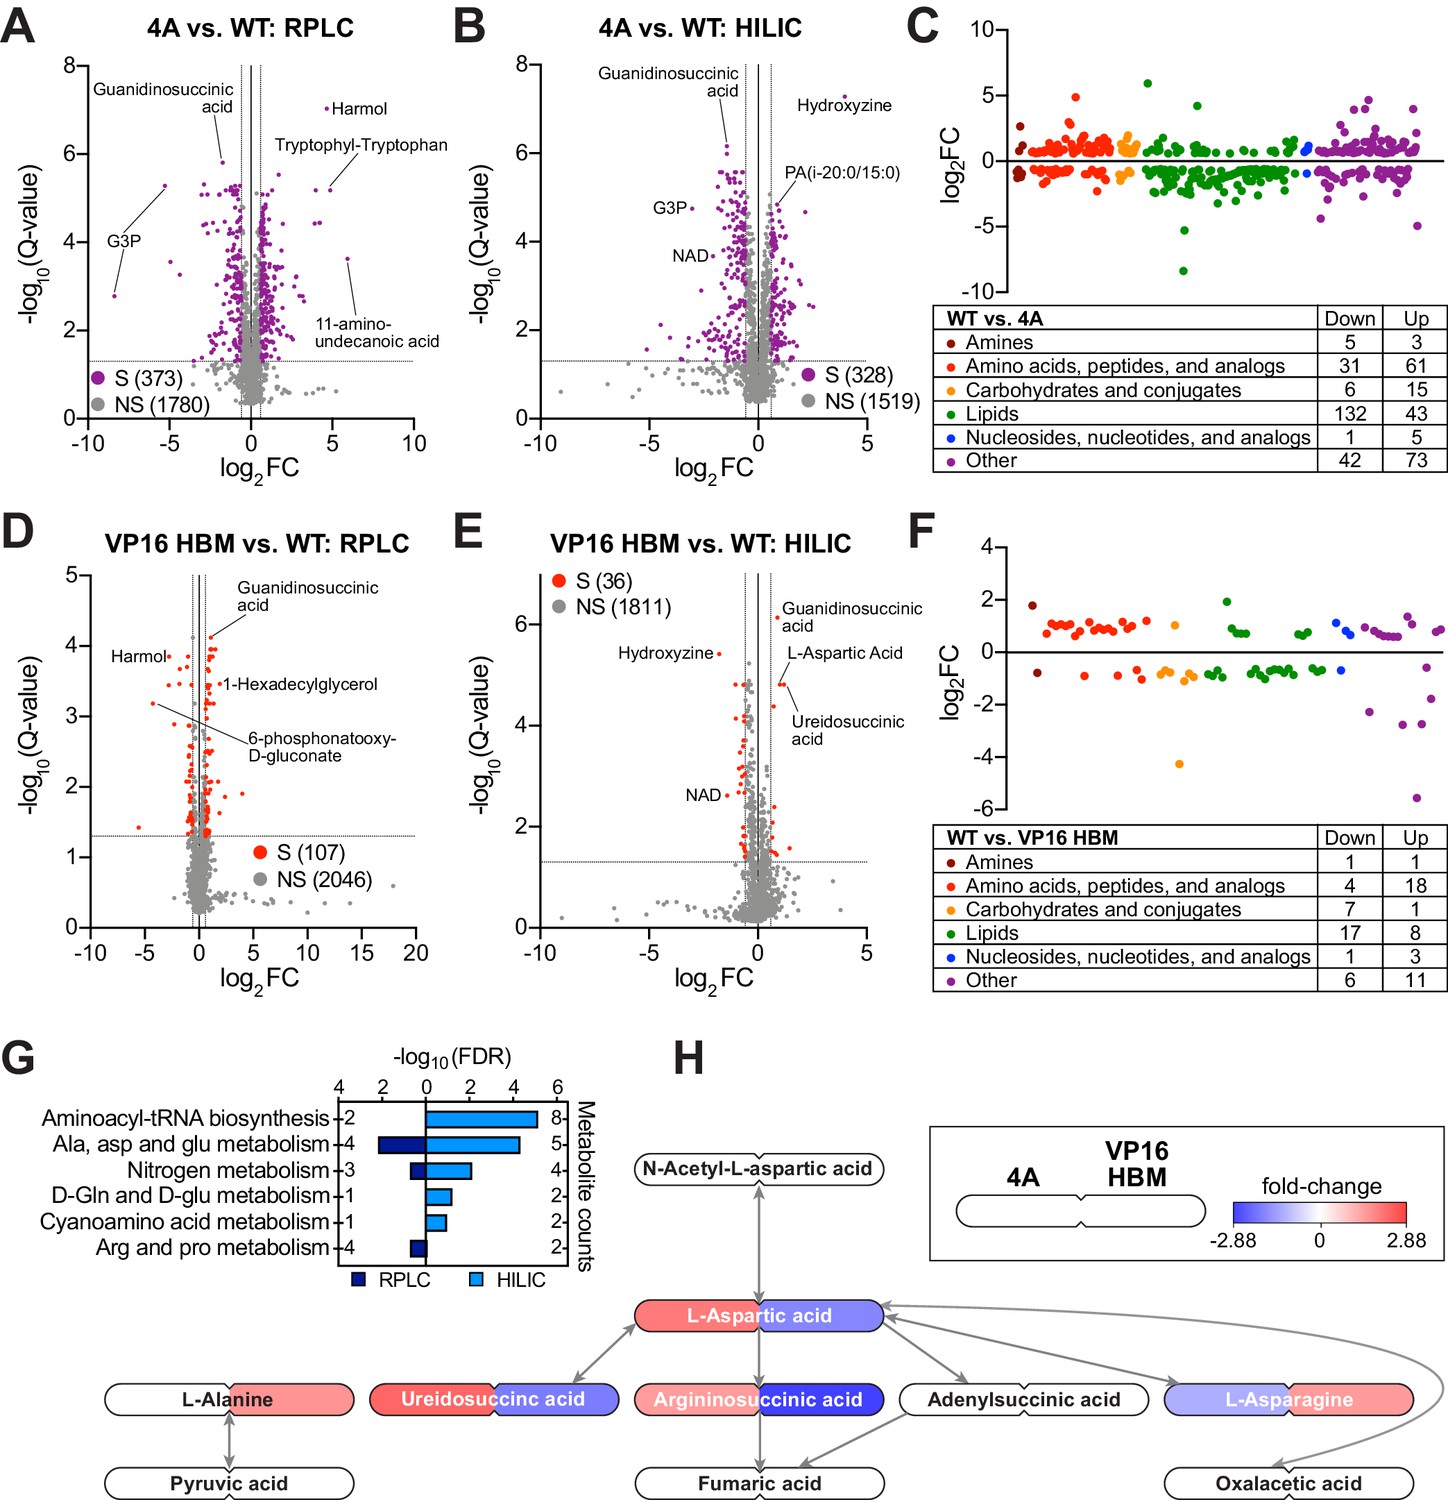
The MYC–host cell factor (HCF)–1 interaction influences intracellular amino acid levels.
(A and B) Volcano plots of metabolites detected by reverse-phase liquid chromatography (RPLC) (A) or hydrophilic interaction liquid chromatography (HILIC) (B) in wild-type (WT) and 4A switchable Ramos cells treated for 24 hr with 20 nM 4-OHT. Metabolites that were significantly (S) changed (false discovery rate [FDR] < 0.05 and |FC| > 1.5) with the 4A MYC mutant compared to WT are colored. Non-significant (NS) changes are in gray. Five biological replicates for WT and four biological replicates for 4A were used to calculate Q-values and fold-changes (FCs). Select metabolites are indicated. (C) Classification of metabolites that were significantly changed (FDR < 0.05 and |FC| > 1.5) with the 4A mutant compared to WT cells. (D and E) Volcano plots of metabolites detected by RPLC (D) or HILIC (E) in WT and VP16 HCF-1-binding motif (HBM) switchable Ramos cells treated for 24 hr with 20 nM 4-OHT. Metabolites that were significantly (S) changed (FDR < 0.05 and |FC| > 1.5) with the VP16 HBM MYC mutant compared to WT are colored. Non-significant (NS) changes are in gray. Five biological replicates for WT and VP16 HBM were used to calculate Q-values and FCs. Select metabolites are indicated. (F) Classification of metabolites that were significantly changed (FDR < 0.05 and |FC| > 1.5) with the VP16 HBM mutant compared to WT cells. (G) Annotated metabolites from Figure 2—figure supplement 1C that were changed in the opposite direction for the 4A and VP16 HBM mutants were independently subjected to pathway enrichment analysis. Pathways with FDR < 0.2 for either RPLC and HILIC are shown. (H) Metabolites (FDR < 0.05) in the ‘alanine, aspartate, and glutamate metabolism’ pathway that were impacted by the 4A (left) and VP16 HBM (right) MYC mutants. Node color represents the FC over WT. The remainder of the pathway is shown in Figure 2—figure supplement 1E and F.
-
Figure 2—source data 1
Ramos 4A and VP16 host cell factor (HCF)–1-binding motif reverse-phase liquid chromatography significant changes.
- https://cdn.elifesciences.org/articles/60191/elife-60191-fig2-data1-v1.xlsx
-
Figure 2—source data 2
Ramos 4A and VP16 host cell factor (HCF)–1-binding motif hydrophilic interaction liquid chromatography significant changes.
- https://cdn.elifesciences.org/articles/60191/elife-60191-fig2-data2-v1.xlsx
Figure 2—figure supplement 1
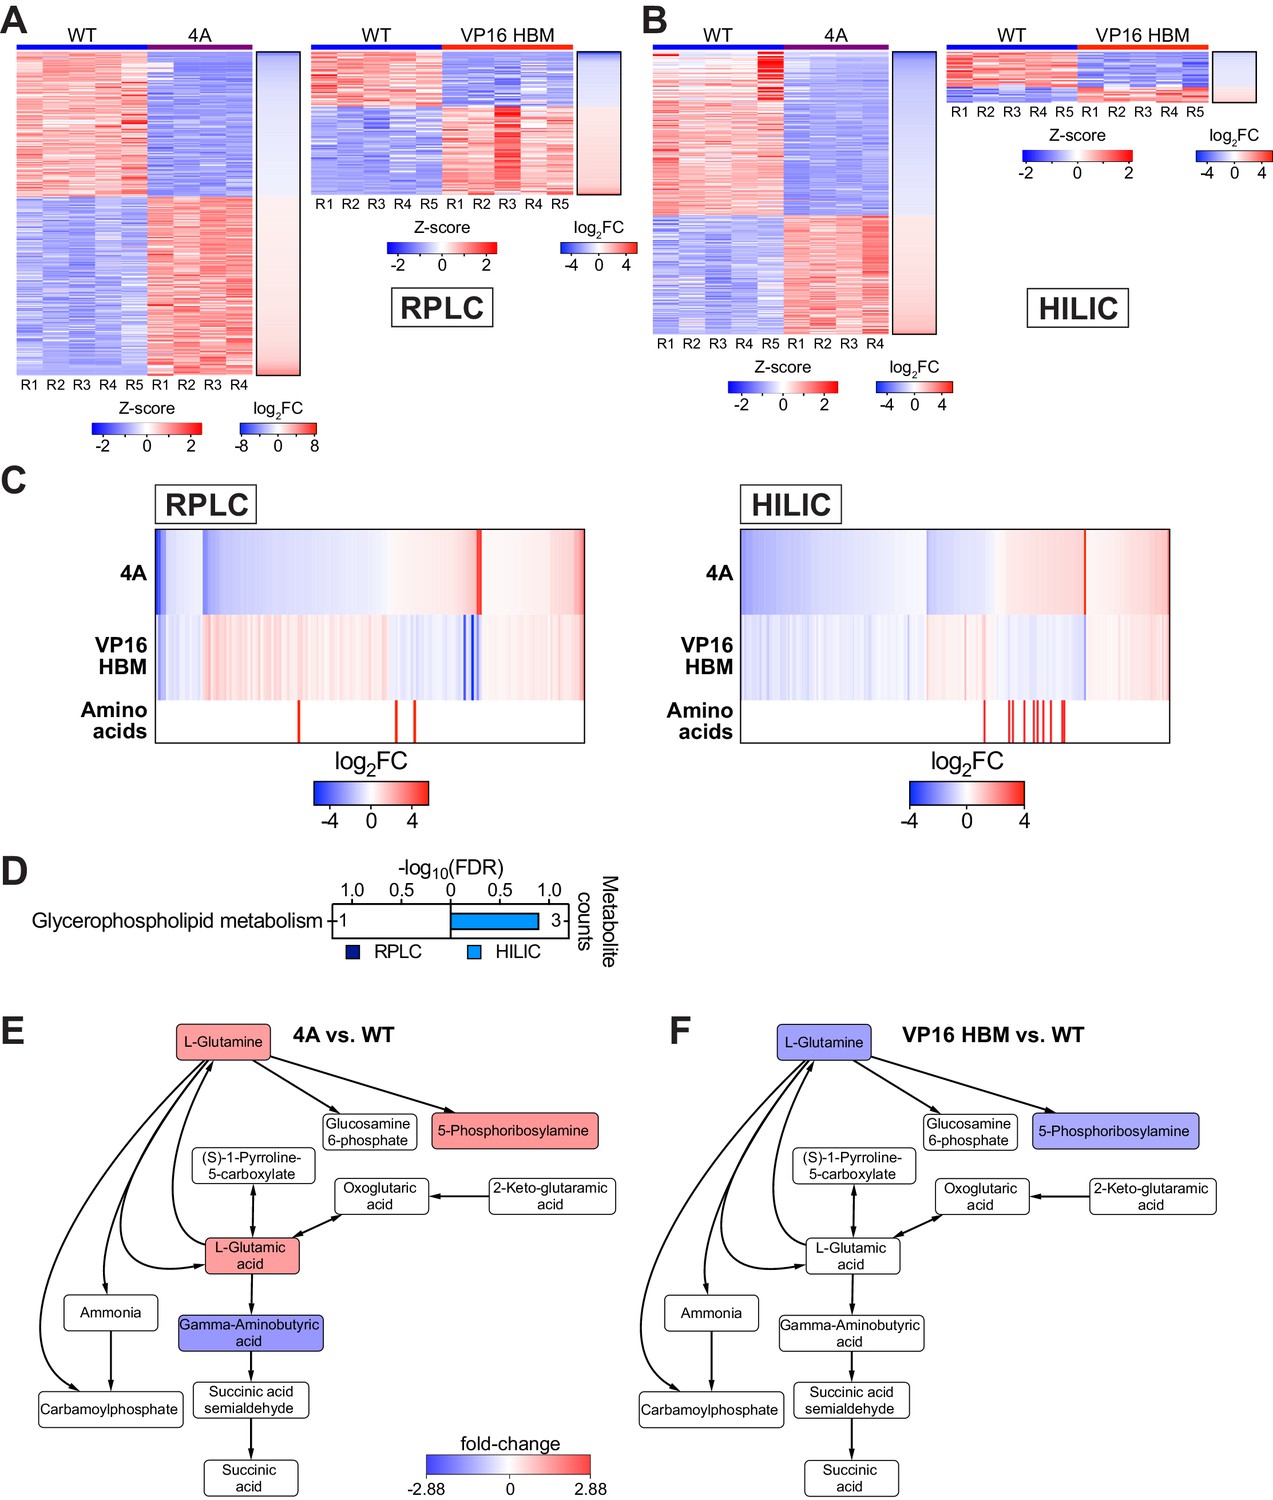
Impact of the 4A and VP16 HCF-1-binding motif (HBM) mutants on Ramos cell metabolites.
All data are derived from switchable Ramos cells treated with 20 nM 4-OHT for 24 hr. (A and B) Heatmap visualizing consistency between replicates of metabolites (z-transformed) detected with reverse-phase liquid chromatography (RPLC) (A) or hydrophilic interaction liquid chromatography (HILIC) (B) that were significantly (false discovery rate [FDR] < 0.05 and |FC| > 1.5) impacted by the 4A (left) or VP16 HBM (right) MYC mutants. Shown alongside each is a heatmap is the log2FC as calculated from the raw data. (C) Heatmap showing metabolites detected with RPLC (left) or HILIC (right) that are significantly (FDR < 0.05) changed for both the 4A and VP16 HBM mutants, compared to wild-type (WT) MYC. Metabolites are clustered according to the relationship between the two mutants, and ranked by the log2FC of 4A versus WT. The position of amino acids is highlighted in red. (D) Annotated metabolites from (C) that were changed in the same direction for the 4A and VP16 HBM mutants were independently subjected to pathway enrichment analysis. Pathways with FDR < 0.2 for either RPLC and HILIC are shown. (E) Metabolites in the ‘alanine, aspartate, and glutamate metabolism’ pathway that are significantly (FDR < 0.05) impacted in the 4A mutant. Node color represents the fold-change (FC) over WT. The remainder of the pathway is shown in Figure 2H. (F) Metabolites in the ‘alanine, aspartate, and glutamate metabolism’ pathway that are significantly (FDR < 0.05) impacted in the VP16 HBM mutant. Node color represents the FC over WT. The remainder of the pathway is shown in Figure 2H.
Figure 3 with 3 supplements
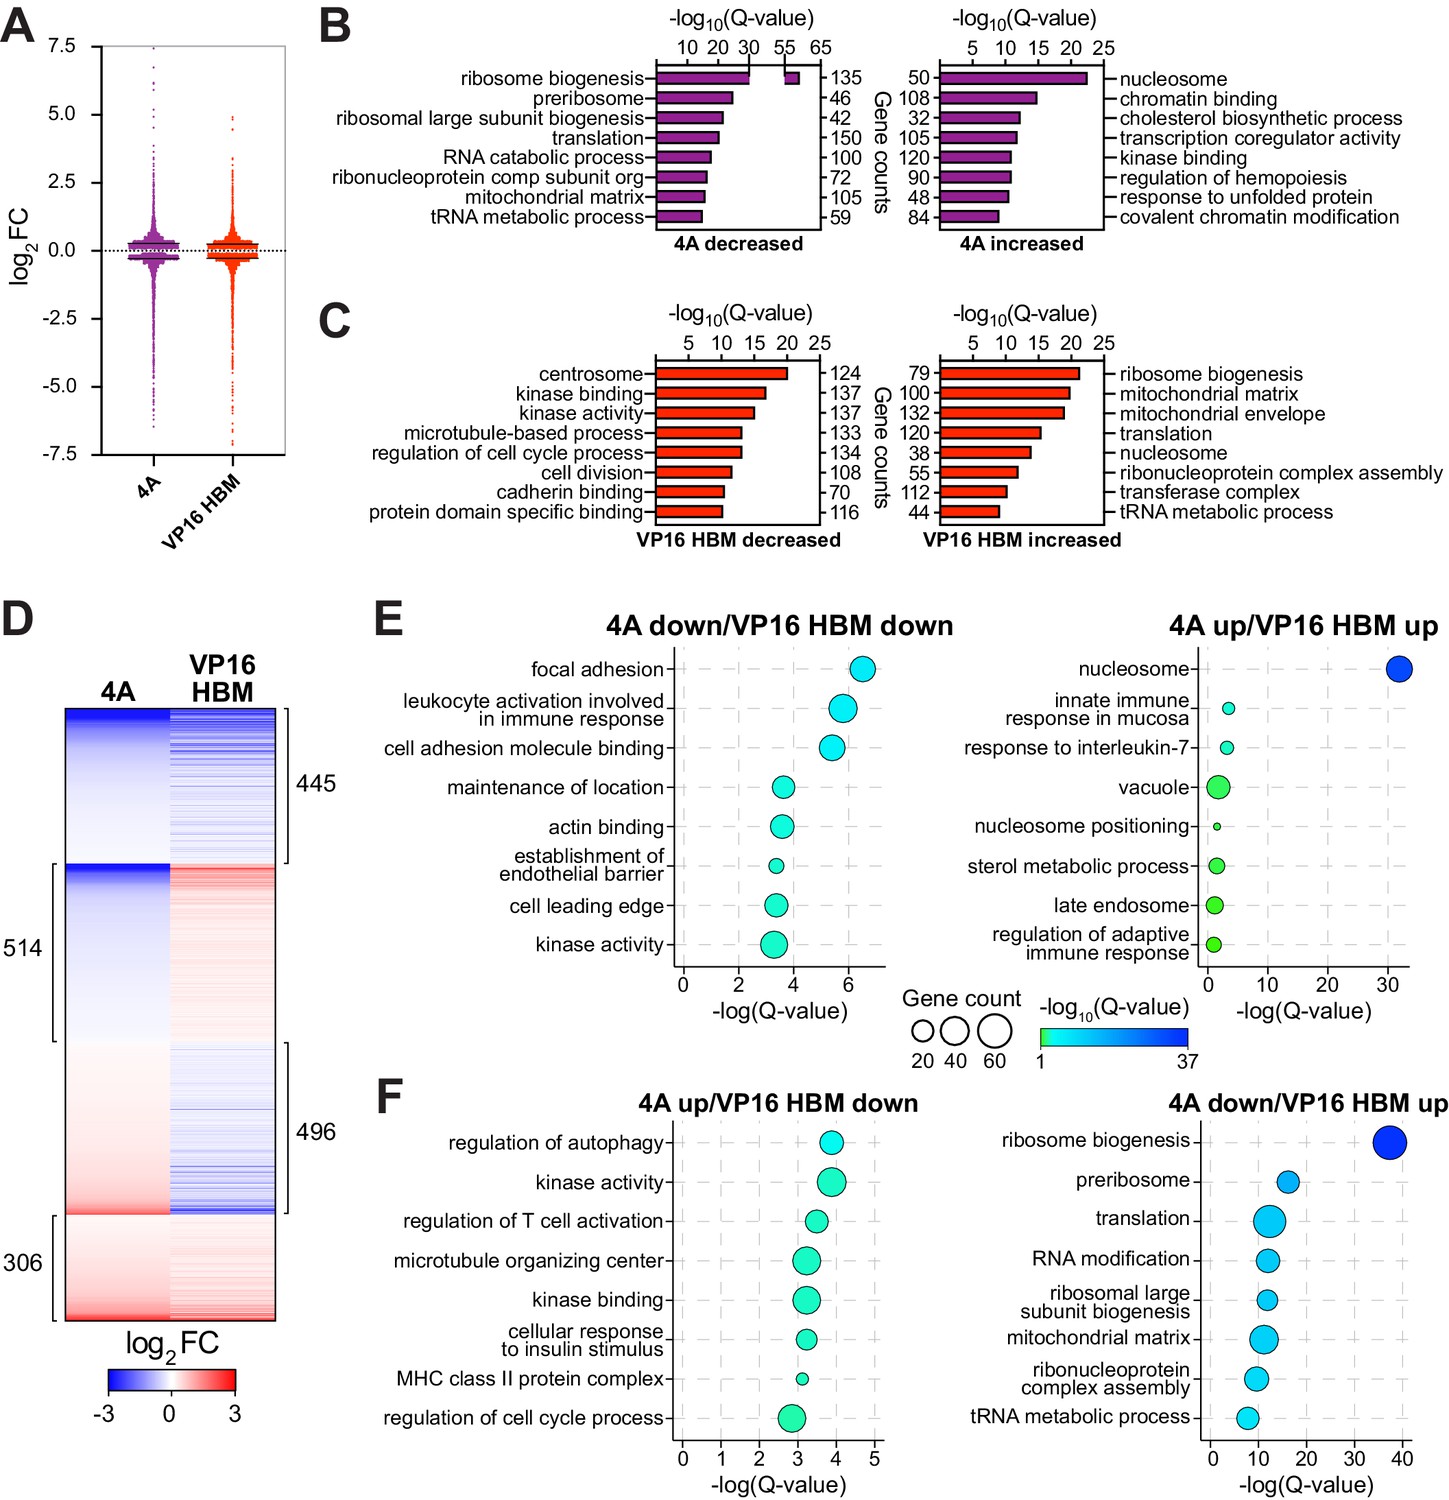
The MYC–host cell factor (HCF)–1 interaction influences the expression of genes involved in ribosome biogenesis and mitochondrial pathways.
Switchable Ramos cells were treated with 20 nM 4-OHT for 24 hr, RNA isolated, and RNA-Seq performed. (A) Scatterplot showing the distribution of log2FC of significant (false discovery rate [FDR] < 0.05) RNA-Seq changes with the 4A and VP16 HCF-1-binding motif (HBM) MYC mutants, compared to the wild-type (WT) switch. Solid lines represent the median log2FC for decreased (4A: −0.2858; VP: −0.2747) and increased (4A: 0.281; VP: 0.2558) transcripts compared to WT. For clarity, some data points were excluded; these data points are highlighted in Figure 3—source data 1 and 2. (B and C) Categories from the top eight families in gene ontology (GO) enrichment analysis of significant (FDR < 0.05) gene expression changes under each condition (B: 4A; C: VP16 HBM). (D) Heatmap showing the log2FC of significantly (FDR < 0.05) changed transcripts that are altered in expression in both the 4A and VP16 HBM mutants. Transcripts are clustered according to the relationship in expression changes between the 4A and VP16 HBM mutants, and ranked by the log2FC for the 4A mutant. Scale of heatmap is limited to [−3,3]. (E and F) Gene clusters in (D) were subject to GO enrichment analysis, and the top eight categories are shown for the correlative (E) or anti-correlative (F) clusters. The Q-value of categories is represented by bubble color, and the number of genes present in a category is represented by bubble size. The genes in these categories are identified in Figure 3—figure supplement 2A and B.
-
Figure 3—source data 1
Ramos 4A 24 hr RNA-Seq significant changes.
- https://cdn.elifesciences.org/articles/60191/elife-60191-fig3-data1-v1.xlsx
-
Figure 3—source data 2
Ramos VP16 host cell factor (HCF)–1-binding motif 24 hr RNA-Seq significant changes.
- https://cdn.elifesciences.org/articles/60191/elife-60191-fig3-data2-v1.xlsx
-
Figure 3—source data 3
Ramos 4A and VP16 host cell factor (HCF)–1-binding motif 24 hr RNA-Seq shared significant changes.
- https://cdn.elifesciences.org/articles/60191/elife-60191-fig3-data3-v1.xlsx
Figure 3—figure supplement 1
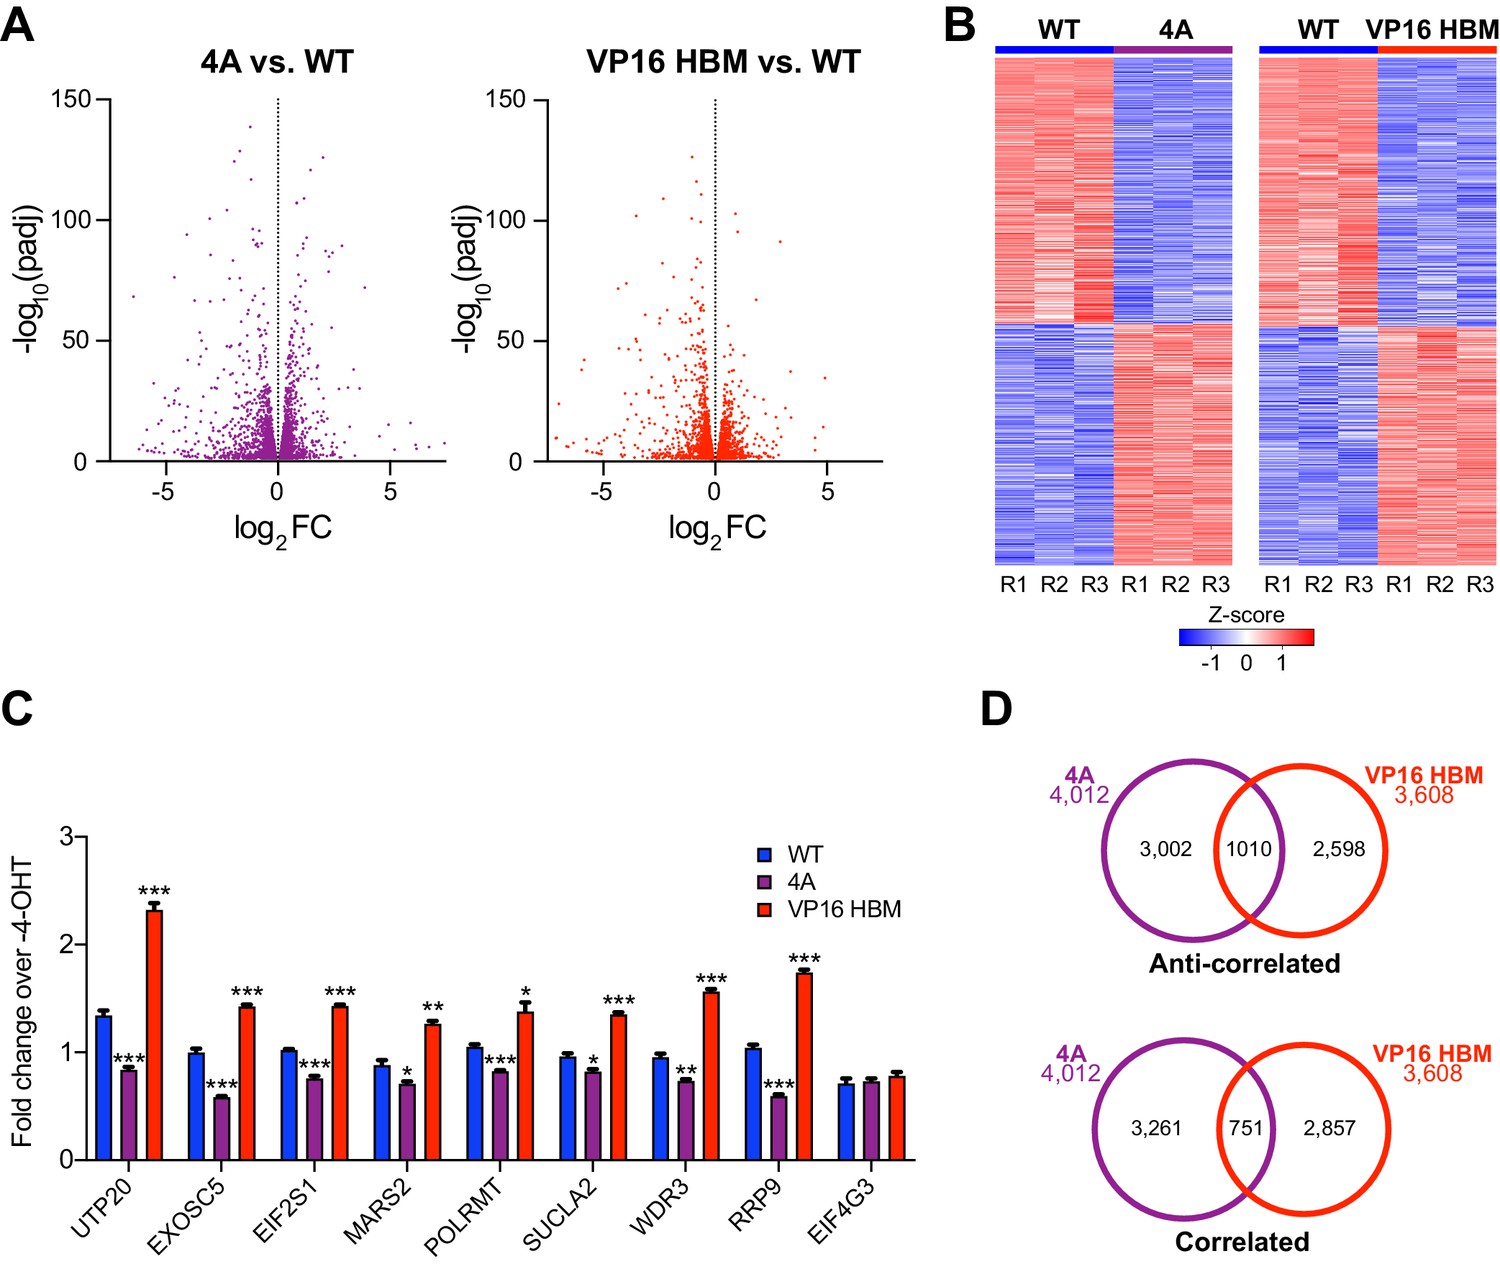
Gene expression changes induced by the 4A and VP16 host cell factor (HCF)–1-binding motif (HBM) mutants.
(A) Volcano plots showing the significant (false discovery rate [FDR] < 0.05) gene expression changes for the 4A (left) and VP16 HBM (right) mutants. For clarity, some data points were excluded; these data points are highlighted in Figure 3—source data 1 and 2. (B) Heatmap visualizing consistency among replicates of RNA-Seq for switchable MYC allele cell lines at 24 hr, by z-transformation and ranking by fold-change (FC). Transcripts that were significantly (FDR < 0.05) impacted compared to wild type (WT) are shown. Three biological replicates for each WT, 4A, and VP16 HBM were used to calculate FDR and FCs. (C) Validation of a set of gene expression changes detected in RNA-Seq. Cells were grown with or without 4-OHT for 24 hr, RNA isolated, reverse transcribed, and the indicated transcripts quantified by real-time PCR. Cycle threshold (Ct) values were normalized to those for GAPDH and FCs calculated over −4-OHT samples. Shown are the mean and standard error for three biological replicates. Student’s t-test between WT and mutant cells was used to calculate p-values; *p<0.05, **p<0.01, ***p<0.001. (D) Significant (FDR < 0.05) gene expression changes that are anti-correlative (top) and correlative (bottom) in direction between the 4A and VP16 HBM mutants.
Figure 3—figure supplement 2
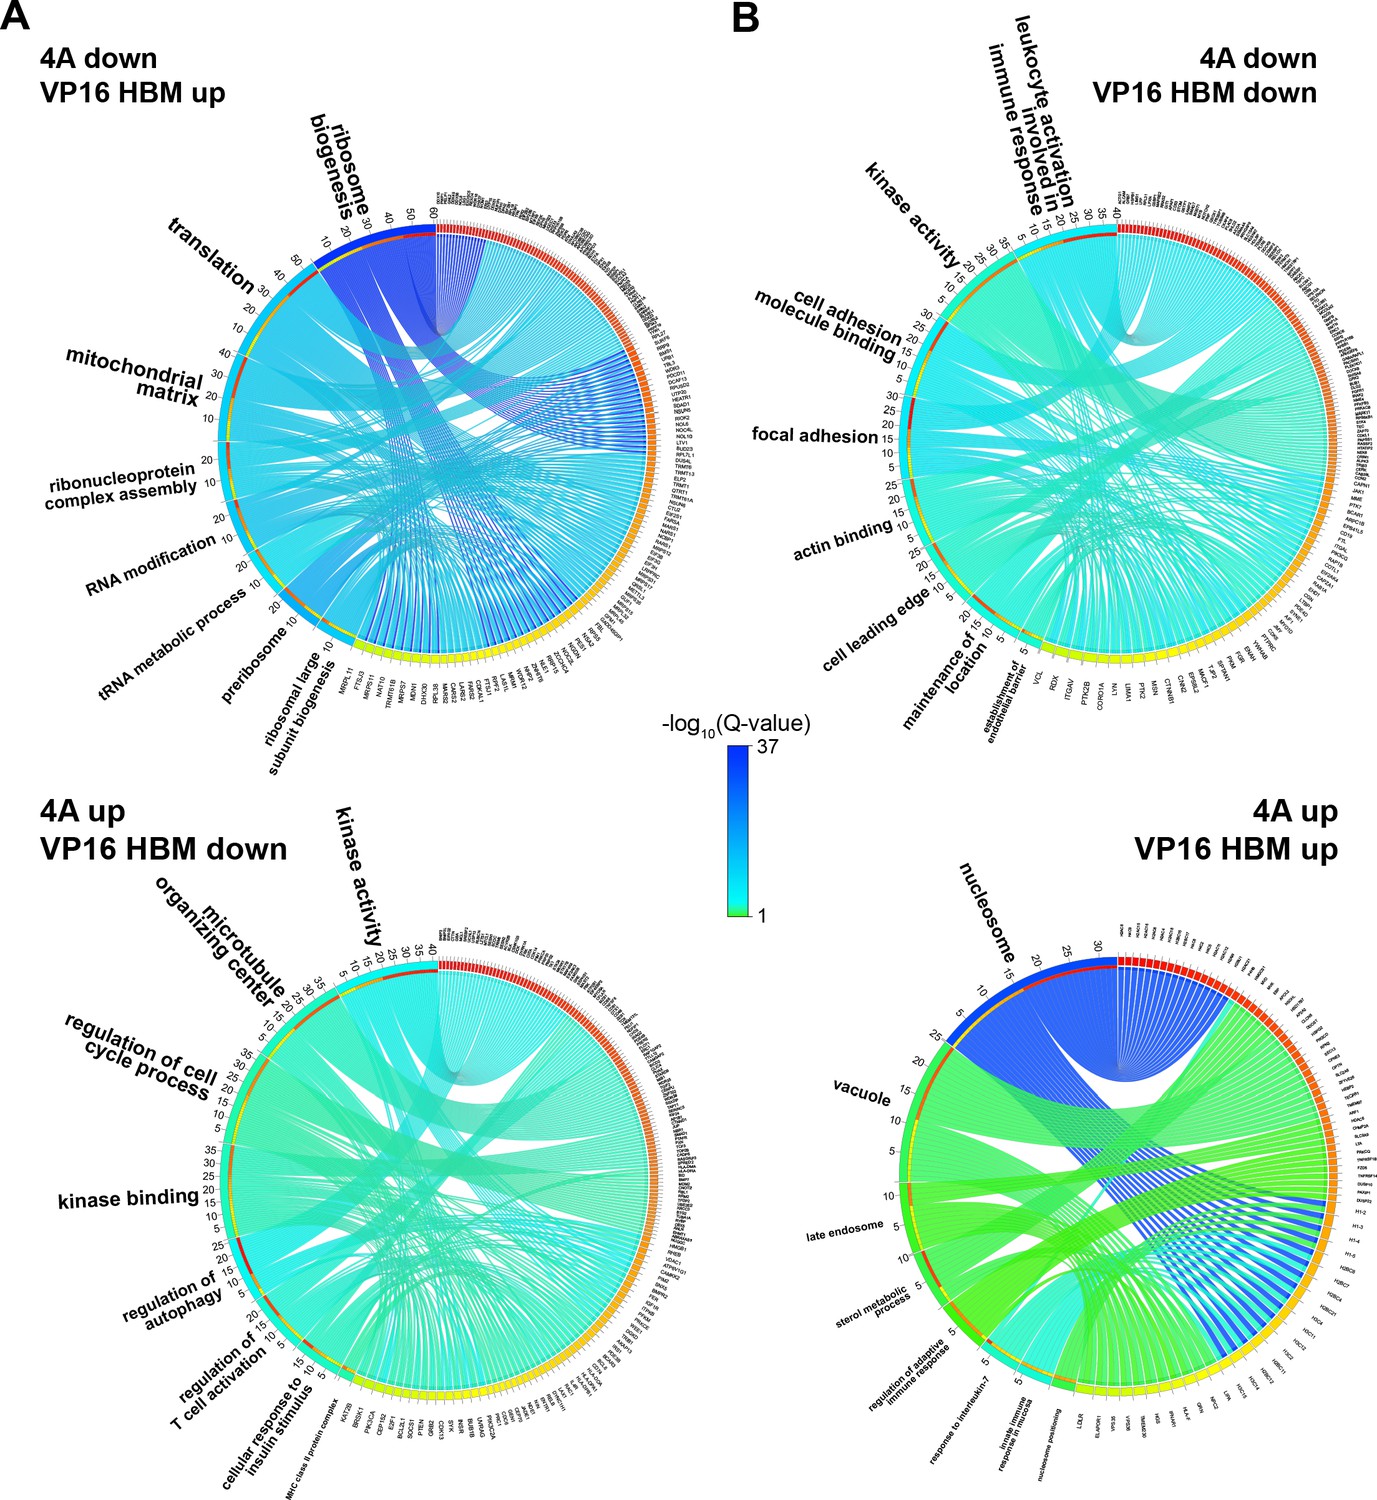
Gene ontology (GO) enrichment analysis of correlative and anti-correlative effects on gene expression.
(A and B) Categories from the top eight families in GO enrichment analysis of the anti-correlated (A) and correlated (B) gene clusters shown in Figure 3D, for transcripts that were decreased (top) or increased (bottom) with the 4A mutant. The Q-value of categories is represented by the ribbon color, which is scaled across these figures. Categories are ranked by the number of matched genes, and genes are ranked by the number of categories into which they fall.
Figure 3—figure supplement 3
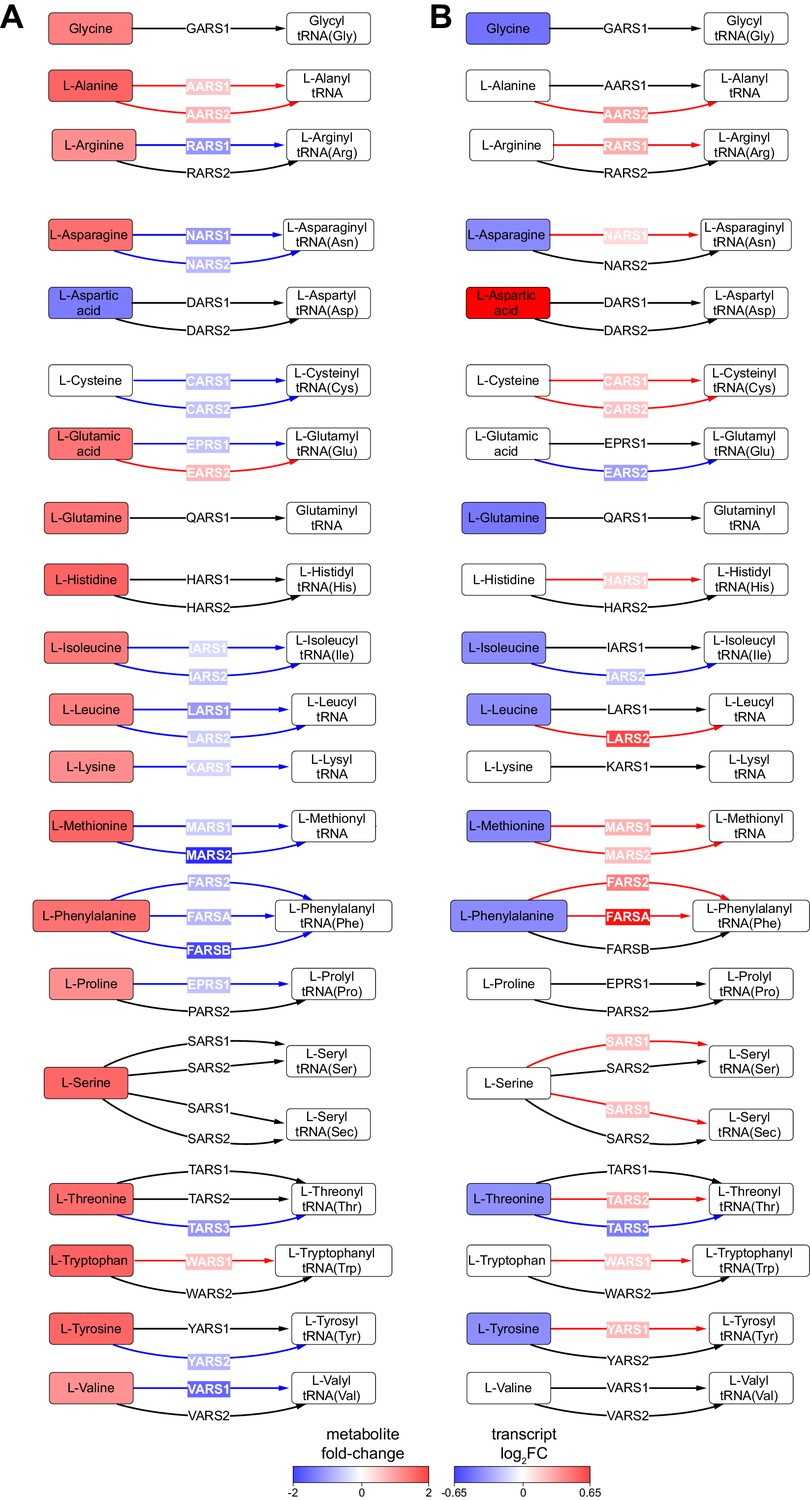
Amino acids and their cognate tRNA-ligases are influenced by the MYC–host cell factor (HCF)–1 interaction.
Impact of the 4A (A) and VP16 HCF-1-binding motif (B) mutants on amino acid levels (hydrophilic interaction liquid chromatography) and on the expression of aminoacyl tRNA transferases (RNA-Seq).
Figure 4 with 1 supplement
Genes regulated by the MYC−host cell factor (HCF)–1 interaction are impacted by loss of HCF-1.
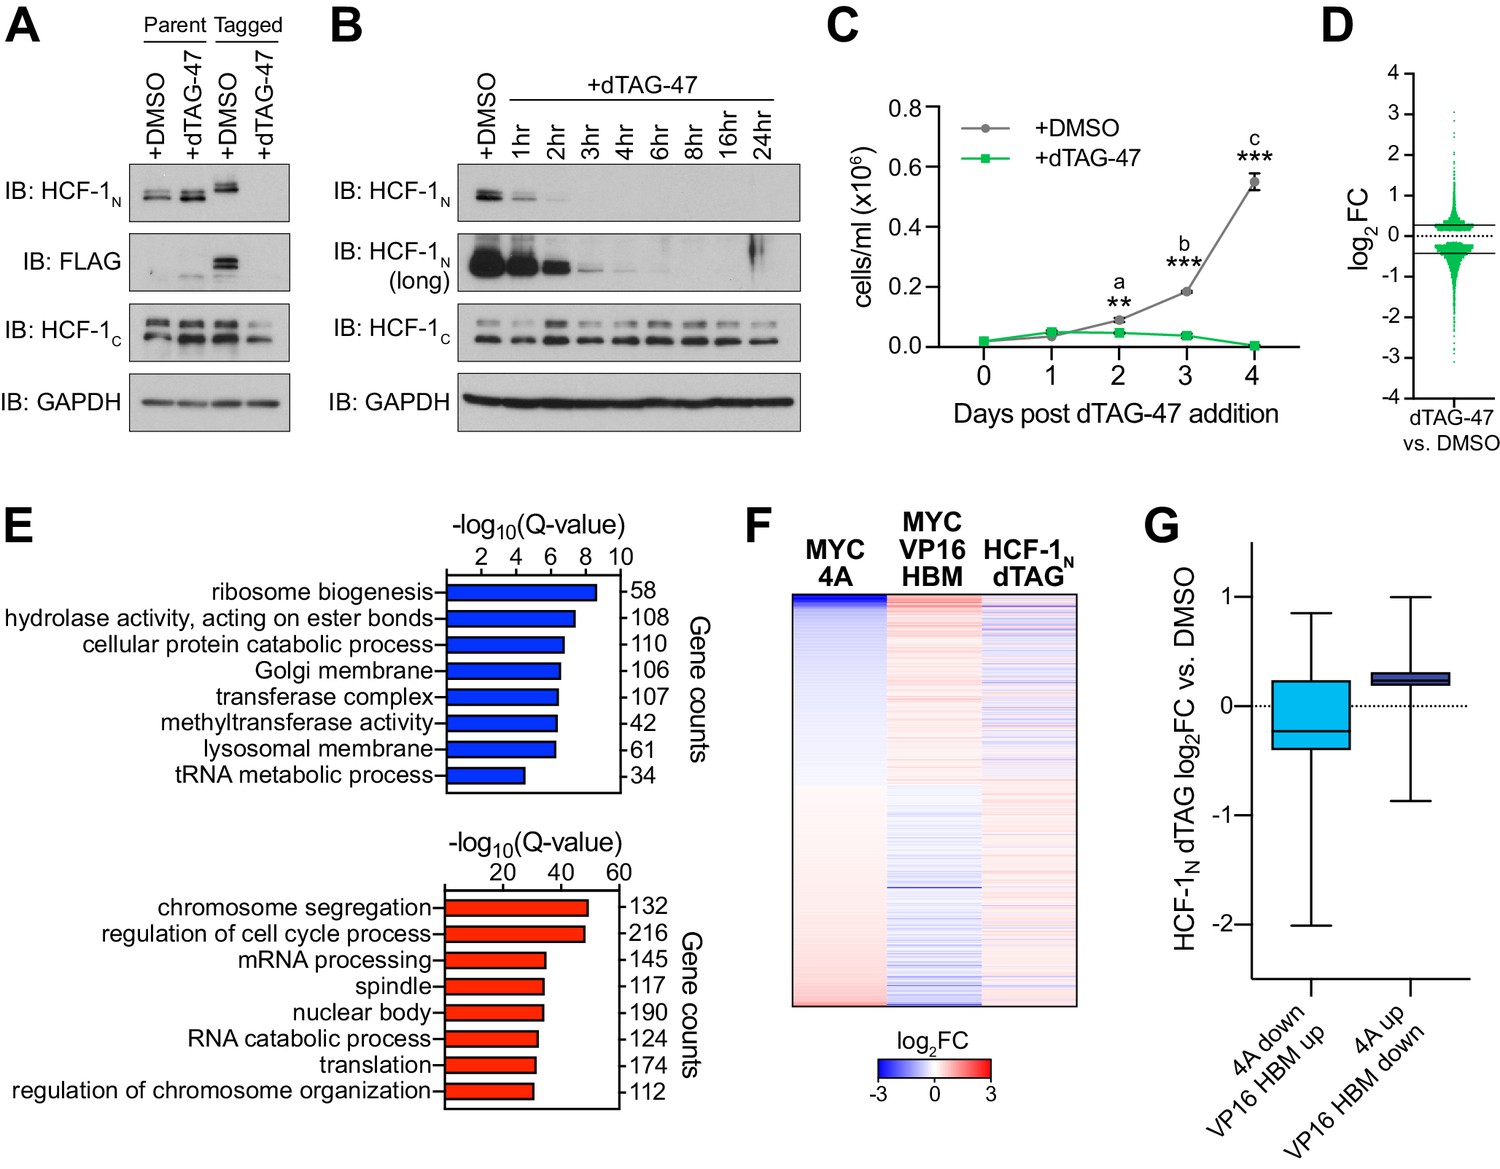
(A) Western blot, comparing the effects of treating untagged parental cells or FKBPFV-HCF-1N Ramos cells with DMSO or 500 nM dTAG-47 for 24 hr. Blots for HCF-1N, FLAG tag, HCF-1C, and GAPDH are shown. (B) Western blot of lysates from FKBPFV-HCF-1N Ramos cells treated with 500 nM dTAG-47 for varying times, compared to cells treated with DMSO for 24 hr. Shown are short and long exposures of HCF-1N, and HCF-1C, with a GAPDH loading control. (C) Growth curve of FKBPFV-HCF-1N Ramos cells treated with DMSO or 500 nM dTAG-47. Cells were counted every 24 hr for 4 days after plating. Shown are the mean and standard error for three biological replicates. Student’s t-test was used to calculate p-values; a = 0.0029, b = 0.000051, c = 0.000040. (D) Scatterplot showing the distribution of log2FC in RNA-Seq comparing DMSO to 3 hr of 500 nM dTAG-47 treatment (degradation of HCF-1N). Solid lines represent the median log2FC for decreased (−0.425655) and increased (0.270428) transcripts. For clarity, one data point was excluded; this data point is highlighted in Figure 4—source data 2. (E) Gene ontology enrichment analysis of transcripts significantly (false discovery rate [FDR] < 0.05) decreased (top) and increased (bottom) in expression following treatment of FKBPFV-HCF-1N Ramos cells with dTAG-47 for 3 hr. Excluded from this analysis are transcripts that were significantly changed when parental Ramos cells were treated with dTAG-47 for 3 hr. (F) Heatmap showing the log2FC of transcripts with significantly (FDR < 0.05) changed expression, as measured by RNA-Seq, under the indicated conditions. Transcripts are clustered according to the relationship in expression changes between the 4A and VP16 HBM mutants, and ranked by the log2FC for the 4A mutant. Scale of heatmap is limited to [−3,3]. (G) Box-and-whisker plot showing the relationship between transcripts that are anti-correlated between the 4A and VP16 HBM MYC mutants, and significantly changed with the degradation of HCF-1N. Box denotes the 25th to 75th percentile, whiskers extend from minimum to maximum point, and middle line marks the median (4A down/VP16 HBM up: −0.2276; 4A up/VP16 HBM down: 0.2349).
-
Figure 4—source data 1
Raw data for host cell factor (HCF)–1N degradation growth curve.
- https://cdn.elifesciences.org/articles/60191/elife-60191-fig4-data1-v1.xlsx
-
Figure 4—source data 2
Ramos host cell factor (HCF)–1N degradation RNA-Seq significant changes.
- https://cdn.elifesciences.org/articles/60191/elife-60191-fig4-data2-v1.xlsx
-
Figure 4—source data 3
Ramos untagged RNA-Seq significant changes.
- https://cdn.elifesciences.org/articles/60191/elife-60191-fig4-data3-v1.xlsx
Figure 4—figure supplement 1
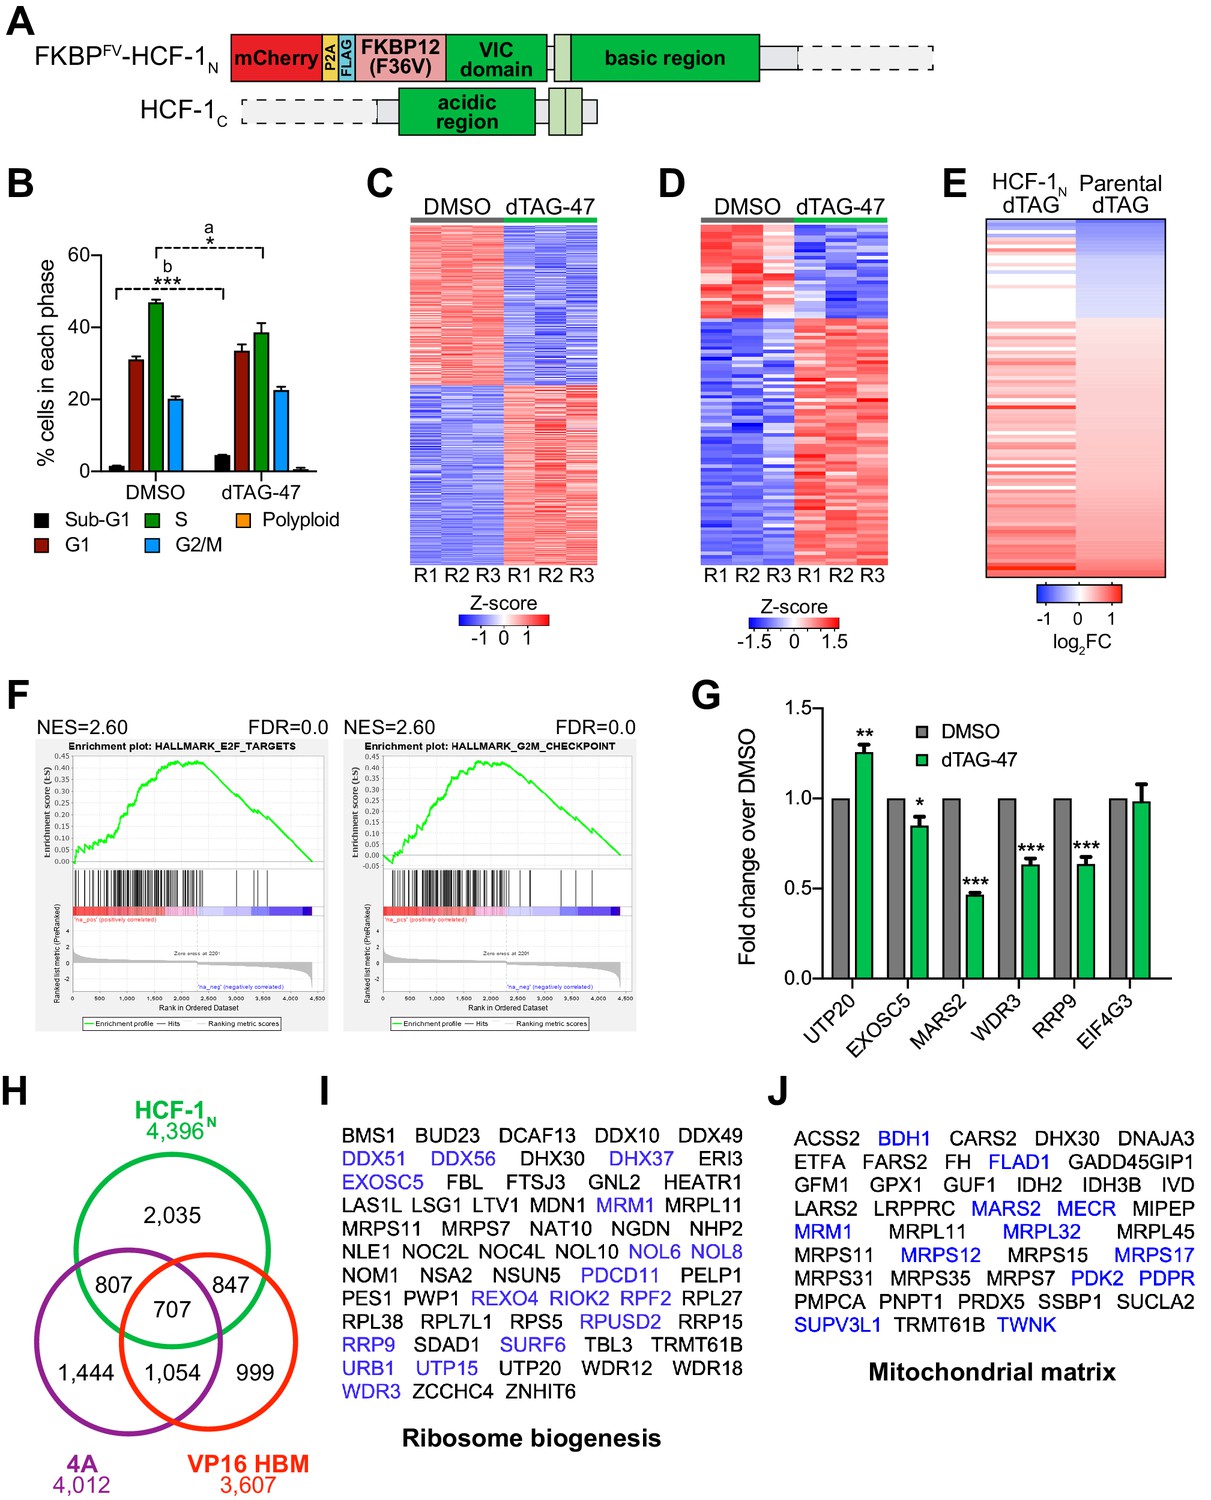
Inducible degradation of host cell factor (HCF)–1N.
(A) Schematic of the HCF-1 fusion protein in Ramos FKBPFV-HCF-1N Ramos cells, which were generated using CRISPR/Cas9 homology-directed repair. Fused to the N-terminus of the VP16-induced complex (VIC) domain is mCherry linked by P2A to FLAG-tagged FKBP12FV. (B) Cell cycle distribution was determined using propidium iodide (PI) staining of FKBPFV-HCF-1N Ramos cells treated with DMSO or 500 nM dTAG-47 for 24 hr. Shown are the mean and standard error for three biological replicates. Student’s t-test was used to calculate p-values; a = 0.037, b < 0.0001. (C) Heatmap of significantly (false discovery rate [FDR] < 0.05) changed transcripts in FKBPFV-HCF-1N Ramos cells treated with DMSO or dTAG-47 for 3 hr. Shown are the z-transformed expression data for three biological replicates of RNA-Seq, ranked by fold-change (FC). (D) Heatmap of significantly (FDR < 0.05) changed transcripts in parental Ramos cells treated with DMSO or 500 nM dTAG-47 for 3 hr. Shown are the z-transformed expression data for three biological replicates of RNA-Seq, ranked by FC. (E) Heatmap showing the log2FC of all transcripts that are significantly (FDR < 0.05) changed when untagged Ramos cells were treated with DMSO or dTAG-47 for 3 hr, and the corresponding log2FC data in FKBPFV-HCF-1N Ramos cells. (F) Gene set enrichment analysis (GSEA) of significantly (FDR < 0.05) changed transcripts in FKBPFV-HCF-1N Ramos cells. Shown are the normalized enrichment scores (NES) and FDR for each gene set. (G) Validation of select RNA-seq changes in FKBPFV-HCF-1N Ramos cells. Cells were grown with DMSO or dTAG-47 for 3 hr, RNA isolated, RT-qPCR performed, and Ct values normalized to those for GAPDH. Fold-changes were then calculated over DMSO-treated samples. Shown are the mean and standard error for three biological replicates. Student’s t-test between DMSO and dTAG-47-treated cells was used to calculate p-values. *p<0.05, **p<0.01, ***p<0.001. (H) Venn diagram showing overlap of gene transcripts that are significantly (FDR < 0.05) changed in RNA-Seq with the 4A and VP16 HCF-1-binding motif (HBM) mutants, and with degradation of HCF-1N in Ramos cells. (I and J) Transcripts that are decreased with the 4A MYC mutant and increased with the VP16 HBM MYC mutant and fall into the ‘Ribosome biogenesis’ (I) or ‘Mitochondrial matrix’ (J) gene ontology categories. Highlighted in blue are the genes that are also significantly decreased with degradation of HCF-1N.
Figure 5 with 1 supplement
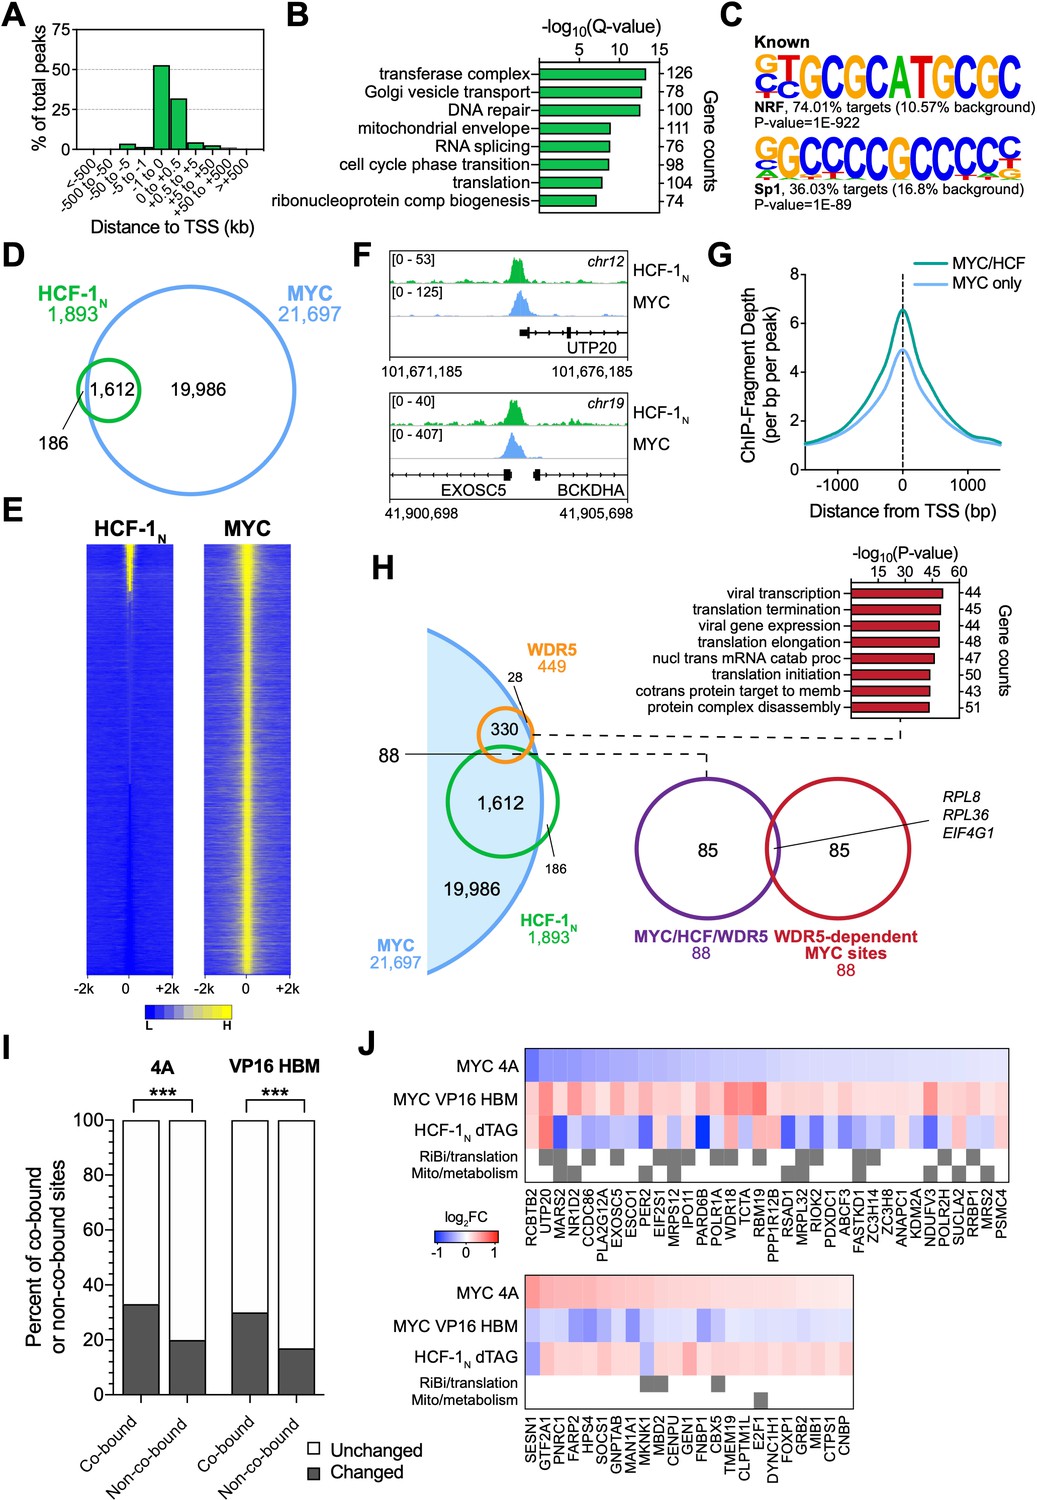
MYC is a widespread binding partner of host cell factor (HCF)–1 on chromatin.
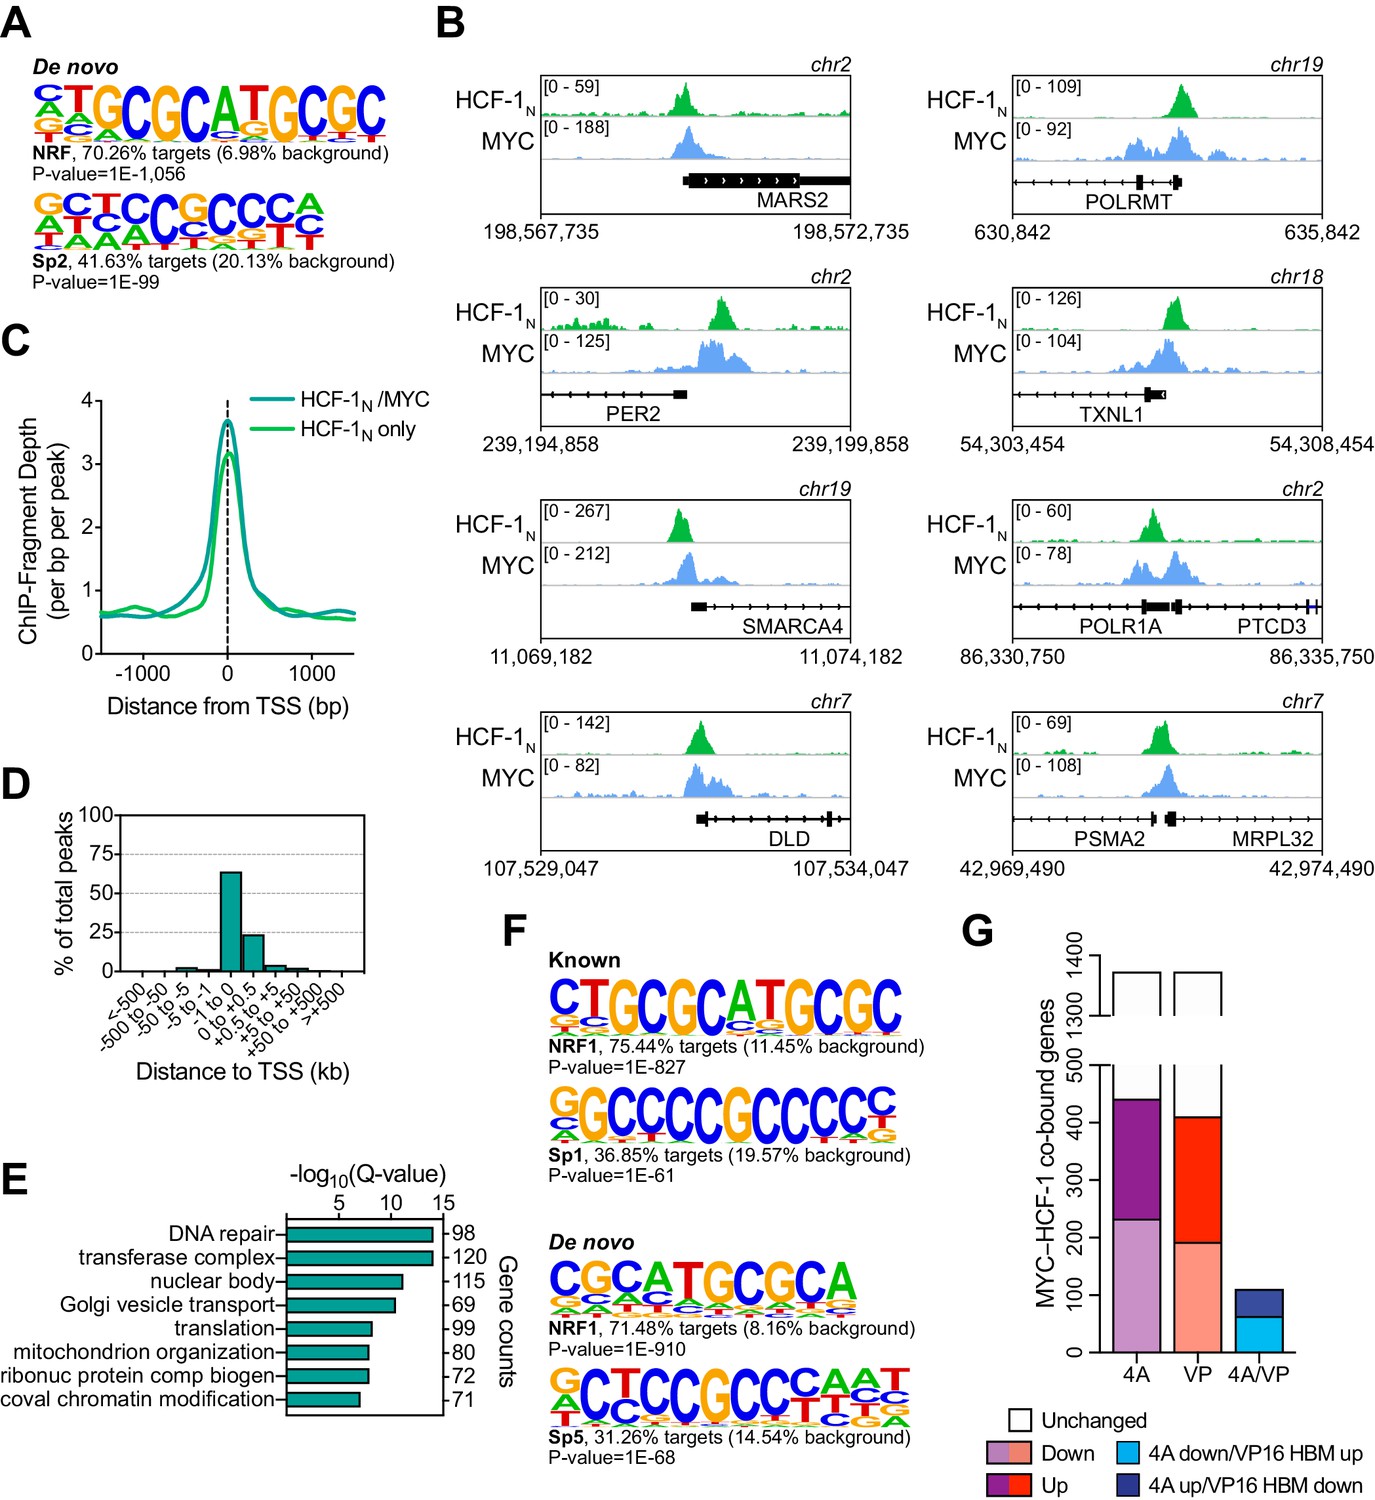
(A) Distribution of HCF-1N peaks in Ramos cells in relation to the nearest transcription start site (TSS), as determined by ChIP-Seq. (B) Gene ontology (GO) categories strongly represented in genes nearest to HCF-1N peaks in Ramos cells. (C) Known motif analysis of HCF-1N peaks in Ramos cells. Two of the most highly enriched motifs are shown, as well as the percentage of target and background sequences with the motif, and the p-value. (D) Venn diagram showing HCF-1N and MYC peaks in Ramos cells, and the number of regions that overlap between the data sets. ChIP-Seq data for MYC are from GSE126207. (E) Heatmap of all MYC peaks in Ramos cells (from GSE126207) and the corresponding region in Ramos HCF-1N ChIP-Seq, representing the combined average of normalized peak intensity in ±2 kb regions surrounding the peak centers with 100 bp bin sizes. Ranking is by peak intensity in HCF-1N. (F) Example Integrative Genomics Viewer (IGV) screenshots of regions that have overlapping peaks for MYC and HCF-1N in Ramos cells. (G) Normalized MYC ChIP-Seq fragment counts where peaks overlap with HCF-1N (MYC/HCF), compared to where they do not overlap (MYC) in Ramos cells. Data are smoothed with a cubic spline transformation. (H) Venn diagram showing relationship between HCF-1N, MYC, and WDR5 peaks in Ramos cells, and the overlap between co-bound genes and genes for which WDR5 is responsible for MYC recruitment. GO enrichment analysis of genes co-bound by MYC and WDR5—taken from Thomas et al., 2019—is also shown. (I) The proportion of protein-coding genes that were co-bound by promoter-proximal MYC and HCF-1N by ChIP-Seq or an equal number of non-co-bound genes were compared to transcripts that were unchanged or significantly changed (false discovery rate [FDR] < 0.05) with the 4A and VP16 HCF-1-binding motif (HBM) mutants by RNA-seq. p-Value for the 4A mutant is 1.982 × 10⁻¹⁴ and 6.933 × 10⁻¹⁴ for the VP16 HBM mutant. (J) Heatmap showing genes that are co-bound by promoter proximal MYC and HCF-1N in Ramos cells, have anti-correlative gene expression changes between for the 4A and VP16 MYC mutants, and have significant gene expression changes with HCF-1N degradation. Genes that fall into GO categories relating to ribosome biogenesis or translation (RiBi/translation), and mitochondrial function or metabolism (Mito/metabolism) are highlighted.
-
Figure 5—source data 1
Ramos host cell factor (HCF)–1N annotated ChIP-Seq peaks.
- https://cdn.elifesciences.org/articles/60191/elife-60191-fig5-data1-v1.xlsx
-
Figure 5—source data 2
Annotated intersect of ChIP-Seq peaks for host cell factor (HCF)–1N and MYC in Ramos cells.
- https://cdn.elifesciences.org/articles/60191/elife-60191-fig5-data2-v1.xlsx
Figure 5—figure supplement 1
Comparison of MYC and host cell factor (HCF)–1N localization on Ramos cell chromatin.
(A) De novo motif analysis of HCF-1N peaks in Ramos cells. Two of the most highly enriched motifs are shown, as well as the percentage of target and background sequences with the motif, and the p-value. (B) Example IGV screenshots of regions that have overlapping MYC and HCF-1N in Ramos cells. (C) Normalized HCF-1N ChIP-Seq fragment counts where peaks overlap with MYC (HCF-1N/MYC) compared to where they do not overlap (HCF-1N only). Data are smoothed with a cubic spline transformation. (D) Distribution of regions that overlap between MYC and HCF-1N peaks in Ramos cells in relation to the nearest TSS. (E) Gene ontology enrichment analysis of genes nearest to regions of overlap between MYC and HCF-1N peaks. (F) Known and de novo motif analysis of regions that overlap between MYC and HCF-1N peaks in Ramos cells. For each motif represented, percentage of target and background sequences with the motif and p-value are shown. (G) Relationship between protein-coding genes that are co-bound by promoter-proximal MYC and HCF-1N by ChIP-Seq, and are significantly (false discovery rate [FDR] < 0.05) decreased or increased in response to the 4A or VP16 HCF-1-binding motif (HBM) mutations. Also shown are genes where the expression changes were anti-correlated between the 4A and VP16 HBM mutants.
Figure 6 with 1 supplement
MYC and host cell factor (HCF)–1 bind chromatin independent of their ability to interact.
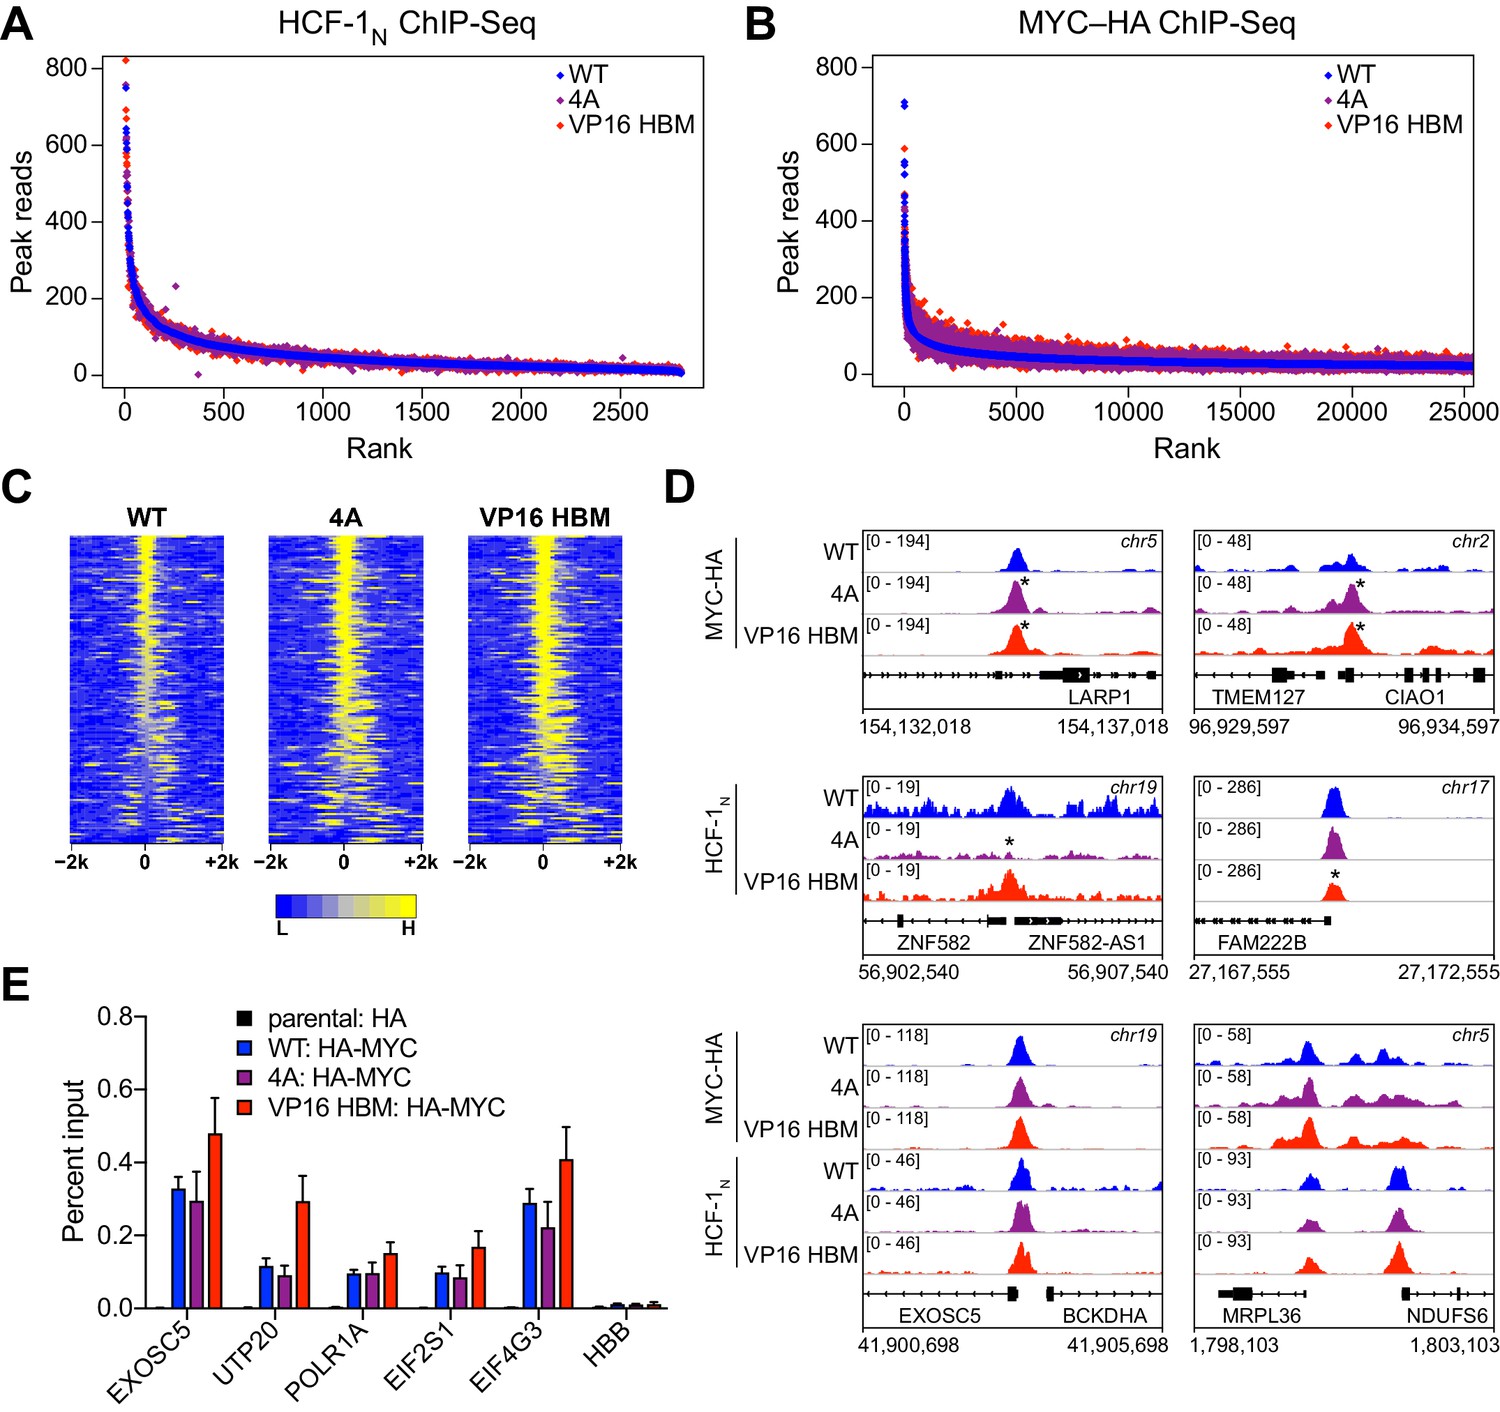
(A) Scatterplots of normalized average read counts for HCF-1N ChIP-seq peaks in wild-type (WT), 4A, or VP16 HCF-1-binding motif (HBM) switched cells. (B) As in (A) but showing normalized average read counts for MYC–HA ChIP-seq peaks. (C) Heatmap of the combined average normalized peak intensity in 100 bp bins for MYC-HA peaks that were significantly changed (false discovery rate [FDR] < 0.05 and |log2FC| > 0.7) for both the 4A and VP16 HBM mutants, and were within ±2 kb of a TSS. (D) Example IGV screenshots of regions that had significant (top) or non-significant (bottom) changes for MYC-HA or HCF-1N by ChIP-seq. Asterisks mark the peaks that were significantly changed compared to WT. (E) ChIP, using anti-HA antibody, was performed on parental or switchable Ramos cells treated for 24 hr with 20 nM 4-OHT. Enrichment of genomic DNA was monitored by qPCR using primers that amplify across peaks. HBB is a negative locus for HA-MYC. ChIP efficiency was measured based on the percent recovery from input DNA. Shown are the mean and standard error for three biological replicates.
-
Figure 6—source data 1
MYC-HA ChIP-seq peaks significantly (false discovery rate [FDR] < 0.05) affected by 4A and VP16 host cell factor (HCF)–1-binding motif mutants.
- https://cdn.elifesciences.org/articles/60191/elife-60191-fig6-data1-v1.xlsx
Figure 6—figure supplement 1
Impact of host cell factor (HCF)–1-binding motif (HBM) mutations on MYC and HCF-1 binding to chromatin.
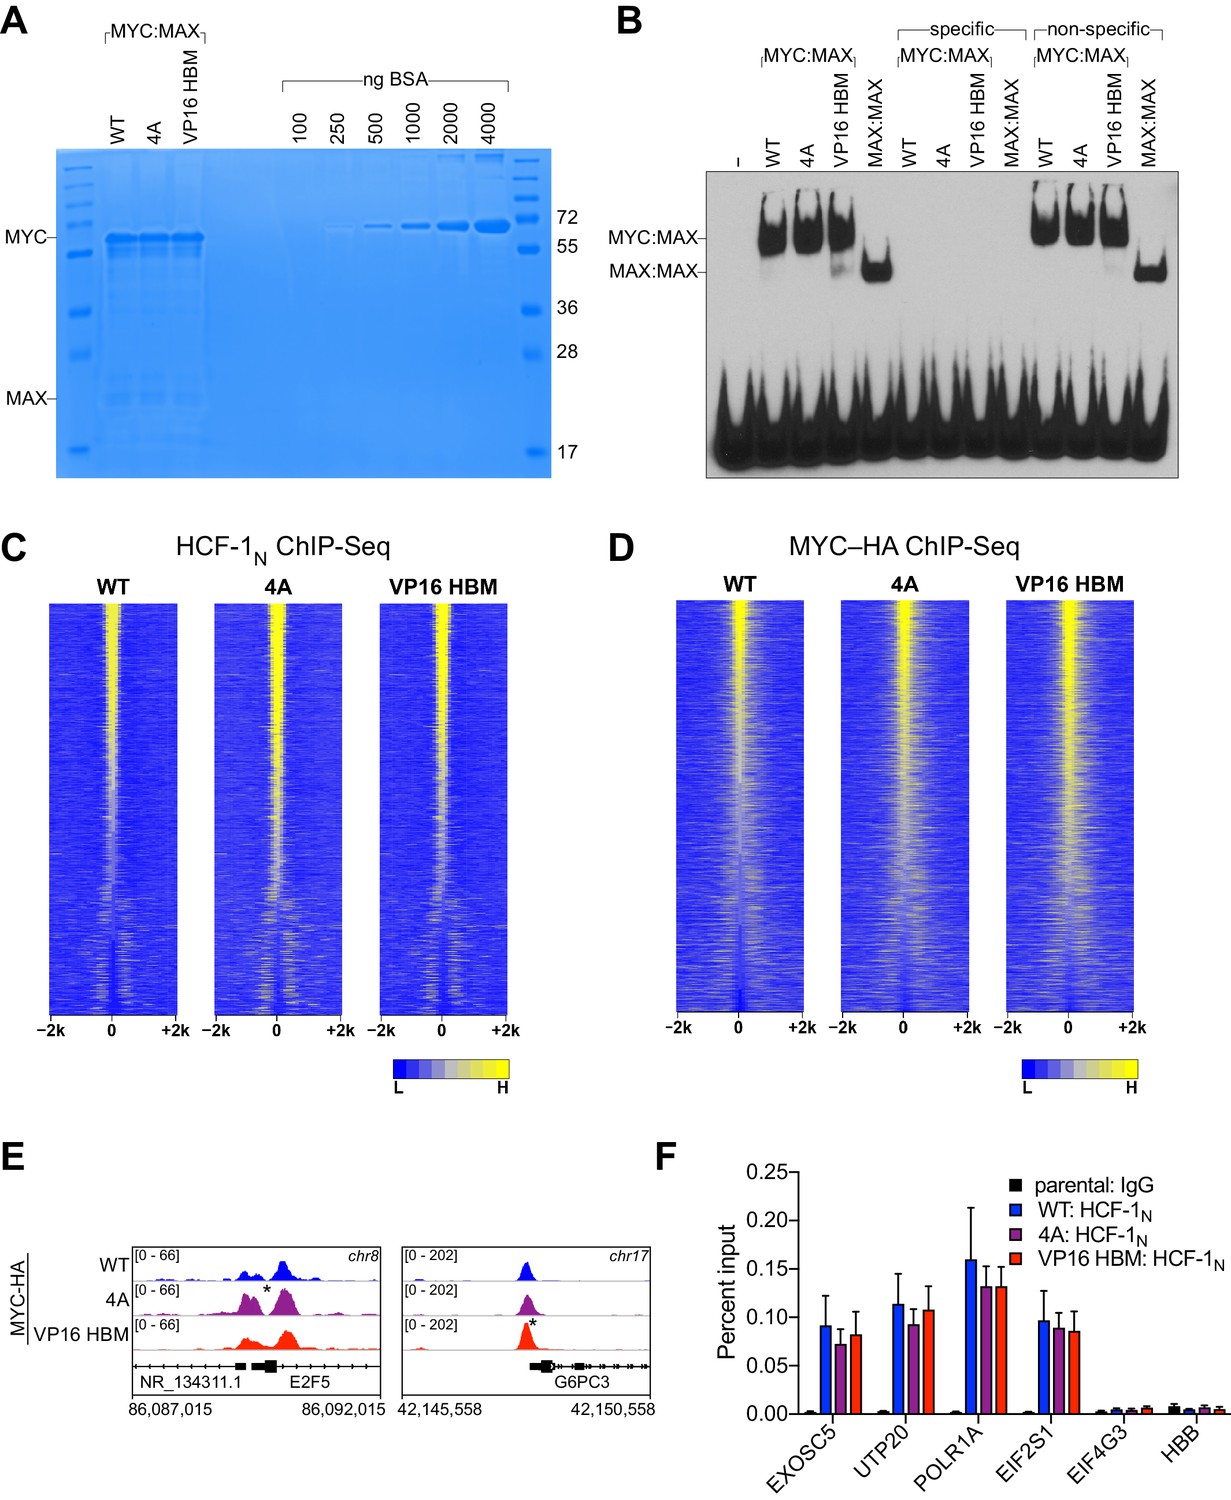
(A) Recombinant MYC (wild-type [WT], 4A, or VP16 HBM):MAX dimers used in these assays. Dimers were separated by SDS-PAGE alongside a BSA standard and stained using Coomassie Brilliant Blue. (B) Electrophoretic mobility shift assay (EMSA) using recombinant MYC:MAX and MAX:MAX dimers incubated with a biotinylated E-box probe (5′-GCTCAGGGACCACGTGGTCGGGGATC-3′). Binding reactions were conducted with or without 100-fold excess of unlabeled specific (as above) or nonspecific (5′-GCTCAGGGACCAGCTGGTCGGGGATC-3′) competitors. (C and D) Heatmap of the combined average normalized peak intensity in 100 bp bins for all HCF-1N (C) or MYC-HA (D) ChIP-Seq peaks that were within ±2 kb of a TSS, and scaled across each of the cell lines. For clarity in (D), some low-signal data points are excluded. (E) Example IGV screenshots of regions that had significant changes for MYC-HA by ChIP-seq. Asterisks mark the peaks that were significantly changed compared to WT. (F) ChIP, using anti-HCF-1N antibody, was performed on parental or switchable Ramos cells treated for 24 hr with 20 nM 4-OHT. Enrichment of genomic DNA was monitored by qPCR using primers that amplify across peaks. EIF4G3 and HBB are negative loci for HCF-1N. ChIP efficiency was measured based on the percent recovery from input DNA. Shown are the mean and standard error for three biological replicates.
Figure 7 with 1 supplement
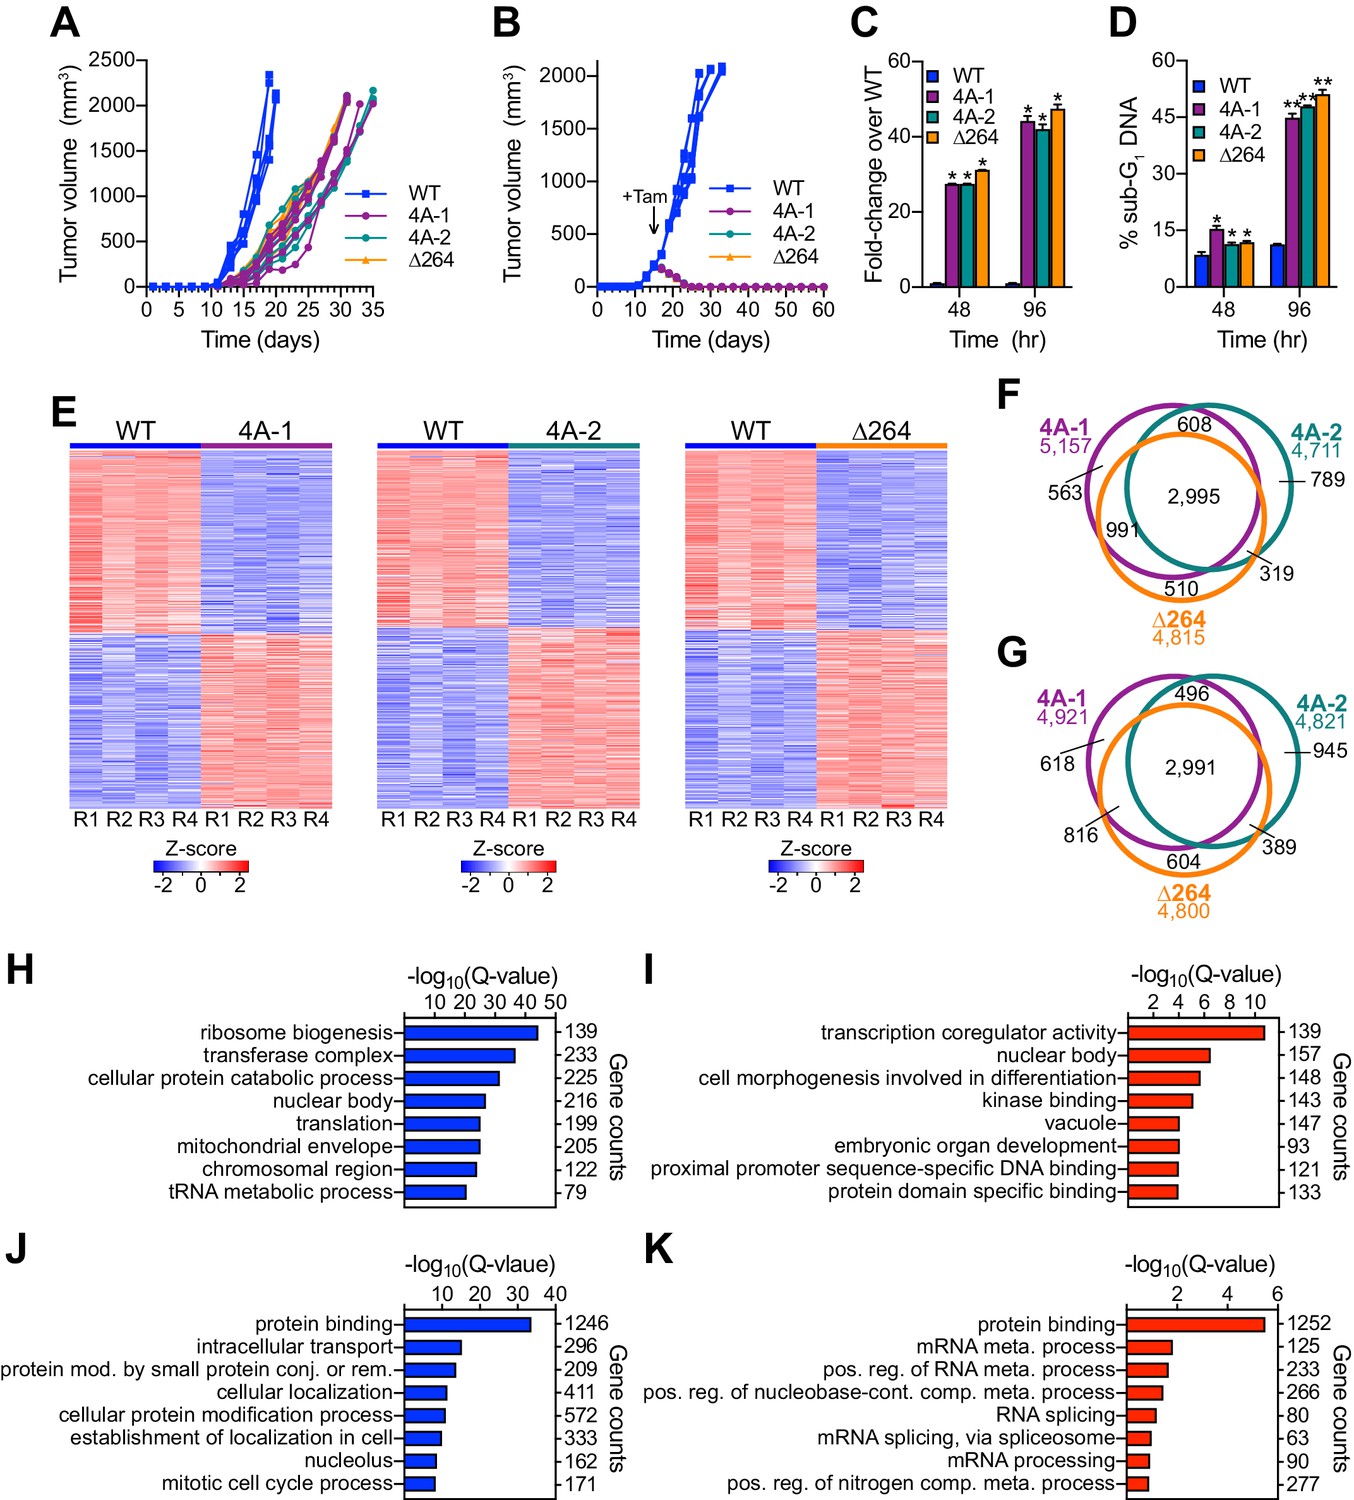
The MYC–host cell factor (HCF)–1 interaction is required for tumor engraftment and maintenance.
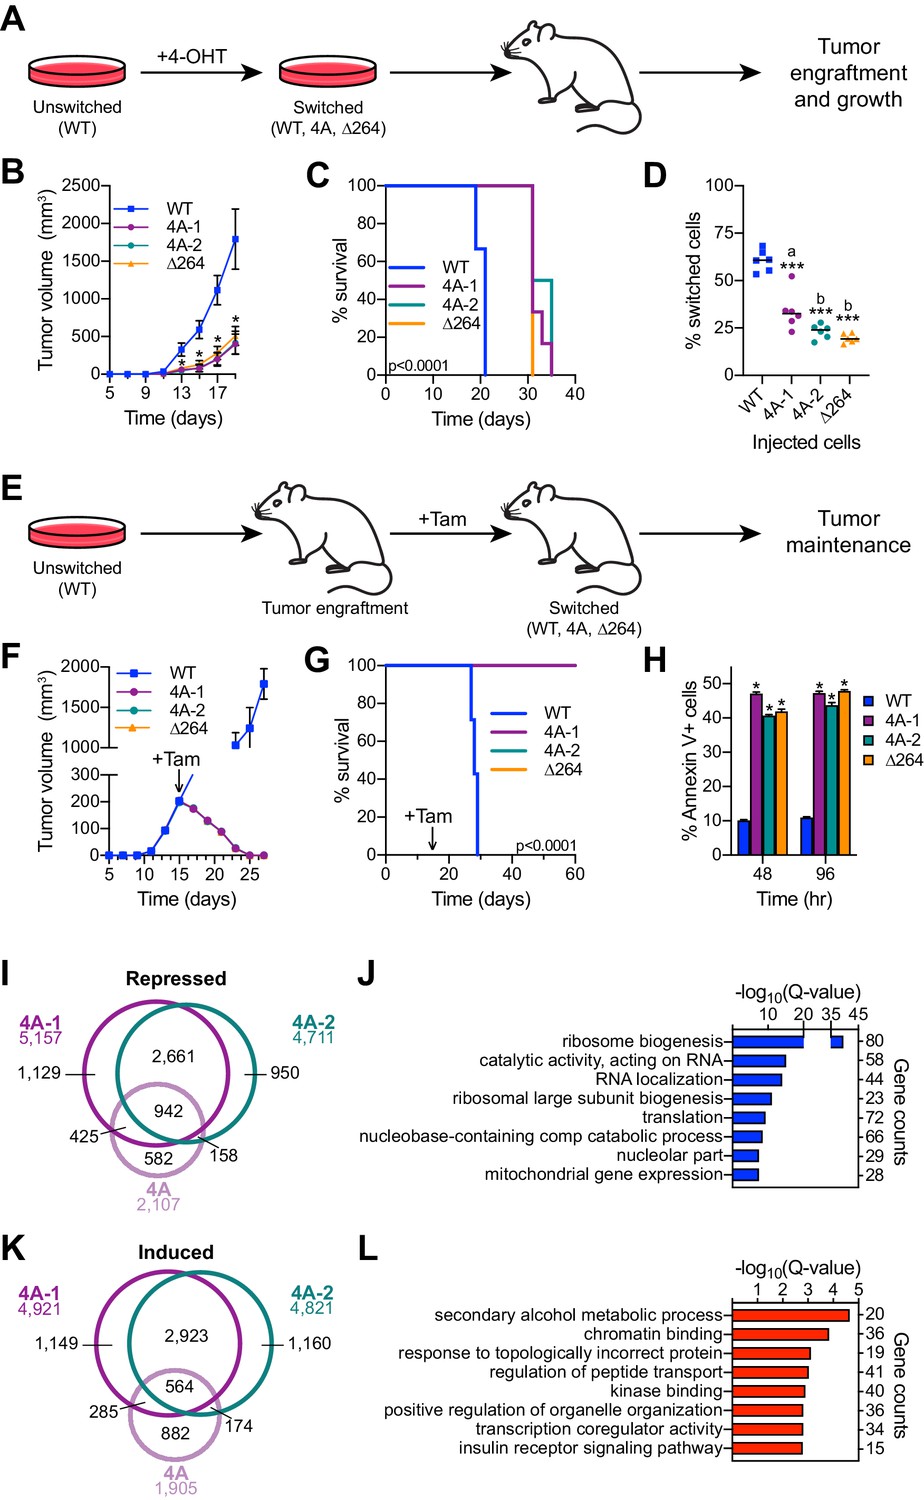
(A) Tumor engraftment schema: wild-type (WT), 4A-1, 4A-2, and ∆264 cells are switched in culture prior to injection into flank of nude mice to test the impact of the mutations on tumor engraftment and growth. (B) Average tumor volume over time following injection of switched cells. Shown are the mean and standard error for six mice each. Only days 5–19 are shown here; the full course of the experiment is depicted in Figure 7—figure supplement 1A. Student’s t-test between WT and each of the mutants was used to calculate p-value; *p<0.000043. (C) Kaplan–Meier survival curves of mice (n = 6 of each) injected with switched cells. Log-rank test was used to calculate p-value (<0.0001) from six biological replicates. (D) PCR assays of genomic DNA were used to determine the proportion of switched cells present in each tumor after sacrifice. Each dot represents an individual tumor, and the line indicates the mean for each group. Student’s t-test between WT and each of the mutants was used to calculate p-values; a = 0.0002, b < 0.0001. (E) Tumor maintenance schema: Unswitched WT, 4A-1, 4A-2, and ∆264 cells were injected into the flanks of nude mice. Tumors were grown until day 15, at which point mice received tamoxifen injections (one per day for 3 days) to induce switching of the cells. (F) Average tumor volume before and after cells were switched. The day at which tamoxifen (Tam) administration was initiated is indicated with an arrow. Shown are the mean and standard error for seven mice for WT and six mice for 4A-1, 4A-2, and ∆264 cells. (G) Kaplan–Meier survival curves of mice in the tumor maintenance assay (n = 7 for WT, and n = 6 for 4A-1, 4A-2, and ∆264). The day at which tamoxifen (Tam) administration was initiated is indicated with an arrow. Log-rank test was used to calculate p-value (<0.0001). (H) Annexin V staining and flow cytometry were performed on cells isolated from tumors at 48 and 96 hr following the first tamoxifen administration to determine the extent of apoptosis. Shown are the mean and standard error for four mice each. Student’s t-test between WT and each of the mutants was used to calculate p-value; *p<0.000001. (I) Venn diagram showing the relationship between transcripts significantly (false discovery rate [FDR] < 0.05) decreased in the 4A cell line and the 4A-1 and 4A-2 tumors. (J) Gene ontology (GO) enrichment analysis of transcripts significantly (FDR < 0.05) decreased in the 4A cell line and the 4A-1 and 4A-2 tumors. (K) Venn diagram showing the overlap of transcripts significantly (FDR < 0.05) increased in the 4A cell line and the 4A-1 and 4A-2 tumors. (L) GO enrichment analysis of transcripts significantly (FDR < 0.05) increased in the 4A cell line and the 4A-1 and 4A-2 tumors.
-
Figure 7—source data 1
Tumor volumes for engraftment and maintenance assays.
- https://cdn.elifesciences.org/articles/60191/elife-60191-fig7-data1-v1.xlsx
-
Figure 7—source data 2
Tumor RNA-Seq significant changes.
- https://cdn.elifesciences.org/articles/60191/elife-60191-fig7-data2-v1.xlsx
Figure 7—figure supplement 1
Disruption of the MYC−host cell factor (HCF)–1 interaction in vivo.
(A) Tumor volumes for individual mice in the tumor engraftment assay. (B) Tumor volumes for individual mice in the tumor maintenance assay. The day at which tamoxifen (Tam) administration was initiated is indicated with an arrow. (C) Caspase activity in cells isolated from tumors (n = 4 each) at 48 and 96 hr following the first tamoxifen administration was measured. Shown are the mean and standard error for the fold-change (FC) over wild type (WT) for each. Student’s t-test between WT and each of the mutants was used to calculate p-value; *p<0.000001. (D) Propidium staining and flow cytometry were performed on cells isolated from four tumors each at 48 and 96 hr following the first tamoxifen administration to determine the extent of cell death. Shown are the mean and standard error. Student’s t-test between WT and each of the mutants was used to calculate p-value; *p<0.000628, **p<0.000001. (E) z-transformed RNA-Seq data from tumors (n = 4) extracted after switching, ranked by FC. Transcripts that were significantly (false discovery rate [FDR] < 0.05) impacted compared to WT are shown. (F) Venn diagram showing the overlap of transcripts significantly (FDR < 0.05) decreased in the 4A-1, 4A-2, and ∆264 tumors. (G) Venn diagram showing the relationship of transcripts significantly (FDR < 0.05) increased in the 4A-1, 4A-2, and ∆264 tumors. (H) Gene ontology (GO) enrichment analysis of transcripts with significantly (FDR < 0.05) decreased expression in the 4A-1, 4A-2, and ∆264 tumors. (I) GO enrichment analysis of transcripts significantly (FDR < 0.05) increased in the 4A-1, 4A-2, and ∆264 tumors. (J) GO enrichment analysis of transcripts significantly (FDR < 0.05) decreased in vivo only (4A-1 and 4A-2 tumors, but not the 4A cell line). (K) GO enrichment analysis of transcripts significantly (FDR < 0.05) increased in vivo only (4A-1 and 4A-2 tumors, but not the 4A cell line).
Tables
Table 1
Loss of the MYC–host cell factor (HCF)–1 interaction promotes amino acid accumulation.
Modulating the MYC–HCF-1 interaction alters intracellular amino acid levels. All data are derived from switchable Ramos cells treated with 20 nM 4-OHT for 24 hr. Amino acid levels were measured following separations by hydrophilic interaction liquid chromatography (HILIC). Q-values and fold-changes (FCs) were calculated between the mutants and wild-type (WT). Five biological replicates for WT and VP16 HCF-1-binding motif (HBM) and four biological replicates for 4A were analyzed. Q-value < 0.05 are highlighted in green, FC > 0 in red, and FC < 0 in blue. Confidence levels reflect the confidence in metabolite identification; L1 is validated, L2 is putative, and L3 is tentative. ND = not detected; NS = not significant.
| 4A | VP16 HBM | Confidence level | |||
|---|---|---|---|---|---|
| Q-value | FC | Q-value | FC | ||
| Glycine | 2.52E-04 | 1.31 | 3.11E-05 | −1.48 | L3 |
| L-alanine | 9.97E-05 | 1.62 | NS | L2 | |
| L-arginine | 2.31E-02 | 1.18 | NS | L1 | |
| L-asparagine | 6.67E-05 | 1.5 | 2.02E-03 | −1.23 | L2 |
| L-aspartic acid | 1.24E-03 | −1.37 | 1.54E-05 | 2.01 | L2 |
| L-cysteine | ND | ND | |||
| L-glutamic acid | 2.53E-03 | 1.46 | NS | L2 | |
| L-glutamine | 2.33E-05 | 1.46 | 9.38E-05 | −1.41 | L2 |
| L-histidine | 8.70E-05 | 1.64 | NS | L2 | |
| L-isoleucine | 1.10E-03 | 1.39 | 2.36E-02 | −1.21 | L2 |
| L-leucine | 8.63E-04 | 1.33 | 2.55E-02 | −1.18 | L2 |
| L-lysine | 1.66E-02 | 1.19 | NS | L2 | |
| L-methionine | 6.51E-05 | 1.61 | 4.39E-03 | −1.27 | L2 |
| L-phenylalanine | 4.71E-04 | 1.48 | 3.46E-02 | −1.22 | L2 |
| L-proline | 1.01E-02 | 1.17 | NS | L2 | |
| L-serine | 7.48E-05 | 1.59 | NS | L1 | |
| L-threonine | 9.63E-05 | 1.54 | 1.25E-02 | −1.17 | L2 |
| L-tryptophan | 1.56E-04 | 1.64 | NS | L1 | |
| L-tyrosine | 1.22E-04 | 1.59 | 1.9E-02 | −1.18 | L2 |
| L-valine | 4.41E-02 | 1.14 | NS | L3 | |
Key resources table
| Reagent type (species) or resource | Designation | Source or reference | Identifiers | Additional information |
|---|---|---|---|---|
| Gene (Homo sapiens) | MYC | NA | UniProt ID: P01106 | |
| Gene (Homo sapiens) | HCFC1 | NA | UniProt ID: P51610 | |
| Strain, strain background (Escherichia coli) | Rosetta (DE3) Competent Cells | Millipore | Cat#: 70954 | |
| Strain, strain background (Escherichia coli) | XL1-Blue Competent Cells | Agilent Technologies | Cat#: 200249 | |
| Cell line (Homo sapiens) | Ramos | ATCC | Cat#: CRL-1596; RRID:CVCL_0597 | |
| Cell line (Homo sapiens) | Ramos Cre-ERT2 | Thomas et al., 2019 | NA | |
| Cell line (Homo sapiens) | Ramos Cre-ERT2 MYC-WT | Thomas et al., 2019 | NA | |
| Cell line (Homo sapiens) | Ramos Cre-ERT2 MYC-Δ264 | Thomas et al., 2019 | NA | |
| Cell line (Homo sapiens) | Ramos Cre-ERT2 MYC-4A | This paper | NA | See section ‘Generation of switchable MYC allele Ramos cell lines’ |
| Cell line (Homo sapiens) | Ramos Cre-ERT2 MYC-VP16 HBM | This paper | NA | See section ‘Generation of switchable MYC allele Ramos cell lines’ |
| Cell line (Homo sapiens) | Ramos FKBPFV-HCF-1N | This paper | NA | See section ‘Generation of dTAG Ramos cell lines’ |
| Antibody | Rabbit anti-HCF-1C polyclonal | Bethyl Laboratories | Cat#: A301-399A; RRID:AB_961012 | Western blotting (1:1000) |
| Antibody | Rabbit anti-HCF-1N polyclonal | Machida et al., 2009 | NA | Western blotting (1:10,000), ChIP (6 μl) |
| Antibody | Rabbit anti-c-MYC (Y69) monoclonal | Abcam | Cat#: ab32072; RRID:AB_731658 | Western blotting (1:10,000), IP (2 μg) |
| Antibody | Rabbit anti-HA (C29F4) monoclonal | Cell Signaling Technology | Cat#: 3724; RRID:AB_1549585 | Western blotting (1:4000), ChIP (5 μl), IF (1:500) |
| Antibody | Rabbit anti-WDR5 (D9E1I) monoclonal | Cell Signaling Technology | Cat#: 13105; RRID:AB_2620133 | Western blotting (1:1000) |
| Antibody | Rabbit anti-IgG polyclonal | Cell Signaling Technology | Cat#: 2729; RRID:AB_1031062 | IP (2 μg), ChIP (0.8 μg) |
| Antibody | Mouse anti-FLAG (M2) monoclonal (HRP) | Sigma-Aldrich | Cat#: A8592; RRID:AB_439702 | Western blotting (1:10,000 or 1:50,000) |
| Antibody | Mouse anti-T7 monoclonal (HRP) | Millipore | Cat#: 69048; RRID:AB_11212778 | Western blotting (1:10,000) |
| Antibody | Mouse anti-GAPDH (GA1R) monoclonal (HRP) | Thermo Fisher Scientific | Cat#: MA5-15738-HRP; RRID:AB_2537659 | Western blotting (1:50,000) |
| Antibody | Rabbit anti-GAPDH (D16H11) monoclonal (HRP) | Cell Signaling Technology | Cat#: 8884; RRID:AB_11129865 | Western blotting (1:2500) |
| Antibody | Rabbit anti-α-Tubulin (11H10) monoclonal (HRP) | Cell Signaling Technology | Cat#: 11H10; RRID:AB_10695471 | Western blotting (1:5000) |
| Antibody | Rabbit anti-histone H3 (D1H2) XP monoclonal (HRP) | Cell Signaling Technology | Cat#: 12648; RRID:AB_2797978 | Western blotting (1:5000) |
| Antibody | Goat anti-rabbit IgG polyclonal (HRP) | Thermo Fisher Scientific | Cat#: 31463; RRID:AB_228333 | Western blotting (1:5000) |
| Antibody | Mouse anti-rabbit IgG monoclonal, light chain specific (HRP) | Jackson ImmunoResearch Labs | Cat#: 211-032-171; RRID:AB_2339149 | Western blotting (1:5000) |
| Antibody | Goat anti-rabbit IgG polyclonal (Alexa Fluor 594) | Thermo Fisher Scientific | Cat#: A11012; RRID:AB_2534079 | IF (1:350) |
| Other | Anti-FLAG M2 affinity gel | Sigma-Aldrich | Cat#: A2220; RRID:AB_10063035 | IP (20 μl bed volume) |
| Other | Protein A Agarose | Roche | Cat#: 11134515001 | IP/ChIP (20 μl bed volume) |
| Recombinant DNA reagent | pCRIS-mCherry-FLAG-dTAG-HCFC1 | This paper | NA | See section ‘Generation of dTAG Ramos cell lines’ |
| Recombinant DNA reagent | pGuide-HCFC1-N | This paper | NA | See section ‘Generation of dTAG Ramos cell lines’ |
| Recombinant DNA reagent | pX330-U6-Chimeric_BB-CBh-hSpCas9 | Addgene | Cat#: 42230; RRID:Addgene_42230 | |
| Recombinant DNA reagent | MYC-WT targeting vector | Thomas et al., 2019 | NA | |
| Recombinant DNA reagent | MYC-4A targeting vector | This paper | NA | See section ‘Generation of switchable MYC allele Ramos cell lines’ |
| Recombinant DNA reagent | MYC-VP16 HBM targeting vector | This paper | NA | See section ‘Generation of switchable MYC allele Ramos cell lines’ |
| Recombinant DNA reagent | pGuide-MYC1 | This paper | NA | See section ‘Generation of switchable MYC allele Ramos cell lines’ |
| Recombinant DNA reagent | pFLAG-C2 | Thomas et al., 2015 | NA | |
| Recombinant DNA reagent | pFLAG-MYC WT | Thomas et al., 2015 | NA | |
| Recombinant DNA reagent | pFLAG-MYC 4A | This paper | NA | See section ‘Transient transfection, western blotting, and immunoprecipitation’ |
| Recombinant DNA reagent | pFLAG-MYC H307G | This paper | NA | See section ‘Transient transfection, western blotting, and immunoprecipitation’ |
| Recombinant DNA reagent | pFLAG-MYC VP16 HBM | This paper | NA | See section ‘Transient transfection, western blotting, and immunoprecipitation’ |
| Recombinant DNA reagent | pFLAG-MYC VP16 HBM H307G | This paper | NA | See section ‘Transient transfection, western blotting, and immunoprecipitation’ |
| Recombinant DNA reagent | pFLAG-MYC WBM | Thomas et al., 2015 | NA | |
| Recombinant DNA reagent | pSUMO-MYC WT-FLAG | Thomas et al., 2015 | NA | |
| Recombinant DNA reagent | pSUMO-MYC 4A-FLAG | This paper | NA | See section ‘In vitro binding assays’ |
| Recombinant DNA reagent | pSUMO-MYC VP16 HBM-FLAG | This paper | NA | See section ‘In vitro binding assays’ |
| Recombinant DNA reagent | pT7-IRES His-T7-HCF-1VIC | This paper | NA | See section ‘In vitro binding assays’ |
| Recombinant DNA reagent | pRSET-6XHis-MYC WT | Farina et al., 2004 | NA | |
| Recombinant DNA reagent | pRSET-6XHis-MYC 4A | This paper | NA | See section ‘Electrophoretic mobility shift assays’ |
| Recombinant DNA reagent | pRSET-6XHis-MYC VP16 HBM | This paper | NA | See section ‘Electrophoretic mobility shift assays’ |
| Commercial assay or kit | Q5 DNA Polymerase | NEB | Cat#: M0491 | |
| Commercial assay or kit | OneTaq DNA Polymerase | NEB | Cat#: M0480 | |
| Commercial assay or kit | Gibson Assembly Cloning Kit | NEB | Cat#: E5510 | |
| Commercial assay or kit | LightShift Chemiluminescent EMSA Kit | Thermo Fisher | Cat#: 20148 | |
| Chemical compound, drug | DMSO | Sigma-Aldrich | Cat#: D2650 | |
| Chemical compound, drug | dTAG-47 | Vanderbilt Institute of Chemical Biology Synthesis Core | ||
| Software, algorithm | PRISM 8 | GraphPad | RRID:SCR_002798 | https://www.graphpad.com/scientific-software/prism/ |
| Software, algorithm | FACSDiva 8.0 | BD Biosciences | RRID:SCR_001456 | https://www.bdbiosciences.com/en-us/instruments/research-instruments/research-software/flow-cytometry-acquisition/facsdiva-software |
| Software, algorithm | FlowJo | FlowJo | RRID:SCR_008520 | https://www.flowjo.com/ |
| Software, algorithm | MetaboAnalyst 4.0 | Chong et al., 2019 | RRID:SCR_015539 | https://www.metaboanalyst.ca/ |
| Software, algorithm | Metascape | Zhou et al., 2019 | RRID:SCR_016620 | https://metascape.org/ |
| Software, algorithm | DAVID | Huang et al., 2009a, Huang et al., 2009b | RRID:SCR_001881 | https://david.ncifcrf.gov/ |
Additional files
-
Supplementary file 1
Primer sequences.
- https://cdn.elifesciences.org/articles/60191/elife-60191-supp1-v1.xlsx
-
Supplementary file 2
Next-generation sequencing read counts.
- https://cdn.elifesciences.org/articles/60191/elife-60191-supp2-v1.xlsx
-
Transparent reporting form
- https://cdn.elifesciences.org/articles/60191/elife-60191-transrepform-v1.docx
Download links
A two-part list of links to download the article, or parts of the article, in various formats.
Downloads (link to download the article as PDF)
Open citations (links to open the citations from this article in various online reference manager services)
Cite this article (links to download the citations from this article in formats compatible with various reference manager tools)
MYC regulates ribosome biogenesis and mitochondrial gene expression programs through its interaction with host cell factor–1
eLife 10:e60191.
https://doi.org/10.7554/eLife.60191


