Emergence and propagation of epistasis in metabolic networks
- Division of Biological Sciences, University of California, San Diego, United States
Figures
Figure 1
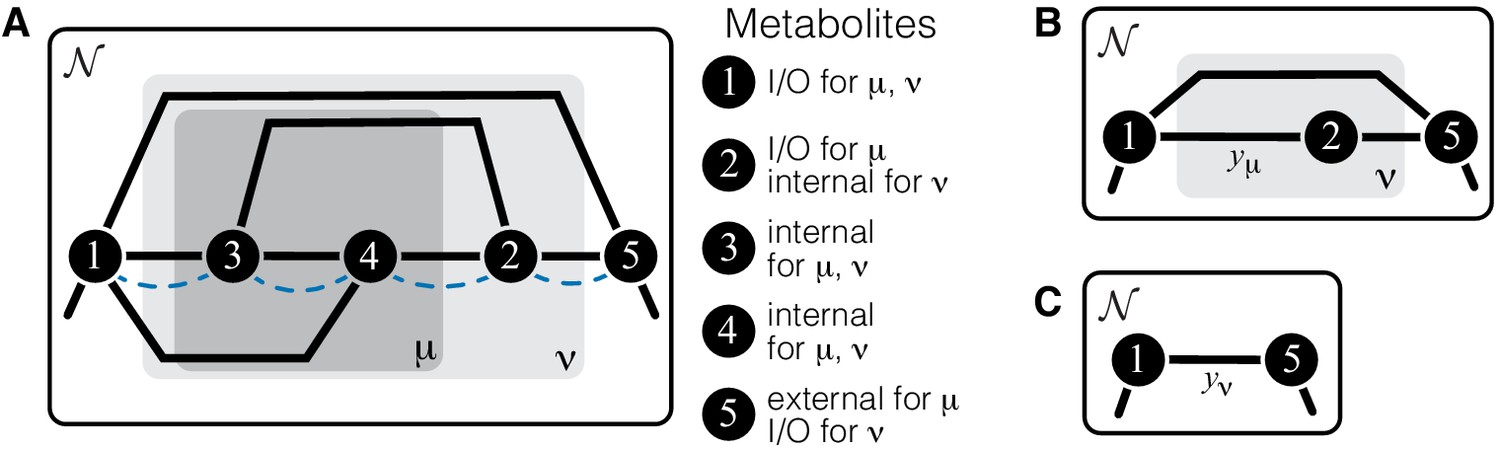
Illustration of a hierarchical metabolic network and its coarse-graining.
(A) White rectangle represents the whole metabolic network . Example subnetworks μ and ν are represented by the dark and light gray rectangles. Only metabolites and reactions that belong to these subnetworks are shown; other metabolites and reactions in are not shown. Metabolites 1 and 5 may be adjacent to other metabolites in ; this fact is represented by short black lines that do not terminate in metabolites. Subnetworks μ and ν are both modules because there exists a simple path connecting their I/O metabolites that lies within μ and ν and contains all their internal metabolites (dashed blue line). (B) Network can be coarse-grained by replacing module μ at steady state with an effective reaction between its I/O metabolites 1 and 2, with the rate constant is . (C) Network can be coarse-grained by replacing module ν at steady state with an effective reaction between its I/O metabolites 1 and 5, with the rate constant is .
Figure 2
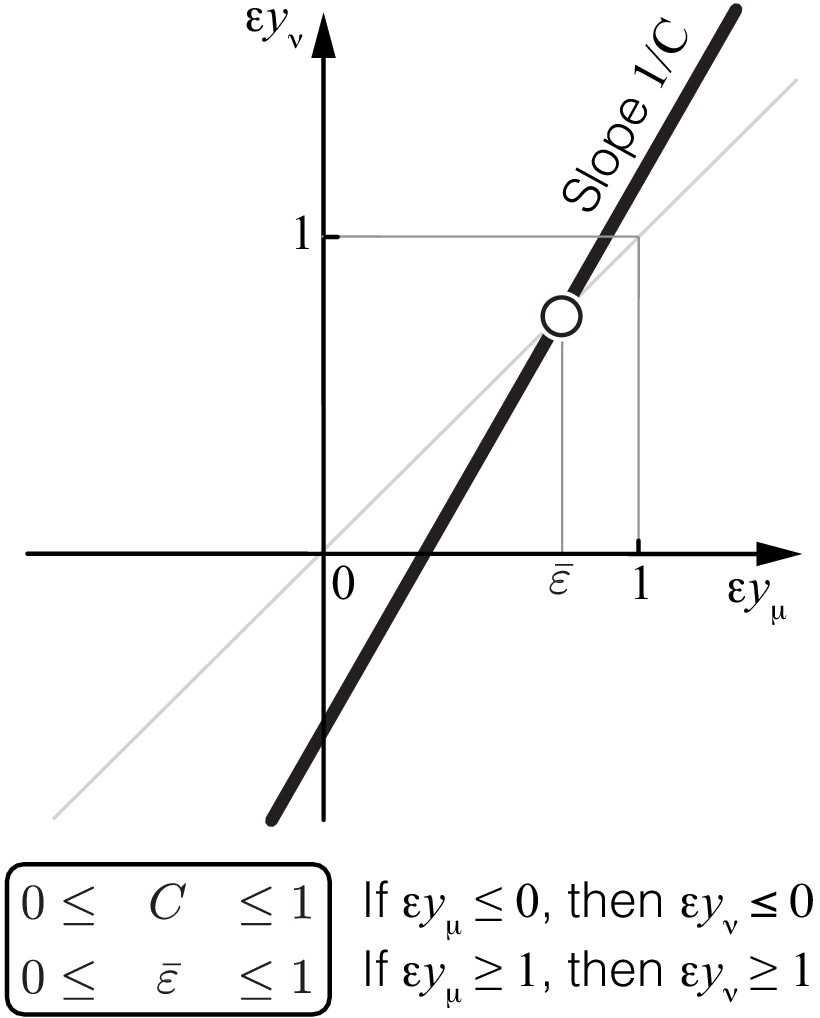
Propagation of epistasis.
Properties of Equation 6 that maps lower-level epistasis onto higher-level epistasis . Slope and fixed point depend on the topology and the rate constants of the higher-level module ν, but they are bounded, as shown. Thus, the fixed point of this map lies between 0 and 1 and is always unstable (open circle).
Figure 3
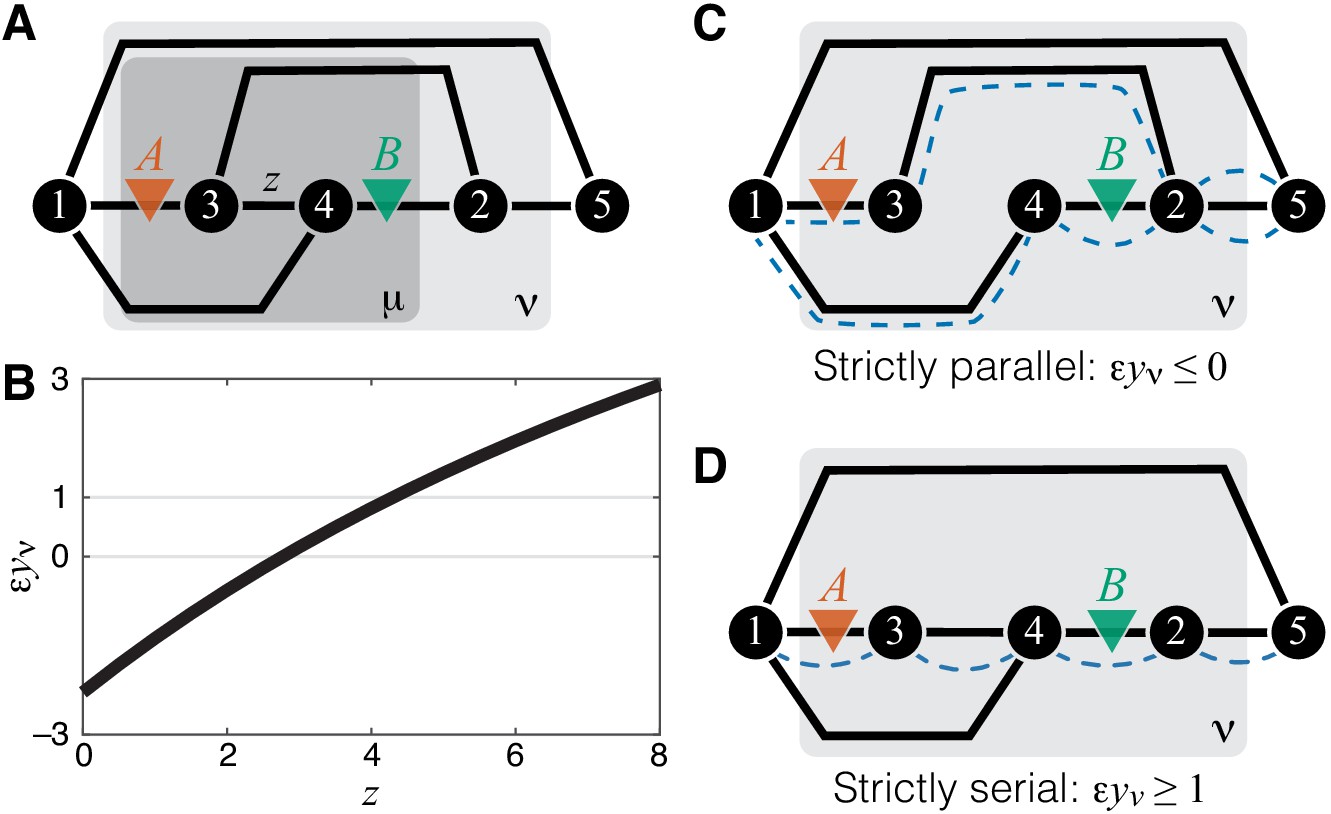
Emergence of epistasis and its dependence on the topological relationship between the reactions affected by mutations.
(A) An example of a simple module ν (same as in Figure 1A) where negative, weak positive and strong positive epistasis can emerge between two mutations A and B. (B) Epistasis between mutations A and B at the level of module ν depicted in (A) as a function of the rate constant of a third reaction. The values of other parameters of the network are given in Materials and Methods. (C) An example of a simple module where reactions affected by mutations are strictly parallel. In such cases, epistasis for the effective rate constant is non-positive. Dashed blue lines highlight paths that connect the I/O metabolites and each contain only one of the affected reactions. (D) An example of a simple module where reactions affected by mutations are strictly serial. In such cases, epistasis for the effective rate constant is equal to or greater than 1 (i.e. strongly positive). Dashed blue line highlights a path that connects the I/O metabolites and contains both affected reactions.
Figure 4 with 3 supplements
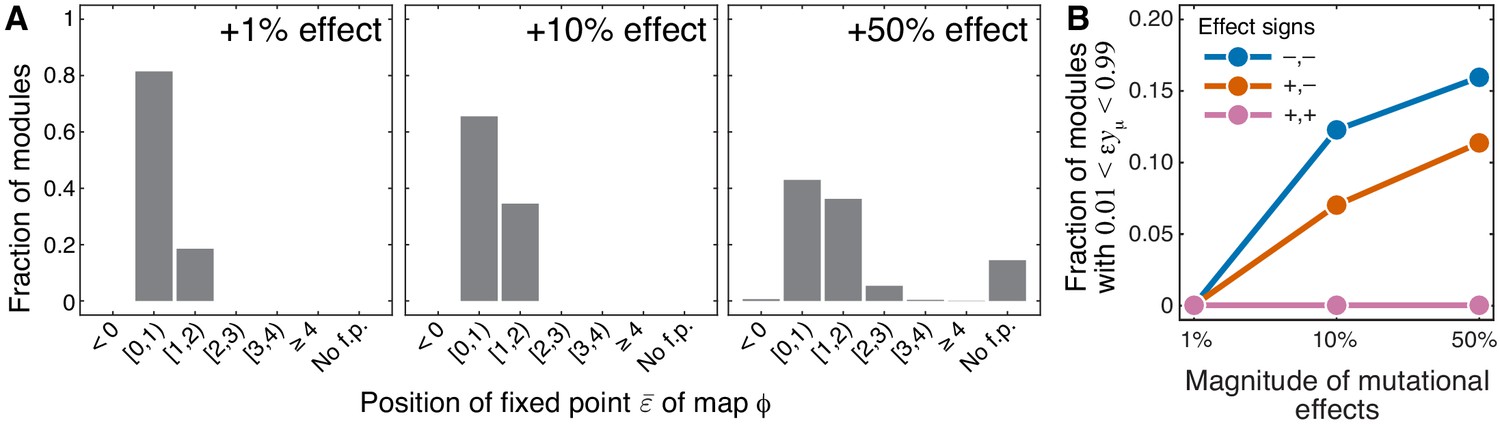
Sensitivity of results of Theorem 1 and Theorem 2 with respect to the magnitude of mutational effects.
(A) Distribution of the position of the fixed point of the function that maps lower-level epistasis onto higher-level epistasis in modules with random parameters and for mutations with positive effects on (see text and Materials and methods for details). All cases are shown in Figure 4—figure supplement 1 and Figure 4—figure supplement 2. The effect size of both mutations is indicated on each panel. ‘No f.p'. indicates that no fixed point exists. (B) Fraction of sampled modules (averaged across generating topologies) where mutations affect strictly serial reactions but the epistasis coefficient is less than 1, contrary to the statement of Theorem 2 (see text and Materials and methods for details). All cases stratified by generating topology are shown in Figure 4—figure supplement 3.
Figure 4—figure supplement 1
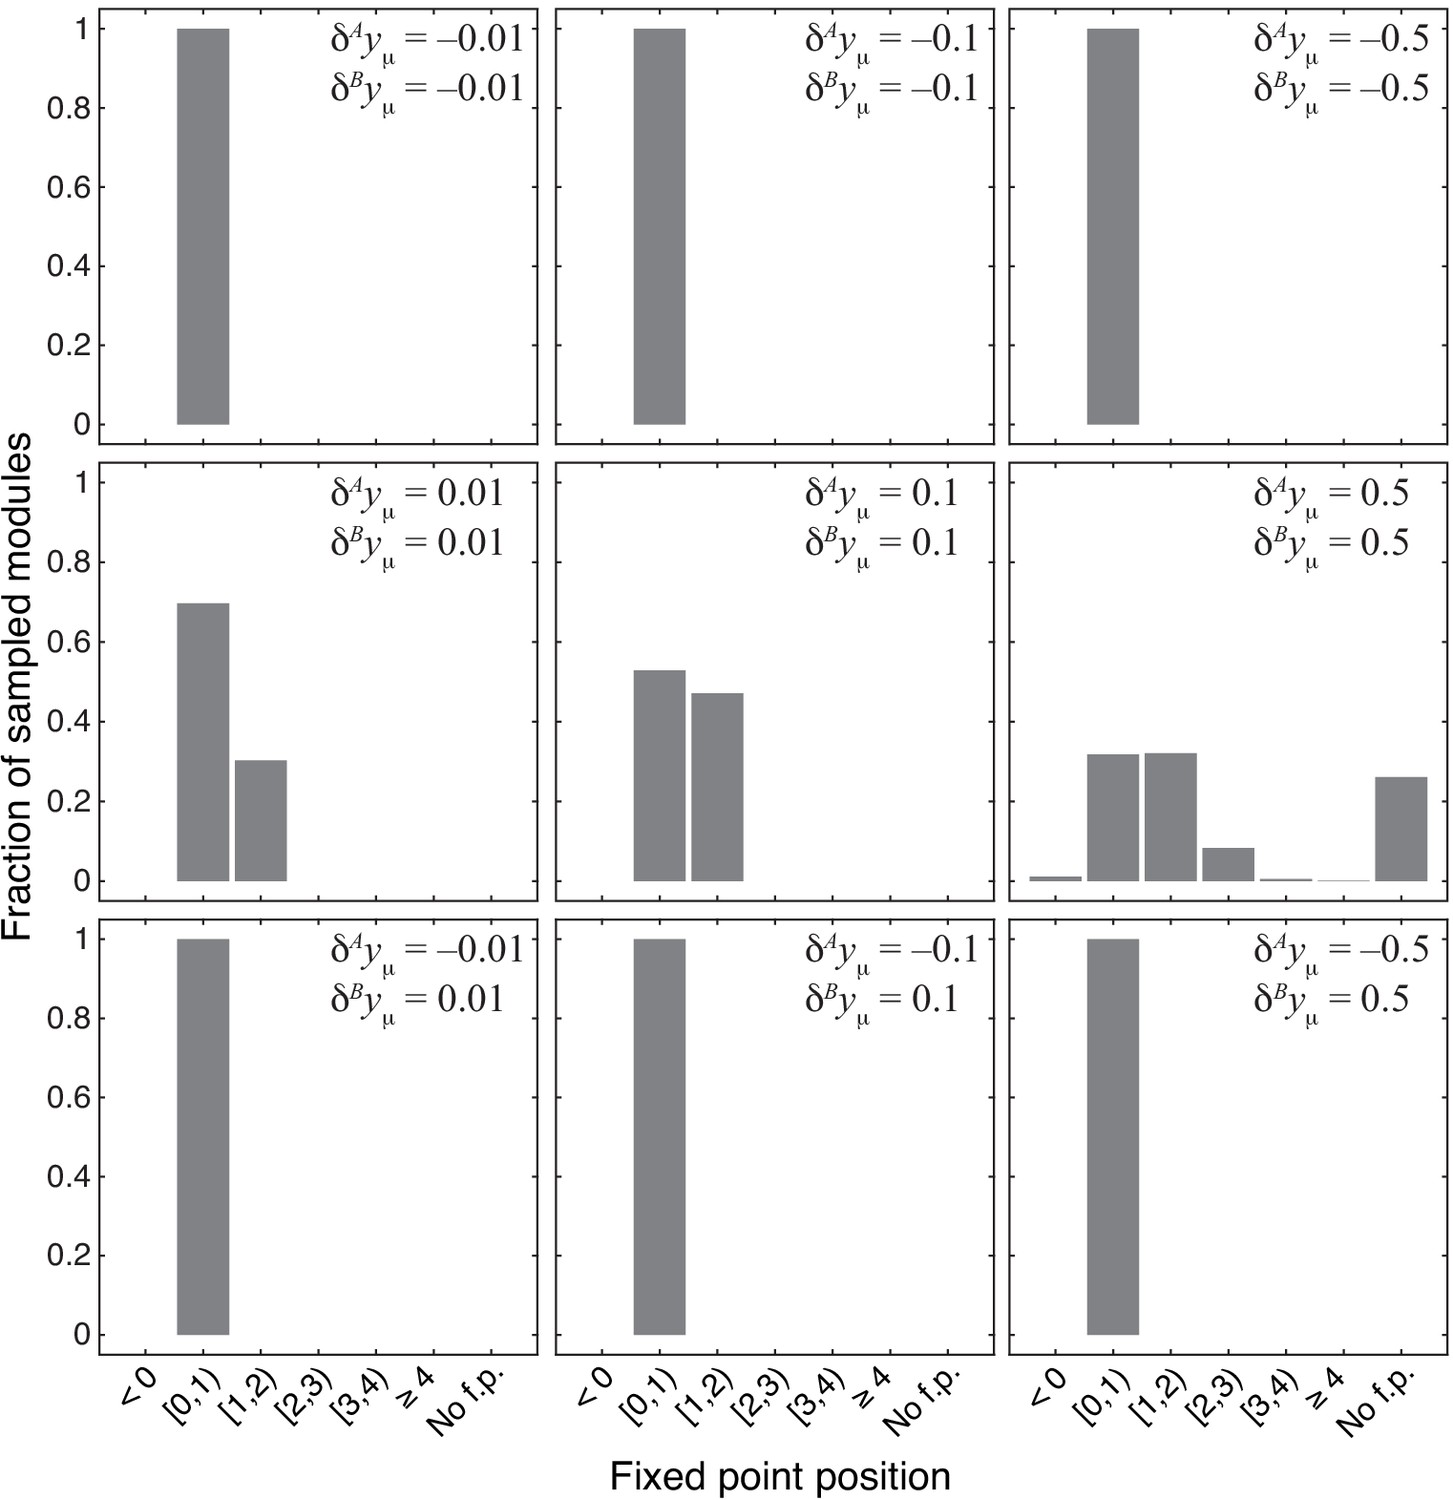
Distribution of the position of the fixed point in 1000 modules from the topological class with random parameters.
Notations are as in Figure 4.
Figure 4—figure supplement 2
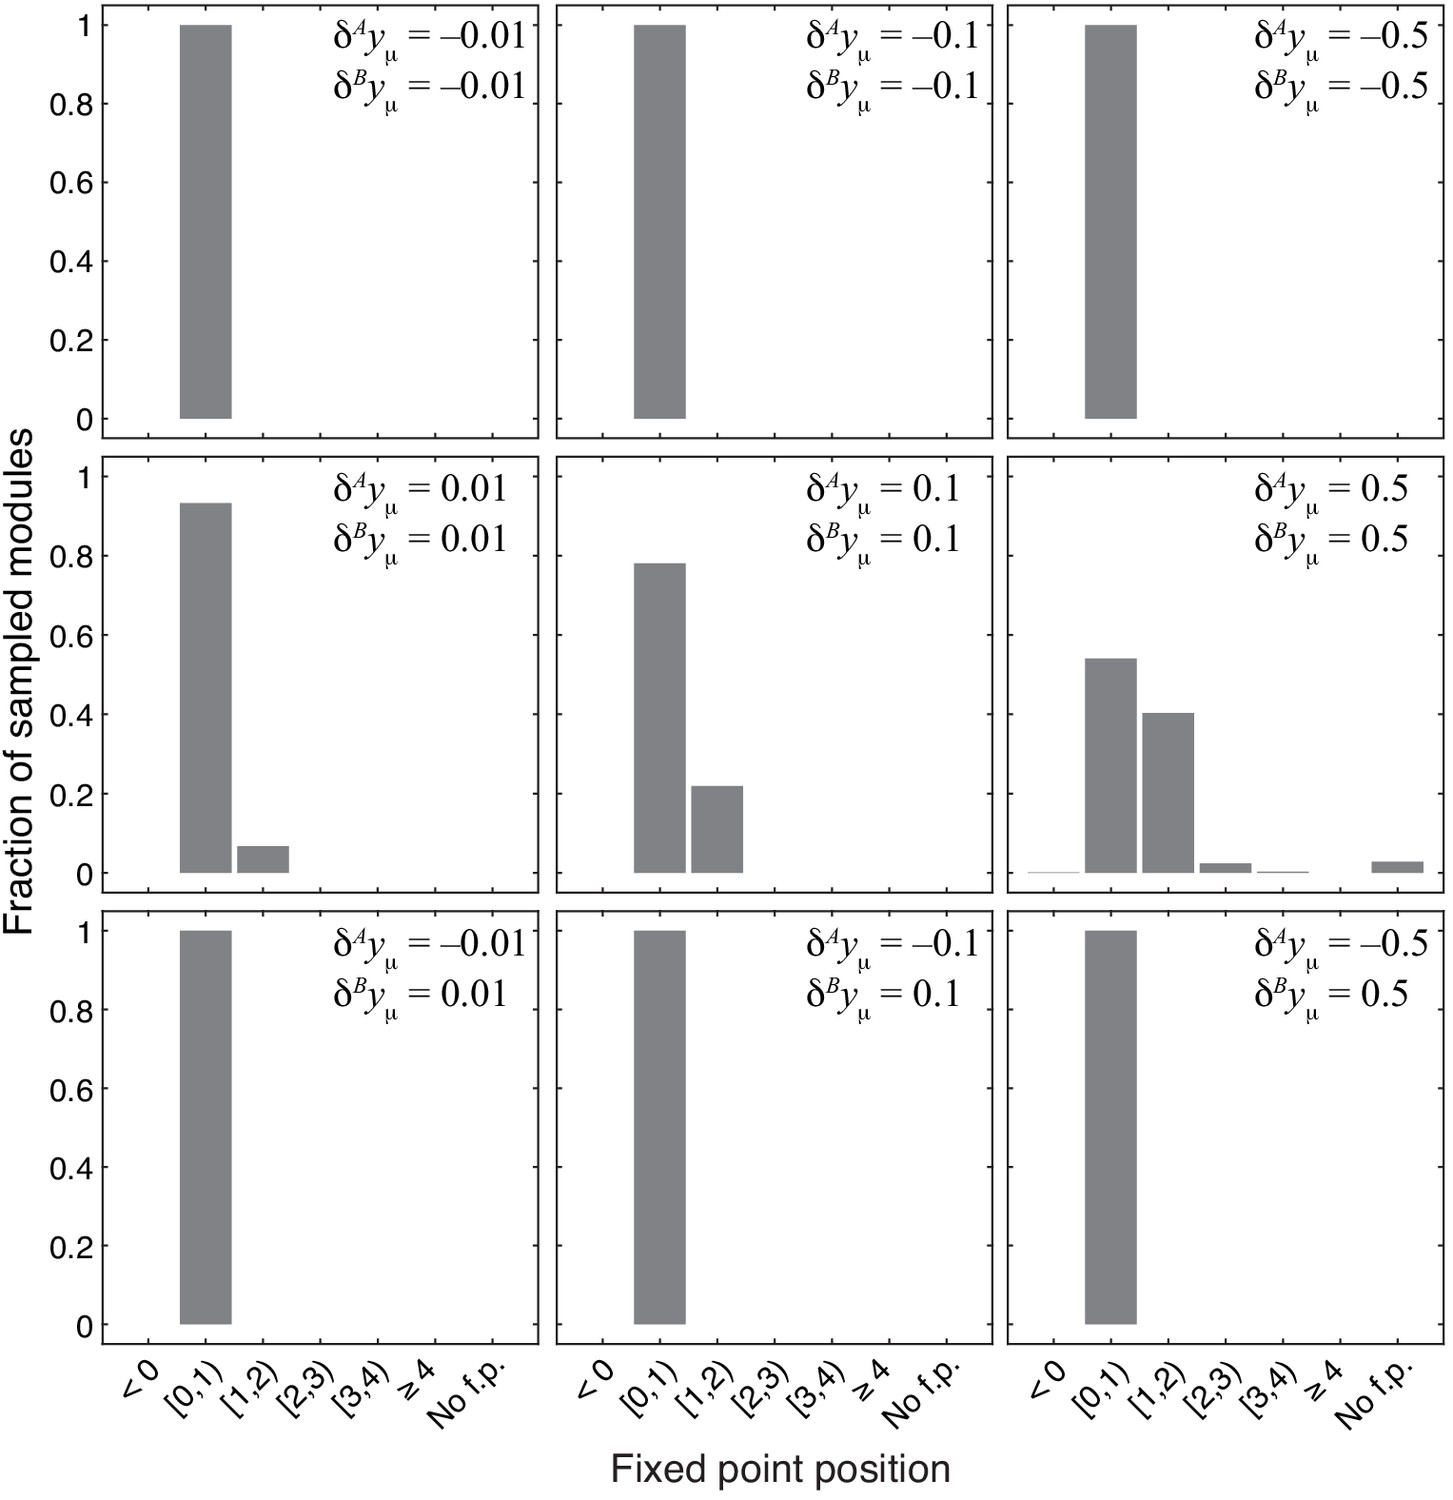
Distribution of the position of the fixed point in 1000 modules from the topological class with random parameters.
Notations are as in Figure 4.
Figure 4—figure supplement 3

Fraction of sampled modules with different strictly serial generating topologies where the epistasis coefficient falls between 0.01 and 0.99.
Dark gray bars show cases with epistasis below 1 (γ = 0:01). The same data is shown in Figure 4B, averaged over 11 generating topologies. Light gray bars show additional cases where epistasis is clustered around 1 (see Materials and methods for details). The effects of both mutations are indicated on each panel.
Figure 5 with 3 supplements
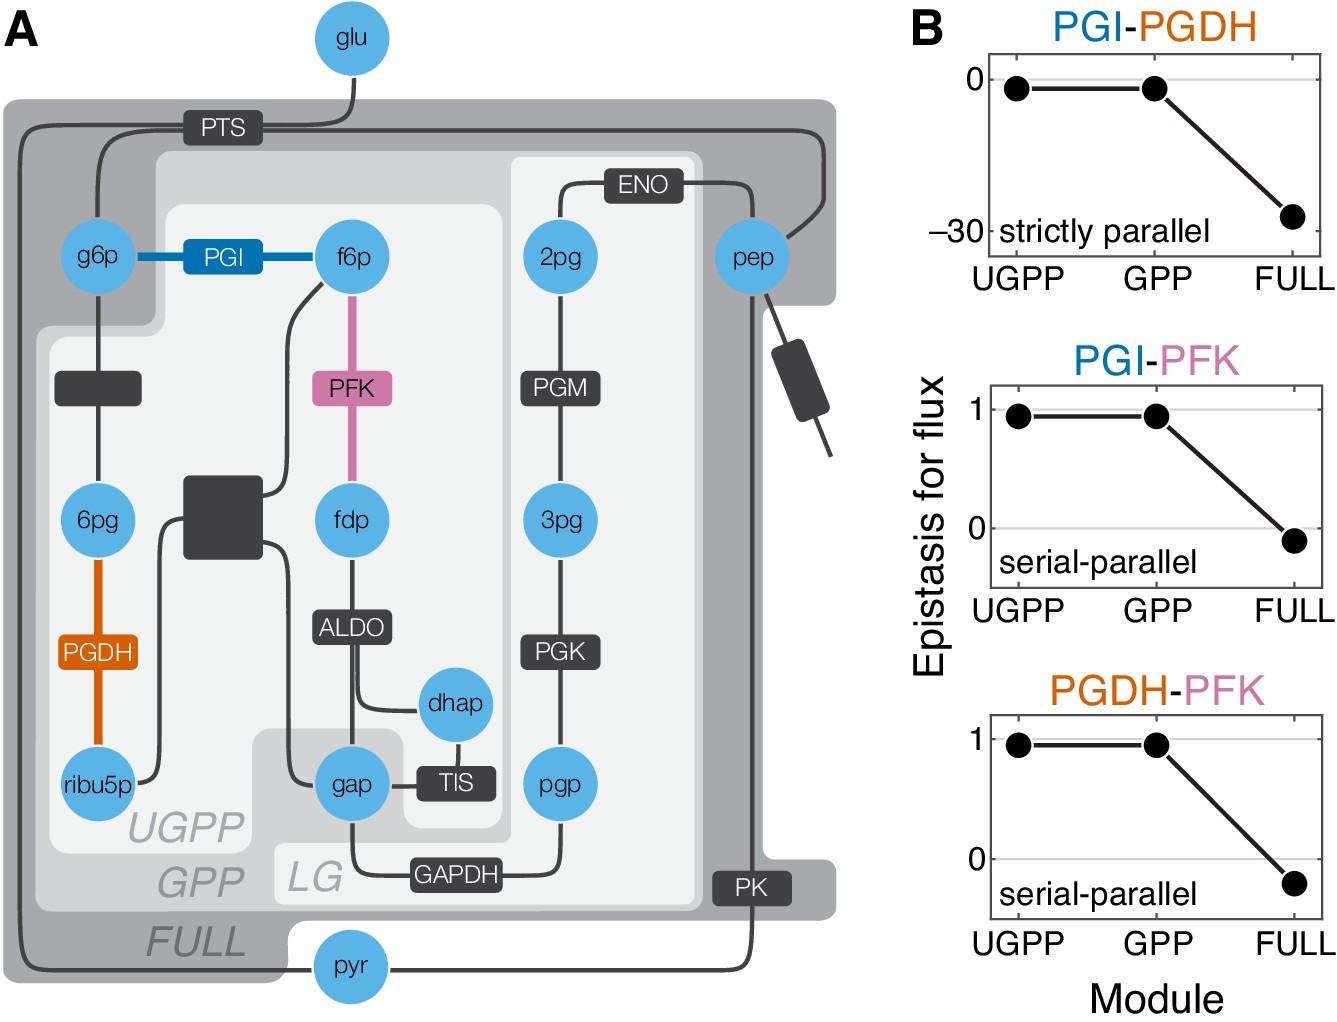
Epistasis in a kinetic model of Escherichia coli glycolysis.
(A) Simplified schematic of the model (see Figure 5—figure supplement 1 for details). Different shades of gray in the background highlight four modules as indicated (see text). Light blue circles represent metabolites. Reactions are shown as lines with dark gray boxes. The enzymes catalyzing reactions whose control coefficients with respect to the flux through the module are positive are named; other enzyme names are ommitted for clarity (see Table 5 and Table 6 for abbreviations). Three reactions, catalyzed by PGI, PFK, PGDH, for which the epistasis coefficients are shown in panel B are highlighted in dark blue, red, and orange, respectively. (B) Epistasis coefficients for flux through each module between mutations perturbing the respective reactions, computed at steady state (see text and Materials and methods for details). Reactions catalyzed by PGI and PGDH are strictly parallel (path g6p-f6p-fdp-gap contains only PGI, path g6p-6pg-ribu5p-gap contains only PGDH and there is no simple path in UGPP between g6p and gap that contains both PGI and PGDH). Reactions catalyzed by PGI and PFK are serial-parallel (path g6p-f6p-fdp-gap contains both reactions, path g6p-f6p-gap contains only PGI, path g6p-6pg-ribu5p-f6p-fdp-gap contains only PFK). Reactions catalyzed by PFK and PGDH are also serial-parallel (path g6p-6pg-ribu5p-f6p-fdp-gap contains both reactions, path g6p-f6p-fdp-gap contains only PFK, path g6p-6pg-ribu5p-gap contains only PGDH).
Figure 5—figure supplement 1
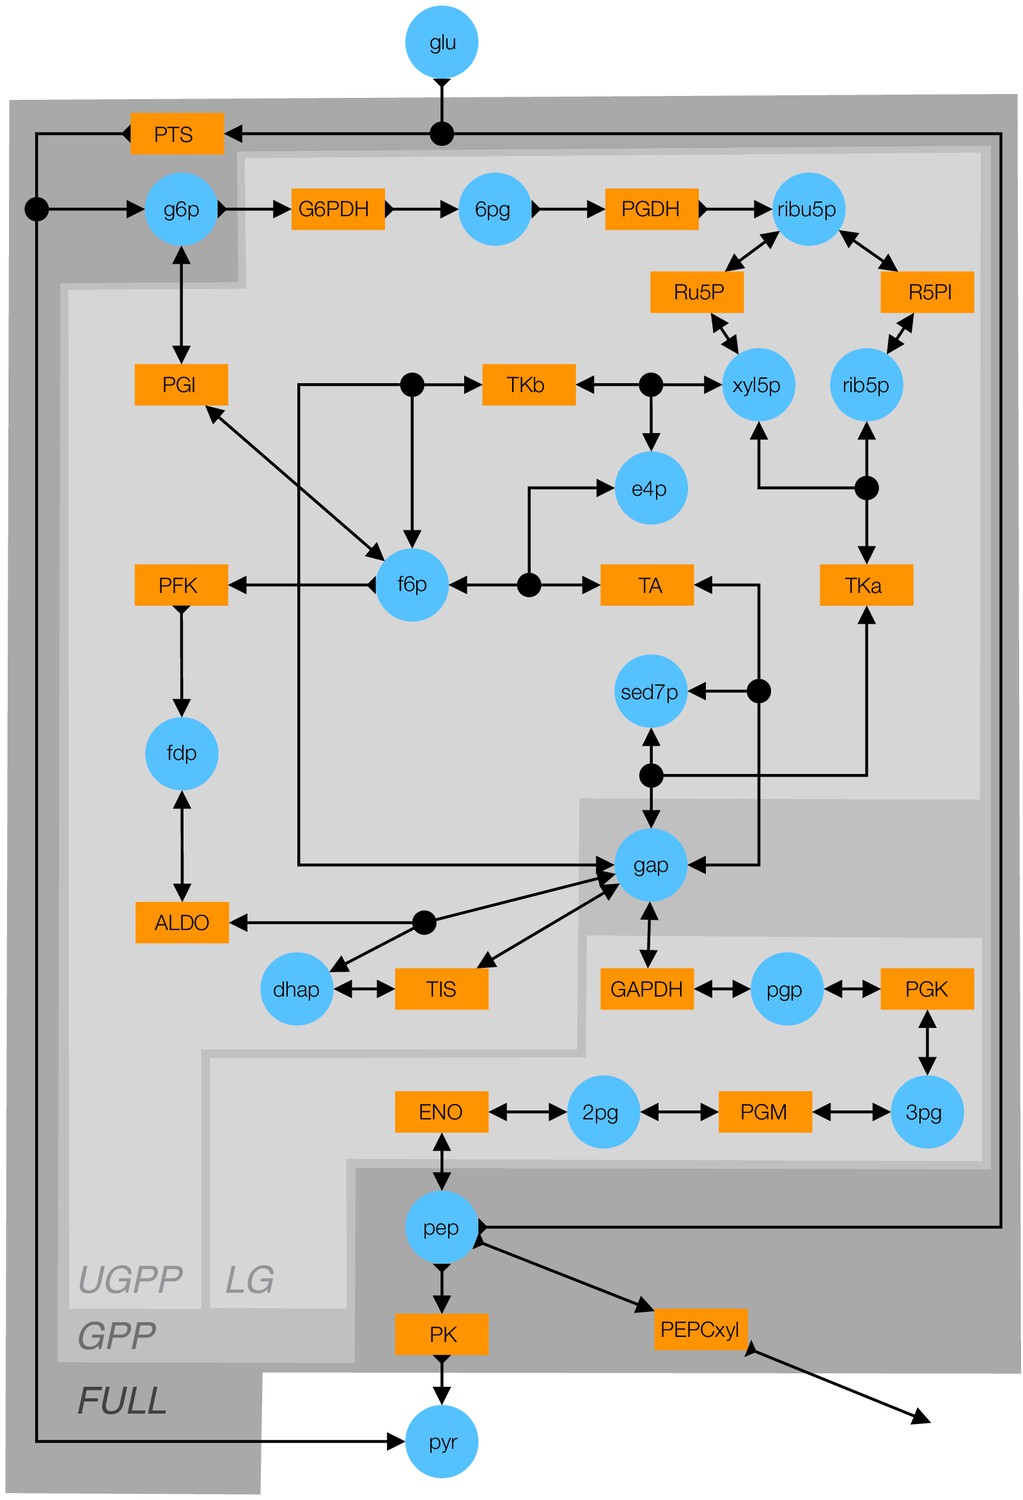
Detailed schematic of the kinetic model of glycolysis.
Blue circles indicate metabolites (see Table 5 for abbreviations). Orange rectangles indicate enzymes (see Table 6 for abbreviations). Double-arrows indicate reversible reactions. Arrows with a fletch indicate irreversible reactions. Black circles indicate reactions with multiple substrates or products. Different shades of gray indicate the FULL, GPP, UGPP, and LG models defined in Table 4.
Figure 5—figure supplement 2
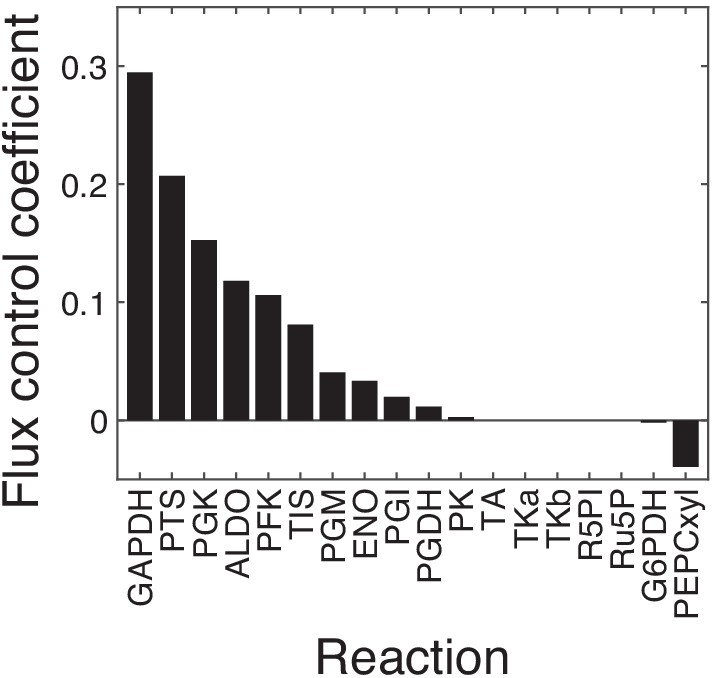
Control coefficients for the output flux in the FULL module.
The first-order flux control coefficients (FCCs) of all 18 reactions with respect to the output flux in the unpperturbed FULL model are shown. Eleven out of 18 reactions have positive FCCs, five (TA, TKa, TKb, R5PI, Ru5P) have zero FCCs and two (G6PDH and PEPCxyl) have negative FCCs. The 11 reactions with positive FCCs were retained for further analysis, the others were excluded. For these 11 reactions, the FCCs and epistasis coefficients with respect to fluxes through all modules (FULL, GPP, UGPP, LG) are shown in Figure 5—figure supplement 3.
Figure 5—figure supplement 3

Control and epistasis coefficients for the fluxes through multiple sub-modules within glycolysis.
The top row shows the FCCs of 11 reactions whose FCCs in the FULL model are positive (see Figure 5—figure supplement 2). The matrix below shows the epistasis coefficients for each pair of these reactions. The topological relationship between reactions is indicated in the lower left corner of each panel ('P', strictly parallel; 'S', strictly serial; 'SP' serial-parallel). Points are colored orange (green) if the epistasis coefficient is less than zero (greater than one). Backgrounds of different shades of gray indicate the sub-modules, as in Figure 5—figure supplement 1.
Figure 6
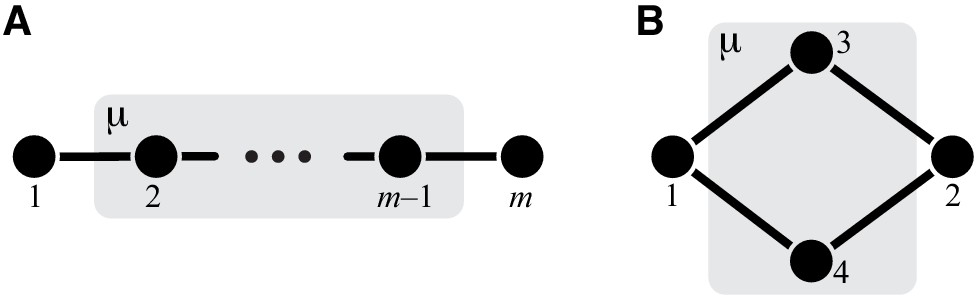
Simple modules.
(A) Linear pathway. (B) Two parallel pathways.
Figure 7
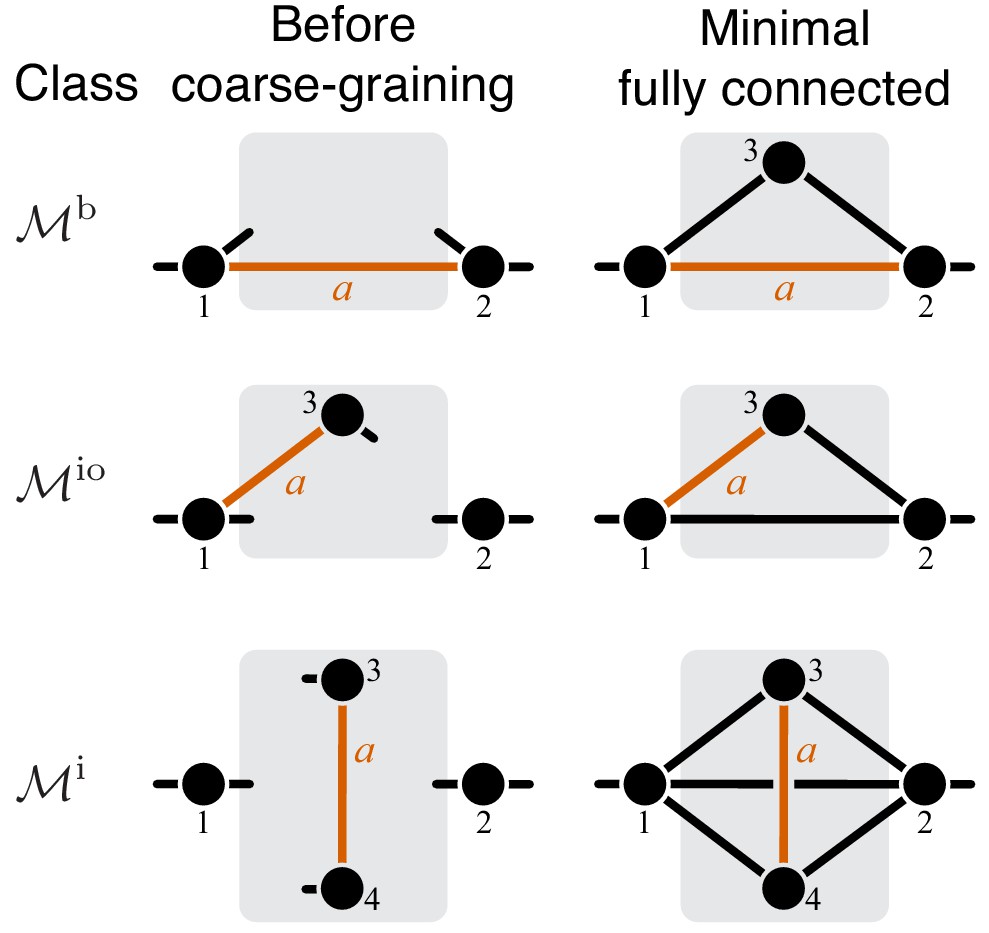
Classification of single-marked modules.
Left column shows a general module from each topological class. The right column shows a minimal fully connected module in each topological class (see text for details). Circles represent metabolites and lines represent reactions. Only the I/O metabolites and the metabolites that participate in the marked reaction are shown, all other metabolites are suppressed. Short lines that have only one terminal metabolite represent all remaining reactions in which this metabolite participates, reactions between all other metabolites are suppressed. Metabolites are labeled according to the conventions listed in the text. The marked reaction is colored orange and labeled . The module is represented by a gray rectangle, and the rest of the network is not shown.
Figure 8
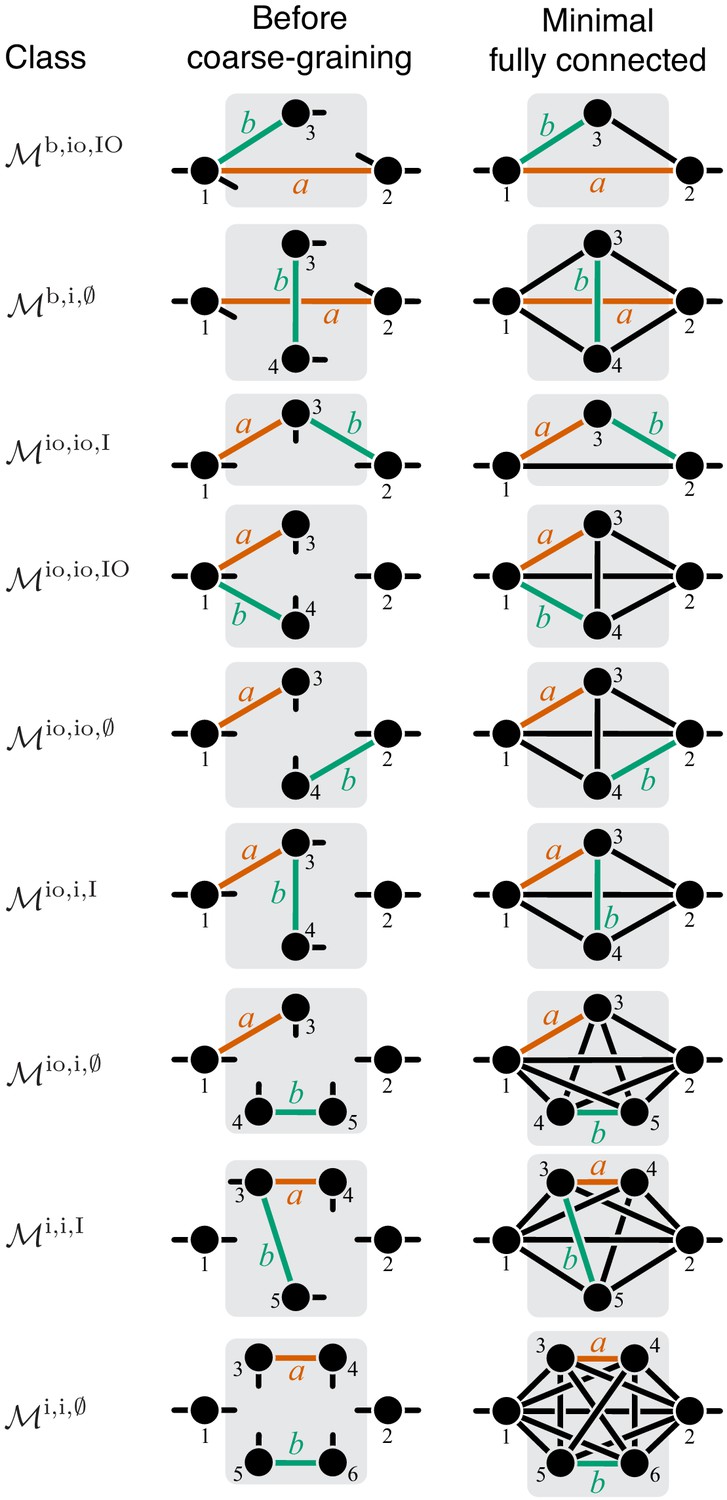
Classification of double-marked modules.
Notations as in Figure 7.
Figure 9

A counter example illustrating that the converse to claim 2 in Proposition 4 may not be true.
Reactions and are parallel in . CGP maps the double-marked module onto the minimal double-marked module where reactions and are not parallel.
Figure 10
Graphical representation of strictly serial and strictly parallel generating topologies in the class .
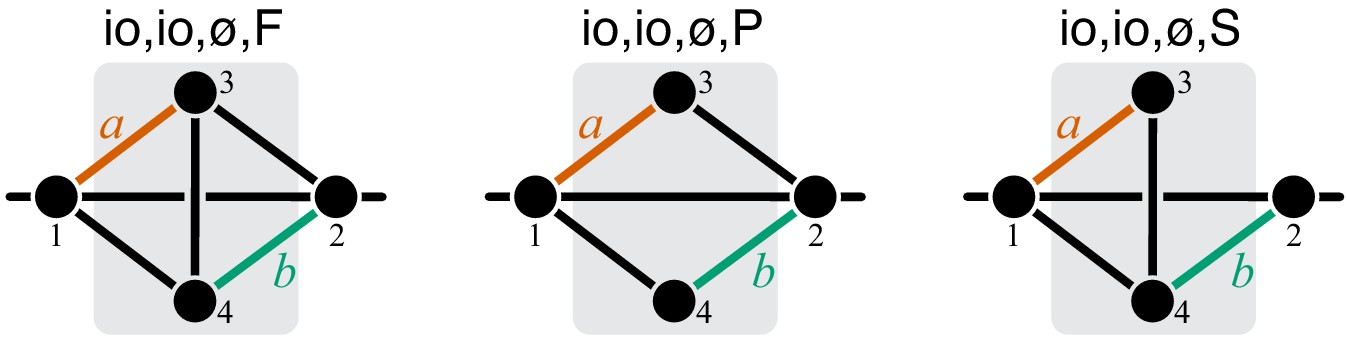
Fully connected topology is shown for reference (same as in Figure 8).
Figure 11
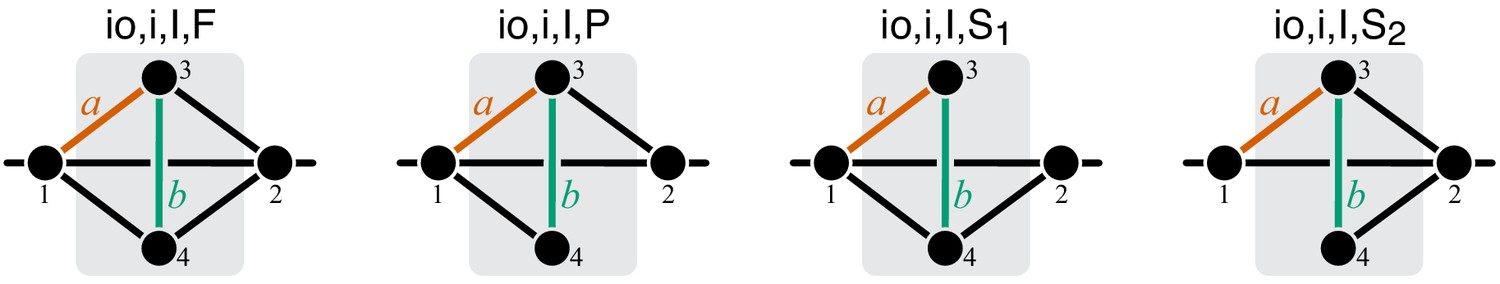
Graphical representation of strictly serial and strictly parallel generating topologies in class .
Fully connected topology is shown for reference (same as in Figure 8).
Figure 12
Graphical representation of strictly serial and strictly parallel generating topologies in class .
Fully connected topology is shown for reference (same as in Figure 8).
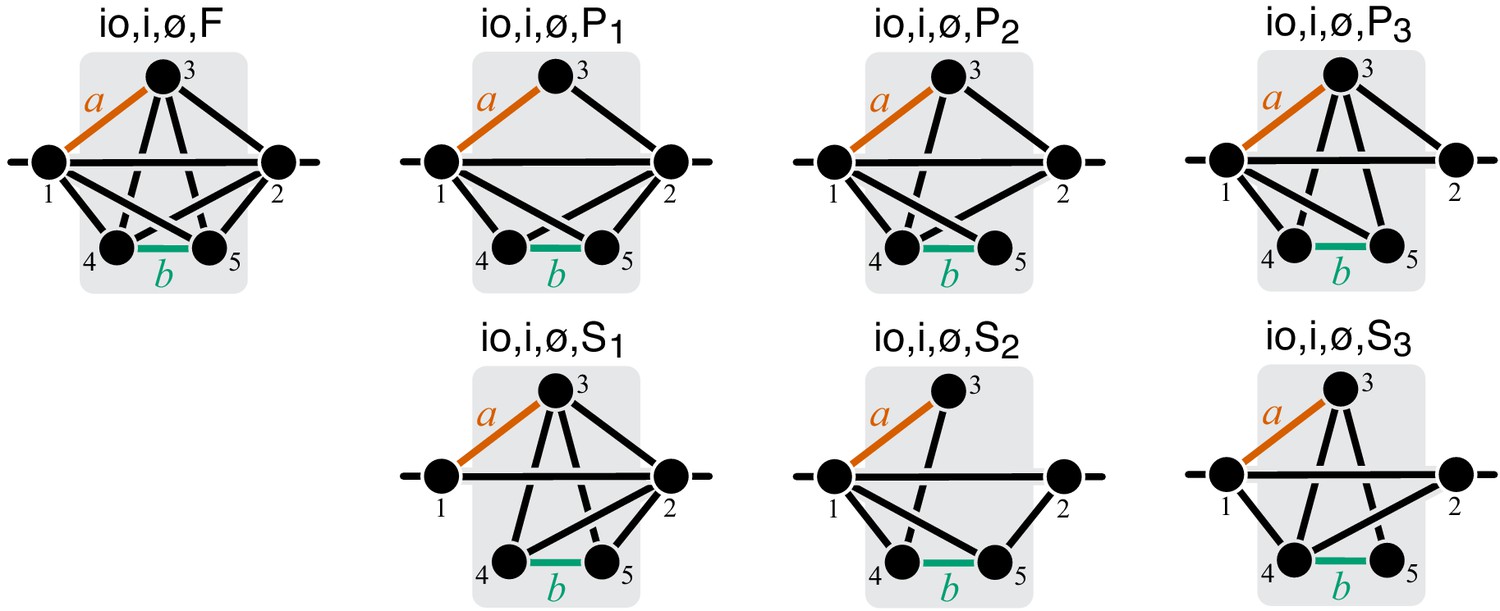
Figure 13

Graphical representation of strictly serial and strictly parallel generating topologies in class .
Fully connected topology is shown for reference (same as in Figure 8).
Figure 14
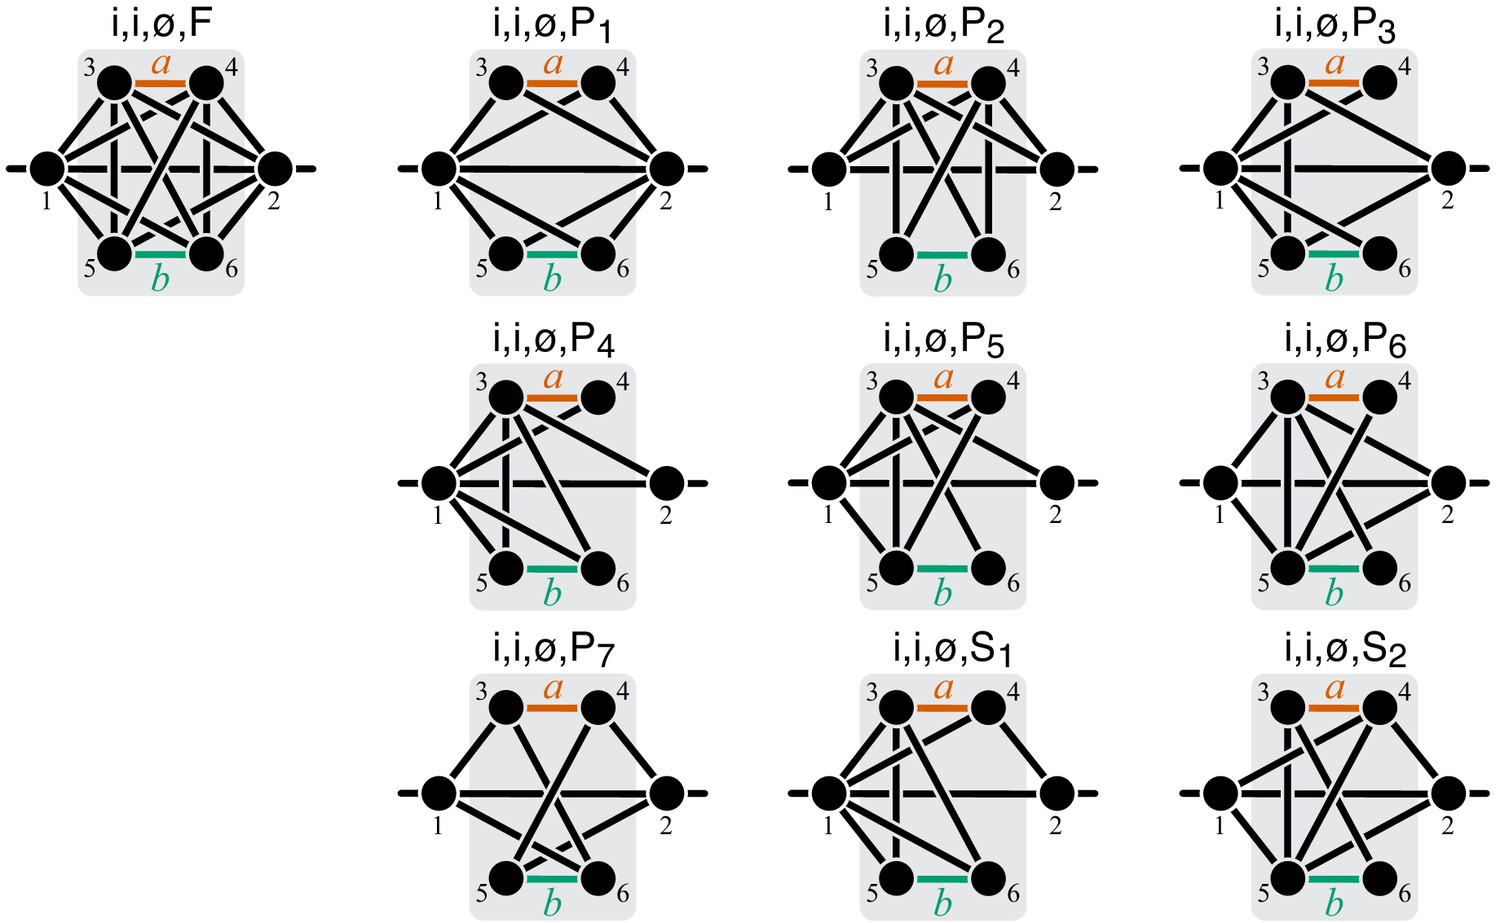
Graphical representation of strictly serial and strictly parallel generating topologies in class .
Fully connected topology is shown for reference (same as in Figure 8).
Appendix 2—figure 1
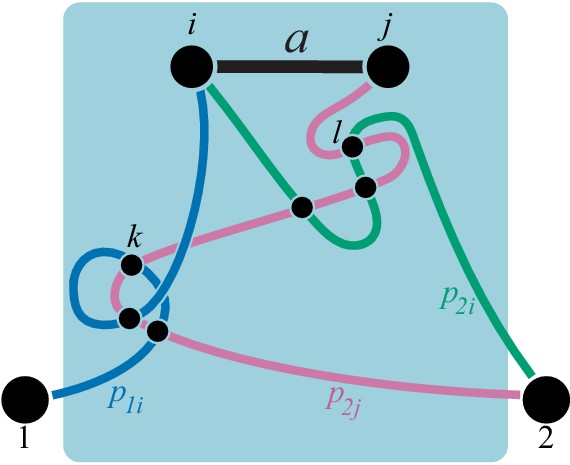
Illustration for the proof of Lemma 1.
Tables
Table 1
Classification of double-marked modules.
Metabolites are labeled according to conventions described in the text. is the minimum number of internal metabolites in a module from class . is the set of internal and I/O metabolites in all minimal modules in class .
| Class | Shared metab. | Verbal description | Equation for f2 | ||||
|---|---|---|---|---|---|---|---|
| 1 | Bypass and i/o reactions, shared I/O metabolite | 2 | Equation (34) | ||||
| – | Bypass and internal reactions, no shared metabolies | 2 | Equation (35) | ||||
| 3 | i/o reactions, shared internal metabolite | 1 | Equation (36) | ||||
| 1 | i/o reactions, shared I/O metabolite | 2 | Equation (37) | ||||
| – | i/o reactions, no shared metabolites | 2 | Equation (38) | ||||
| 3 | i/o and internal reactions, shared internal metabolite | 2 | Equation (39) | ||||
| – | i/o and internal reactions, no shared metabolites | 3 | Equation (40) | ||||
| 3 | Internal reactions, shared internal metabolite | 3 | Equation (41) | ||||
| – | Internal reactions, no shared metabolites | 4 | Equation (42) |
Table 2
Table 3
Table 4
Definition of modules in the glycolysis network shown in Figure 5—figure supplement 1.
| Model | Internal metabolites | Concentrations of I/O metabolites | Reactions | Output flux |
|---|---|---|---|---|
| UGPP | 6 pg, dhap, e4p, f6p, fdp, rib5p, ribu5p, sed7p, xyl5p | [g6p]=3.82 mM, [gap]=0.44 mM | ALDO, G6PDH, PFK, PGDH, PGI, Ru5P, R5PI, TA, TIS, TKa, TKb | |
| LG | 2 pg, 3 pg, pgp | [gap]=0.44 mM, [pep]=0.08 mM | ENO, GAPDH, PGK, PGM | |
| GPP | all in UGPP and in LG, gap | [g6p]=3.82 mM, [pep]=0.08 mM | all in UGPP and in LG | |
| FULL | all in GPP, g6p, pep | [Ext glu]=2 µM, [pyr]=10 µM | all in GPP, PTS, PK, PEPCxyl |
Table 5
Names of metabolites used in the kinetic model of glycolysis.
| 2 pg | 2-Phosphoglycerate |
|---|---|
| 3 pg | 3-Phosphoglycerate |
| 6 pg | 6-Phosphogluconate |
| dhap | Dihydroxyacetonephosphate |
| e4p | Erythrose-4-phosphate |
| f6p | Fructose-6-phosphate |
| fdp | Fructose-1,6-bisphosphate |
| g6p | Glucose-6-phosphate |
| gap | Glyceraldehyde-3-phosphate |
| glu | Glucose |
| pep | Phosphoenolpyruvate |
| pgp | 1,3-Diphosphoglycerate |
| pyr | Pyruvate |
| rib5p | Ribose-5-phosphate |
| ribu5p | Ribulose-5-phosphate |
| sed7p | Sedoheptulose-7-phosphate |
| xyl5p | Xylulose-5-phosphate |
Table 6
Names of enzymes used in the kinetic model of glycolysis.
| ALDO | Aldolase |
|---|---|
| ENO | Enolase |
| G6PDH | Glucose-6-phosphate dehydrogenase |
| GAPDH | Glyceraldehyde-3-phosphate dehydrogenase |
| PFK | Phosphofructokinase |
| PGDH | 6-Phosphogluconate dehydrogenase |
| PGI | Glucose-6-phosphateisomerase |
| PGK | Phosphoglycerate kinase |
| PGM | Phosphoglycerate mutase |
| PEPCxyl | PEP carboxylase |
| PK | Pyruvate kinase |
| PTS | Phosphotransferase system |
| R5PI | Ribose-phosphateisomerase |
| Ru5P | Ribulose-phosphate epimerase |
| TA | Transaldolase |
| TIS | Triosephosphate isomerase |
| TKa | Transketolase, reaction a |
| TKb | Transketolase, reaction b |
Additional files
-
Supplementary file 1
Mathematica notebook ‘Case i,i,emptyset,P7.nb’ for evaluating epistasis for the generating topology .
- https://cdn.elifesciences.org/articles/60200/elife-60200-supp1-v2.nb
-
Supplementary file 2
PDF version of the Mathematica notebook ‘Case i,i,emptyset,P7.nb’.
- https://cdn.elifesciences.org/articles/60200/elife-60200-supp2-v2.pdf
-
Transparent reporting form
- https://cdn.elifesciences.org/articles/60200/elife-60200-transrepform-v2.docx
Download links
A two-part list of links to download the article, or parts of the article, in various formats.
Downloads (link to download the article as PDF)
Open citations (links to open the citations from this article in various online reference manager services)
Cite this article (links to download the citations from this article in formats compatible with various reference manager tools)
Emergence and propagation of epistasis in metabolic networks
eLife 10:e60200.
https://doi.org/10.7554/eLife.60200


