Glutamine metabolism modulates azole susceptibility in Trypanosoma cruzi amastigotes
- Department of Immunology and Infectious Diseases, Harvard T.H. Chan School of Public Health, United States
- Institute for Pharmacy and Molecular Biotechnology, Heidelberg University, Germany
- Harvard Center for Mass Spectrometry, Harvard University, United States
Figures
Figure 1 with 5 supplements
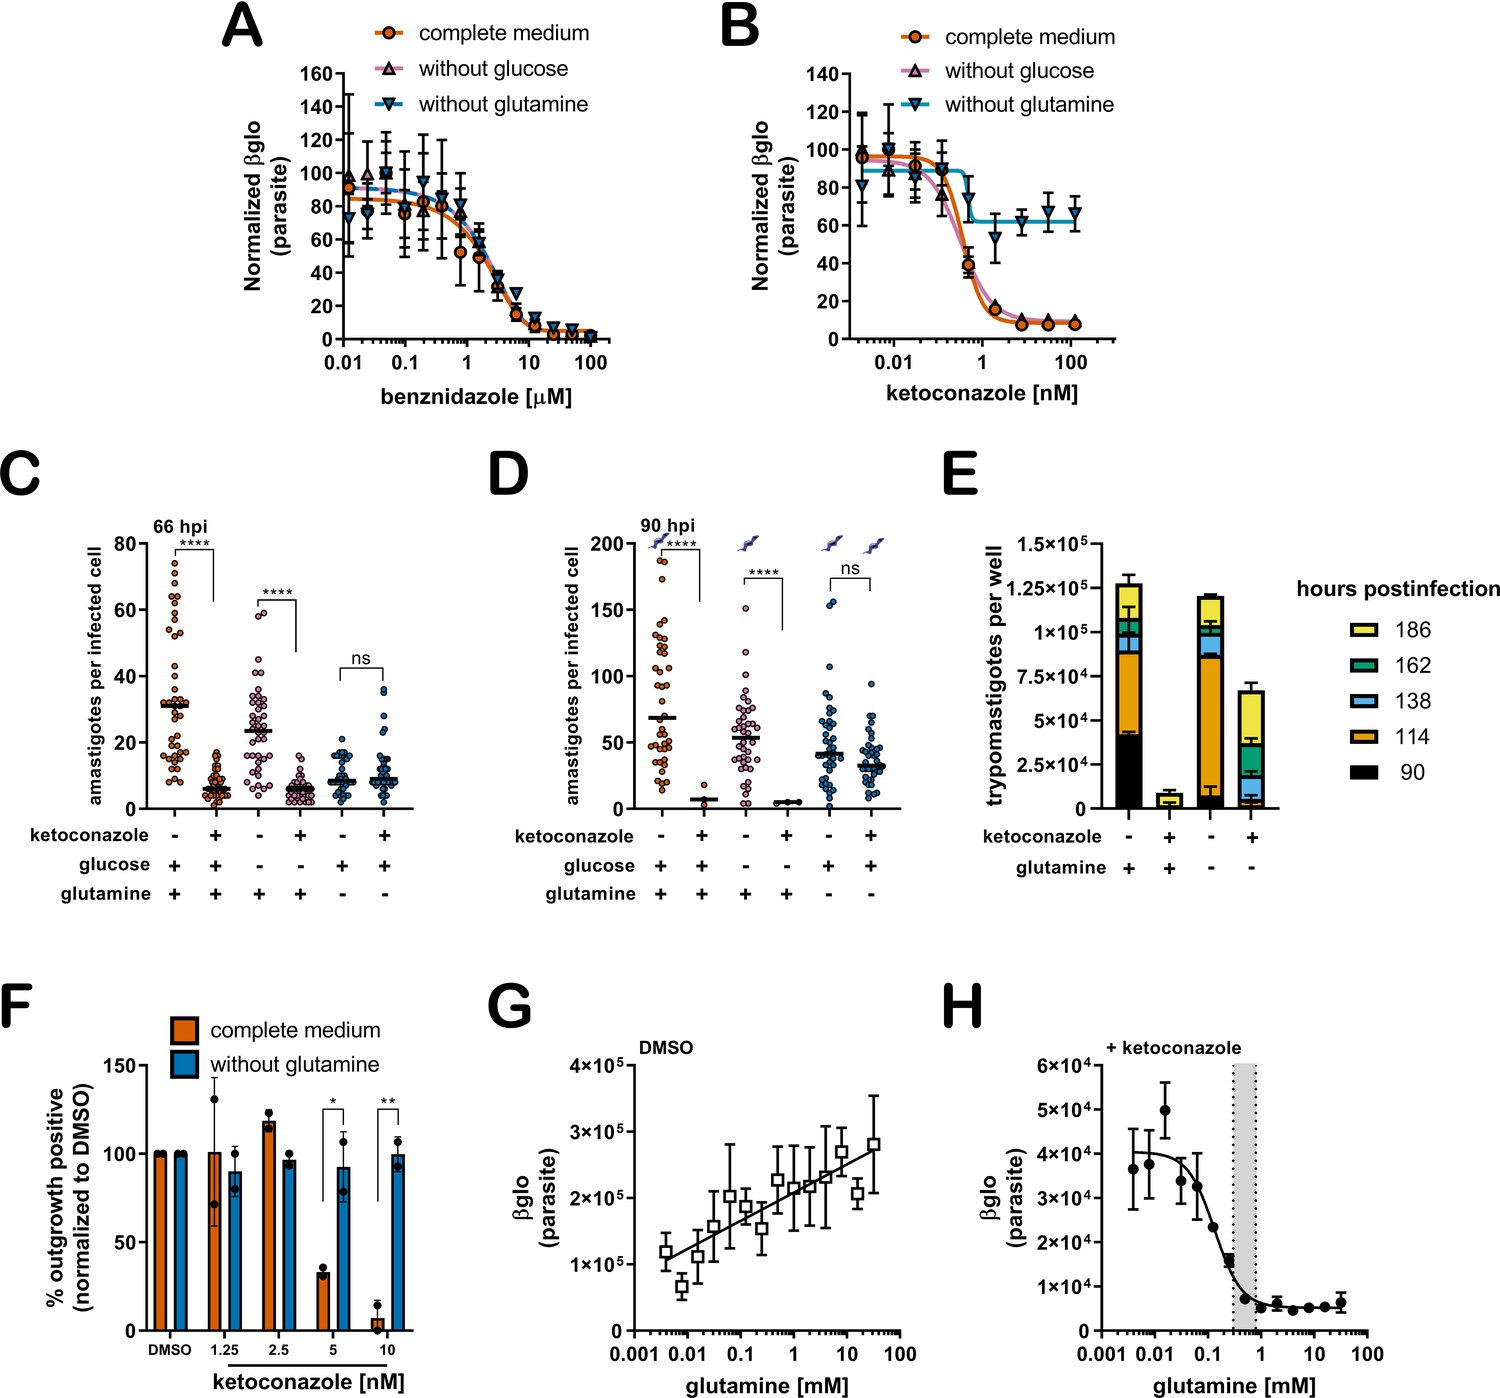
A lack of supplemental glutamine in growth medium protects intracellular T. cruzi amastigotes from the cytocidal effects of ketoconazole.
(A) Dose response curves at 66 hpi of benznidazole and (B) ketoconazole treatment, in the indicated media compositions, normalized to the largest mean in each treatment group. Mean (symbols) and standard deviation shown (n = 4). (C) Microscopic counts at 66 hpi and (D) 90 hpi of the number of amastigotes per infected host cell (n = 40), medians indicated. Cartoons at top of graph indicate conditions where extracellular trypomastigotes are visible in the culture supernatant. (E) Growth media was replaced and extracellular trypomastigotes were counted every 24 hr beginning at 90 hpi (n = 2). (F) Detection of clonal outgrowth 14 days after the indicated treatments, normalized to DMSO (vehicle) treatment. Mean and standard deviation shown, circles indicates values of two independent experiments with 28 wells used per treatment within an experiment. (G) Dose response curves of glutamine in the presence of DMSO or (H) ketoconazole (5 nM). Mean and standard deviation shown (n = 3). Grey shading indicates in panel I shows the physiological range found in human plasma (800–300 uM) (Cruzat et al., 2018). Statistical comparisons between medians (C,D) were performed using a Kruskal-Wallis test with Dunn’s multiple comparisons test (****p<0.0001, ns = not significant). Comparisons of means from outgrowth (F) was performed using a two-way ANOVA with Dunnett’s multiple comparisons test (*p<0.05, **p<0.01).
Figure 1—figure supplement 1
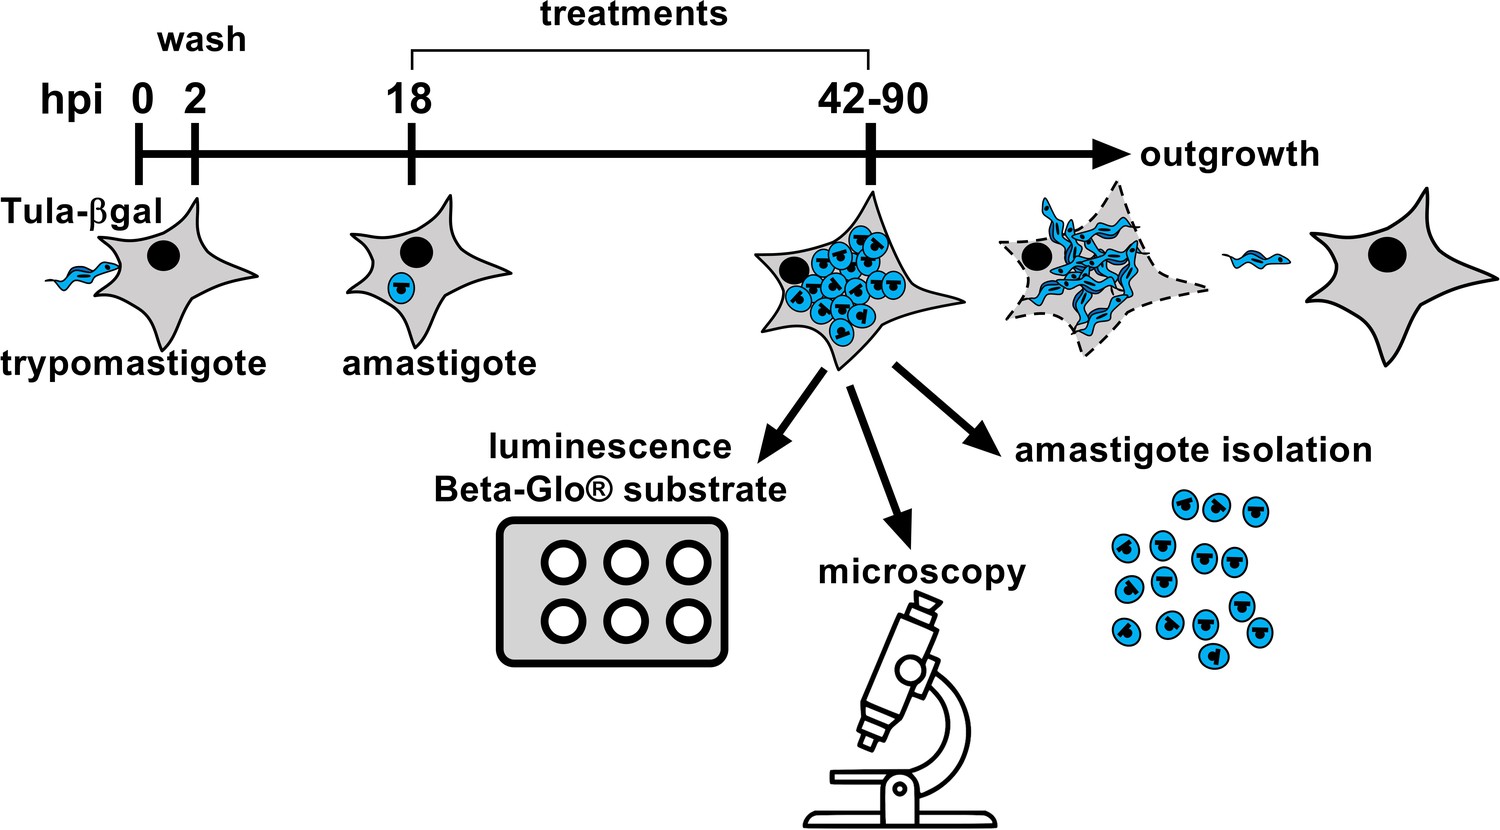
Experimental schematic for in vitro infection and readouts.
Trypomastigotes (Tula-βgal) are incubated with mammalian host cells for 2 hr to allow invasion. Remaining extracellular parasites are subsequently removed by thorough rinsing of monolayers. Internalized parasites undergo differentiation into mature amastigotes and any treatments or media adjustments are initiated at 18 hpi prior to the first amastigote division. At indicated time points post-infection (e.g. 42–90 hpi), infected cultures have one of several fates depending on the experiment, as illustrated and described in detail in the Materials and methods.
Figure 1—figure supplement 2
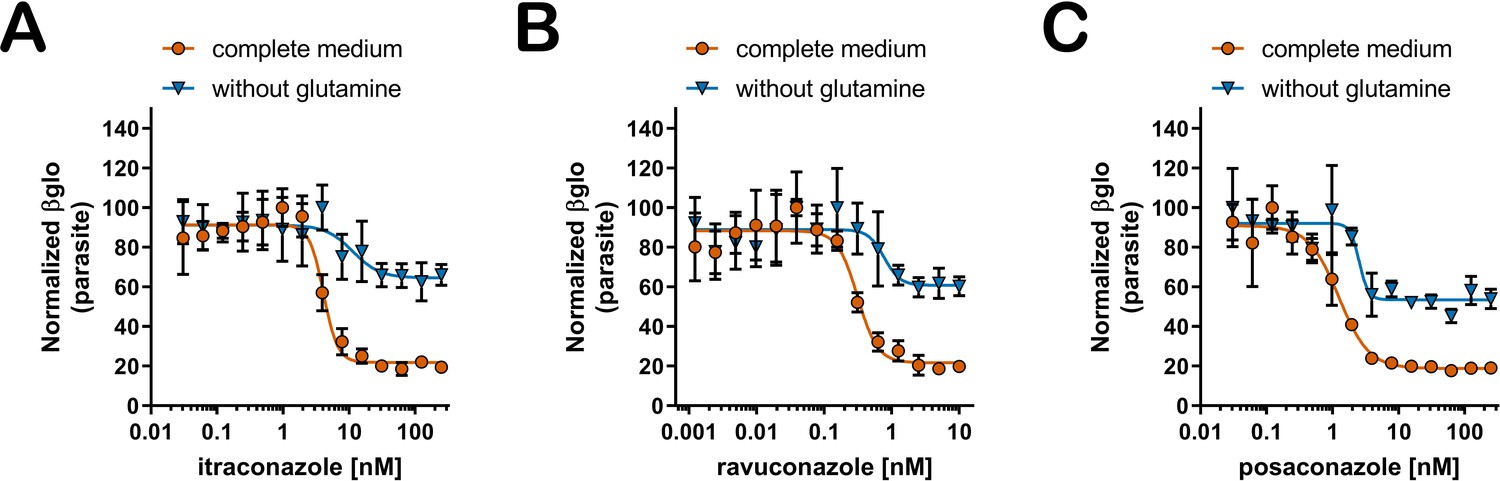
Sensitivity to additional azole drugs is modulated by glutamine.
(A) Dose response curves of itraconazole, (B) ravuconazole, and (C) posaconazole treatment measured at 66 hpi. Treatment including media compositions are indicated and growth is normalized to the largest mean in each data set. Mean (symbols) and standard deviation show (n = 4).
Figure 1—figure supplement 3
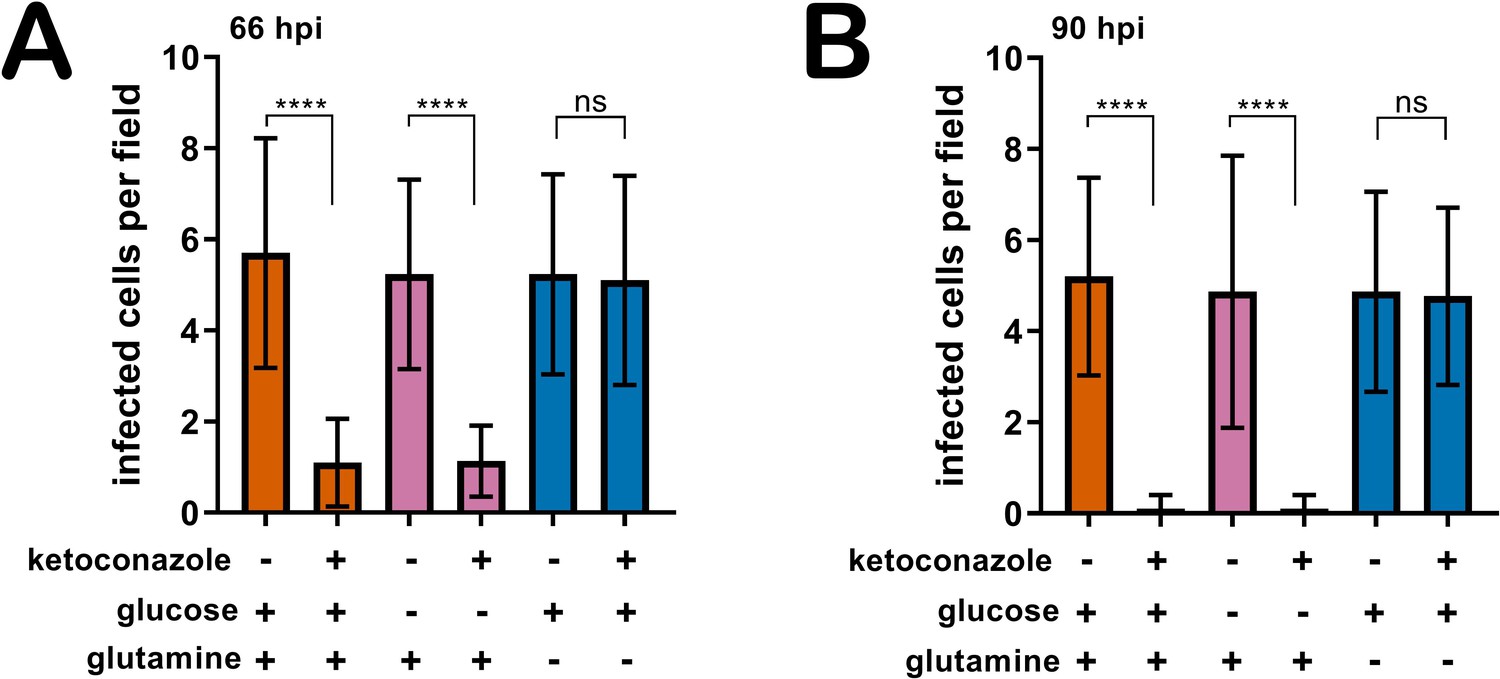
Removal of supplemental glutamine but not glucose maintains the proportion of infected host cells in the presence of azoles.
The number of infected cells per field (n = 20) at (A) 66 hpi and (B) 90 hpi, mean and standard deviations shown. Comparisons of means (D,F) were performed using a one-way ANOVA and Bonferroni’s multiple comparisons test (****p<0.0001, ns = not significant).
Figure 1—figure supplement 4
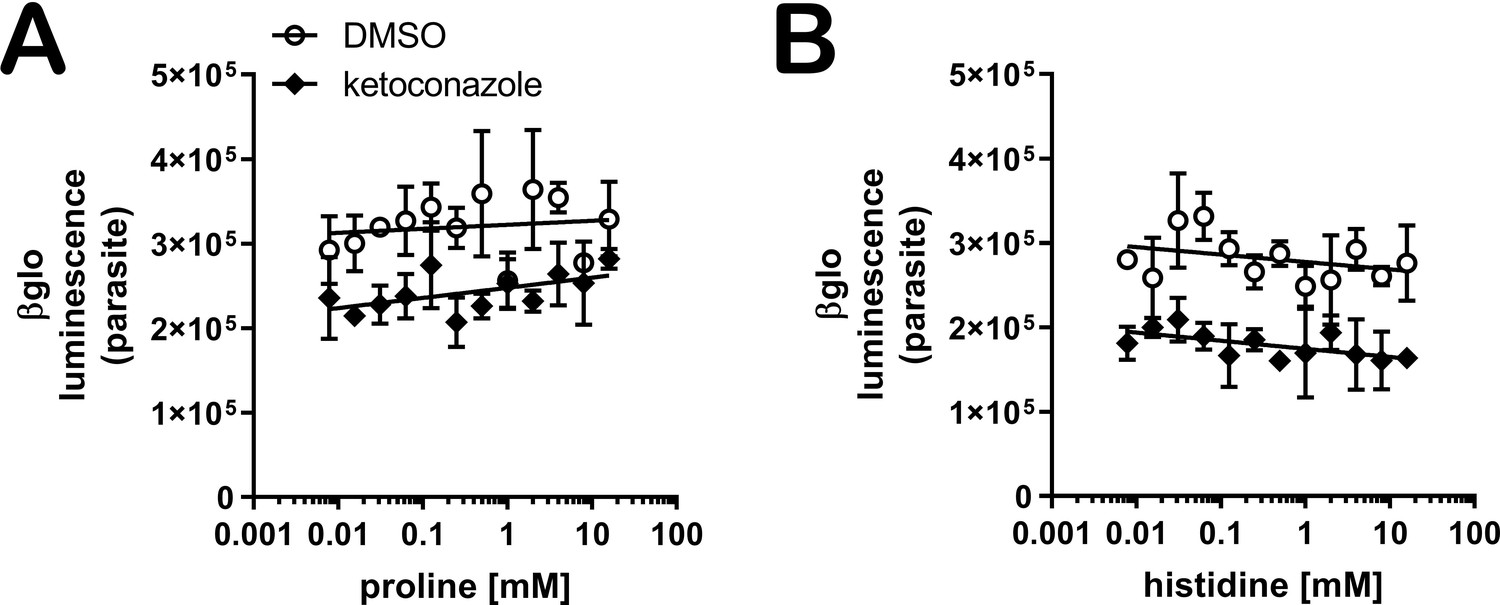
Proline or histidine supplementation do not sensitize amastigotes to ketoconazole in the absence of glutamine.
Dose response curves of (A) proline and (B) histidine in the absence of supplemental glutamine (n = 3).
Figure 1—figure supplement 5
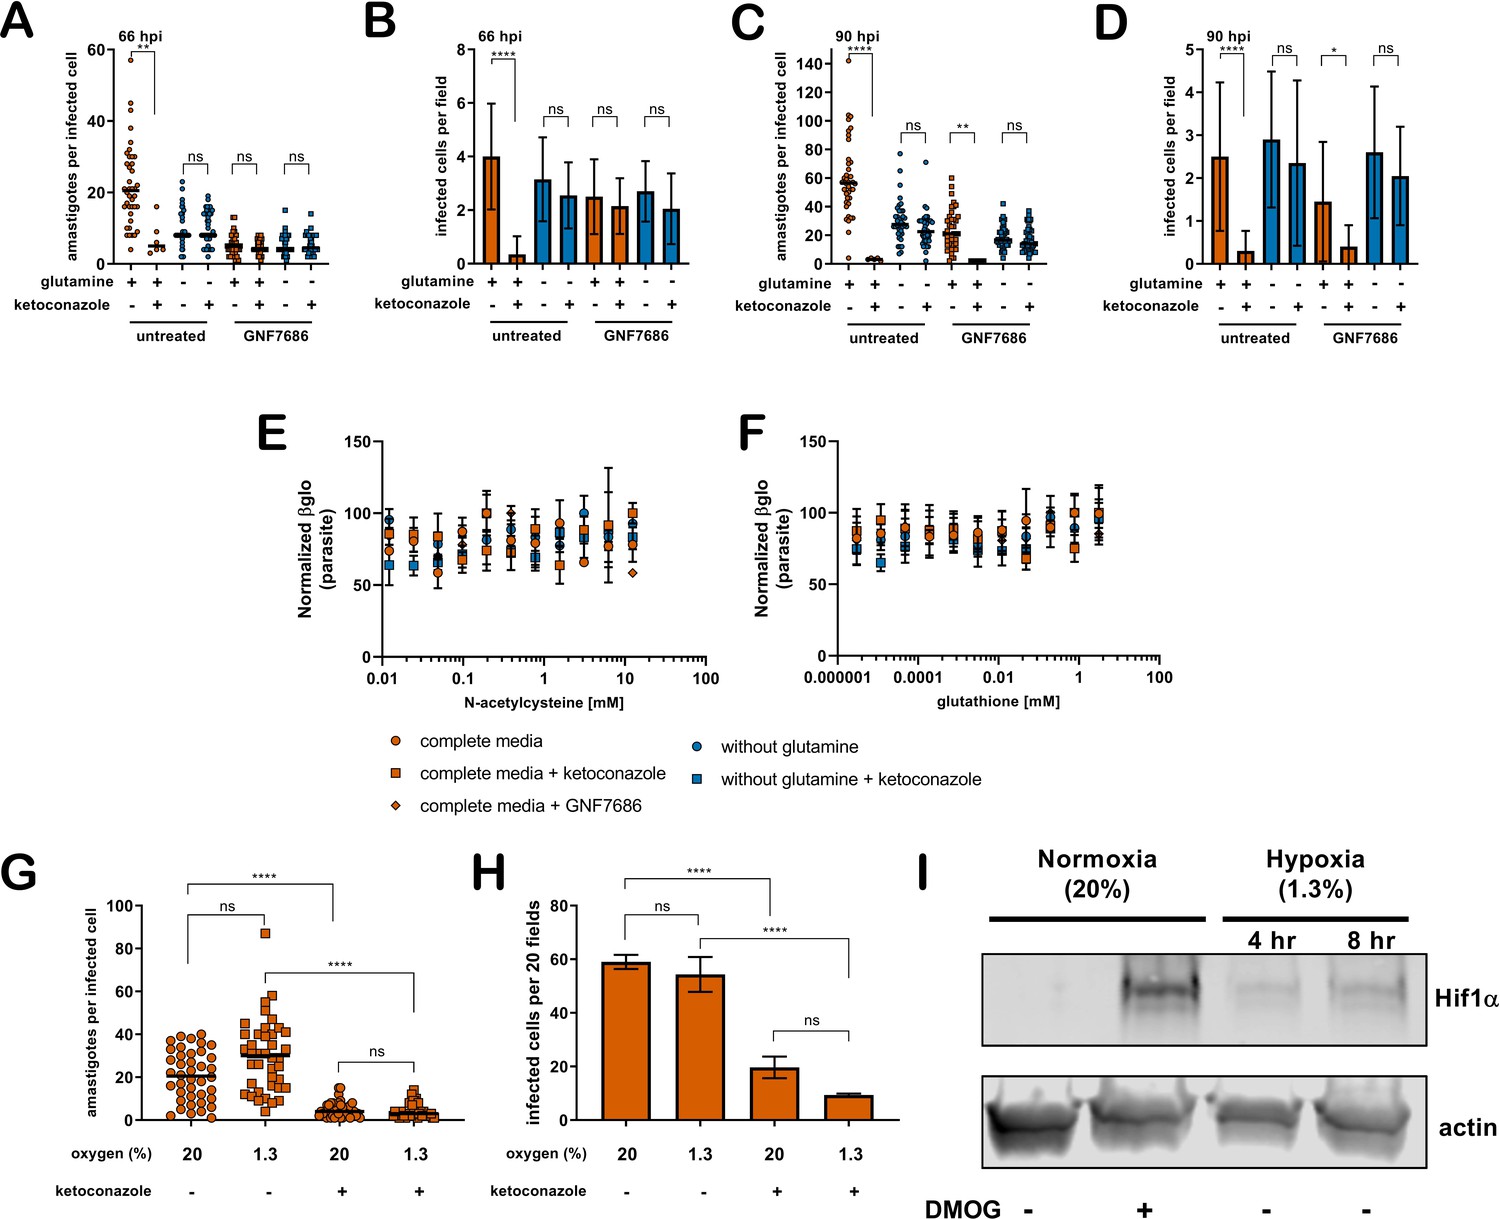
Slowed amastigote growth, antioxidants, or hypoxia does not prevent the cidal effects of ketoconazole.
(A) Microscopic counts of amastigotes per host cell (n = 40) and (B) proportion of infected cells (n = 20) at 66 hpi following treatment at 18 hpi with ketoconazole (5 nM) and/or GNF7686 (150 nM) under the indicated conditions. (C) Microscopic counts of amastigotes per host cell (n = 40) and (D) proportion of infected cells (n = 20) at 90 hpi following treatment at 18 hpi with ketoconazole (5 nM) and/or GNF7686 (150 nM) under the indicated conditions. Statistical comparisons between medians (A,C) were performed using a Kruskal-Wallis test with Dunn’s multiple comparisons test (****p<0.0001, **p<0.01, ns = not significant). Comparisons of means (B,D) were performed using a one-way ANOVA and Bonferroni’s multiple comparisons test (****p<0.0001, *p<0.05, ns = not significant). (E) Normalized dose response of N-acetylcysteine and (F) glutathione measured at 66 hpi in the indicated treatment conditions. Mean and standard deviations are show (n = 2). (G) Microscopic counts of the number of amastigotes per infected host cell, mean indicated, (n = 40) and (H) the number of infected cells per 20 fields, mean and standard deviation shown (n = 3). Growth in complete medium under normoxia (20% atmospheric oxygen) or hypoxia (1.3% oxygen) and ketoconazole (5 nM) where indicated. (I) Western blot of uninfected whole host cell lysate. Hif1α is induced under hypoxia and in the presence of DMOG (0.8 mM for 6 hr) as a positive control.
Figure 2 with 2 supplements
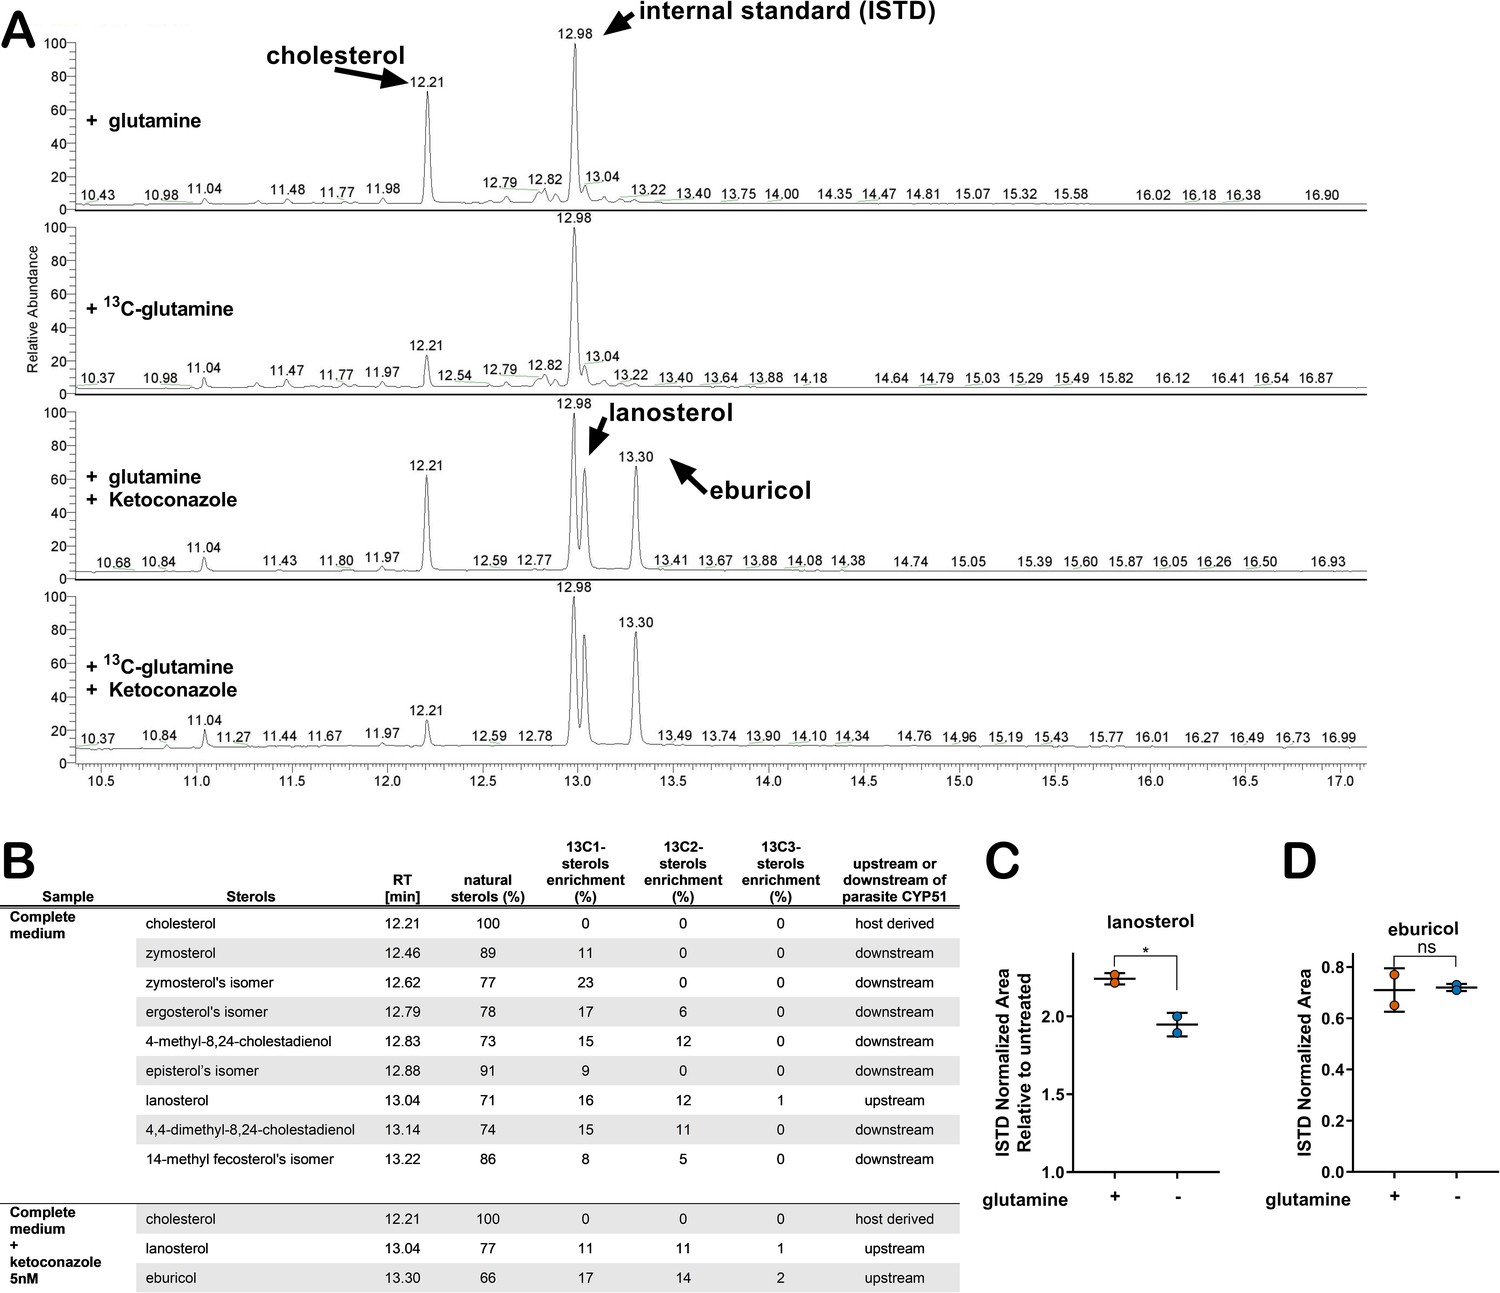
Glutamine-derived carbons are incorporated into amastigote sterols and influence the buildup of lanosterol.
(A) Chromatogram from GC-MS detection of samples. Host-cell-derived cholesterol is seen at retention time 12.21, eburicol at 13.30, lanosterol at 13.04 and the internal standard at 12.98. (B) Table of detectable isolated amastigote sterol species from panel A and the percentage of natural sterols (i.e. without detectable 13C). The proportion of species found with the indicated number of incorporated 13C carbons are shown (e.g. 13C1, 13C2). (C) Quantification, using an internal standard, of lanosterol and (D) eburicol in isolated amastigotes (52 hpi) following treatment with ketoconazole (5 nM) at 18 hpi with or without glutamine (2 mM). Mean and standard deviation shown of independent treatments, infections and amastigote isolations (n = 2). Statistical comparisons are made using a Student’s t-test (*p<0.05, ns = not significant).
Figure 2—figure supplement 1
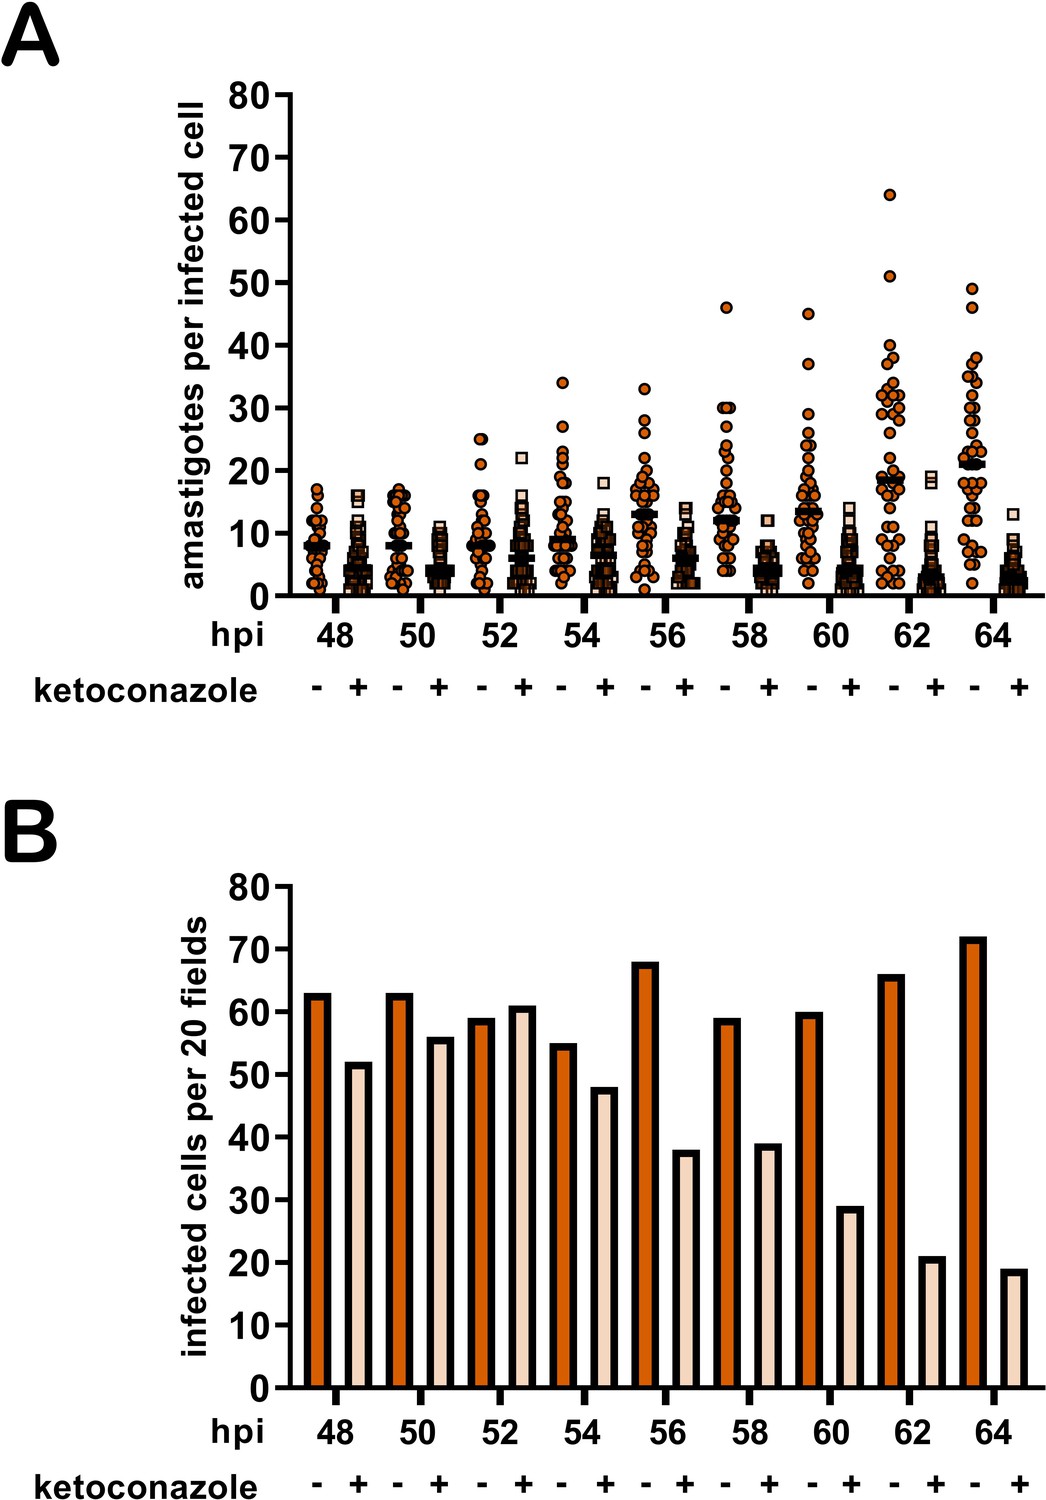
Time course establishes 52 hpi as optimal time point to harvest intracellular amastigotes following ketoconazole treatment.
Time course following treatment with ketoconazole (5 nM) in complete media. (A) Amastigotes per infected host cell (n = 40) and (B) infected cells per 20 fields are shown. Fifty-two hpi identified as maximum time of ketoconazole exposure prior to measurable loss of intracellular amastigotes.
Figure 2—figure supplement 2
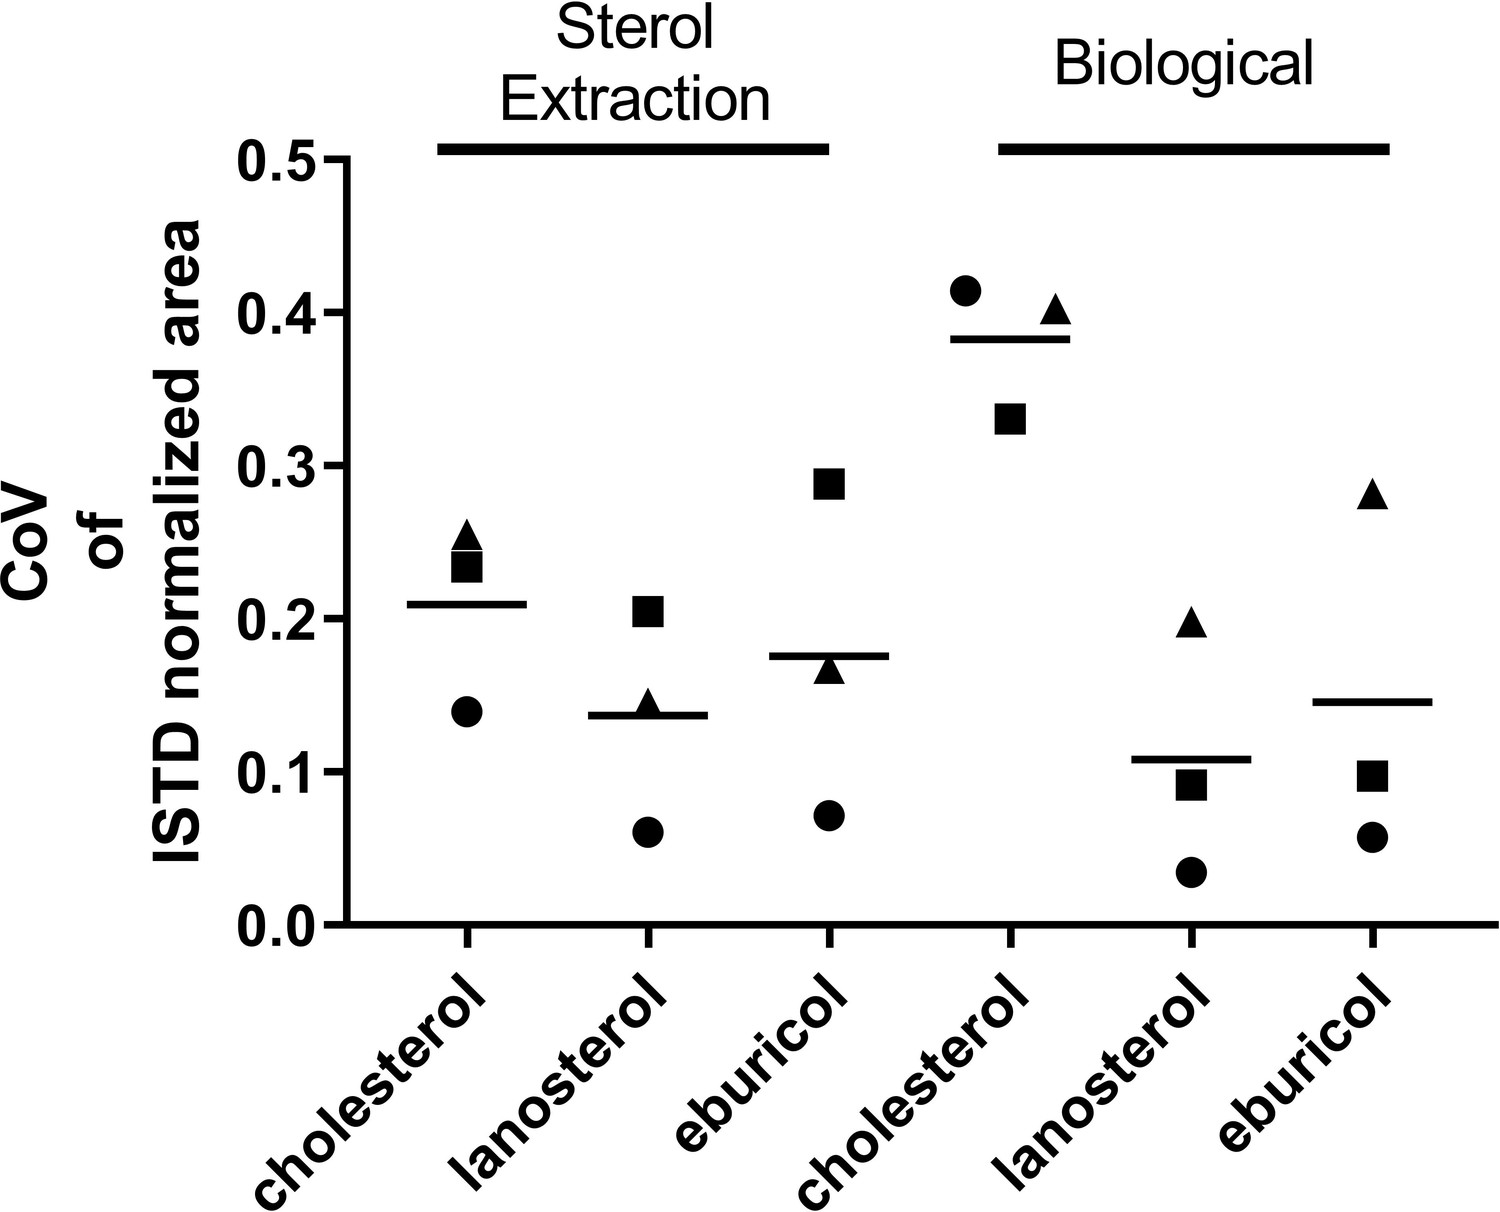
Endogenous lanosterol and eburicol but not host derived cholesterol are reliable quantifiable from isolated intracellular amastigotes.
Isolated amastigotes (52 hpi) were prepared on three independent occasions (biological) and each isolation was extracted three separate times (sterol extraction). The coefficient of variation of standard normalized area (GC-MS) was determined, means indicated. Variation in cholesterol between biological replicates prohibits reliable quantification.
Figure 3 with 1 supplement
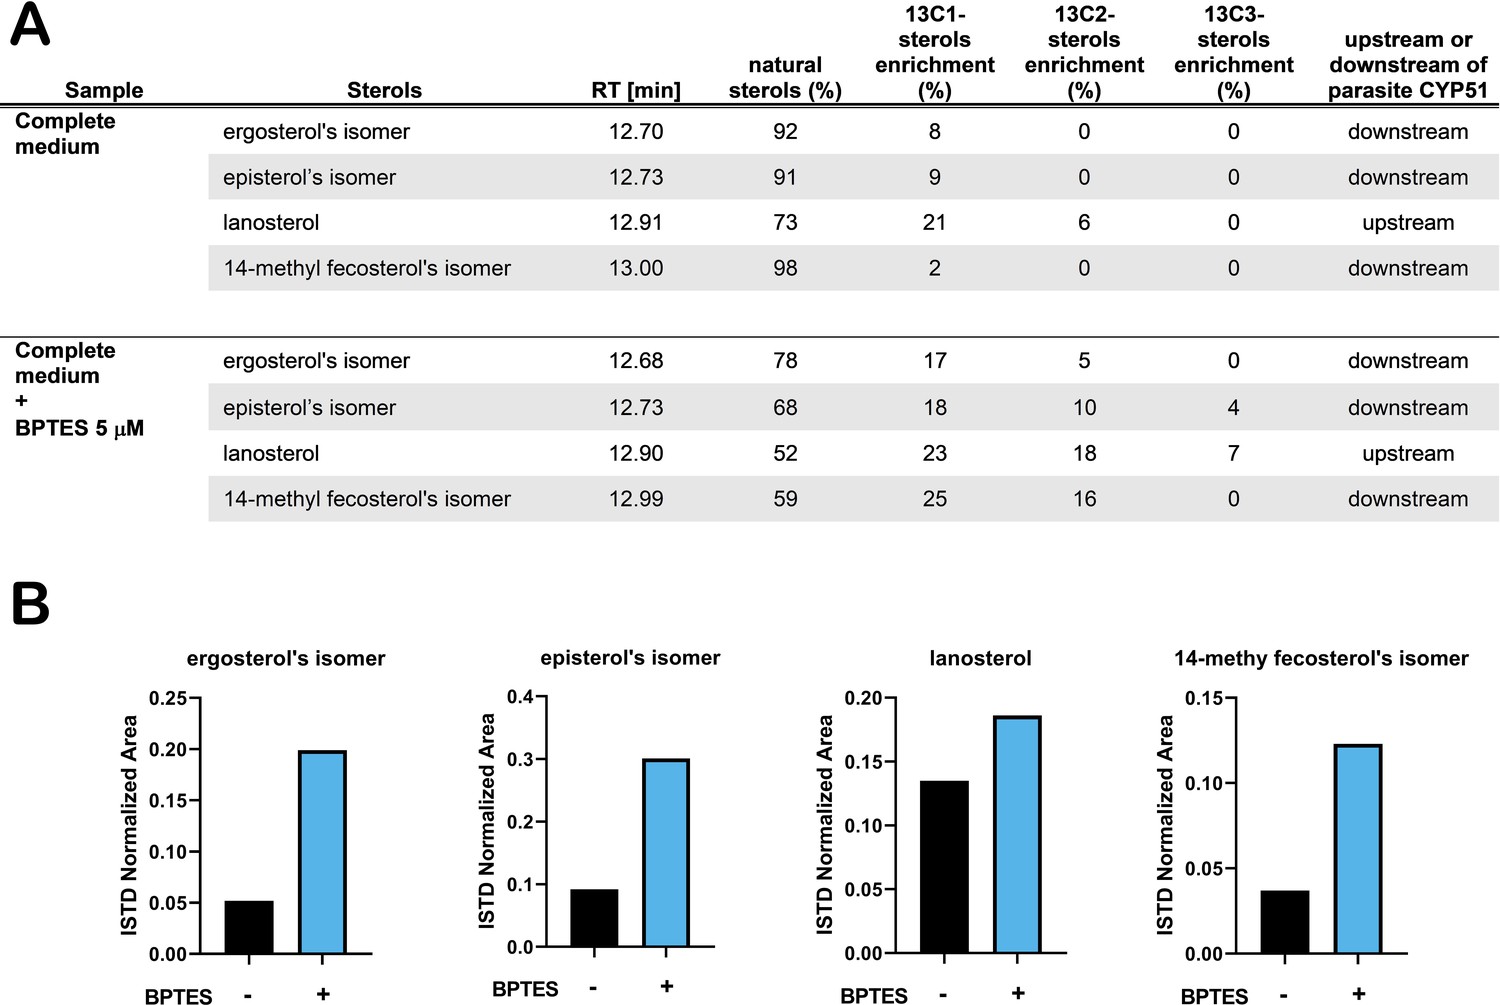
Treatment with BPTES increases incorporation of carbons from glutamine into endogenously synthesized amastigote sterols.
(A) Table of detectable isolated amastigote sterol species from and the percentage of natural sterols (i.e. without detectable 13C). The proportion of species found with the indicated number of incorporated 13C carbons are shown (e.g. 13C1, 13C2). (B) Normalized area (ISTD) of the indicated species without and without BPTES treatment.
Figure 3—figure supplement 1
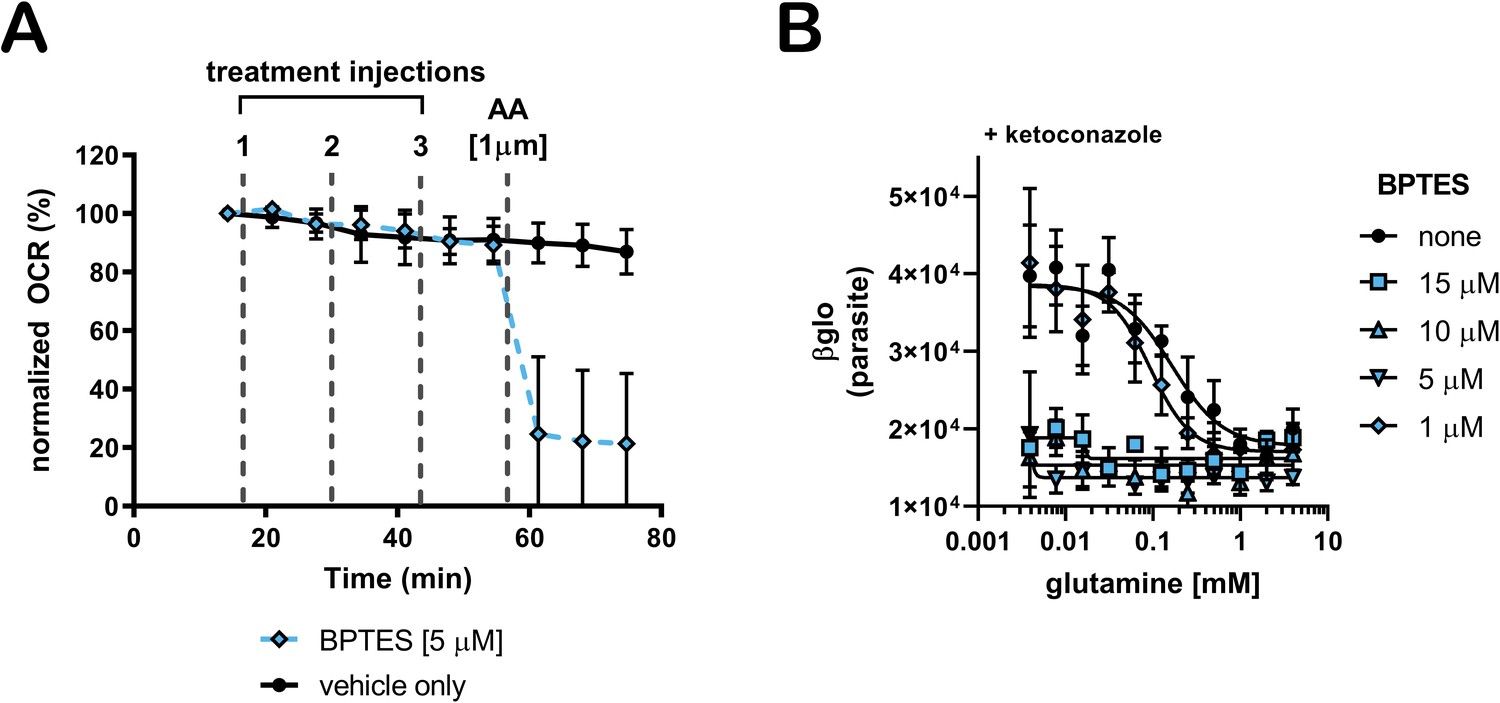
BPTES does not inhibit oxygen consumption of isolated amastigotes from glutamine and sensitizes amastigotes to ketoconazole.
(A) Measurement of the oxygen consumption rate (OCR) of isolated amastigotes when glutamine is the sole carbon source. BPTES was injected three times, increasing the BPTES concentration by 5 μM per injection for a final well concentration of 15 µM. (B) Dose response curves of glutamine in the presence of ketoconazole and at various indicated concentrations of BPTES.
Figure 4 with 1 supplement

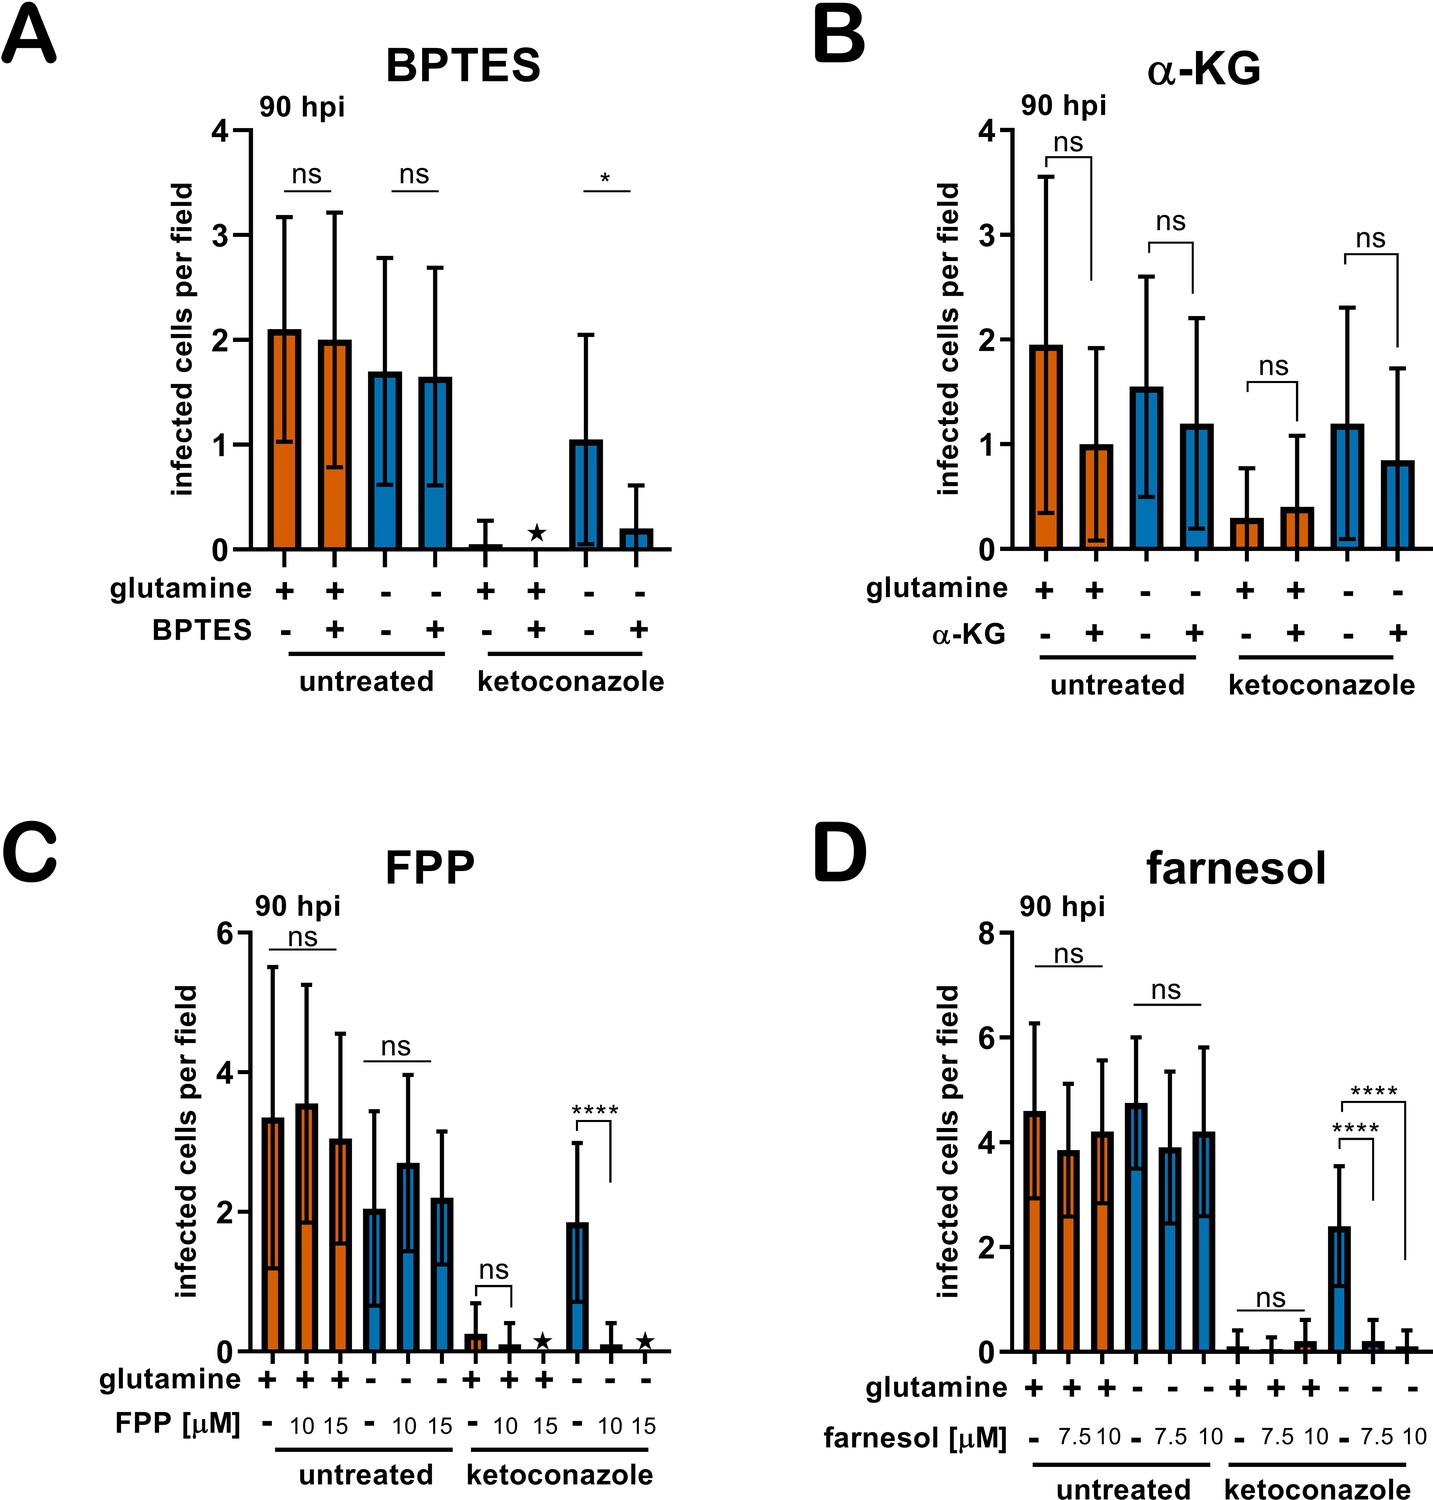
Addition of metabolites re-sensitize intracellular T. cruzi amastigotes to ketoconazole in the absence of glutamine.
(A) Schematic of endogenous sterol synthesis. Dash lined arrows indicate omission of steps for simplicity. (B) Microscopic counts of amastigotes per infected cell (n = 40) at 90 hpi treated with BPTES (5 μM), (C) αKG (10 mM), (D) FPP or (E) farnesol. Statistical comparisons between medians were performed using a Kruskal-Wallis test with Dunn’s multiple comparisons test (****p<0.0001, ***p<0.001, *p<0.05, ns = not significant).
Figure 4—figure supplement 1
Addition of metabolites re-sensitize infected cultures to ketoconazole in the absence of glutamine.
(A) Microscopic counts of infected cells per field (n = 20) at 90 hpi treated with BPTES (5 μM), (B) αKG (10 mM), (C) FPP or (D) farnesol. Comparisons of means were performed using a one-way ANOVA and Bonferroni’s multiple comparisons test (****p<0.0001, ns = not significant).
Tables
Key resources table
| Reagent type (species) or resource | Designation | Source or reference | Identifiers | Additional information |
|---|---|---|---|---|
| Strain (Trypanosoma cruzi) | Tula-βgal | ATCC | PRA-330 | Tulahuén LacZ clone C4: PMID:8913471 |
| Cell line (Macaca mulatta) | LLC-MK2 | ATCC | CCL-7 | PMID:14449902/14449901 |
| Cell line (Homo sapiens) | NHDF | Lonza | CC-2509 | Normal Human Neonatal Dermal Fibroblasts |
| Chemical compound, drug | ketoconazole | Enzo | Cat# EI107 | ≥99% (HPLC) |
| Chemical compound, drug | GNF7686 | Vitas-M Laboratory | Cat# STK393240 | PMID:26186534 |
| Other | glutamine | Gibco | Cat# A2916801 | |
| Other | 13C-glutamine | Cambridge Isotope Laboratories, Inc | Cat# CLM-1822 | Chemical Purity 98% |
Additional files
Download links
A two-part list of links to download the article, or parts of the article, in various formats.
Downloads (link to download the article as PDF)
Open citations (links to open the citations from this article in various online reference manager services)
Cite this article (links to download the citations from this article in formats compatible with various reference manager tools)
Glutamine metabolism modulates azole susceptibility in Trypanosoma cruzi amastigotes
eLife 9:e60226.
https://doi.org/10.7554/eLife.60226


