Sonic hedgehog signaling directs patterned cell remodeling during cranial neural tube closure
- Howard Hughes Medical Institute and Developmental Biology Program, Sloan Kettering Institute, United States
- Developmental Biology Program, Sloan Kettering Institute, United States
Figures
Figure 1
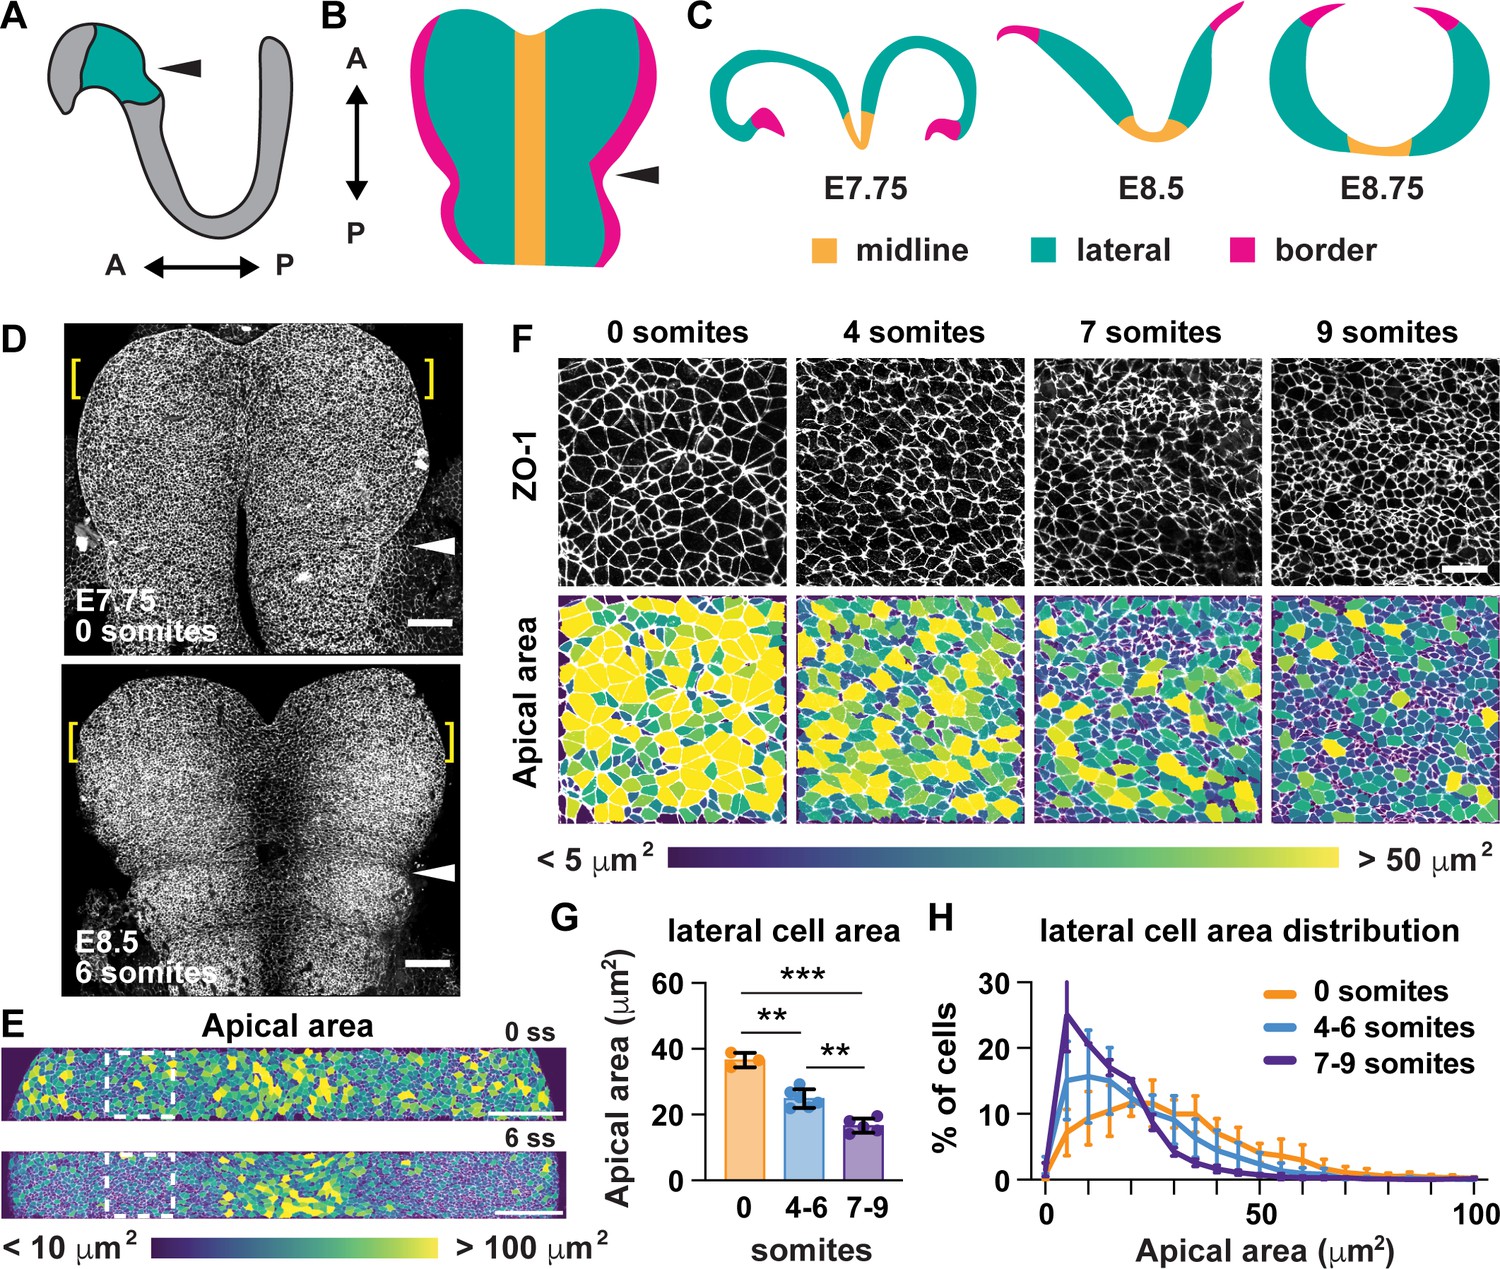
Lateral cells undergo apical remodeling during cranial neural fold elevation.
(A) Schematic lateral view of the E8.5 neural plate showing the midbrain and anterior hindbrain region in green. (B) Schematic en face view of the midbrain and anterior hindbrain region. (C) Schematic cross-sectional views of the cranial neural plate during elevation. (D) Tiled confocal images of embryos at 0 somites (E7.75) and six somites (E8.5) labeled with ZO-1. Midline in center. Arrowhead, pre-otic sulcus. Brackets, regions shown in (E). (E) Midbrain cells color-coded by apical area. Boxes, regions shown in (F). (F) Lateral cells at progressive stages of neural fold elevation. Cells are labeled with ZO-1 (top) and are color-coded by apical area (bottom). (G,H) Average apical cell area (G) and apical area distributions (H) of lateral cells during midbrain neural fold elevation. A single value was obtained for each embryo and the mean ± SD between embryos is shown, n = 3–6 embryos/stage, **p<0.01, ***p<0.001 (one-way ANOVA test). See Supplementary file 1 for n and p values. Anterior up in (D–F). Bars, 100 μm (D,E), 20 um (F).
Figure 2 with 1 supplement
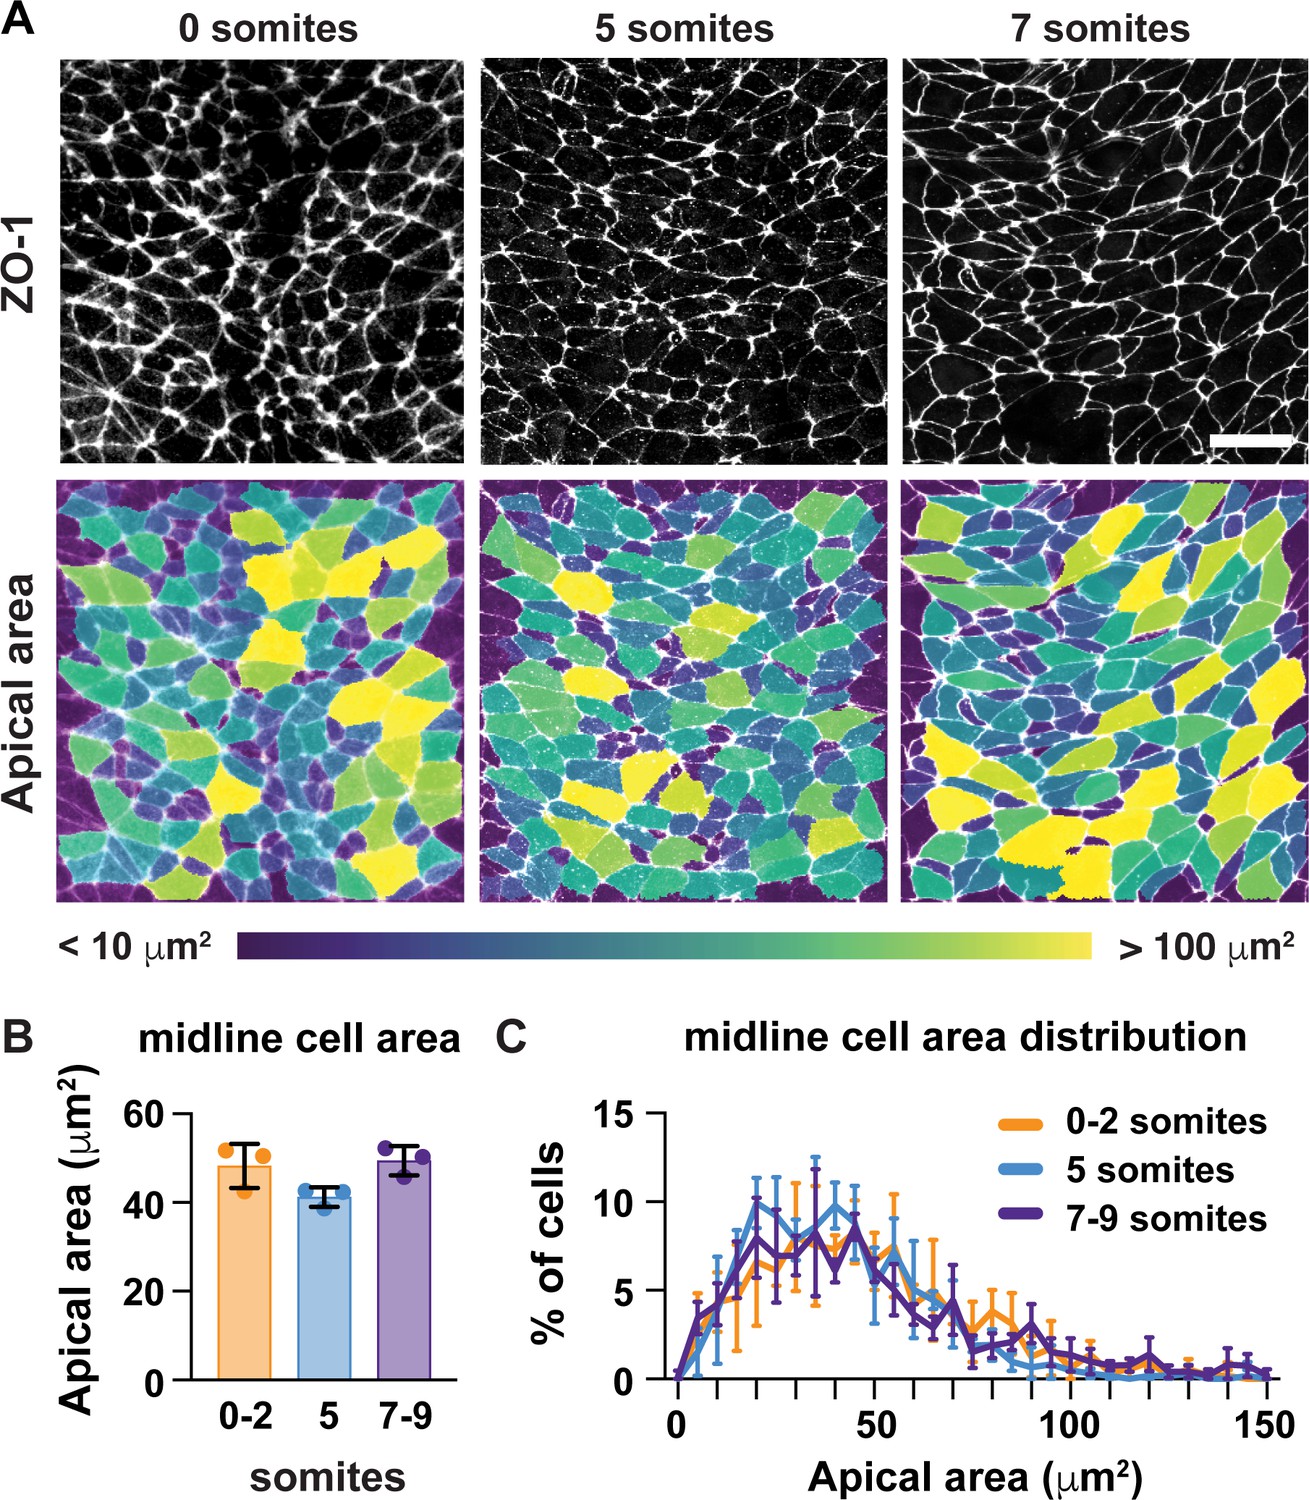
Midline cells do not undergo apical remodeling during cranial neural fold elevation.
(A) Midline cells at progressive stages of neural fold elevation. Cells are labeled with ZO-1 (top) and are color-coded by apical area (bottom). (B,C) Average apical cell area (B) and apical area distributions (C) of midline cells during midbrain neural fold elevation. A single value was obtained for each embryo and the mean ± SD between embryos is shown, n = 3 embryos/stage, no significant differences (one-way ANOVA test). See Supplementary file 1 for n and p values. Anterior up. Bar, 20 μm.
Figure 2—figure supplement 1
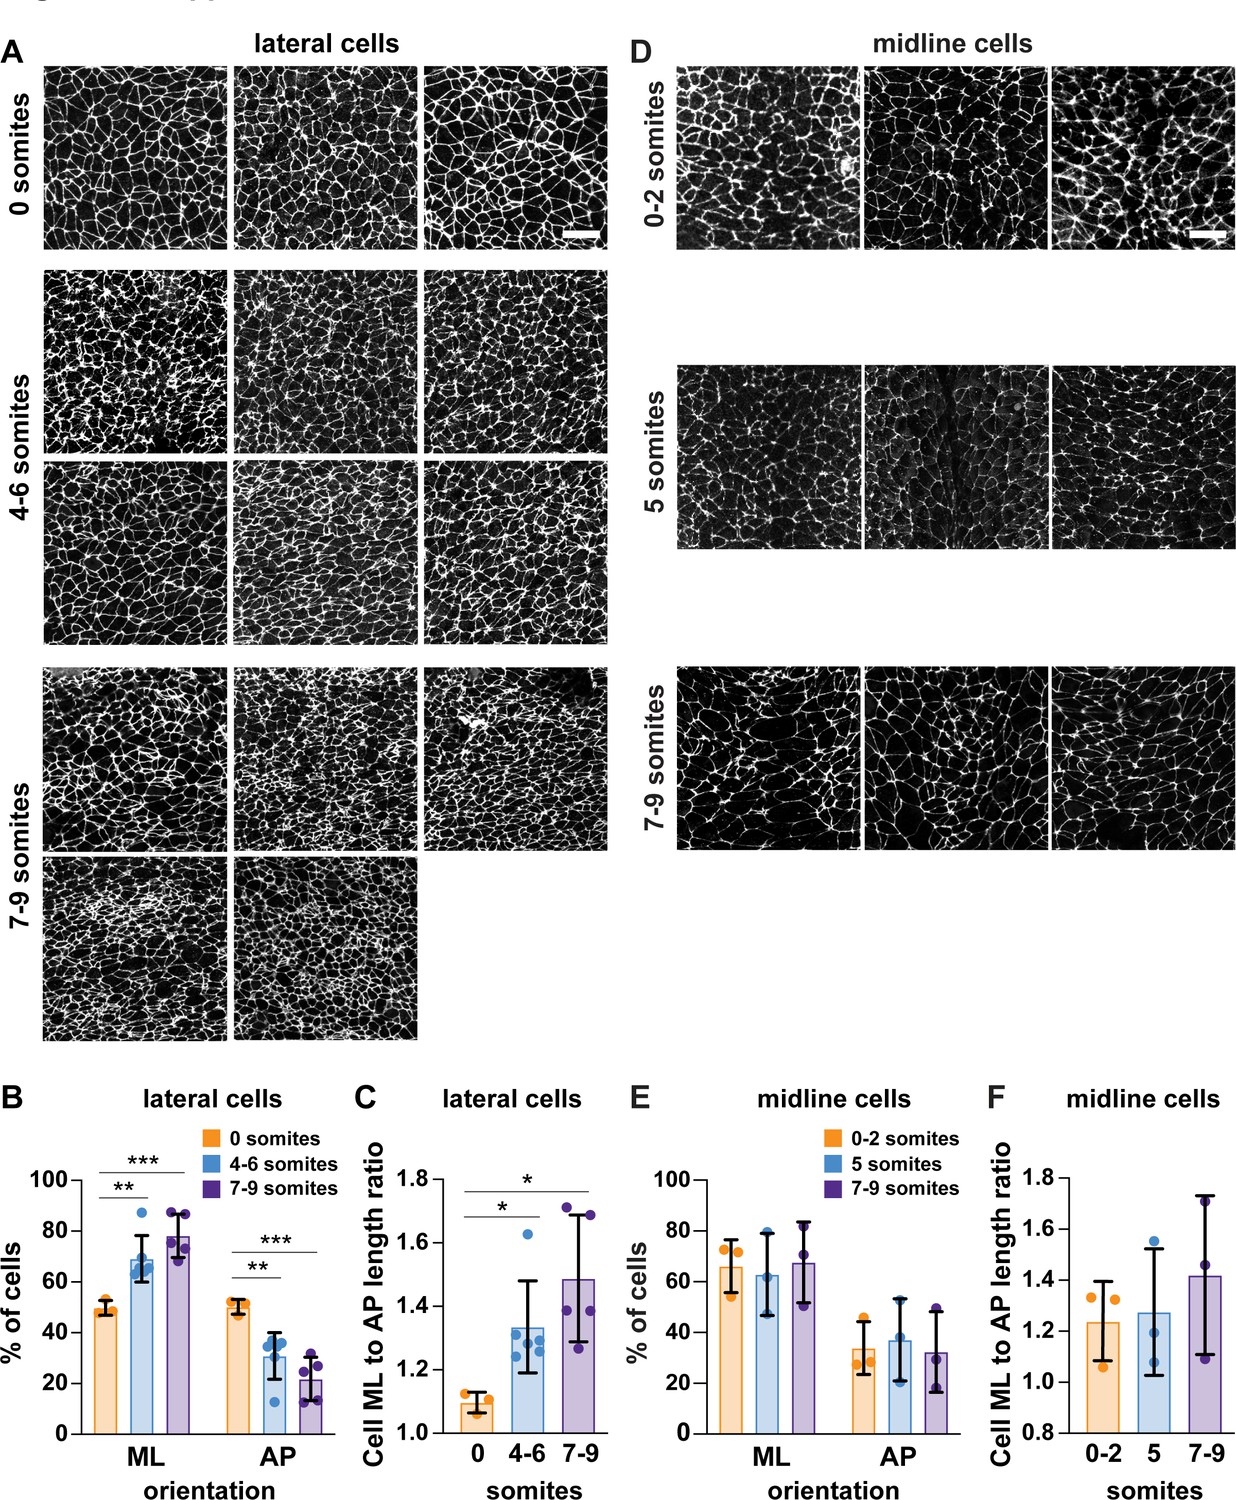
Analysis of mediolateral cell orientation in midline and lateral cells.
(A,D) One of the two 100 μm x 100 μm lateral regions analyzed in each wild-type embryo (A) and all midline regions analyzed in wild-type embryos (one image/embryo) (D) are shown. (B,E) Percentage of lateral (B) and midline (E) cells with a mediolateral (ML) orientation (0–45° relative to the ML axis) or an anterior-posterior (AP) orientation (45–90° relative to the ML axis) at progressive stages of elevation. (C,F) The average ratio of cell length along the ML axis to cell length along the AP axis in lateral (C) and midline (F) cells. A single value was obtained for each embryo and the mean ± SD between embryos is shown. n = 3–6 embryos/stage, *p<0.05, **p<0.01, ***p<0.001, two-way ANOVA test (B,E) or Brown-Forsythe and Welch one-way ANOVA test (C,F). See Supplementary file 1 for n and p values. Anterior up. Bars, 20 μm.
Figure 3 with 2 supplements
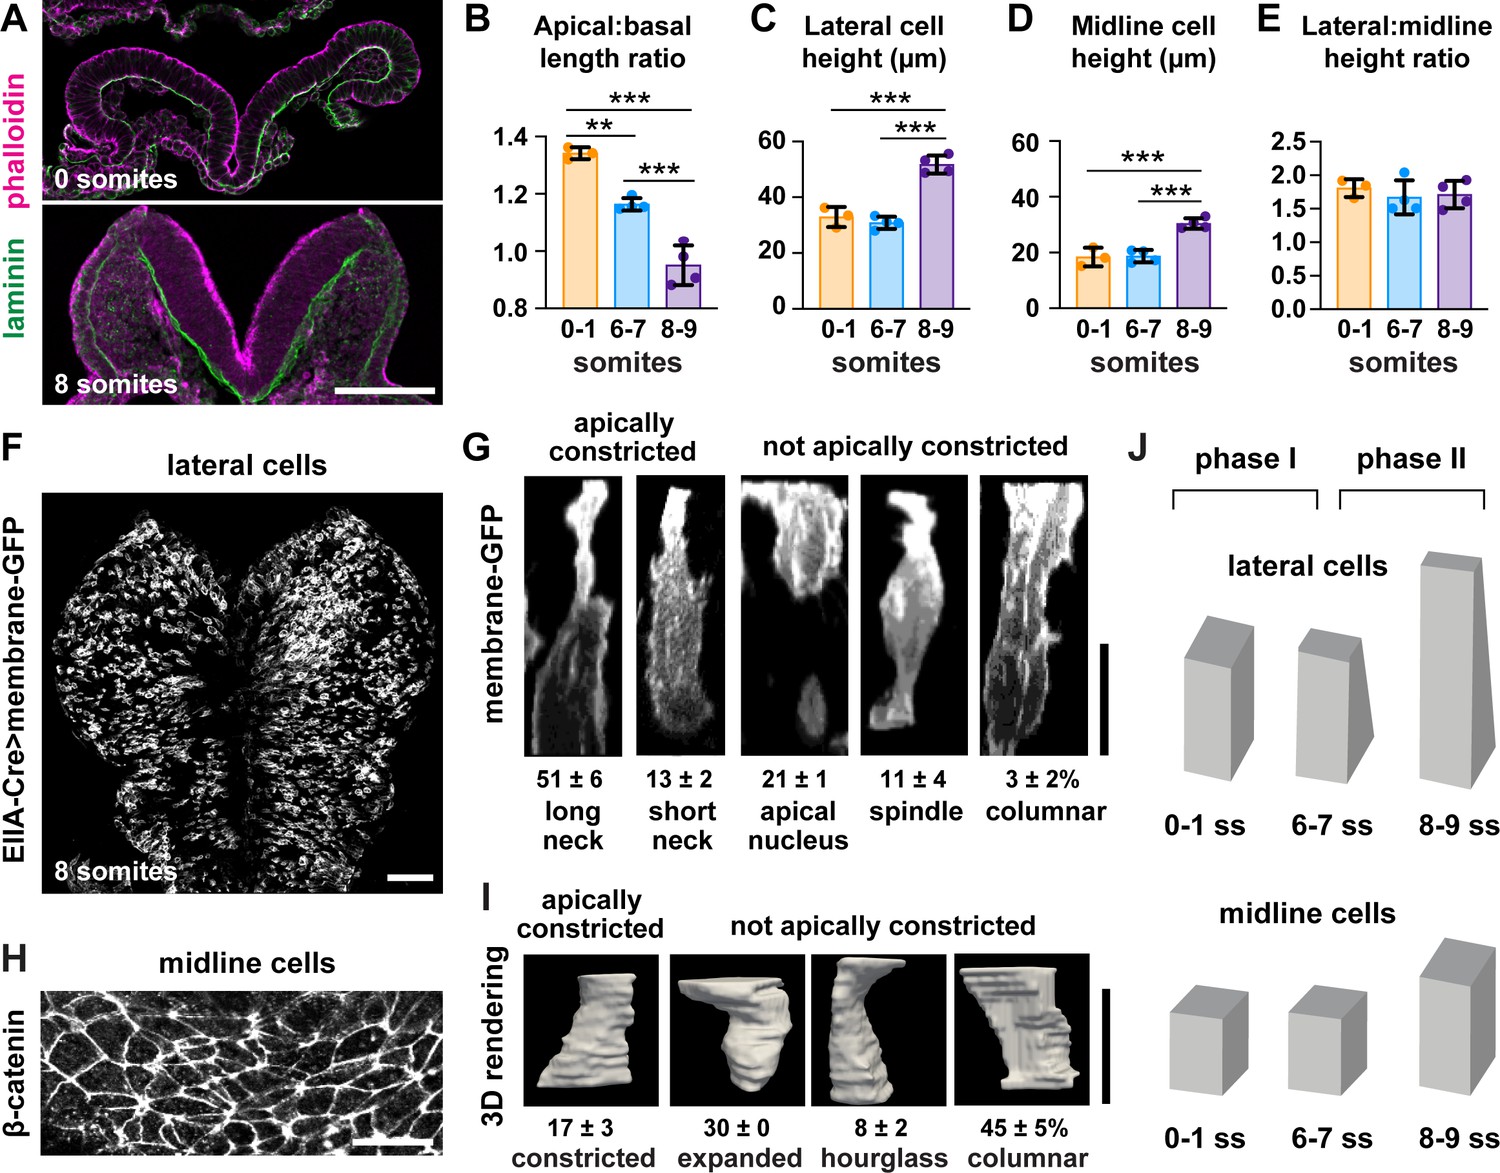
Lateral cells, but not midline cells, apically constrict.
(A) Transverse sections of the cranial neural plate. Phalloidin and laminin show the apical and basal surfaces of the neuroepithelium, respectively. (B) The ratio of the apical span to the basal span of the neural plate decreases during elevation, flipping the cranial neural plate from convex (>1) to concave (<1). (C–E) Cell height in lateral (C) and midline (D) regions increases after the seven somite stage, but the ratio (E) does not change. (F) Mosaic expression of membrane-GFP using the EIIA-Cre driver. (G) 3D projections of membrane-GFP signal from individual lateral cells. (H) Midline cells labeled with β-catenin. (I) 3D surface renderings of manually segmented midline cells. (J) Midbrain neural fold elevation occurs in two phases. Early elevation (0–6 somites) is driven by apical constriction in lateral cells without a change in cell height. At later stages (7–9 somites), both midline and lateral cells undergo significant apicobasal cell elongation. A single value was obtained for each embryo and the mean ± SD between embryos is shown, n = 3–4 embryos/stage in (B–E), 408 cells in three embryos in (G), 60 cells in three embryos in (I), **p<0.01, ***p<0.001 (one-way ANOVA test). See Supplementary file 1 for n and p values. Apical up in (A), (G), and (I), anterior up in (F) and (H). Bars, 100 μm (A,F), 20 μm (G–I).
Figure 3—figure supplement 1
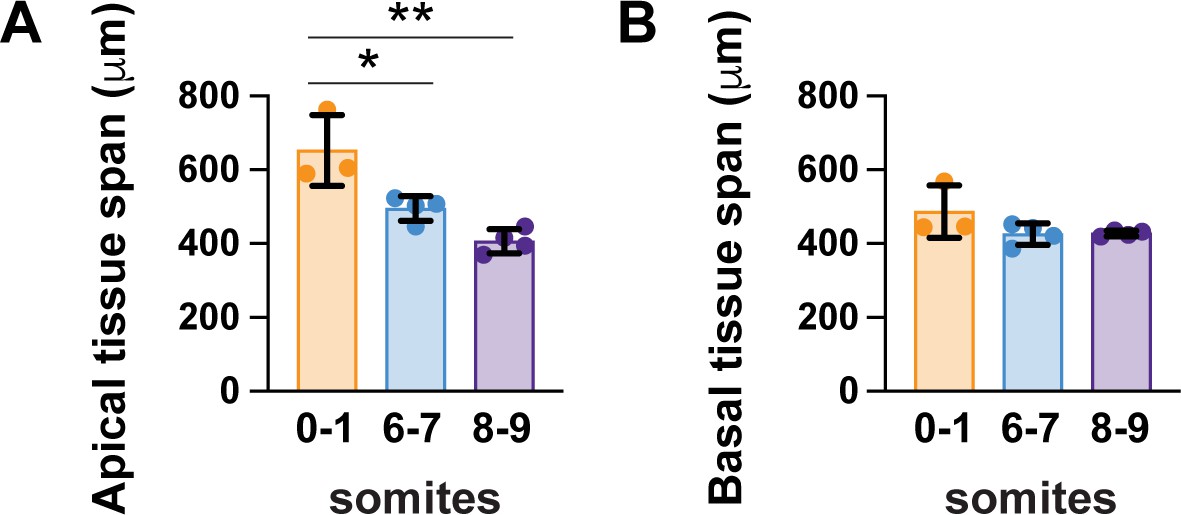
The cranial neural plate transitions from convex to concave during elevation.
(A) The apical span of the cranial neural plate decreases significantly during elevation. (B) The basal span decreases slightly but does not reach statistical significance. Apical and basal spans were measured from one border to the other in the midbrain neural plate, encompassing midline and lateral cells. A single value was obtained for each embryo and the mean ± SD between embryos is shown, n = 3–4 embryos/stage, *p<0.05, **p<0.01 (one-way ANOVA test). See Supplementary file 1 for n and p values.
Figure 3—figure supplement 2
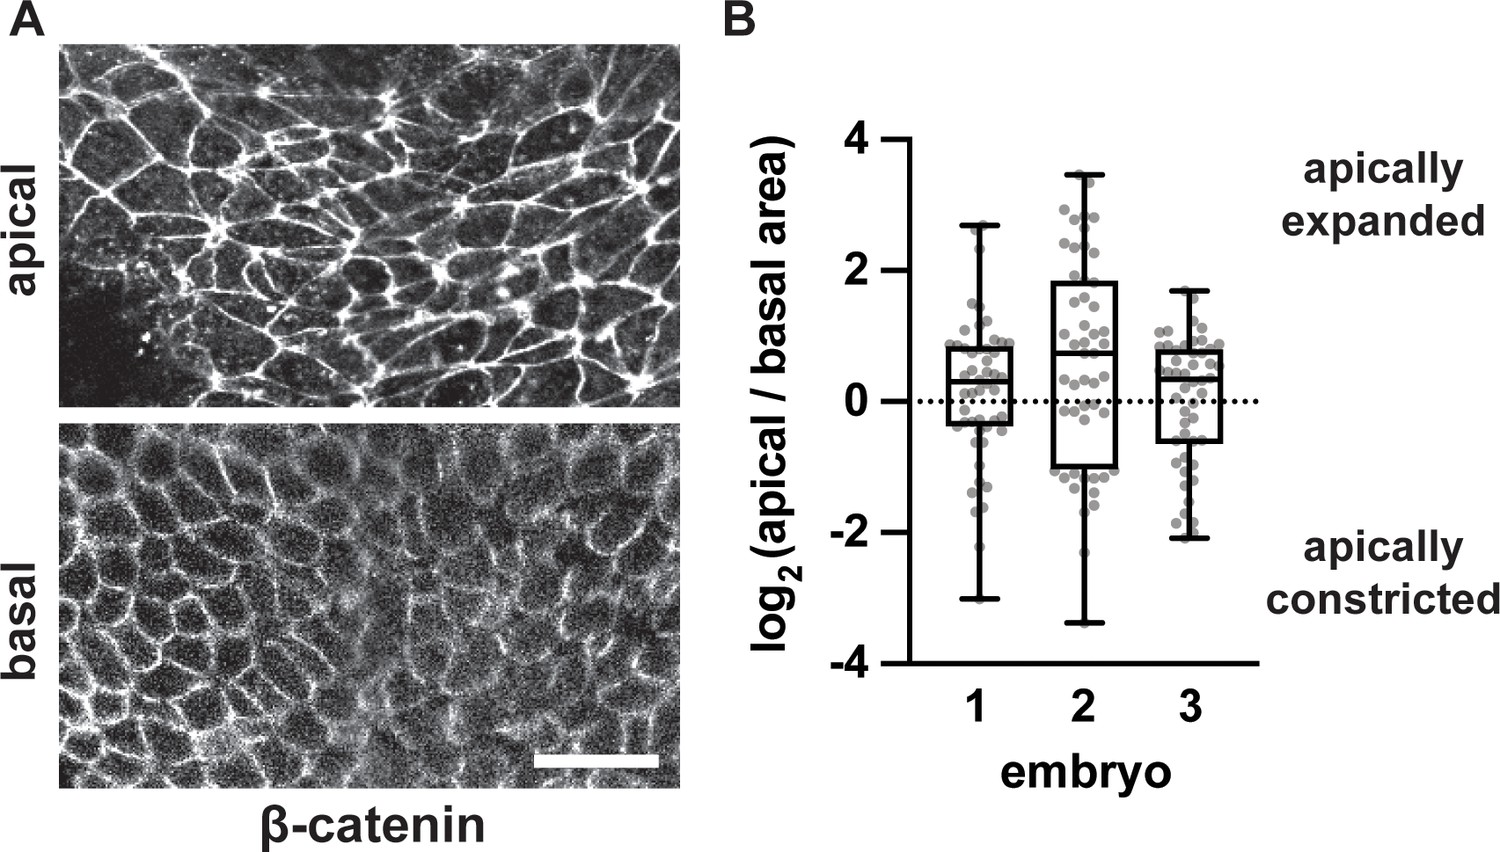
Midline cells do not apically constrict during elevation.
(A) The apical (top) and basal (bottom) surface of midline cells from a wild-type embryo. Cells outlines are labeled with β-catenin. (B) Distributions of the log2 ratios of the apical area to the basal area of individual cells in three embryos. Cells with positive values are apically expanded, whereas cells with negative values are apically constricted. n = 50 cells/embryo from three wild-type embryos. See Supplementary file 1 for n and p values. Anterior up. Bars, 20 μm.
Figure 4 with 6 supplements
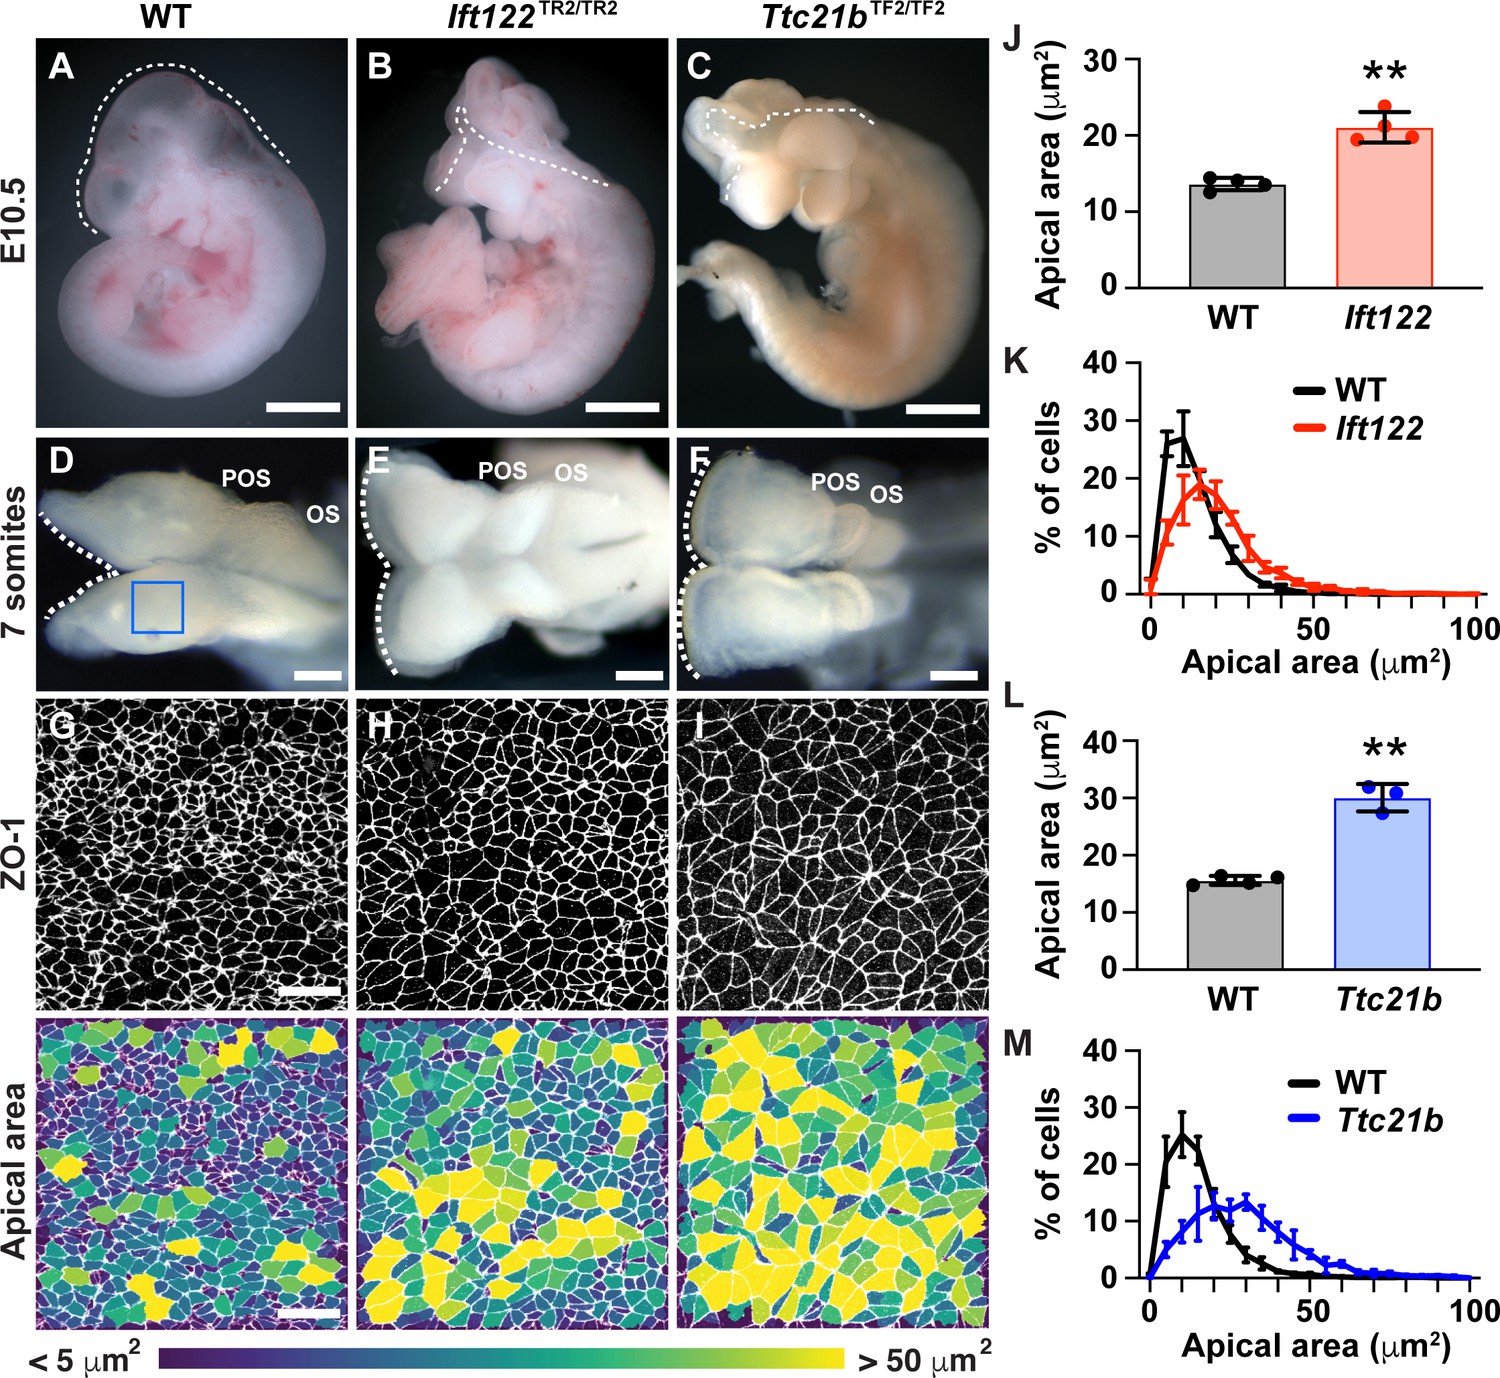
IFT-A proteins have an early role in cranial neural tube closure.
(A) Wild-type littermate control (WT) showing normal cranial closure. (B,C) Exencephaly was observed in 10/10 Ift122 mutants (B) (compared with 0/16 WT controls) and 5/5 Ttc21b mutants (C) (compared with 0/13 WT controls). Dashed lines, lateral edge of the cranial neuroepithelium. (D–F) The cranial neural folds fail to elevate in Ift122 (E) and Ttc21b (F) mutants compared to WT controls (D). Box, region shown in (G–I). (G–I) Lateral cells in WT and mutant embryos. Cells are labeled with ZO-1 (top) and are color-coded by apical area (bottom). (J–M) Average apical cell area (J,L) and apical area distributions (K,M) of lateral cells in Ift122 and Ttc21b mutants compared with WT controls. A single value was obtained for each embryo and the mean ± SD between embryos is shown, n = 3–4 embryos/genotype, **p<0.01 (Welch’s t-test). See Supplementary file 1 for n and p values. Anterior up in (A–C) and (G–I), anterior left in (D–F). Bars, 1 mm (A–C), 100 μm (D–F), and 20 μm (G–I).
Figure 4—figure supplement 1
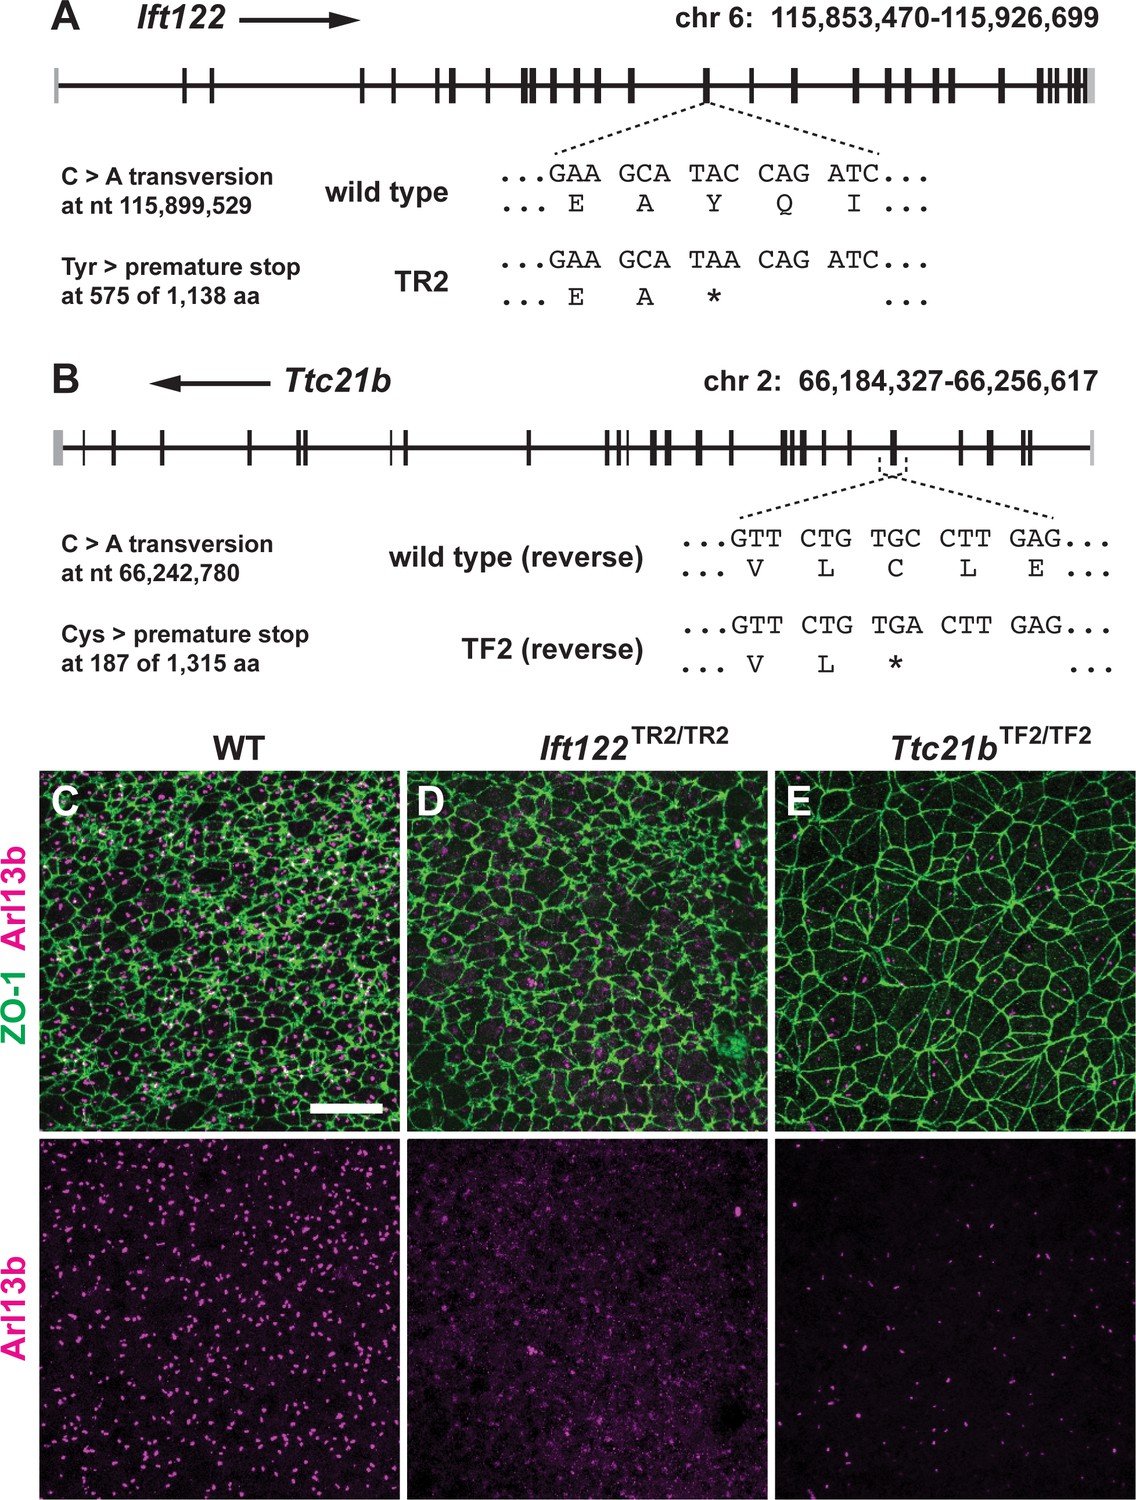
Novel Ift122 and Ttc21b alleles have defects in ciliogenesis.
(A,B) Mouse Ift122 (A) and Ttc21b (B) loci showing the Ift122TR2 and Ttc21bTF2 mutations. (C–E) Localization of ZO-1 and the cilia marker Arl13b in lateral cells of the midbrain neural plate at 7–8 somites. Note the reduction in Arl13b staining in Ift122 and Ttc21b. Anterior up. Bar, 20 μm.
Figure 4—figure supplement 2
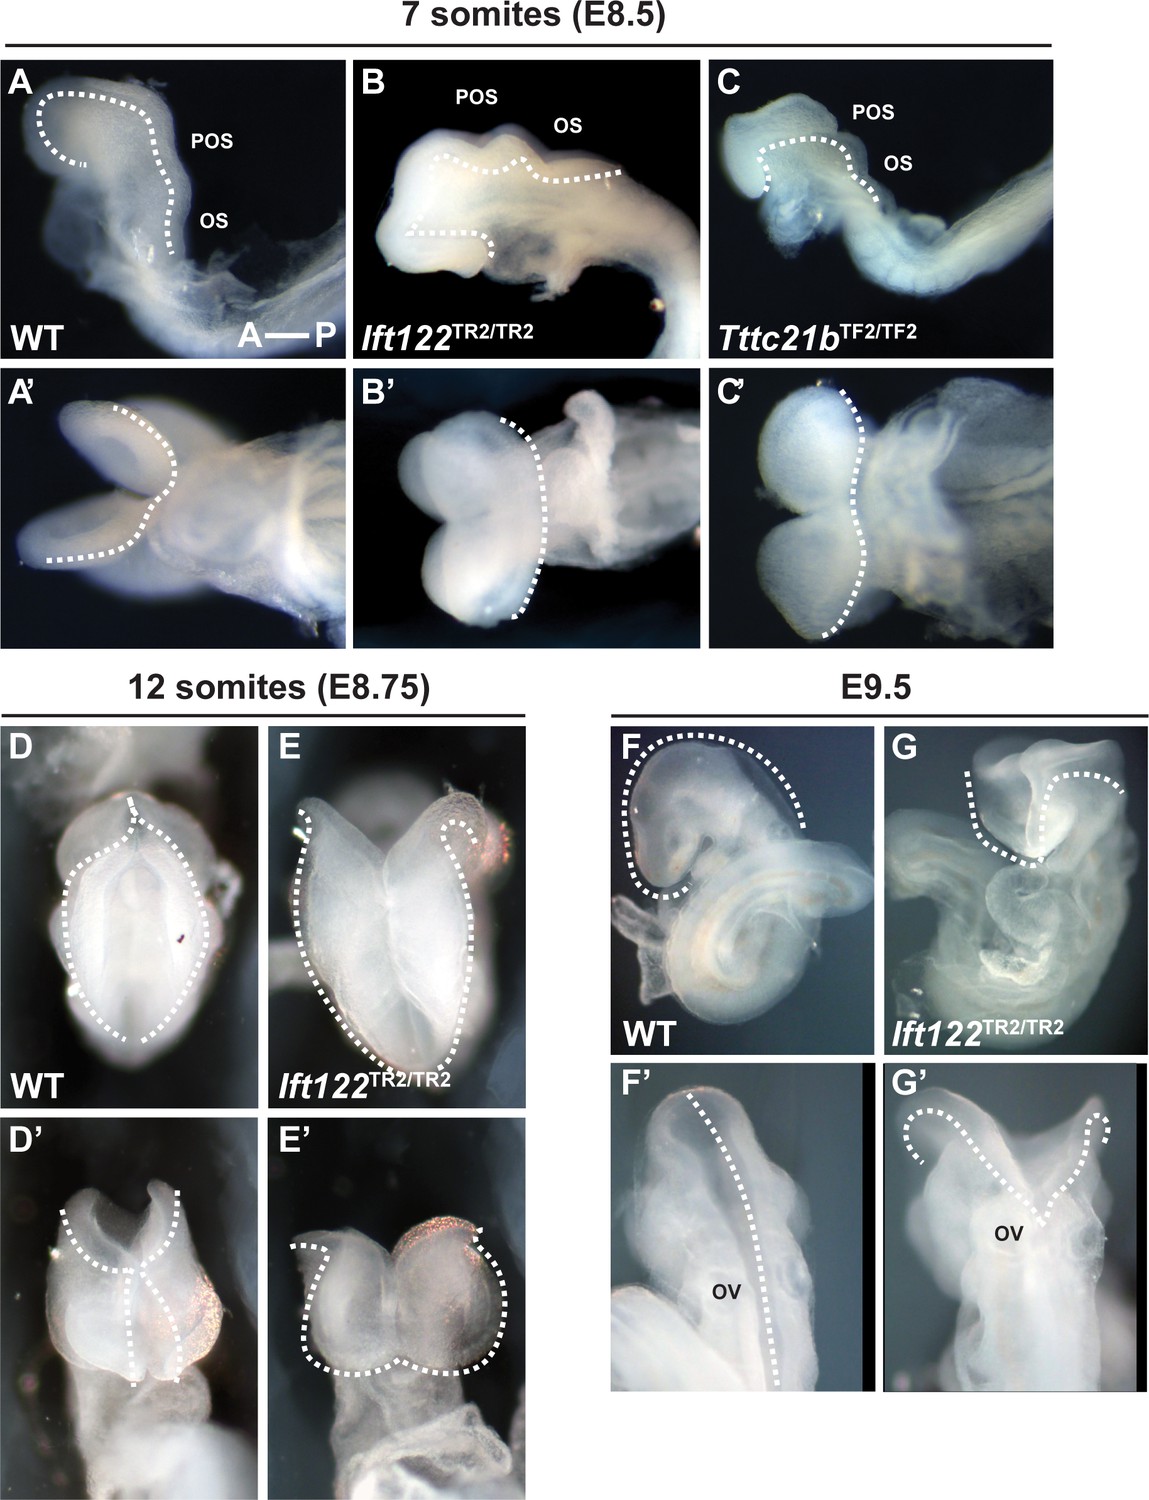
Ift122 and Ttc21b mutants display a persistent failure of neural fold elevation.
(A–C’) Ift122 and Ttc21b embryos at seven somites compared with a wild-type (WT) littermate control. Top panels, side views. Bottom panels, ventral views. Note the failure of neural fold elevation in Ift122 and Ttc21b mutants. POS, pre-otic sulcus; OS, otic sulcus. Anterior left. (D–E’) Ift122 embryos at 12 somites compared with a WT littermate control. Top panels, dorsal views. Bottom panels, frontal views. Lateral neural folds are unelevated in the Ift122 mutant midbrain and forebrain. (F–G’) Ift122 embryos at E9.5 compared with a WT littermate control. Top panels, side views. Bottom panels, dorsal views. Cranial closure is completed by E9.5 in WT but the midbrain and forebrain neural folds are unelevated in Ift122 mutants. Dashed lines indicate the lateral neural plate borders.
Figure 4—figure supplement 3
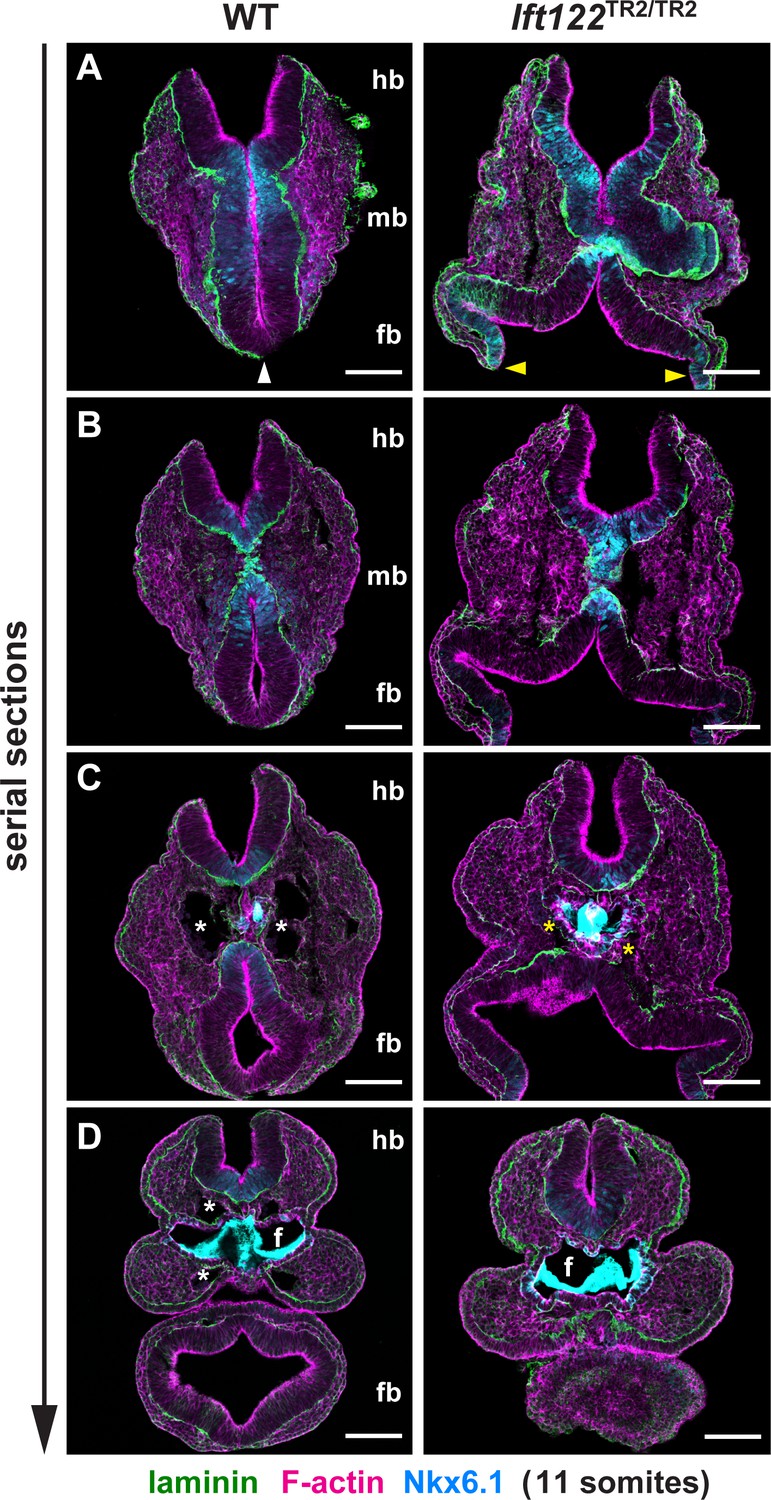
Disrupted cranial architecture in Ift122 mutants.
(A–D) Serial transverse sections through a wild-type littermate control (WT) and an Ift122 mutant embryo at 11 somites. Phalloidin and laminin label the apical and basal surfaces of the neuroepithelium, respectively. Nkx6.1 labels ventral cells. In WT, the forebrain (fb, white arrowhead in top panel) is closed and the midbrain (mb) displays substantial neural fold elevation. In contrast, the Ift122 mutant shows a failure of forebrain closure (yellow arrowheads in top panel). Asterisks indicate the connection between the dorsal aorta and the first brachial arch artery. Nkx6.1 signal in the foregut pocket (f) is nonspecific trapping of secondary antibody. Bars, 100 μm.
Figure 4—figure supplement 4
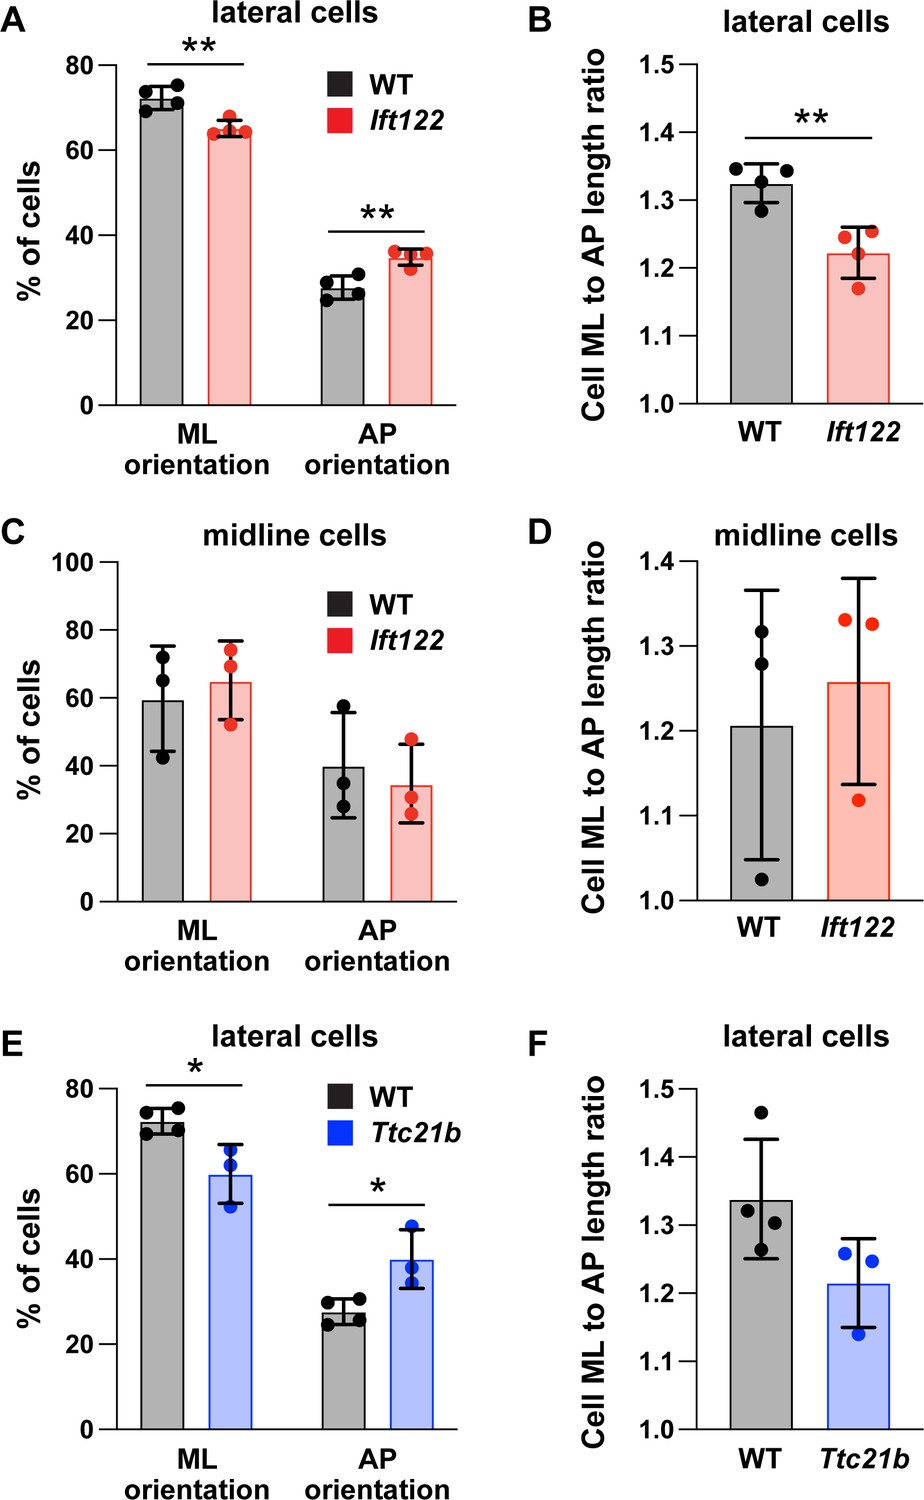
Analysis of mediolateral cell orientation in Ift122 and Ttc21b mutants.
(A,C) Percentage of lateral cells (A) and midline cells (C) with a mediolateral (ML) orientation (0–45° relative to the ML axis) or an anterior-posterior (AP) orientation (45–90° relative to the ML axis) in Ift122 mutants and wild-type littermate controls (WT). (B,D) Average ratio of cell length along the ML and AP axes. (E) Percentage of lateral cells with an ML or AP orientation in Ttc21b mutants and WT littermate controls. (F) Average ratio of cell length along the ML and AP axes. Midline cells could not be analyzed due to deep midline folds in Ttc21b mutants. A single value was obtained for each embryo and the mean ± SD between embryos is shown. n = 3–4 embryos/genotype, *p<0.05, **p<0.01, two-way ANOVA test (A,C,E) or Welch’s t-test (B,D,F). See Supplementary file 1 for n and p values.
Figure 4—figure supplement 5
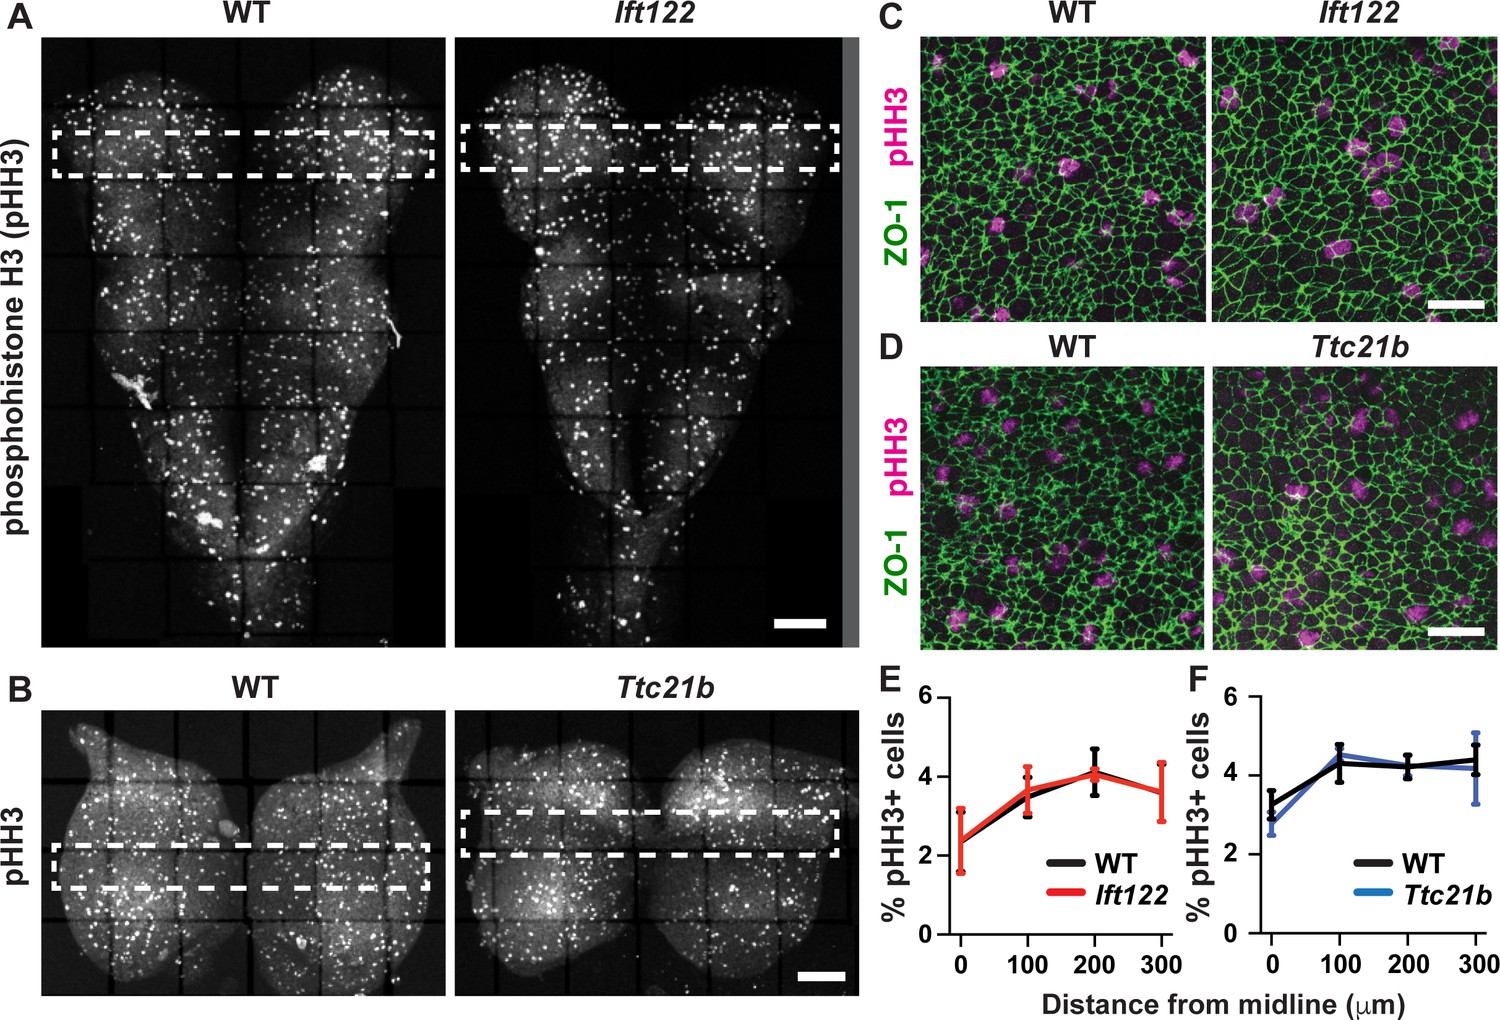
Cell proliferation is not affected in Ift122 and Ttc21b mutants.
(A) Images of the cranial neuroepithelium from the midbrain at the level of the cranial flexure (top) to the closed hindbrain (bottom) in a wild-type littermate control (WT) and an Ift122 mutant. Dividing cells are labeled with phospho-histone H3 (pHH3), which labels cells in M phase. Dashed rectangles indicate regions analyzed in (E). (B) Projections of the cranial neuroepithelium from the forebrain-midbrain border (top) to the midbrain-hindbrain border (bottom) showing M-phase cells labeled with pHH3. Dashed rectangles indicate regions analyzed in (F). (C,D) Lateral cells in Ift122 (C) and Ttc21b (D) mutants and littermate controls labeled with pHH3 and ZO-1. (E,F) The percentage of proliferative (pHH3+) cells in 100 μm x 100 μm regions plotted by distance from the midline. Each bin is plotted at the minimum distance for that bin. A single value was obtained for each embryo and the mean ± SD between embryos is shown, n = 3 embryos/genotype. No significant differences were observed between mutant embryos and WT controls (two-way ANOVA test). See Supplementary file 1 for n and p values. Anterior up. Bars, 100 μm (A,B), 20 μm (C,D).
Figure 4—figure supplement 6

Mesenchymal cell density is not affected in Ttc21b mutants.
(A) Cell nuclei visualized with DAPI in the plane of the mesenchymal cells underlying the cranial neural plate from transverse sections of individual embryos. (B) The number of mesenchymal cells per 50 μm x 100 μm region is plotted for Ttc21b mutants and wild-type littermate controls (WT). A single value was obtained for each embryo and the mean ± SD between embryos is shown, n = 3 embryos/genotype, Welch’s t-test. No significant differences between genotypes were observed. See Supplementary file 1 for n and p values. Apical up. Bar, 20 μm.
Figure 5 with 1 supplement
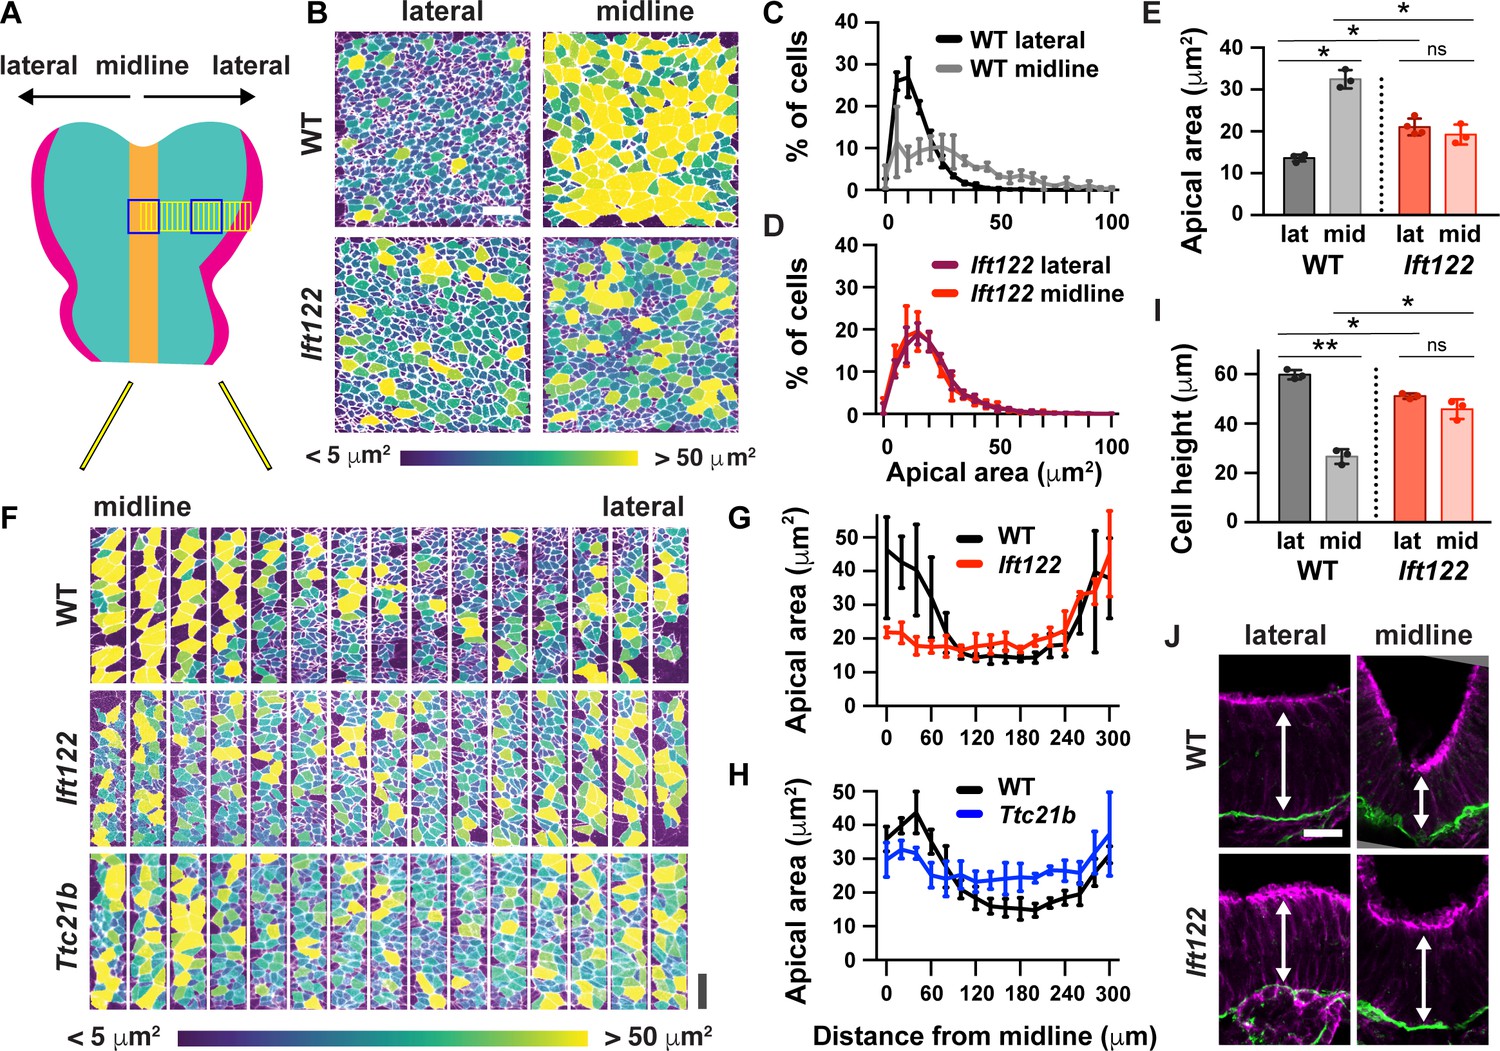
IFT-A mutants display a failure of patterned apical remodeling.
(A) Schematic of midbrain regions analyzed in (B) (blue boxes) and (F) (yellow boxes). (B) Lateral and midline cells labeled with ZO1 are color-coded by apical area in wild-type littermate control (WT) and Ift122 mutant embryos. (C–E) Apical area distributions (C,D) and average apical cell area (E). Lateral measurements are reproduced from Figure 4J. (F) Contiguous 20 μm wide regions spanning the mediolateral axis from the midline to the lateral margins of the midbrain neural plate. Cells are labeled with ZO1 and color-coded by apical area. (G,H) Apical cell area plotted by distance from the midline. (I,J) Average cell height in midline and lateral cells (I) measured in transverse sections of the cranial neural plate (J). Phalloidin and laminin show apical and basal surfaces, respectively. A single value was obtained for each embryo and the mean ± SD between embryos is shown, n = 3–4 embryos/genotype, *p<0.05, **p<0.01 (one-way ANOVA test). See Supplementary file 1 for n and p values. Embryos are anterior up, 7 somites (B–H) or apical up, 12 somites (I,J). Bars, 20 μm.
Figure 5—figure supplement 1
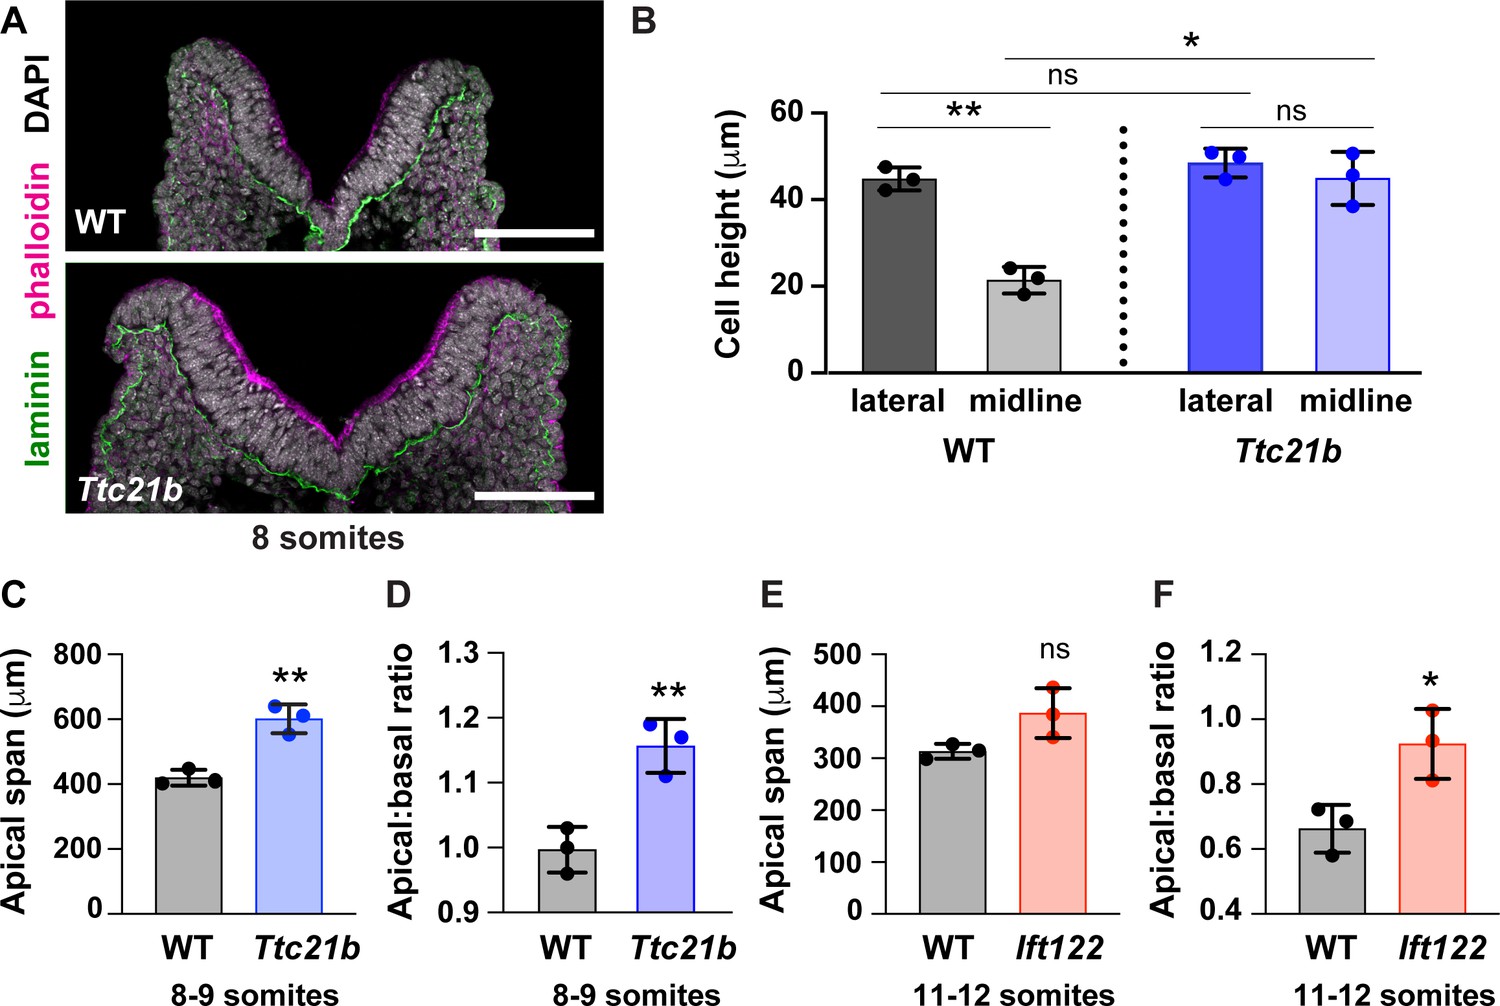
The convex to concave transition is defective in Ift122 and Ttc21b mutants.
(A) Transverse sections of a Ttc21b mutant and a wild-type littermate control (WT) at eight somites. Phalloidin and laminin label the apical and basal surfaces of the neuroepithelium, respectively. DAPI (white) shows the nuclei. (B) Midline cells are significantly shorter than lateral cells in WT controls at eight somites. This difference is eliminated in Ttc21b mutants. (C–F) The ratio of the apical span to the basal span of the neuroepithelium is increased in Ttc21b mutants at mid-elevation (8–9 somites) (C,D) and in Ift122 mutants at late elevation (12 somites) (E,F). Apical and basal spans were measured from one border to the other, encompassing midline and lateral cells. A single value was obtained for each embryo and the mean ± SD between embryos is shown, n = 3 embryos/genotype, *p<0.05, **p<0.01 (one-way ANOVA test in B, Welch’s t-test in C–F). See Supplementary file 1 for n and p values. Apical up. Bars, 20 μm.
Figure 6
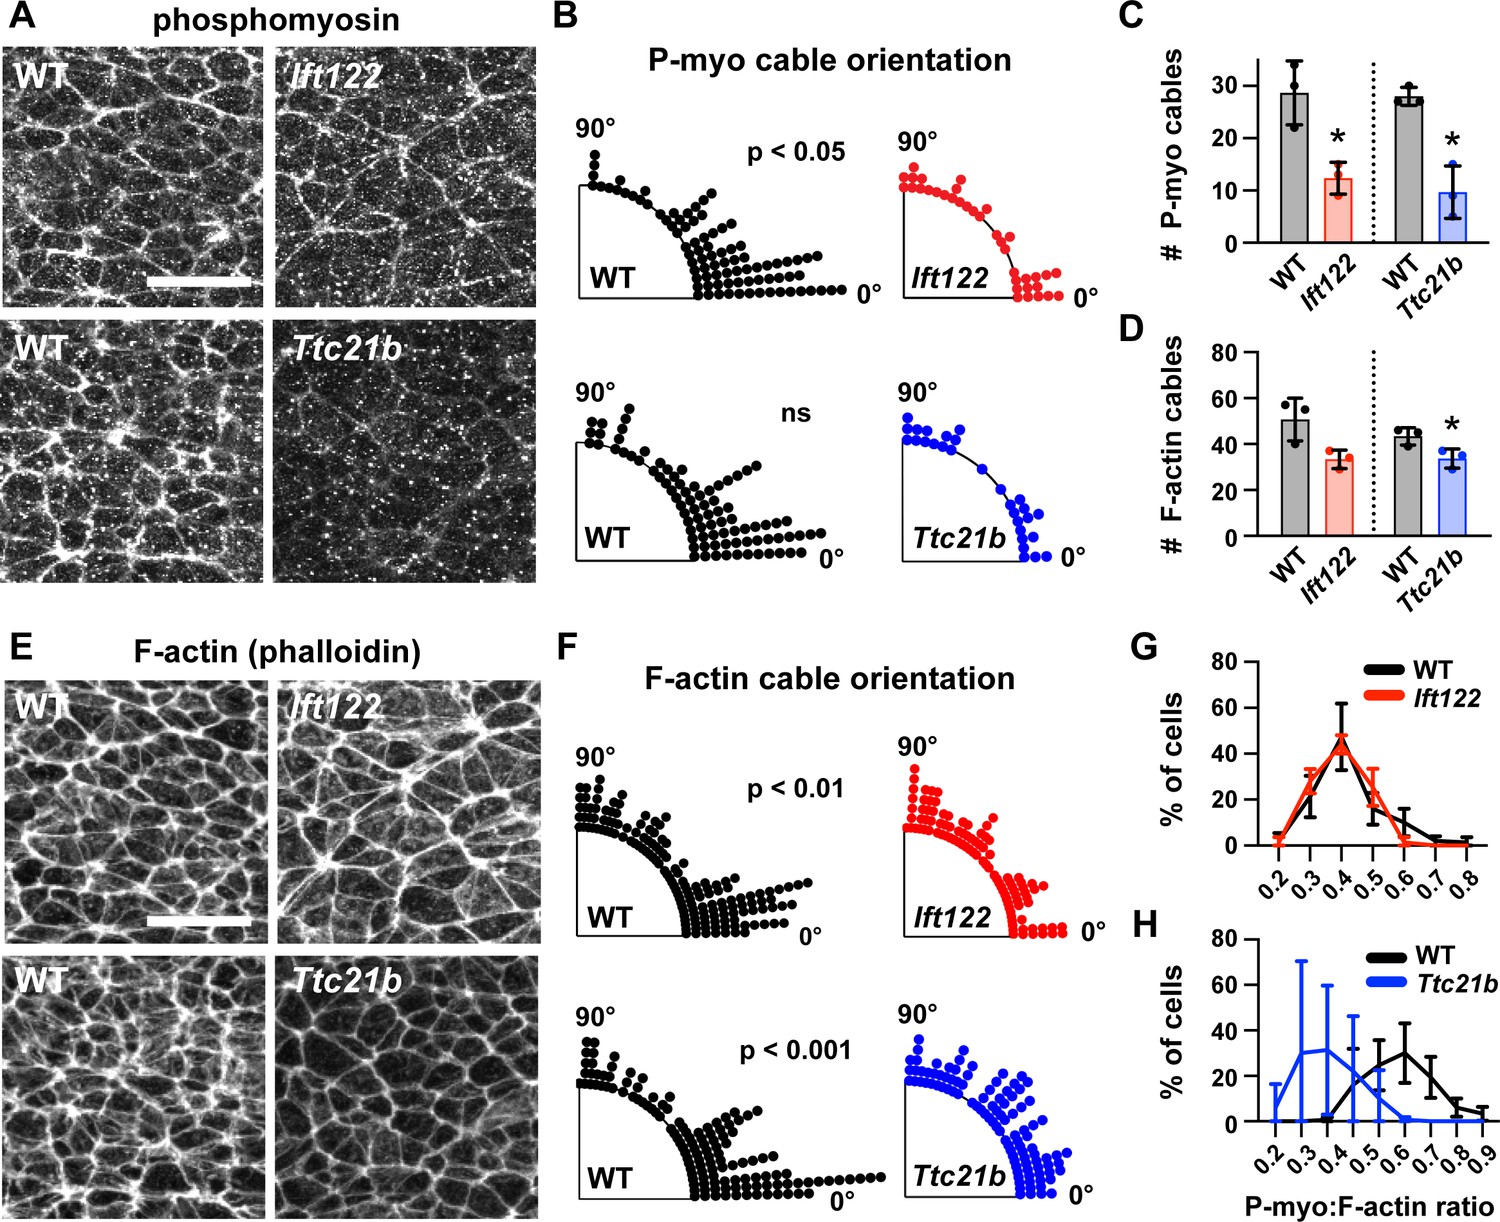
Actomyosin organization is disrupted in IFT-A mutants.
(A,E) Localization of phosphorylated myosin II (phosphomyosin) (A) and F-actin (E) in lateral cells of Ift122 and Ttc21b mutants and wild-type littermate controls (WT). (B,F) Orientation of apical phosphomyosin (P-myo) cables (B) and F-actin cables (F) in Ift122 and Ttc21b mutants and WT controls. (C,D) The number of phosphomyosin cables (C) and F-actin cables (D) per embryo in two 100 μm x 100 μm lateral regions in Ift122 and Ttc21b mutants. (G,H) The ratio of phosphomyosin to F-actin at cell-cell junctions was shifted to lower values in Ttc21b mutants. A single value was obtained from each embryo and the mean ± SD between embryos is shown, n = 29–86 phosphomyosin cables and 100–151 F-actin cables from three embryos/genotype in (A–F), 50 cells from three embryos/genotype (G,H), *p<0.05, Welch’s t-test in (C,D), Watson two-sample test for homogeneity (B,F). See Supplementary file 1 for n and p values. Embryos are 7-8 somites. Anterior up. Bars, 20 μm.
Figure 7

Shh-dependent cell fates expand laterally in Ift122 and Ttc21b mutants.
(A) Nkx6.1 protein visualized in tiled confocal images of cranial neural plate cells labeled with phalloidin (F-actin). (B,C) Nkx6.1 intensity plotted by distance from the midline, normalized to the mean Nkx6.1 intensity of the image, in Ift122 (B) and Ttc21b (C) mutants compared with wild-type littermate controls (WT). A single value was obtained for each embryo and the mean ± SD between embryos is shown, n = 3 embryos/genotype. Anterior up. Bars, 100 μm.
Figure 8 with 2 supplements
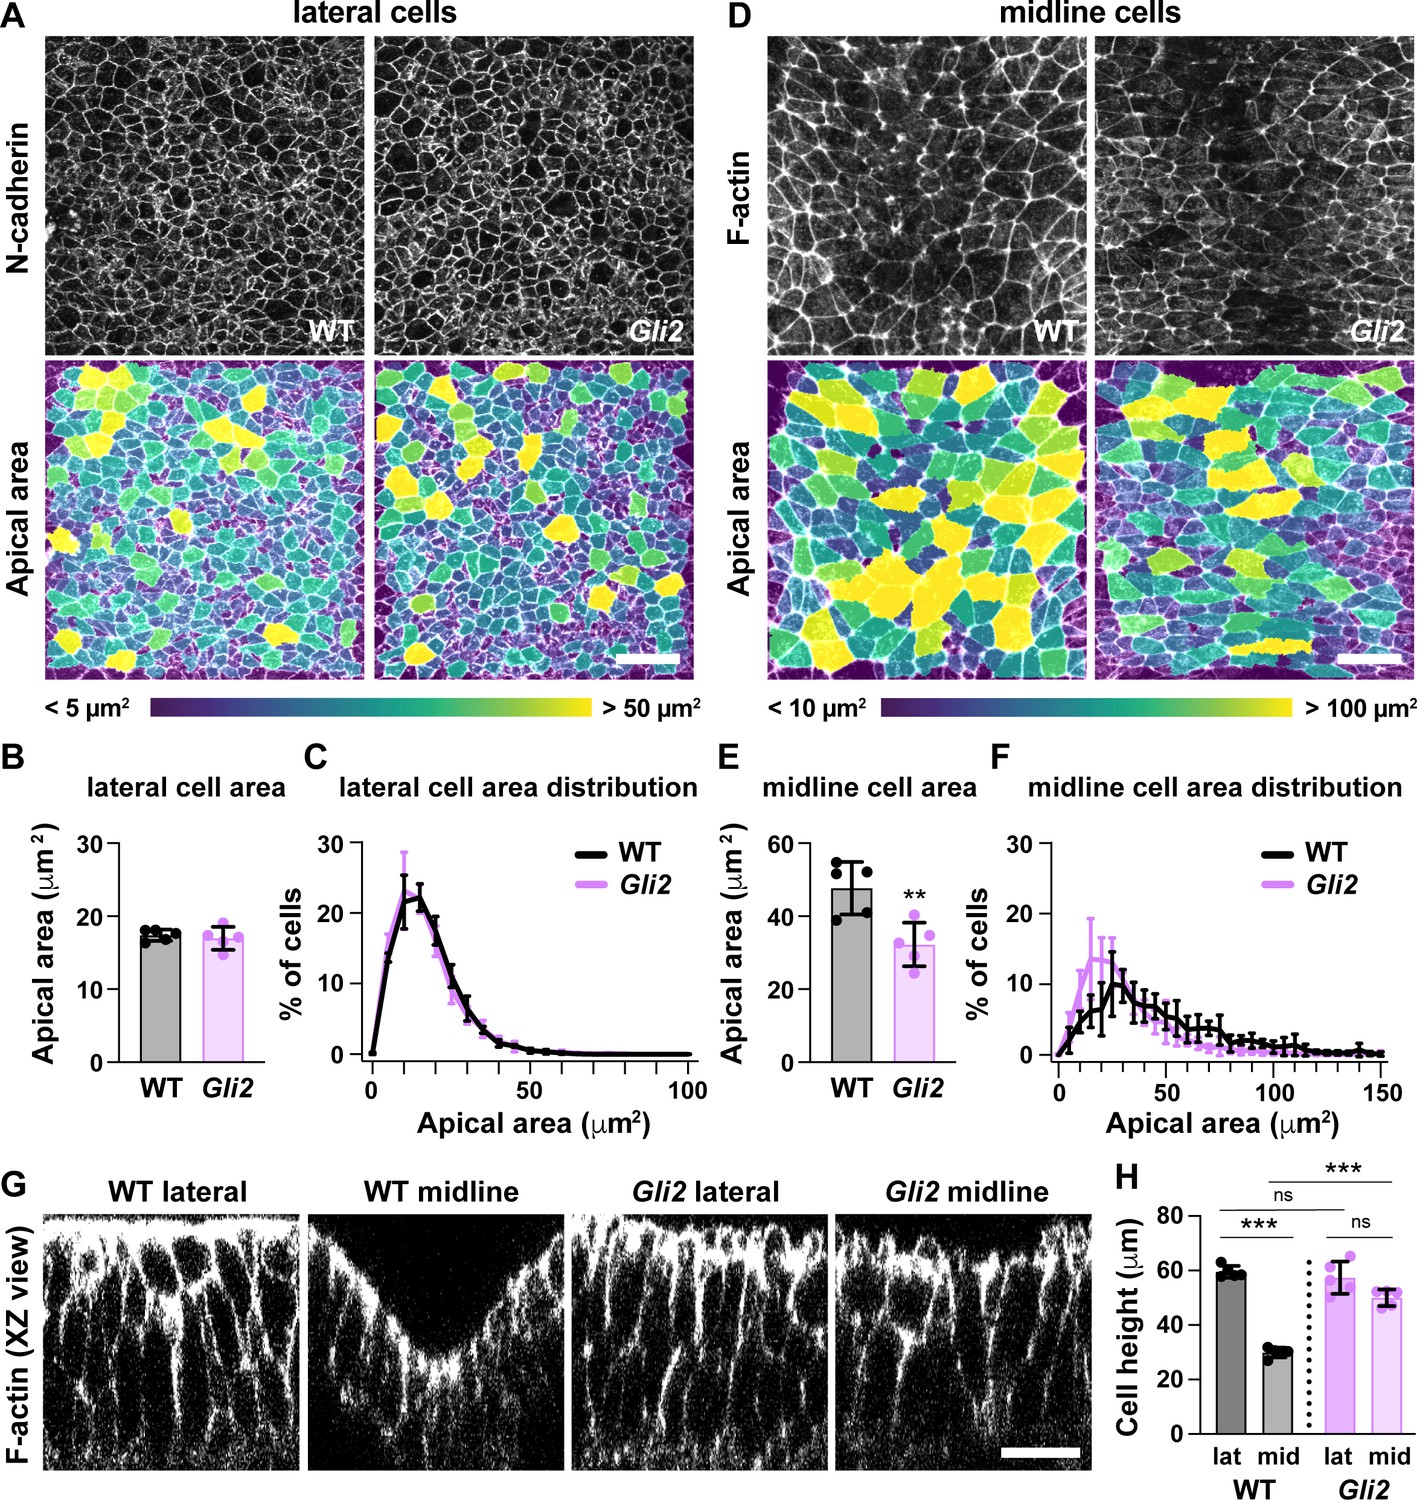
Loss of Gli2 disrupts midline but not lateral cell shape.
(A,D) Lateral (A) and midline (D) cells in Gli2 mutant embryos and wild-type littermate controls (WT). Cells are labeled with N-cadherin or phalloidin (top) and color coded by apical area (bottom). (B,C,E,F) Average apical cell area (B,E) and apical area distributions (C,F) of lateral and midline cells from WT and Gli2 mutant embryos. (G) XZ reconstructions of lateral and midline cells labeled with F-actin in WT and Gli2 mutant embryos. (H) Cell height in lateral and midline cells in WT and Gli2 mutant embryos. A single value was obtained for each embryo and the mean ± SD is shown. n = 5 embryos/genotype, **p<0.01, ***p<0.001, Welch’s t-test (B,E) or Brown-Forsythe one-way ANOVA test (H). See Supplementary file 1 for n and p values. Embryos are 7–9 somites. Anterior up in (A,D), apical up in (G). Bars, 20 μm.
Figure 8—figure supplement 1
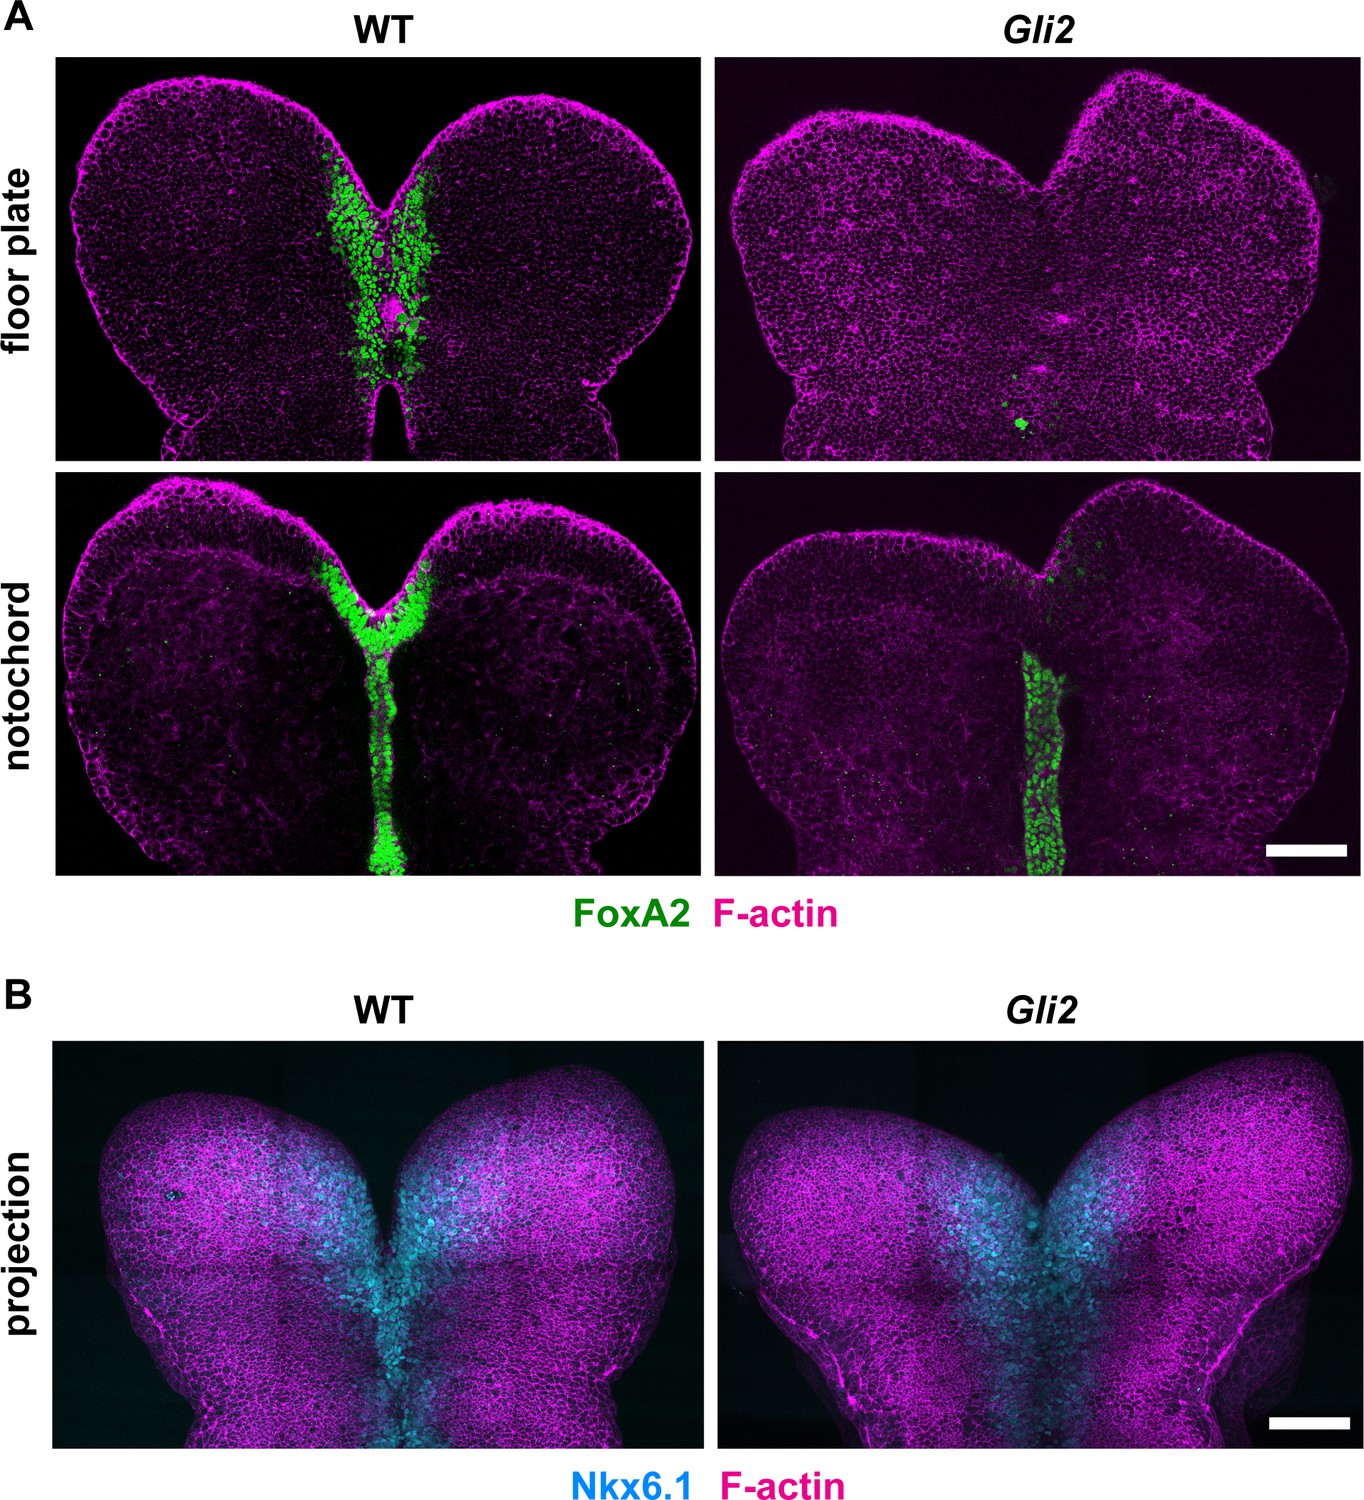
Gli2 is required for FoxA2 expression in the ventral neural plate.
(A) Single z-planes of Gli2 mutant and wild-type littermate control (WT) embryos at the level of the floor plate of the midbrain neural plate (top) or at the level of the underlying notochord (bottom) labeled with the ventral/floor plate marker FoxA2 and counterstained with phalloidin (F-actin). Note that FoxA2 is expressed in the notochord but not the floor plate of Gli2 mutants. (B) Maximum-intensity projections of WT control and Gli2 mutant neural plates labeled with the ventral marker Nkx6.1 and phalloidin. Embryos are 7–8 somites. Anterior up. Bars, 100 μm.
Figure 8—figure supplement 2
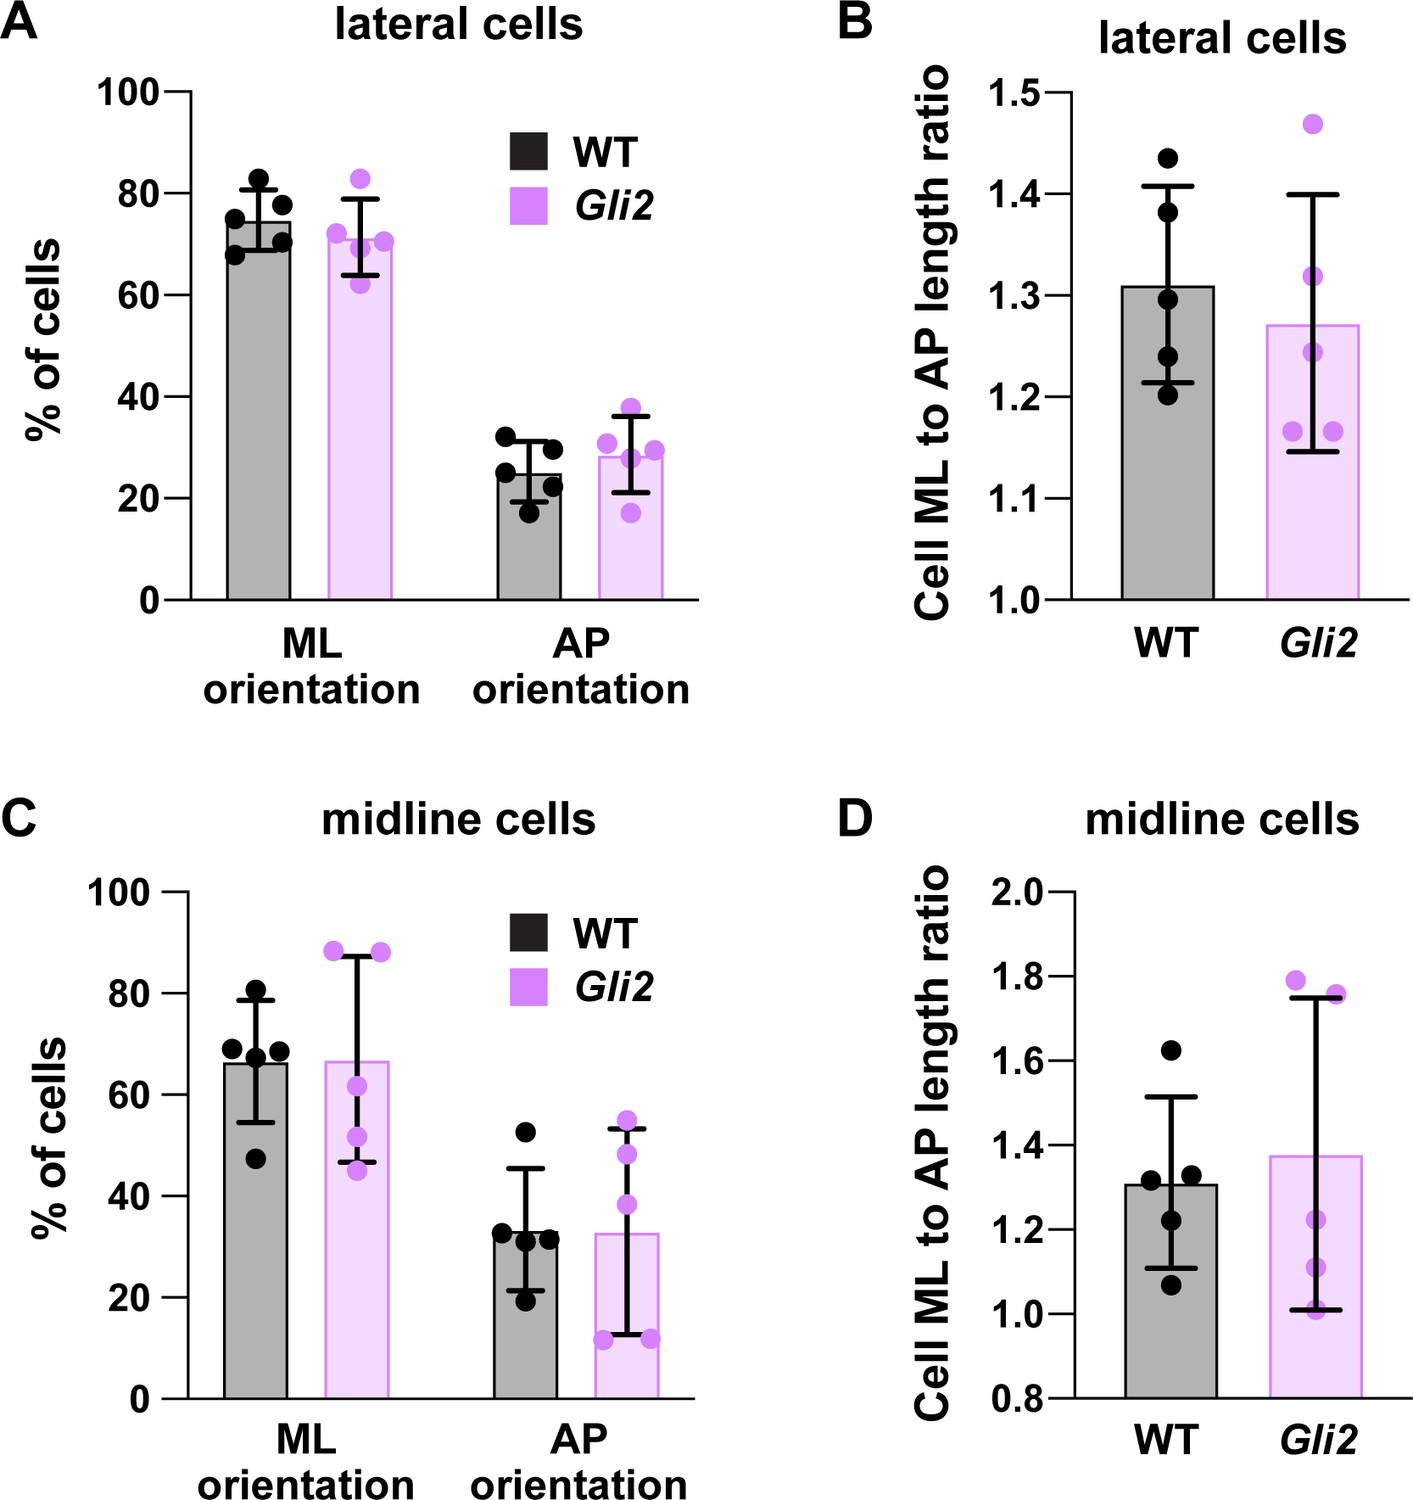
Analysis of mediolateral cell orientation in Gli2 mutants.
(A,C) Percentage of lateral cells (A) and midline cells (C) with a mediolateral (ML) orientation (0–45° relative to the ML axis) or an anterior-posterior (AP) orientation (45–90° relative to the ML axis) in Gli2 mutants and wild-type littermate controls (WT). (B,D) Average ratio of cell length along the ML and AP axes. n = 5 embryos/genotype, two-way ANOVA test (A,C) or Welch’s t-test (B,D). See Supplementary file 1 for n and p values.
Figure 9 with 2 supplements
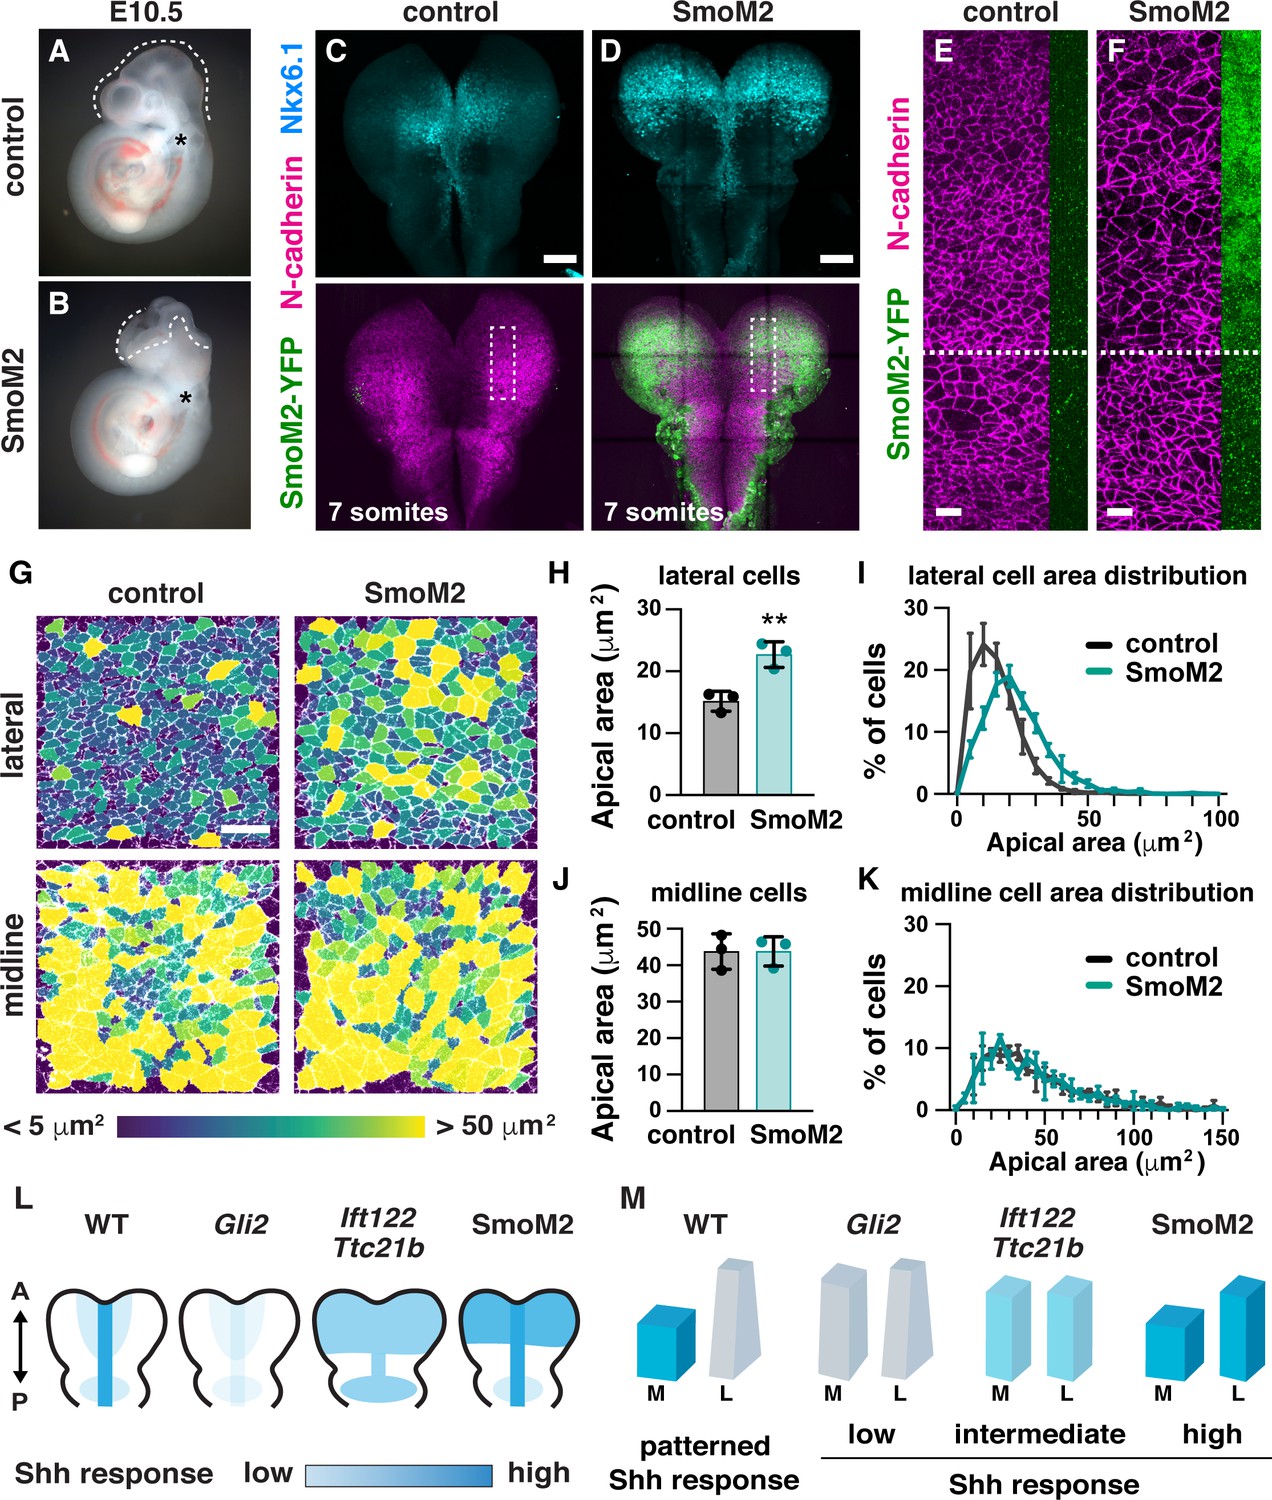
Ectopic Shh signaling disrupts lateral cell remodeling and causes exencephaly.
(A,B) Expression of the activated Shh receptor Smoothened (SmoM2) using the midbrain-specific Wnt1-Cre2 driver causes exencephaly (12/12 Wnt1-Cre2; SmoM2 embryos vs. 0/13 littermate controls). Control embryos were Wnt1-Cre2 or SmoM2 alone. (C,D) Wnt1-Cre2 drives SmoM2-YFP expression in the midbrain and induces ectopic Nkx6.1 expression throughout the mediolateral axis. Boxes, regions shown in (E,F). (E,F) Cells expressing SmoM2-YFP have larger apical areas compared with cells outside of the Wnt1-Cre2 expression domain (cells below the dashed line) and cells from equivalent regions in controls (E). SmoM2-YFP signal at the lateral edge of the N-cadherin region is shown. (G) Lateral and midline cells labeled with N-cadherin are color coded by area in control and SmoM2-expressing embryos. (H–K) Average apical cell area (H,J) and apical area distributions (I,K) in lateral and midline cells in control and SmoM2-expressing embryos. (L) Schematics of the pattern and intensity of the Shh response in WT, Gli2 mutant, IFT-A mutant, and SmoM2-expressing embryos. (M) Model. The different shapes of lateral and midline cells correlate with different levels of Shh signaling. A high Shh response inhibits apical remodeling and apicobasal elongation in midline cells, whereas a low Shh response allows apical constriction in lateral cells. A single value was obtained for each embryo and the mean ± SD between embryos is shown, n = 3 embryos/genotype, **p<0.01 (Welch’s t-test). See Supplementary file 1 for n and p values. Embryos are E10.5 in (A,B), 6–7 somites in (E–K). Anterior up. Bars, 100 μm in (C,D), and 20 μm in (E–G).
Figure 9—figure supplement 1
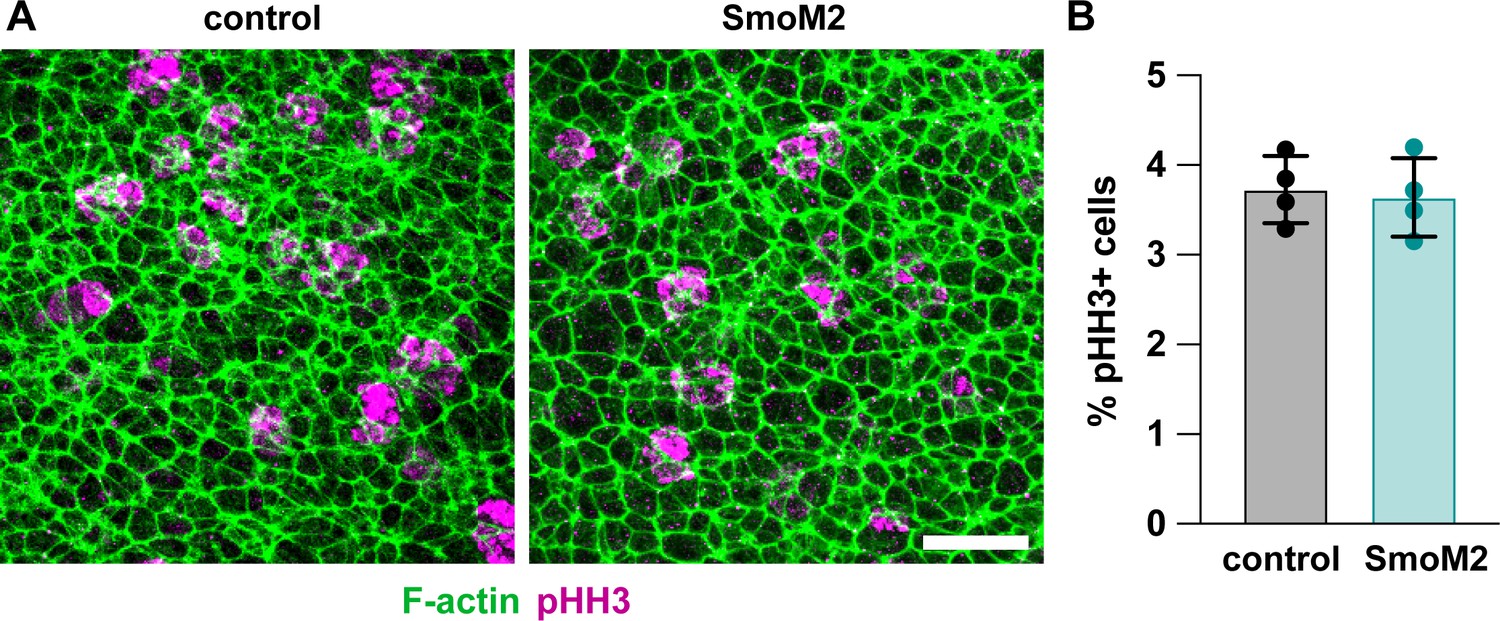
Cell proliferation is not affected by neuroepithelial expression of SmoM2.
(A) Lateral cell proliferation in embryos labeled with pHH3 to mark mitotic cells and phalloidin (F-actin) to mark cell outlines in embryos expressing activated Smoothened using the midbrain-specific Wnt1-Cre driver. Control embryos were Wnt1-Cre2 or SmoM2 alone. (B) The percentage of proliferative (pHH3+) cells in a 100 μm x 100 μm lateral region. No significant difference was observed between SmoM2-expressing embryos and controls. A single value was obtained for each embryo and the mean ± SD between embryos is shown, n = 4 embryos/genotype, Welch’s t-test. Embryos are 7–9 somites. See Supplementary file 1 for n and p values. Anterior up. Bars, 20 μm.
Figure 9—figure supplement 2
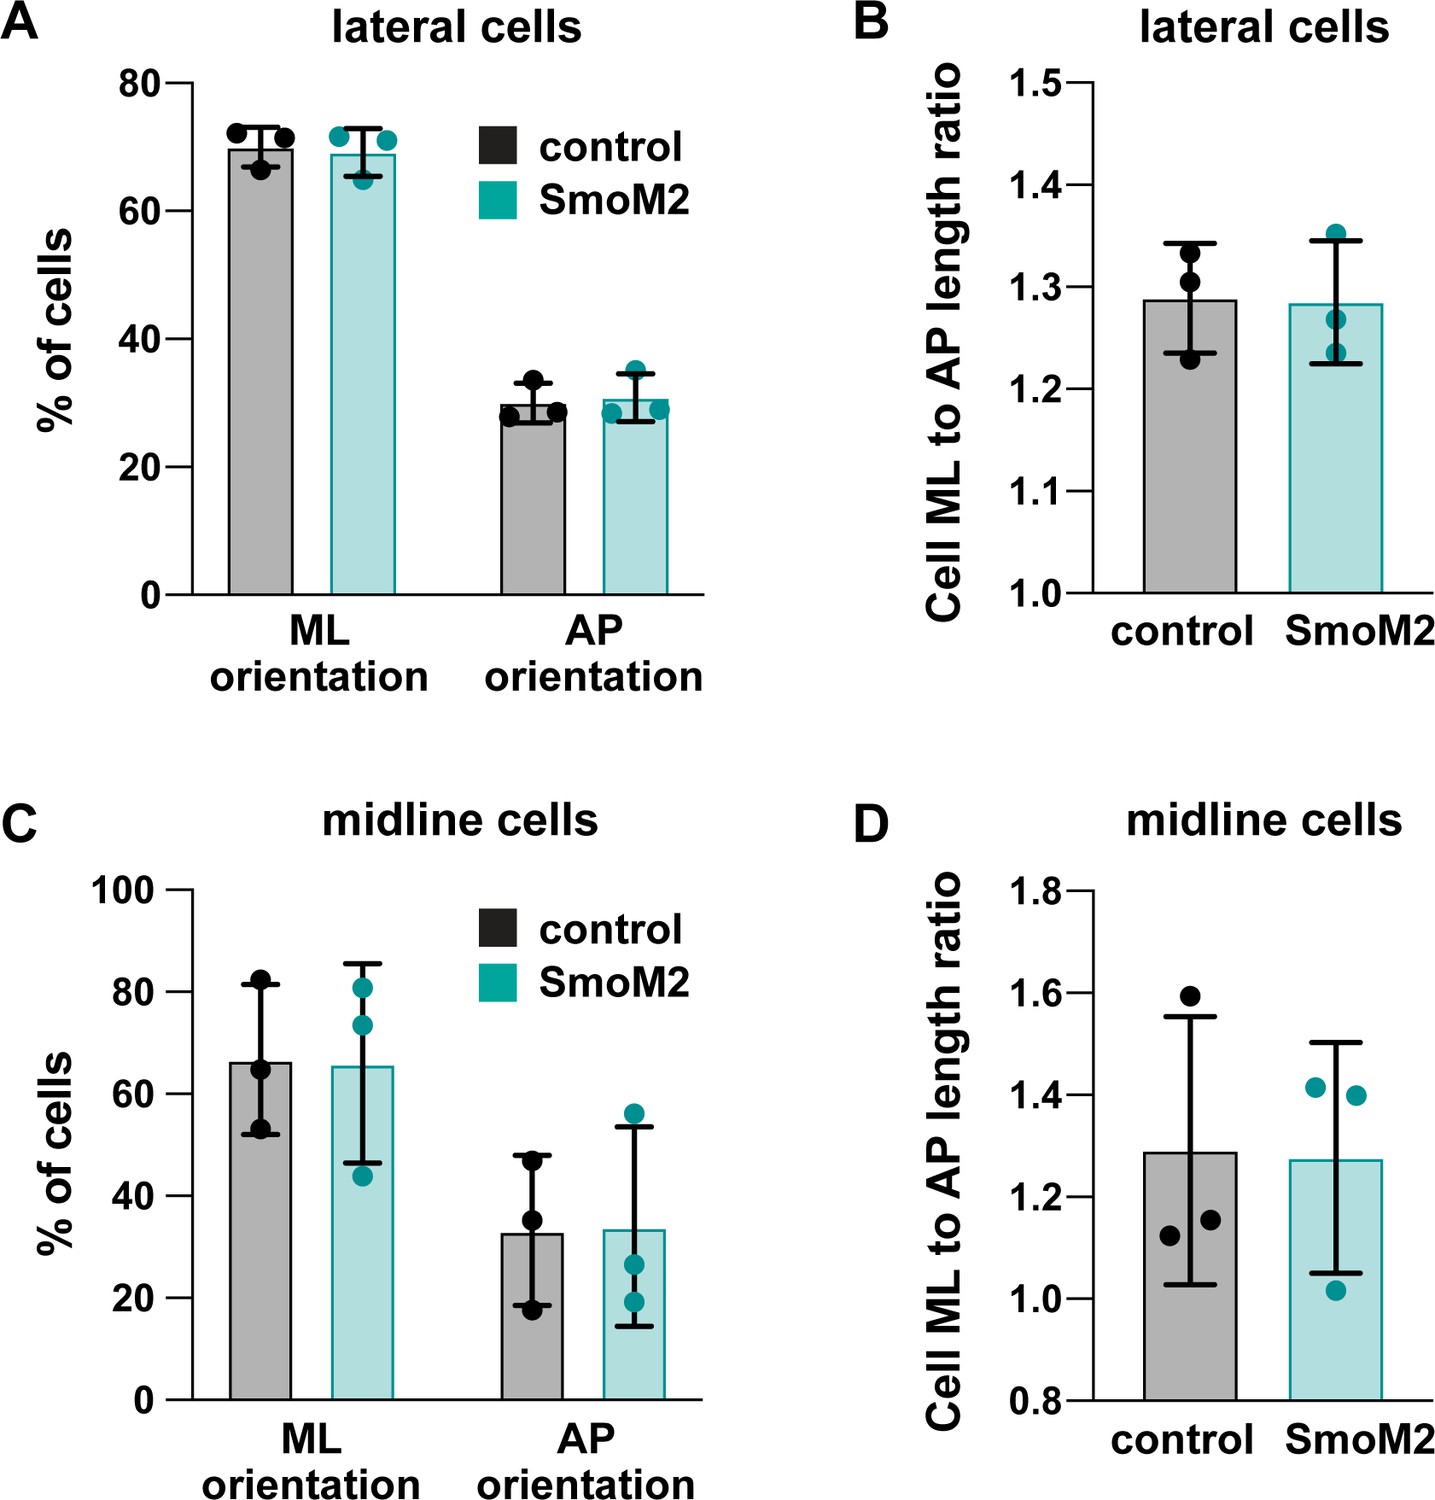
Analysis of mediolateral cell orientation in SmoM2-expressing embryos.
(A,C) Percentage of lateral cells (A) and midline cells (C) with a mediolateral (ML) orientation (0–45° relative to the ML axis) or an anterior-posterior (AP) orientation (45–90° relative to the ML axis) in embryos expressing activated Smoothened using the midbrain-specific Wnt1-Cre2 driver. Control embryos were Wnt1-Cre2 or SmoM2 alone. (B,D) Average ratio of cell length along the ML and AP axes. n = 3 embryos per genotype, two-way ANOVA test (A,C) or Welch’s t-test (B,D). See Supplementary file 1 for n and p values.
Tables
Key resources table
| Reagent type (species) or resource | Designation | Source or reference | Identifiers | Additional information |
|---|---|---|---|---|
| Genetic reagent (Mus musculus) | FVB/NJ | Jackson Laboratory | stock no. 001800 RRID:IMSR_JAX:001800 | |
| Genetic reagent (Mus musculus) | Iftt122TR2 | This study | FVB/N background | |
| Genetic reagent (Mus musculus) | Ttc21bTF2 | This study | FVB/N background | |
| Genetic reagent (Mus musculus) | SmoM2 | Jackson Laboratory (Jeong et al., 2004) | Gt(ROSA)26Sortm1(Smo/EYFP)Amc/Jstock no. 005130 MGI:3576373 RRID:IMSR_JAX:005130 | C57BL/6J background |
| Genetic reagent (Mus musculus) | Wnt1-Cre2 | Jackson Laboratory (Lewis et al., 2013) | E2f1Tg(Wnt1-cre)2Sor/Jstock no. 022137 MGI:5485027 RRID:IMSR_JAX:022137 | FVB/N background |
| Genetic reagent (Mus musculus) | EIIA-Cre | Jackson Laboratory (Lakso et al., 1996) | Tg(EIIa-cre)C5379Lmgd/Jstock no. 003314 MGI:2137691 RRID:IMSR_JAX:003314 | FVB/N background |
| Genetic reagent (Mus musculus) | mT/mG | Jackson Laboratory (Muzumdar et al., 2007) | Gt(ROSA)26Sortm4(ACTB-tdTomato,-EGFP)Luo/Jstock no. 007676 MGI:3716464 RRID:IMSR_JAX:007676 | FVB/N background |
| Genetic reagent (Mus musculus) | Gli2lzki | Jackson Laboratory (Bai and Joyner, 2001) | Gli2tm2.1Alj/J stock no. 007922 MGI:3815004 RRID:IMSR_JAX:007922 | SWR/J background |
| Antibody | Anti-ZO-1 (rat monoclonal) | Developmental Studies Hybridoma Bank (DSHB) | R26.4C RRID:AB_2205518 | (1:100) |
| Antibody | Anti-phospho-Histone H3 (rabbit polyclonal) | Upstate | 06–570 RRID:AB_310177 | (1:1000) |
| Antibody | Anti-Arl13b (rabbit polyclonal) | Caspary et al., 2007 | (1:1000) | |
| Antibody | Anti-β-catenin (mouse monoclonal) | BD | 610153 RRID:AB_397554 | (1:300) |
| Antibody | Anti-laminin (rabbit polyclonal) | Sigma | L9393 RRID:AB_477163 | (1:1000) |
| Antibody | Anti-N-cadherin (rabbit monoclonal) | Cell Signaling Technology | D4R1H RRID:AB_2687616 | (1:500) |
| Antibody | Anti-GFP (chicken polyclonal) | abcam | ab13970 RRID:AB_300798 | (1:1000) |
| Antibody | Anti-Nkx6.1 (mouse monoclonal) | DSHB | F55A10 RRID:AB_532378 | (1:50) |
| Antibody | Anti-diphospho myosin regulatory light chain (rabbit polyclonal) | Cell Signaling Technology | 3674 RRID:AB_2147464 | (1:100) |
| Antibody | Anti-FoxA2 (rabbit monoclonal) | abcam | ab108422 RRID:AB_11157157 | (1:1000) |
| Sequence-based reagent | Ift122(TR2)_F | This study | PCR primer | CTGGTTGTAATCTGACTCGTTGA After amplification with below reverse primer, product is digested with HpyCH4III, resulting in a 133 bp WT band and a 118 bp mutant band. |
| Sequence-based reagent | Ift122(TR2)_R | This study | PCR primer | ACTCCCAAGCAAGCGAACT |
| Sequence-based reagent | Ttc21b(TF2)_F | This study | PCR primer | AGAATGATGTGCAACCTTGTTGA After amplification with below reverse primer, product is digested with NmuCI, resulting in a 224 bp WT band and a 168 bp mutant band. |
| Sequence-based reagent | Ttc21b(TF2)_R | This study | PCR primer | TTATCTGGCTCACGGTCTCC |
| Software, algorithm | SeedWater Segmenter | Mashburn et al., 2012 | ||
| Software, algorithm | SEGGA | Farrell et al., 2017 | ||
| Software, algorithm | FIJI/ImageJ | Schindelin et al., 2012 Schneider et al., 2012 | RRID:SCR_002285 | |
| Software, algorithm | MorphoLibJ (FIJI plugin) | Legland et al., 2016 | ||
| Software, algorithm | ITK-SNAP | Yushkevich et al., 2006 | RRID:SCR_002010 | |
| Software, algorithm | R | R Development Core Team, 2020 | RRID:SCR_001905 | |
| Software, algorithm | Circular plugin (for R) | Agostinelli and Lund, 2017 | ||
| Software, algorithm | Prism | Graphpad | RRID:SCR_002798 | |
| Software, algorithm | Zen | Zeiss | RRID:SCR_018163 | |
| Software, algorithm | LAS X | Leica | RRID:SCR_013673 | |
| Software, algorithm | EOS Utility | Canon | ||
| Software, algorithm | Illustrator | Adobe | RRID:SCR_010279 |
Additional files
-
Supplementary file 1
N values and details of statistical analyses performed.
The details of the statistical tests performed, including the exact n and p values in the Figures and Figure supplements, are presented.
- https://cdn.elifesciences.org/articles/60234/elife-60234-supp1-v2.docx
-
Transparent reporting form
- https://cdn.elifesciences.org/articles/60234/elife-60234-transrepform-v2.pdf
Download links
A two-part list of links to download the article, or parts of the article, in various formats.
Downloads (link to download the article as PDF)
Open citations (links to open the citations from this article in various online reference manager services)
Cite this article (links to download the citations from this article in formats compatible with various reference manager tools)
Sonic hedgehog signaling directs patterned cell remodeling during cranial neural tube closure
eLife 9:e60234.
https://doi.org/10.7554/eLife.60234


