Acetyl-CoA production by specific metabolites promotes cardiac repair after myocardial infarction via histone acetylation
- Faculty of Health Sciences, University of Macau, China
- Department of Cardiac Surgery, University of Michigan-Ann Arbor, United States
Figures
Figure 1 with 1 supplement
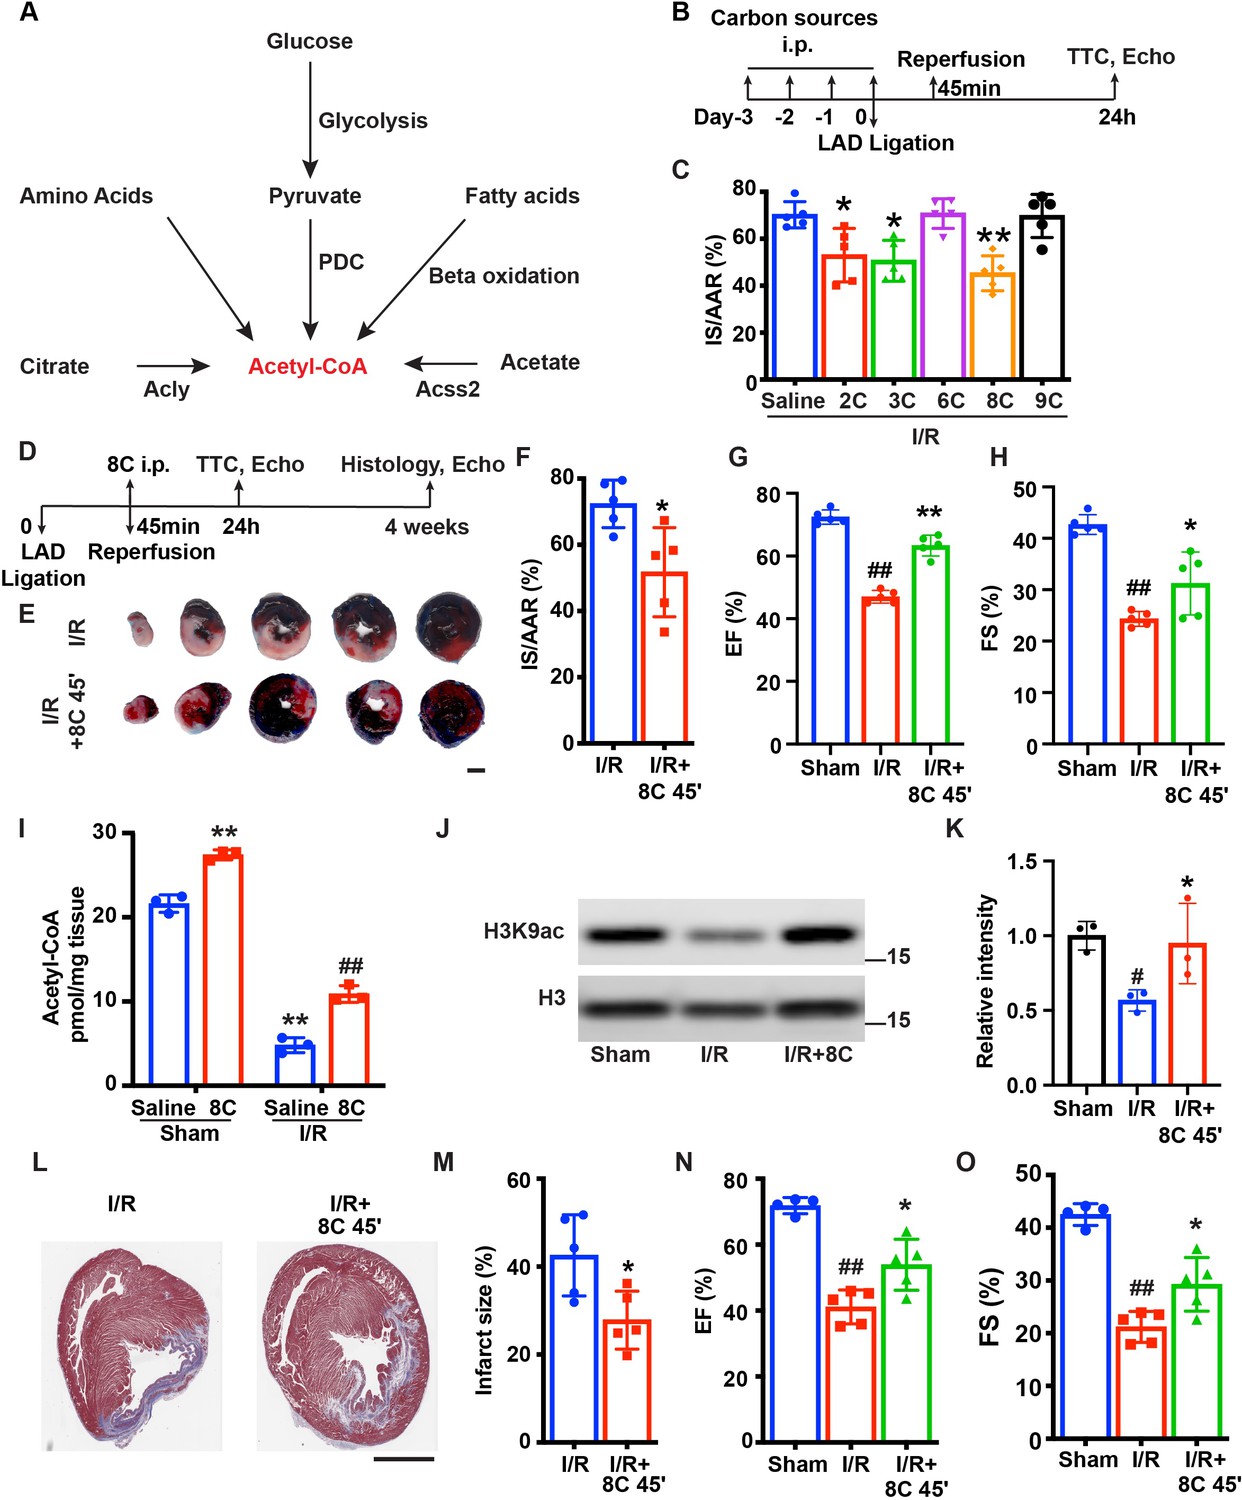
8 C administration attenuates ischemia-reperfusion injury in rats.
(A) Metabolic pathways of acetyl-CoA synthesis. (B) Schematic diagram of different carbon sources administration prior to I/R surgery. (C) Quantification of IS/AAR ratio in Figure 1—figure supplement 1A by Image J. (D) Schematic diagram of 8C administration post ischemic injury. (E) Representative figures of heart sections at 24 hr after I/R with or without 8C administration at reperfusion after 45 min ischemia. Scale bar: 2.5 mm (F) Quantification of IS/AAR ratio in (E). LV EF (G) and FS (H) at 24 hr after I/R. (I) Quantification of Acetyl-CoA levels in sham and I/R rat hearts at indicated conditions. (J–K) Western blot and quantification of H3K9ac and H3 in rat hearts 24 hr after I/R. (L) Trichrome masson staining of heart section after 4 weeks of I/R. Scale bar: 2.5 mm. (M) Quantification of infarct size in (I). LV EF (N) and FS (O) at 4 weeks after I/R. Error bars represent S.D. n = 5, #p < 0.05, ##p < 0.01 vs Sham group. * p < 0.05, **p < 0.01, vs I/R group. Data were analyzed by one-way ANOVA (C,G,H,K,N and O) or two-way ANOVA (I), followed by post-hoc Tukey test, data in F and M were analyzed by two-tailed student test.
-
Figure 1—source data 1
Original numeric data for Figure 1.
- https://cdn.elifesciences.org/articles/60311/elife-60311-fig1-data1-v2.xlsx
-
Figure 1—source data 2
Original western blot figure for Figure 1.
- https://cdn.elifesciences.org/articles/60311/elife-60311-fig1-data2-v2.zip
Figure 1—figure supplement 1

Effect of metabolites on myocardial I/R injury.
(A) Representative figures of heart sections at 24 hr after I/R in presence of different metabolites. Scale bar: 2.5 mm. (B) Quantification of AAR/LV in Figure 1A by Image J. (C) Quantification of AAR/LV ratio after I/R with or without 8C administration at 45 min after ligation. (D–E) Representative echo image for measurement of heart function in Figure 1G, H, N and O. (F) Quantification of Succinate levels in rat hearts after I/R with saline, 8C or 9C treatment. n = 3, *p < 0.05, **p < 0.01 vs I/R + saline group; ##p < 0.01 vs I/R + 8C group. Data were analyzed by one-way ANOVA (B and E), followed by post-hoc Tukey test, data in C was analyzed by two-tailed student test.
Figure 2 with 1 supplement
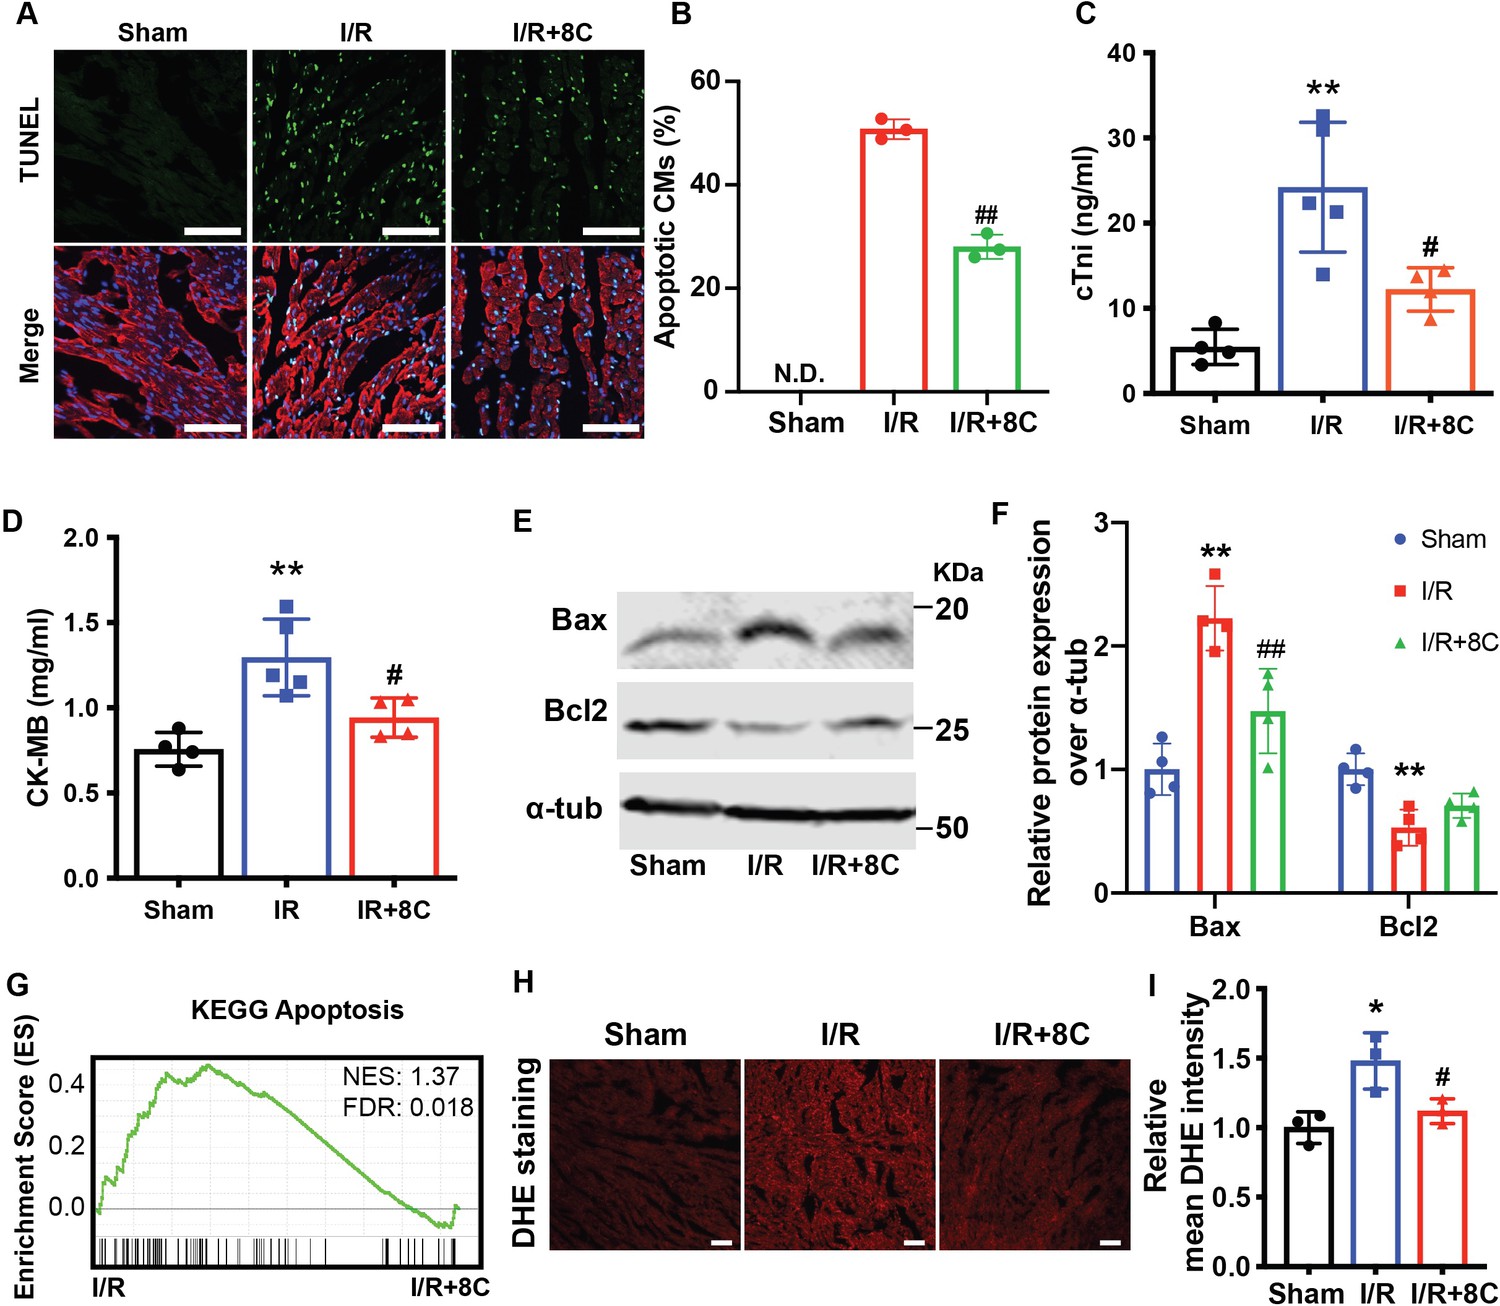
Post ischemic administration of 8C reduces the oxidative stress and cell death after I/R injury.
(A) Representative of TUNEL (green) and cTnT (red) double staining at boarder zone at 24 hr post I/R injury. Scale bar: 100 µm (B) Quantification of cardiomyocytes cell death of 12 sections (C–D) Serum cTni and CK-MB level at 24 hr post I/R. (E–F) Western blot and quantification of Bax and Bcl2 at 24 hr after I/R. (G) GSEA analysis of Kegg apoptotic pathways after I/R with and without 8C treatment. (H) ROS levels were measured by DHE staining. Scale bar: 200 µm. (I) Relative mean DHE fluorescence intensity measured by Image J. Error bars represent S.D. n = 3. *p < 0.05, **p < 0.01 vs Sham; #p < 0.05, ##p < 0.01 vs I/R group. Data were analyzed by one-way ANOVA, followed by post-hoc Tukey test.
-
Figure 2—source data 1
Original numeric data for Figure 2.
- https://cdn.elifesciences.org/articles/60311/elife-60311-fig2-data1-v2.xlsx
-
Figure 2—source data 2
Original western blot figure for Figure 2.
- https://cdn.elifesciences.org/articles/60311/elife-60311-fig2-data2-v2.zip
Figure 2—figure supplement 1
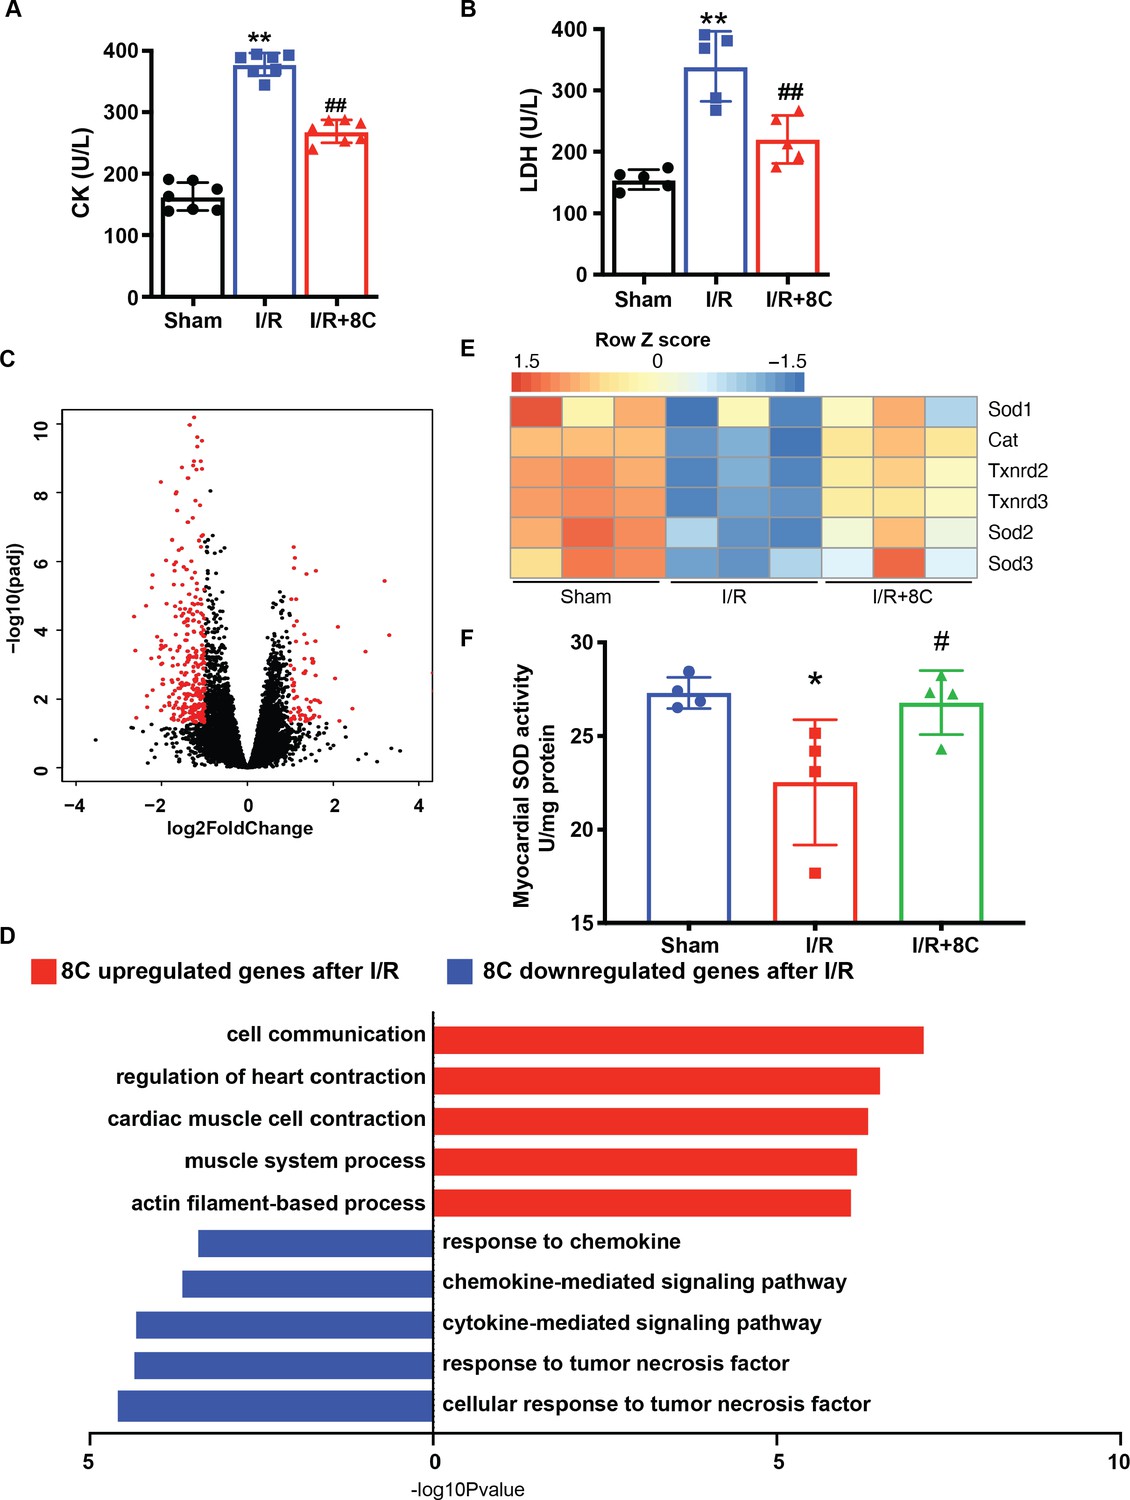
8C administration altered the gene expression after I/R injury.
(A–B) Serum CK and LDH level at 24 hr post I/R. (C) Volcano plot of differential expressed genes in 8C-treated and saline-treated hearts after I/R. Differential expressed genes with abs(Log2Foldchange) > 1, and padj < 0.05 were labelled in red. (D) Top gene set enrichment of differential expressed genes using GO biological process gene sets. (E) Heatmap of antioxidant gene expression. (F) Quantification of myocardial SOD activity after I/R with or without I/R. n = 3, *p < 0.05 vs Sham group; #p < 0.05 vs I/R group. Data were analyzed by one-way ANOVA (B and D), followed by post-hoc Tukey test.
Figure 3
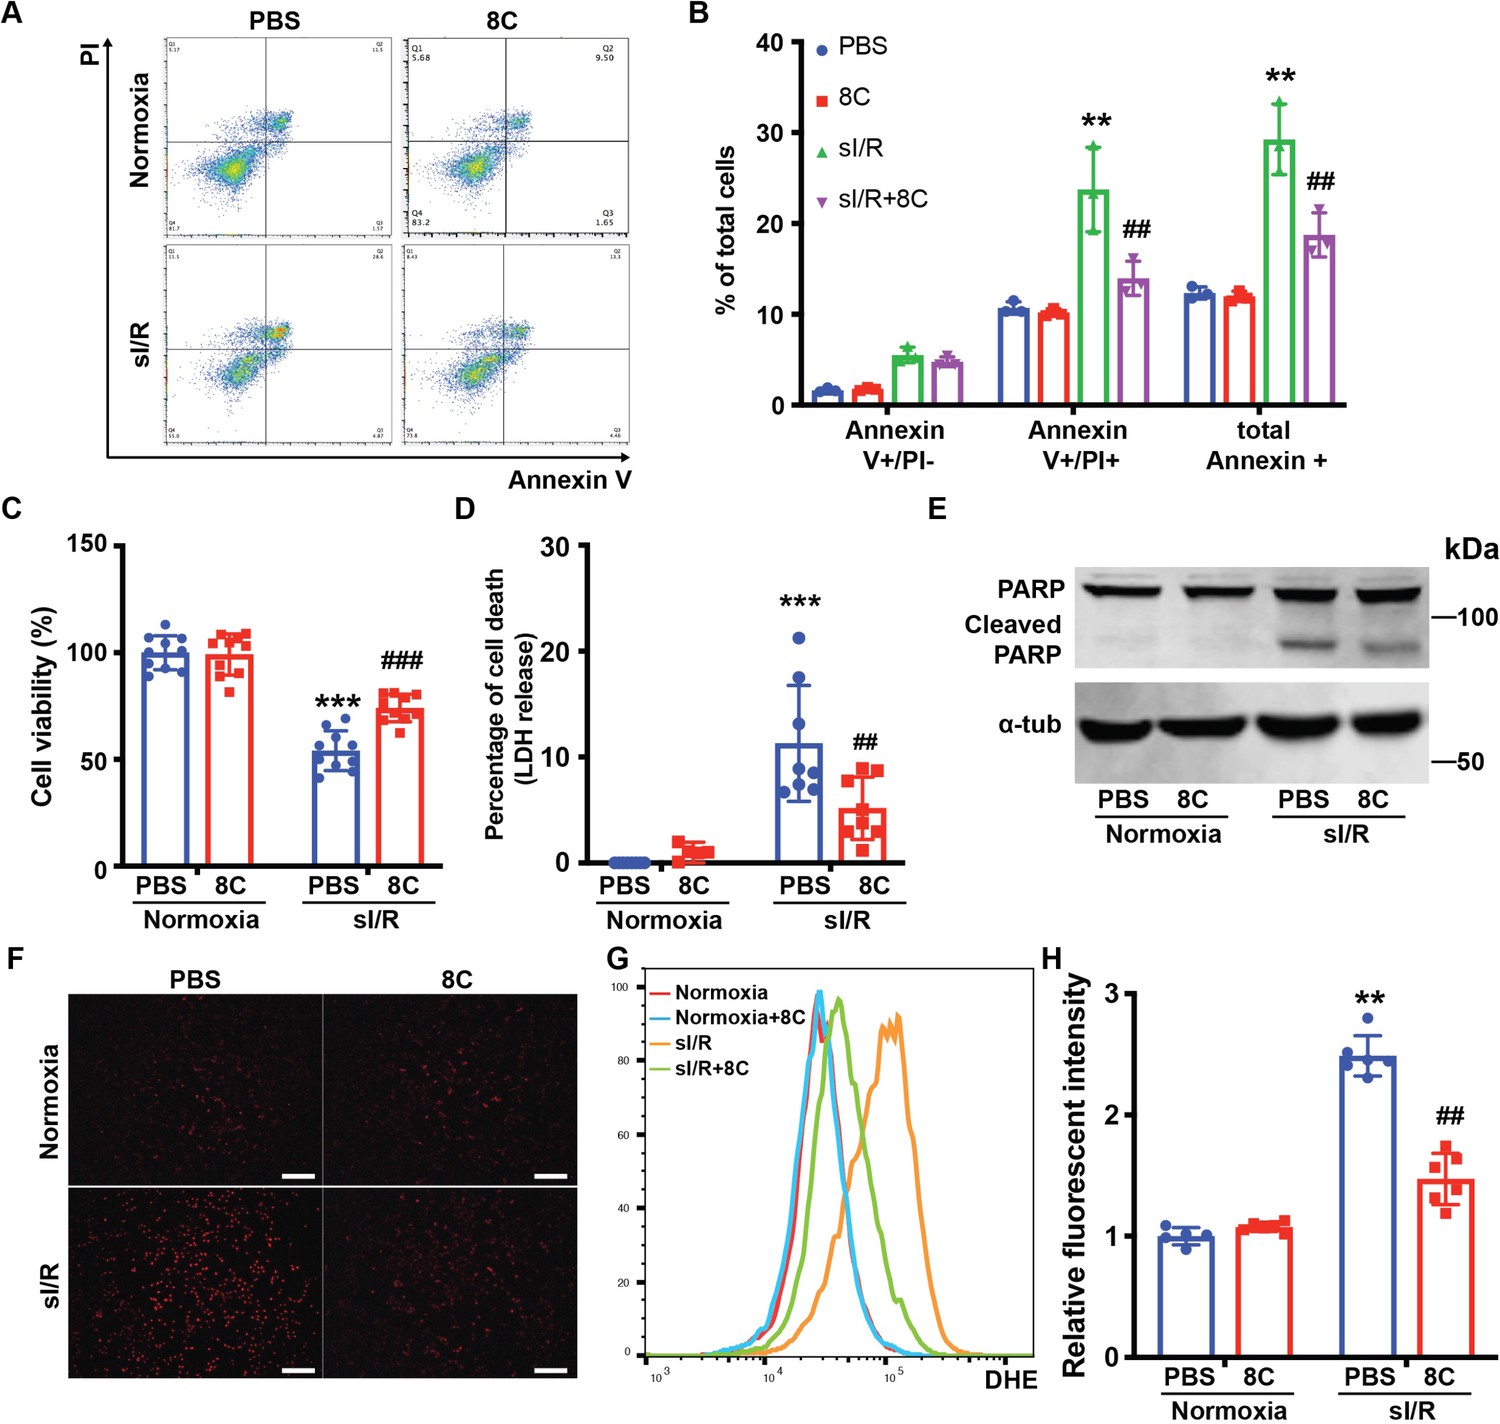
8C attenuates NRVMs apoptosis through reducing oxidative stress.
(A) FACS analysis of Annexin V and PI staining in NRVMs exposed to sI/R with and without 8C treatment. (B) Quantification of percentage of Annexin V + and PI+ cells. Cell viability and cell death measurement in NRVMs with sI/R using CCK8 detection kit (C) and LDH assay kit (D). (E) Western blot of cleaved PARP in NRVMs after sI/R treatment. (F) NRVM cellular ROS levels are indicated by DHE staining after sI/R treatment. Scale bar: 200 µm (G) FACS analysis of NRVM DHE staining after sI/R. (H) Relative mean fluorescence intensity of DHE staining measured by Flowjo. n = 3, **p < 0.01, ***p < 0.001, vs Normoxia + PBS; ## p < 0.01, ###p < 0.001 vs sI/R + PBS. Data were analyzed by two-way ANOVA, followed by post-hoc Tukey test.
-
Figure 3—source data 1
Original numeric data for Figure 3.
- https://cdn.elifesciences.org/articles/60311/elife-60311-fig3-data1-v2.xlsx
-
Figure 3—source data 2
Original western blot figure for Figure 3.
- https://cdn.elifesciences.org/articles/60311/elife-60311-fig3-data2-v2.zip
Figure 4 with 1 supplement
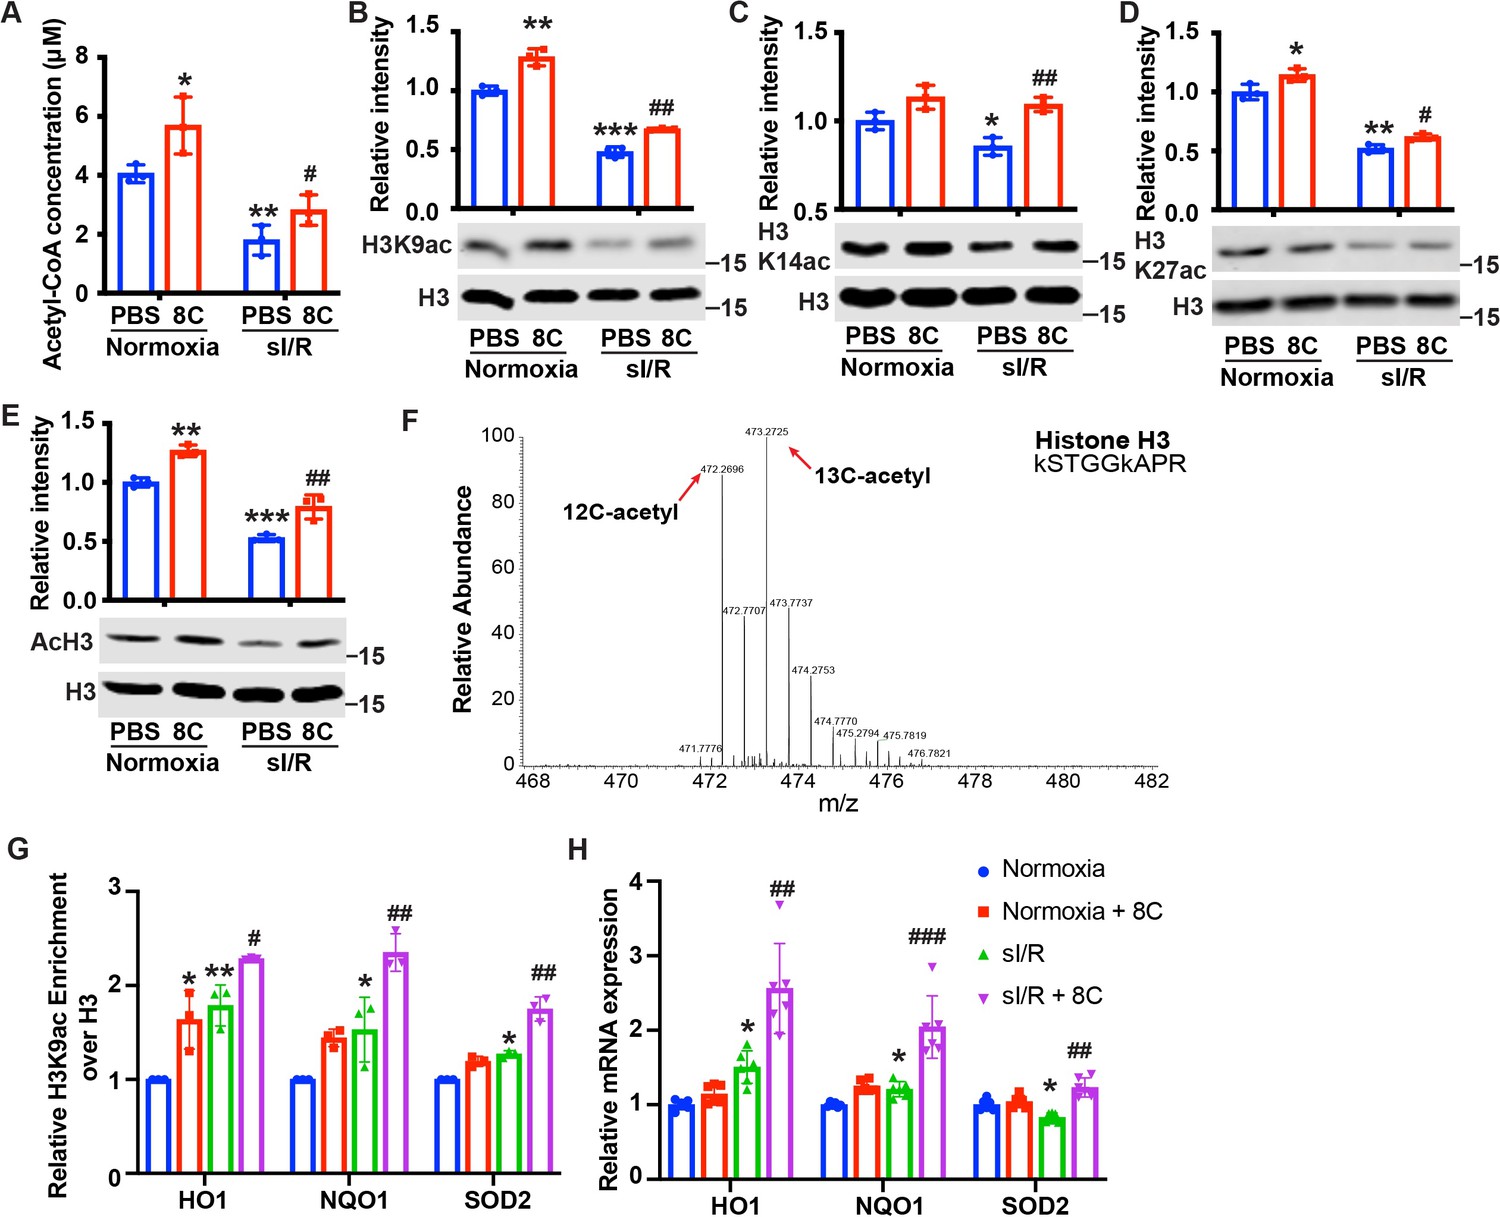
8C stimulates histone acetylation and promotes antioxidant gene expression.
(A) Quantification of Acetyl-CoA concentrations in NRVMs subjected to sI/R. (B–E) 8 C rescues sI/R reduced H3K9ac, H3K27ac, H3K14ac and total acH3 levels. NRVMs were treated with or without 0.5 mM 8 C under sI/R. The histone acetylation levels were determined by western blot. Total H3 in the same blot was used as loading control. (F) Representative MS spectra from NRVMs treated with [U-13C] sodium octanoate indicating isotope distribution on acetyl Histone H3. The mass shifts indicate the incorporation of heavy carbon to the acetyl histone lysines. (G) Enrichment of H3K9ac over H3 at promoters of HO1, NQO1, and SOD2 in NRVMs after sI/R. (H) mRNA expression of HO1, NQO1, and SOD2 in NRVMs after sI/R. *p < 0.05, **p < 0.01, ***p < 0.001, vs Normoxia + PBS; #p < 0.05, ##p < 0.01, ###p < 0.001 vs sI/R + PBS. Data were analyzed by two-way ANOVA, followed by post-hoc Tukey test.
-
Figure 4—source data 1
Original numeric data for Figure 4.
- https://cdn.elifesciences.org/articles/60311/elife-60311-fig4-data1-v2.xlsx
-
Figure 4—source data 2
Original western blot figure for Figure 4.
- https://cdn.elifesciences.org/articles/60311/elife-60311-fig4-data2-v2.zip
Figure 4—figure supplement 1
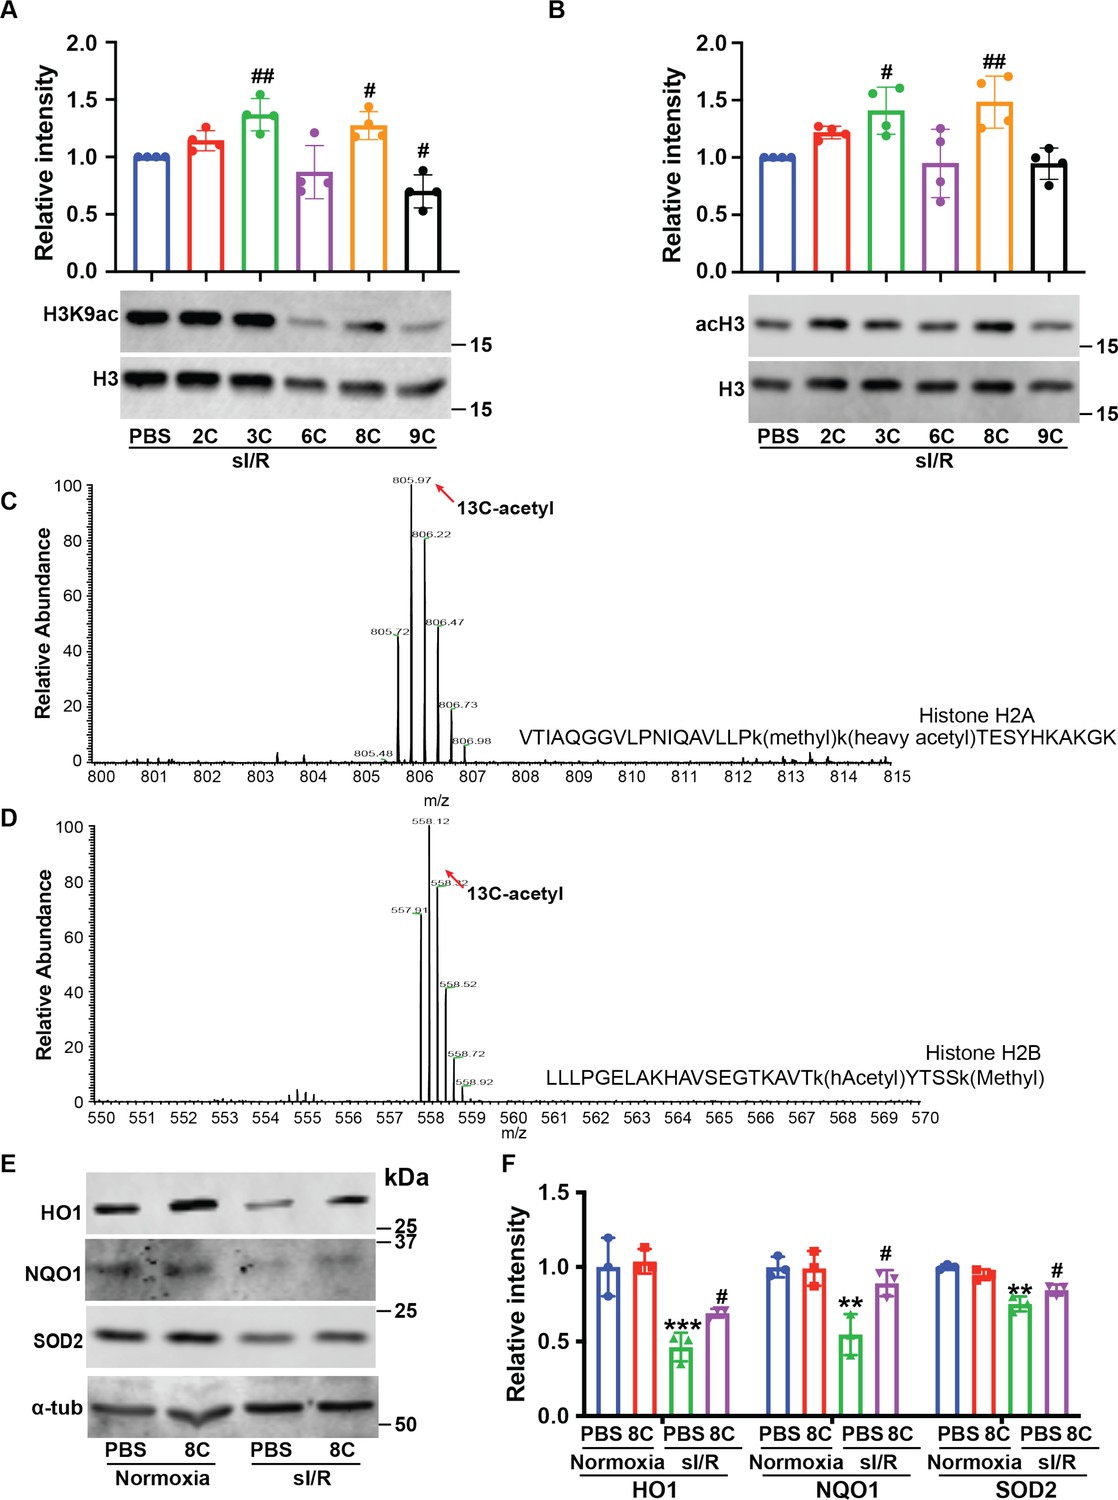
8C administration altered the gene expression after I/R injury.
(A-B) Serum CK and LDH level at 24 hr post I/R. (C) Volcano plot of differential expressed genes in 8C-treated and saline-treated hearts after I/R. Differential expressed genes with abs(Log2Foldchange) >1, and padj < 0.05 were labeled in red. (D) Top gene set enrichment of differential expressed genes using GO biological process gene sets. (E) Heatmap of antioxidant gene expression. (F) Quantification of myocardial SOD activity after I/R with orwithout I/R. n=3, *p < 0.05 vs Sham group; # p < 0.05 vs I/R group. Data were analyzed by oneway ANOVA (B and D), followed by post-hoc Tukey test.
-
Figure 4—figure supplement 1—source data 1
Original western blot figure for Figure 4—figure supplement 1.
- https://cdn.elifesciences.org/articles/60311/elife-60311-fig4-figsupp1-data1-v2.zip
Figure 5 with 1 supplement
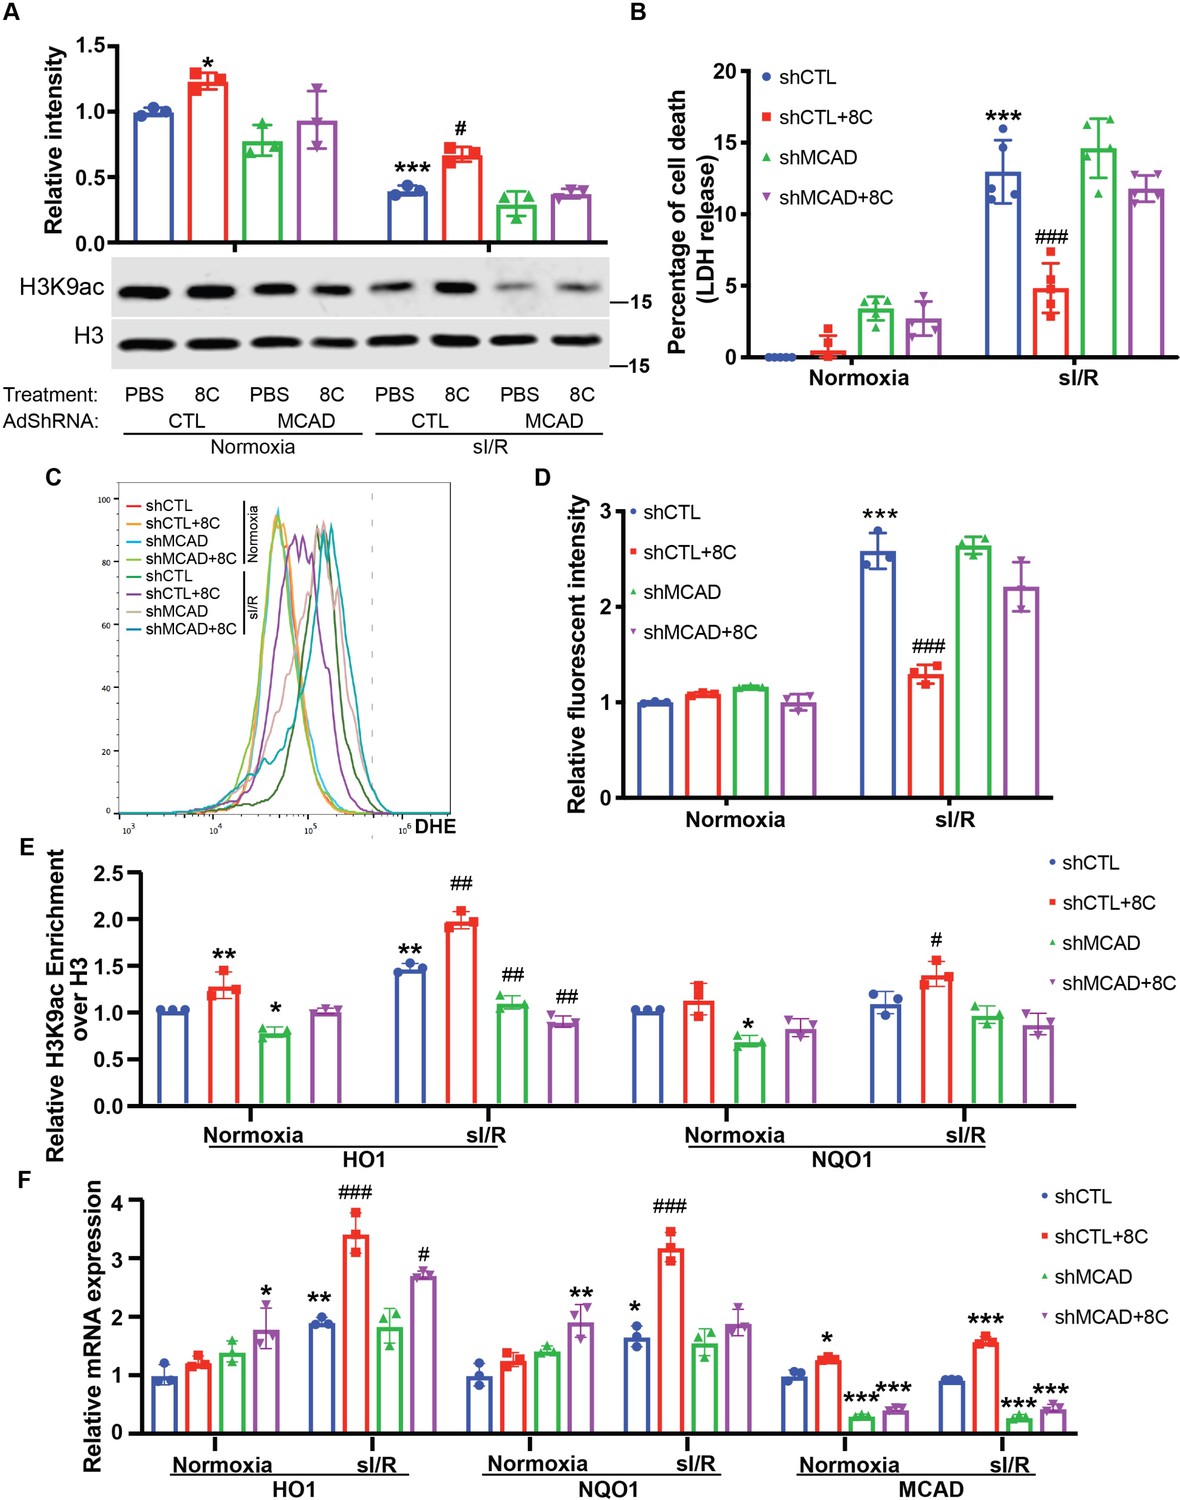
MCAD was required for the conversion of 8 C into acetyl-CoA and subsequent histone acetylation increase and heart protection.
(A) Western blot of H3K9ac level showed MCAD knockdown reduced 8C-induced H3K9ac increase in NRVMs under both normoxia and sI/R. (B) Measurement of medium LDH levels in NRVMs at indicated condition using LDH assay kit. (C) FACS analysis of DHE staining NRVMs after sI/R. (D) Relative mean fluorescence intensity of DHE staining. (E) Enrichment of H3K9ac over H3 at promoters of HO1 and NQO1 after sI/R at indicated conditions. (F) mRNA expression of HO1, NQO1 and MCAD in NRVMs after sI/R. n = 3, *p < 0.05, **p < 0.01, ***p < 0.001, vs Normoxia + PBS + shCTL; #p < 0.05, ##p < 0.01, ###p < 0.001 vs sI/R + PBS + shCTL. Data were analyzed by two-way ANOVA, followed by post-hoc Tukey test.
-
Figure 5—source data 1
Original numeric data for Figure 5.
- https://cdn.elifesciences.org/articles/60311/elife-60311-fig5-data1-v2.xlsx
-
Figure 5—source data 2
Original western blot figure for Figure 5.
- https://cdn.elifesciences.org/articles/60311/elife-60311-fig5-data2-v2.zip
Figure 5—figure supplement 1
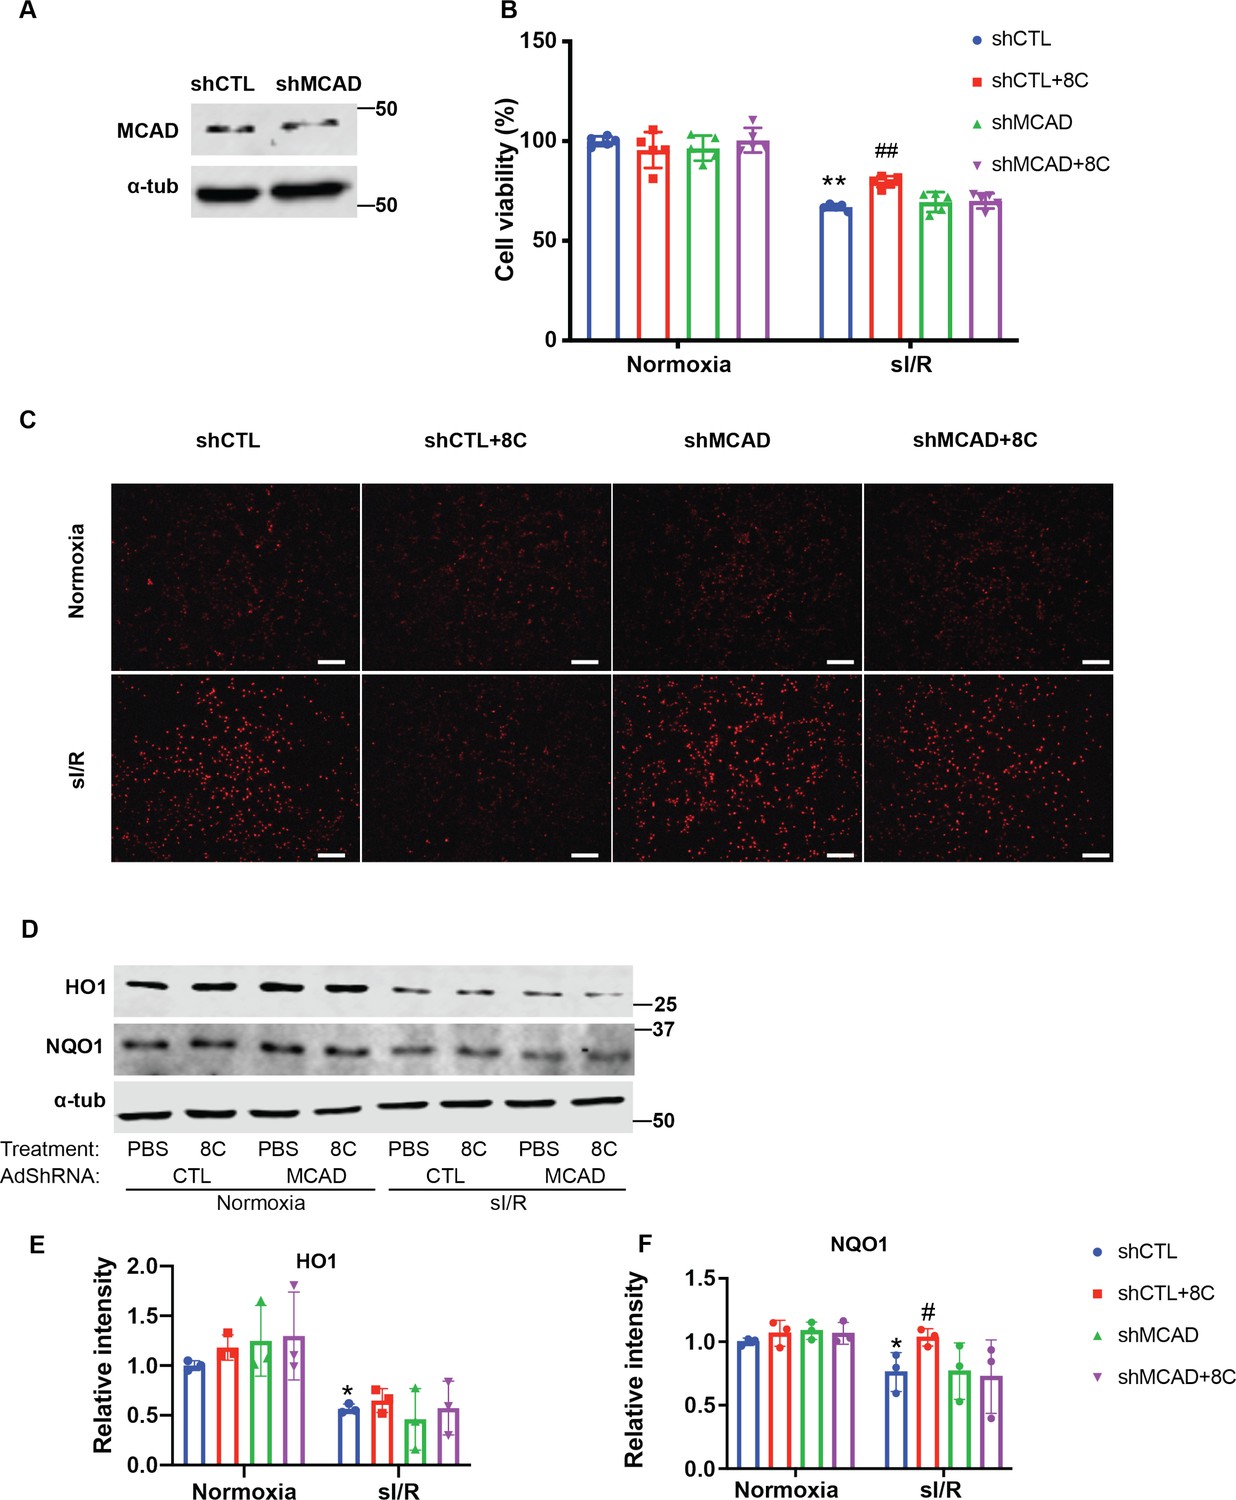
Knockdown of MCAD is required for alleviating ROS accumulation.
(A) Western blot showed knockdown of MCAD by adenovirus shRNA. (B) Cell viability measurement in NRVMs at shown condition using CCK8 detection kit. (C) NRVM cellular ROS levels are indicated by DHE staining after sI/R treatment. Scale bar: 200 µm. (D–F) Western blot and quantifications of HO1 and NQO1 in NRVMs after sI/R. n = 3, *p < 0.05, **p < 0.01, vs Normoxia + PBS + shCTL; #p < 0.05, ##p < 0.01 vs sI/R + PBS + shCTL. Data were analyzed by two-way ANOVA, followed by post-hoc Tukey test.
-
Figure 5—figure supplement 1—source data 1
Original western blot figure for Figure 5—figure supplement 1.
- https://cdn.elifesciences.org/articles/60311/elife-60311-fig5-figsupp1-data1-v2.zip
Figure 6 with 1 supplement
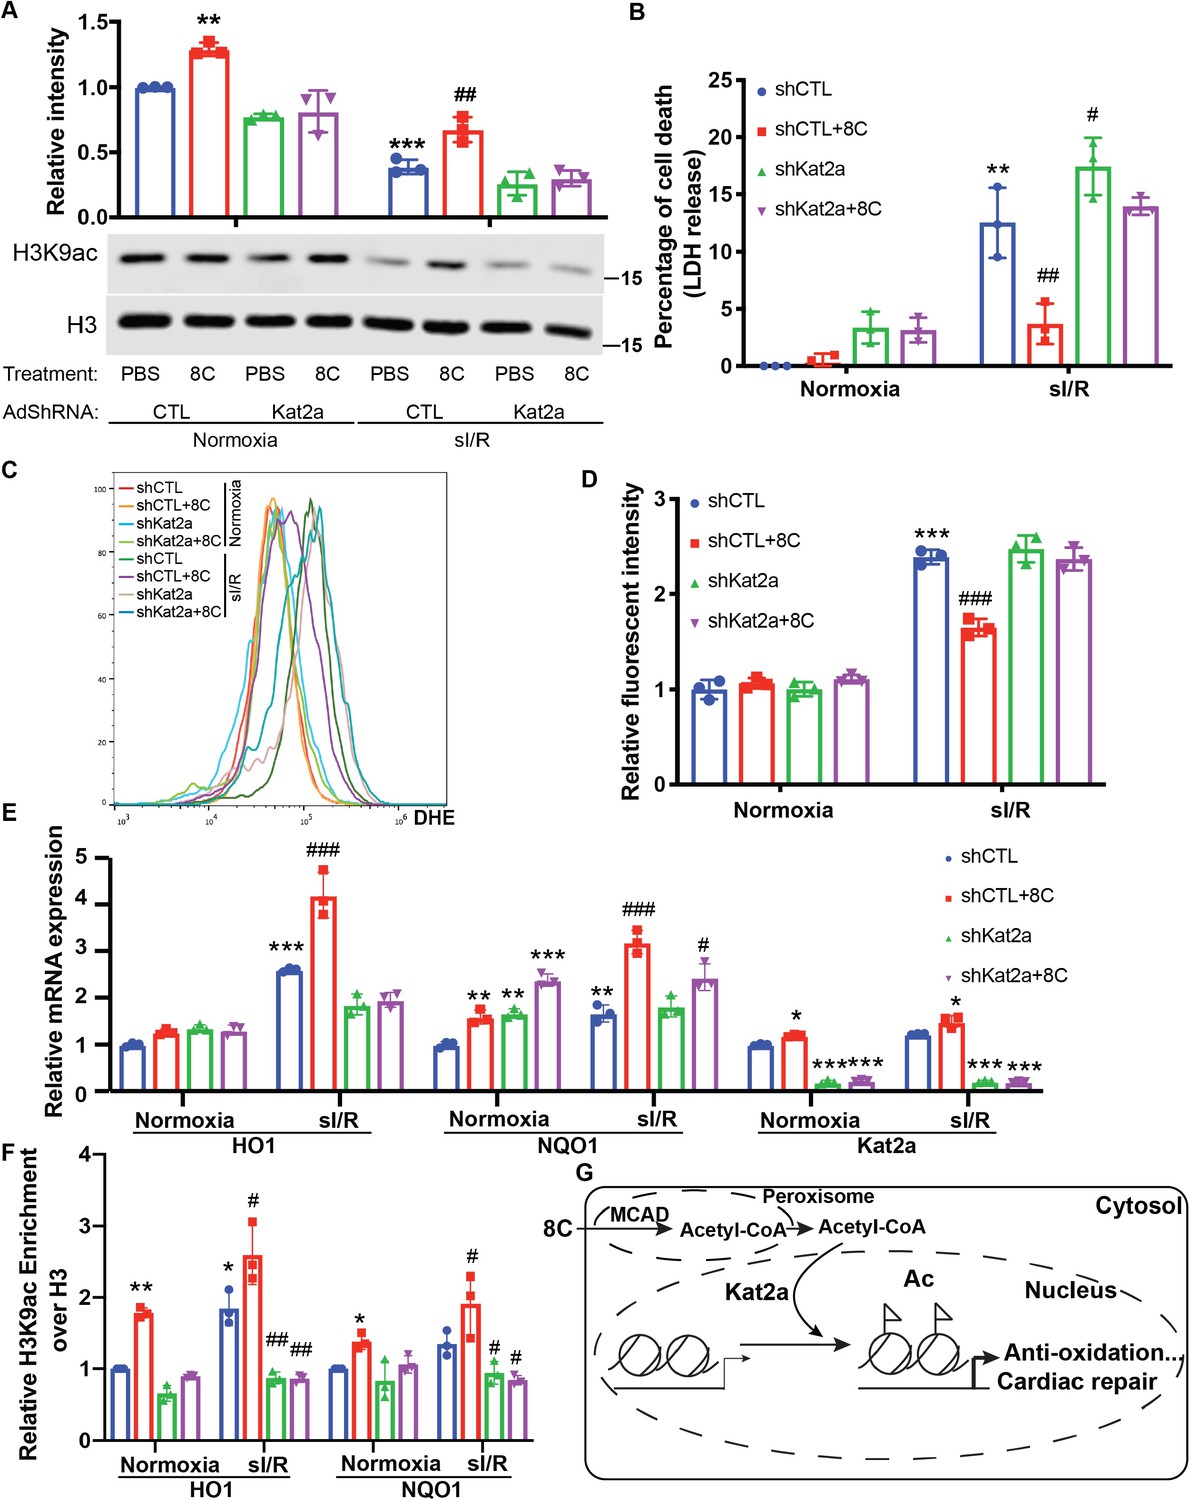
HAT enzyme Kat2a was required for 8 C mediated histone acetylation to inhibit oxidative stress in heart protection.
(A) Western blot of H3K9ac level showed Kat2a knockdown reduced 8C-induced H3K9ac increase in NRVMs under both normoxia and sI/R. (B) Measurement of medium LDH levels in NRVMs at indicated condition using LDH assay kit. (C) FACS analysis of DHE staining NRVMs after sI/R. (D) Relative mean fluorescence intensity of DHE staining. (E) Enrichment of H3K9ac over H3 at promoters of HO1 and NQO1 after sI/R at indicated conditions. (F) mRNA expression of HO1,NQO1 and Kat2a in NRVMs after sI/R. (G) Schematic diagram of 8 C metabolism for cardiac repair. n = 3, *p < 0.05, **p < 0.01, ***p < 0.001, vs Normoxia + PBS + shCTL; #p < 0.05, ##p < 0.01, ###p < 0.001 vs sI/R + PBS + shCTL. Data were analyzed by two-way ANOVA, followed by post-hoc Tukey test.
-
Figure 6—source data 1
Original numeric data for Figure 6.
- https://cdn.elifesciences.org/articles/60311/elife-60311-fig6-data1-v2.xlsx
-
Figure 6—source data 2
Original western blot figure for Figure 6.
- https://cdn.elifesciences.org/articles/60311/elife-60311-fig6-data2-v2.zip
Figure 6—figure supplement 1
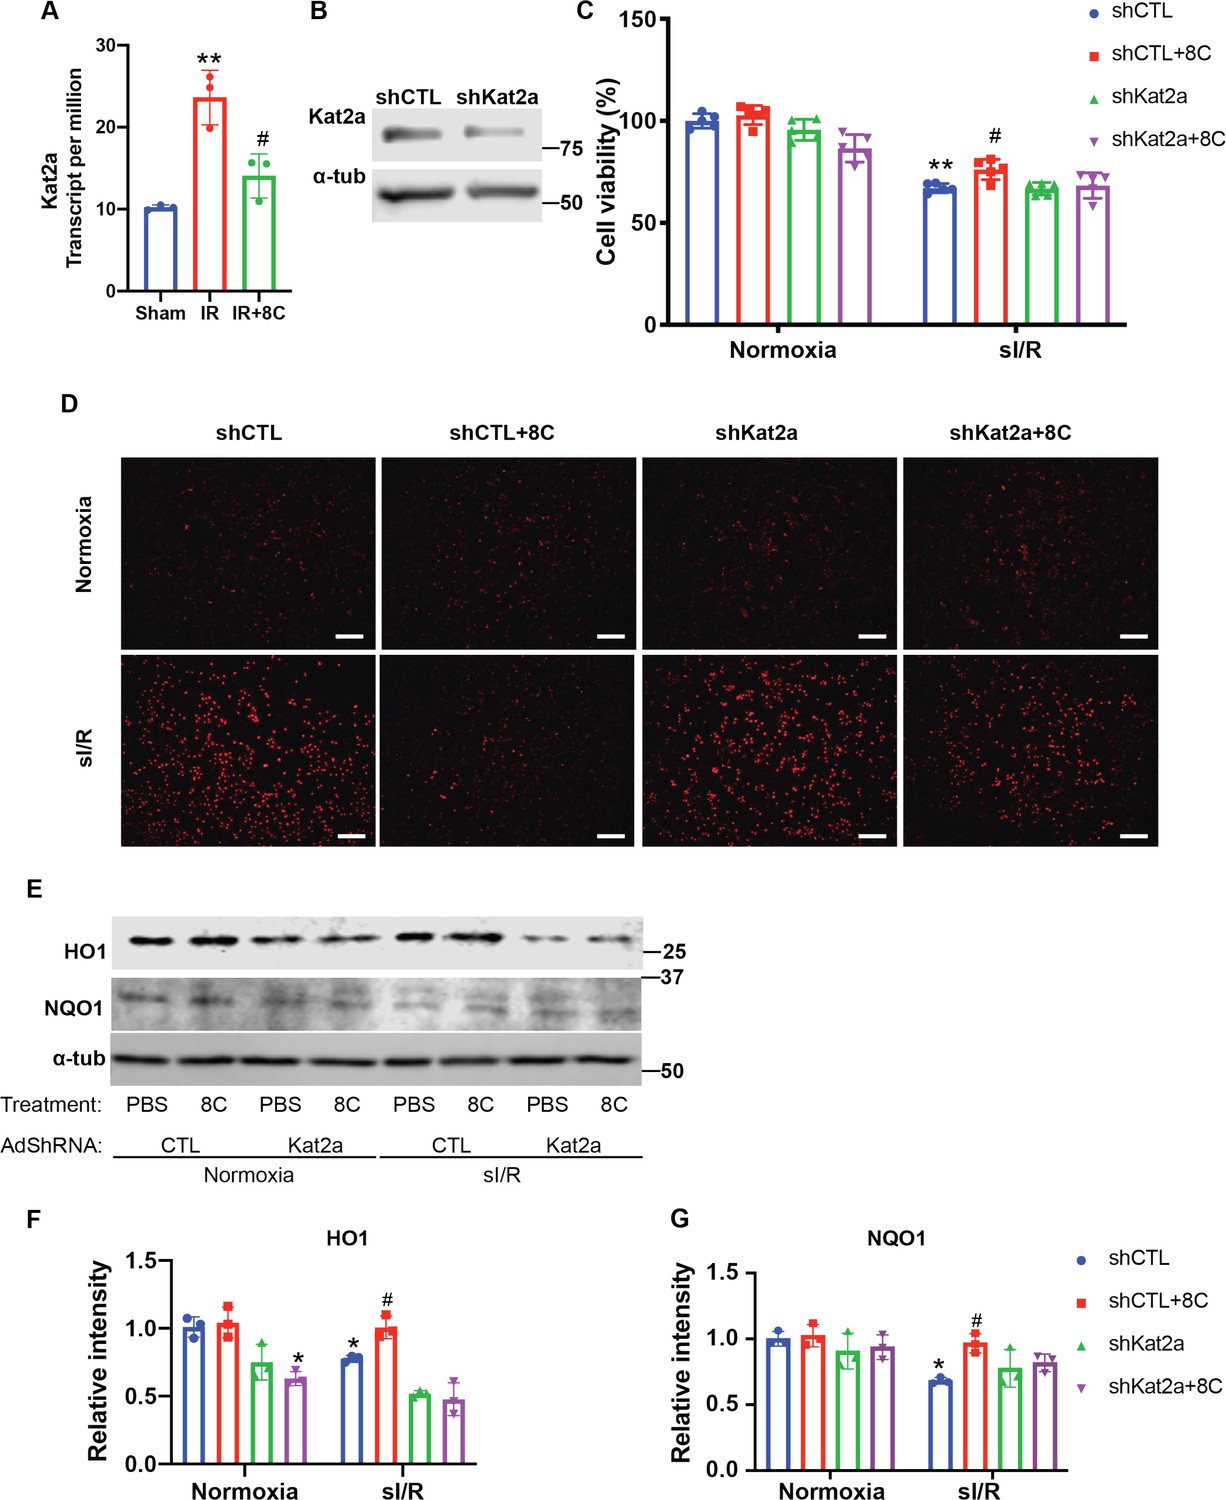
Knockdown of Kat2a is required for alleviating ROS accumulation.
(A) Kat2a was upregulated after I/R based on RNA-seq results. (B) Western blot showed knockdown of Kat2a by adenovirus sh-RNA. (C) Cell viability measurement in NRVMs at indicated condition using CCK8 detection kit. (D) NRVM cellular ROS levels are indicated by DHE staining after sI/R treatment. Scale bar: 200 µm. (E–G) Western blot and quantifications of HO1 and NQO1 in NRVMs after sI/R. n = 3, *p < 0.05, **p < 0.01, vs Normoxia + PBS + shCTL; # p < 0.05 vs sI/R + PBS + shCTL. Data were analyzed by two-way ANOVA, followed by post-hoc Tukey test.
-
Figure 6—figure supplement 1—source data 1
Original western blot figure for Figure 6—figure supplement 1.
- https://cdn.elifesciences.org/articles/60311/elife-60311-fig6-figsupp1-data1-v2.zip
Tables
Key resources table
| Reagent type (species) or resource | Designation | Source or reference | Identifiers | Additional information |
|---|---|---|---|---|
| Antibody | Bcl2 (Rabbit monoclonal antibody) | Abcam | Cat#: ab182858; RRID: AB_2715467 | Western blot (1:1000) |
| Antibody | Bax (Rabbit polyclonal antibody) | Cell Signaling Technology | Cat#: 2,772 S; RRID: AB_10695870 | Western blot (1:1000) |
| Antibody | α-Tubulin (mouse monoclonal antibody) | Cell Signaling Technology | Cat#: 3,873 S; RRID: AB_1904178 | Western blot (1:1000) |
| Antibody | PARP (Rabbit polyclonal antibody) | Cell Signaling Technology | Cat#: 9542; RRID: AB_2160739 | Western blot (1:1000) |
| Antibody | H3K9ac (Rabbit polyclonal antibody) | Sigma | Cat#: 06–942; RRID: AB_310308 | Western blot (1:3000), 1:100 for ChIP (1:100) |
| Antibody | H3K14ac (Rabbit polyclonal antibody) | Sigma | Cat#: 07–353; RRID: AB_310545 | Western blot (1:3000) |
| Antibody | H3K27ac (Rabbit polyclonal antibody) | Millipore | Cat#: 07–360; RRID: AB_310550 | Western blot (1:3000) |
| Antibody | AcH3 (Rabbit polyclonal antibody) | Millipore | Cat#: 06–599; RRID: AB_2115283 | Western blot (1:3000) |
| Antibody | Histone H3 (mouse monoclonal antibody) | Sigma | Cat#: 14,269 S; RRID: AB_2756816 | Western blot (1:2000) |
| Antibody | HO1 (Rabbit polyclonal antibody) | Proteintech Group Inc | Cat#: 10701–1-AP; RRID: AB_2118685 | Western blot (1:1000) |
| Antibody | NQO1 (Rabbit polyclonal antibody) | Proteintech Group Inc | Cat#: 11451–1-AP; RRID: AB_2298729 | Western blot (1:1000) |
| Antibody | SOD2 (Rabbit polyclonal antibody) | Proteintech Group Inc | Cat#: 24127–1-AP; RRID:AB_2879437 | Western blot (1:1000) |
| Antibody | MCAD (Rabbit polyclonal antibody) | Proteintech Group Inc | Cat#: 55210–1-AP; RRID: AB_10837361 | Western blot (1:1000) |
| Antibody | Kat2a (Rabbit recombinant antibody) | Abcam | Cat#: Ab217876; RRID:AB_2811191 | Western blot (1:1000) |
| Antibody | cTnT (Rabbit polyclonal antibody) | Abcam | Cat#: ab45932; RRID: AB_956386 | IF (1:200), FACS (1:200) |
| Antibody | 680RD Donkey anti-Mouse IgG (H + L) | LI-COR | Cat# 926–68072;RRID:AB_10953628 | Western blot (1:5000) |
| Antibody | 800CW Donkey anti-Rabbit IgG (H+ L) | LI-COR | Cat# 926–32213; RRID:AB_621848 | Western blot (1:5000) |
| Chemical compound, drug | Sodium acetate | Sigma | Cat#:S2889-250G | |
| Chemical compound, drug | Sodium Pyruvate | Sigma | Cat#:P2265-5G | |
| Chemical compound, drug | Sodium Citrate | Sigma | Cat#: PHR1416-1G | |
| Chemical compound, drug | Sodium Octanoate | Fisher | Cat#: N029125G | |
| Chemical compound, drug | Sodium Nonanoate | TCI America | Cat#: N0291-25G | |
| Chemical compound, drug | Evans Blue | Fisher | Cat#: AC195550250 | |
| Chemical compound, drug | 2,3,5-Triphenyltetrazolium chloride | Sigma | Cat#: T8877 | |
| Chemical compound, drug | Dihydroethidium (DHE) | Cayman | Cat#: 12,013 | |
| Chemical compound, drug | U-13C-Sodium octanoate | Cambridge Isotope Laboratories | Cat#:CLM-9617-PK | |
| Chemical compound, drug | EDTA-free Protease Inhibitor Cocktail | Sigma | Cat#:118350001 | |
| Chemical compound, drug | Type II Collagenase | WorthingtonBiochemical Co. | Cat#: LS004174 | |
| Chemical compound, drug | 2-deoxy-D-Glucose | Cayman | Cat#: 14,325 | |
| Peptide, recombinant protein | Micrococcal Nuclease | NEB | Cat#: M0247S | |
| Chemical compound, drug | IHC Zinc Fixative | Fisher | Cat#: BDB550523 | |
| Commercial assay or kit | Creatine Kinase Activity Assay Kit | Sigma | Cat#: MAK116-1KT | |
| Commercial assay or kit | Lactate Dehydrogenase Activity Assay Kit | Sigma | Cat#: MAK066 | |
| Commercial assay or kit | SOD Assay Kit-WST | Dojindo | Cat#: S311-10 | |
| Commercial assay or kit | PowerUp SYBR Green MasterMix | Thermo Fisher | Cat#: A25778 | |
| Commercial assay or kit | Precision Plus Protein All Blue Prestained | Bio-rad | Cat#:1610373 | |
| Commercial assay or kit | iScript cDNA Synthesis Kit | Bio-rad | Cat#:1708891 | |
| Commercial assay or kit | AccuPrep PCR Purification Kit | Bioneer | Cat#: K-3034 | |
| Commercial assay or kit | Trichrome Stain (Masson) Kit | Sigma | Cat#: HT15-1KT | |
| Commercial assay or kit | TUNEL Assay Kit | Sigma | Cat#:11684795910 | |
| Commercial assay or kit | Cytotoxicity LDH Assay Kit-WST | Dojindo | Cat#: CK12-05 | |
| Commercial assay or kit | PicoProbeAcetyl-CoAFluorometric Assay Kit | Fisher | Cat#: NC9976028 | |
| Commercial assay or kit | Cell Counting Kit-8 | Dojindo | Cat#: CK04-13 | |
| Commercial assay or kit | BD Annexin V-FITC | Fisher | Cat#: BDB556420 | |
| Commercial assay or kit | Succinate Colorimetric Assay Kit | Fisher | Cat#: NC0541966 | |
| Commercial assay or kit | TRIzol Reagent | Sigma | Cat#: 15596018 | |
| Commercial assay or kit | TURBO DNase | Thermo Fisher | Cat#: AM2238 | |
| Commercial assay or kit | NEBNext Ultra II Directional RNA Library Prep Kit for Illumina | NEB | Cat#: E7760L | |
| Commercial assay or kit | Creatine kinase (CK) MB isolenzyme Elisa kit | ABclonal | RK03571 | |
| Commercial assay or kit | Troponin I (TnI) Elisa kit | Abclonal | RK03995 | |
| Strain, strain background (Escherichia coli) | NEB stable E-coli | NEB | Cat#: C3040H | |
| Strain, strain background (Escherichia coli) | NEB 10-beta competent E. coli | NEB | Cat#:C3019H | |
| Recombinant DNA reagent | BLOCK-iT U6 RNAi Entry VectorKit | Invitrogen | Cat#: K494500 | |
| Recombinant DNA reagent | Gateway LR Clonase II Enzyme Mix | Thermo Fisher | Cat#: 11791–020 | |
| Recombinant DNA reagent | pAd/PL-DEST Gateway VectorKit | Thermo Fisher | Cat#: V49420 | |
| Cell line (Homo-sapiens) | 293 A Cell Line | Thermo Fisher | R70507 | For package of Adenovirus |
| Software, algorithm | ImageJ | NIH | https://imagej.nih.gov/ij/ | |
| Software, algorithm | GraphPad Prism (version 7) | Graphpad Software | https://www.graphpad.com/scientific-software/prism/ | |
| Software, algorithm | Odyssey CLx Imaging System | LI-COR Biosciences | https://www.licor.com/ | |
| Software, algorithm | FlowJo | Flowjo | https://www.flowjo.com/ |
Additional files
-
Supplementary file 1
List of DEGs between I/R and I/R with 8 C treatment.
- https://cdn.elifesciences.org/articles/60311/elife-60311-supp1-v2.xlsx
-
Transparent reporting form
- https://cdn.elifesciences.org/articles/60311/elife-60311-transrepform1-v2.docx
Download links
A two-part list of links to download the article, or parts of the article, in various formats.
Downloads (link to download the article as PDF)
Open citations (links to open the citations from this article in various online reference manager services)
Cite this article (links to download the citations from this article in formats compatible with various reference manager tools)
Acetyl-CoA production by specific metabolites promotes cardiac repair after myocardial infarction via histone acetylation
eLife 10:e60311.
https://doi.org/10.7554/eLife.60311


