Cdon mutation and fetal alcohol converge on Nodal signaling in a mouse model of holoprosencephaly
- Department of Cell, Developmental, and Regenerative Biology, Icahn School of Medicine at Mount Sinai, United States
- Max-Delbruck-Center for Molecular Medicine, Germany
Figures
Figure 1
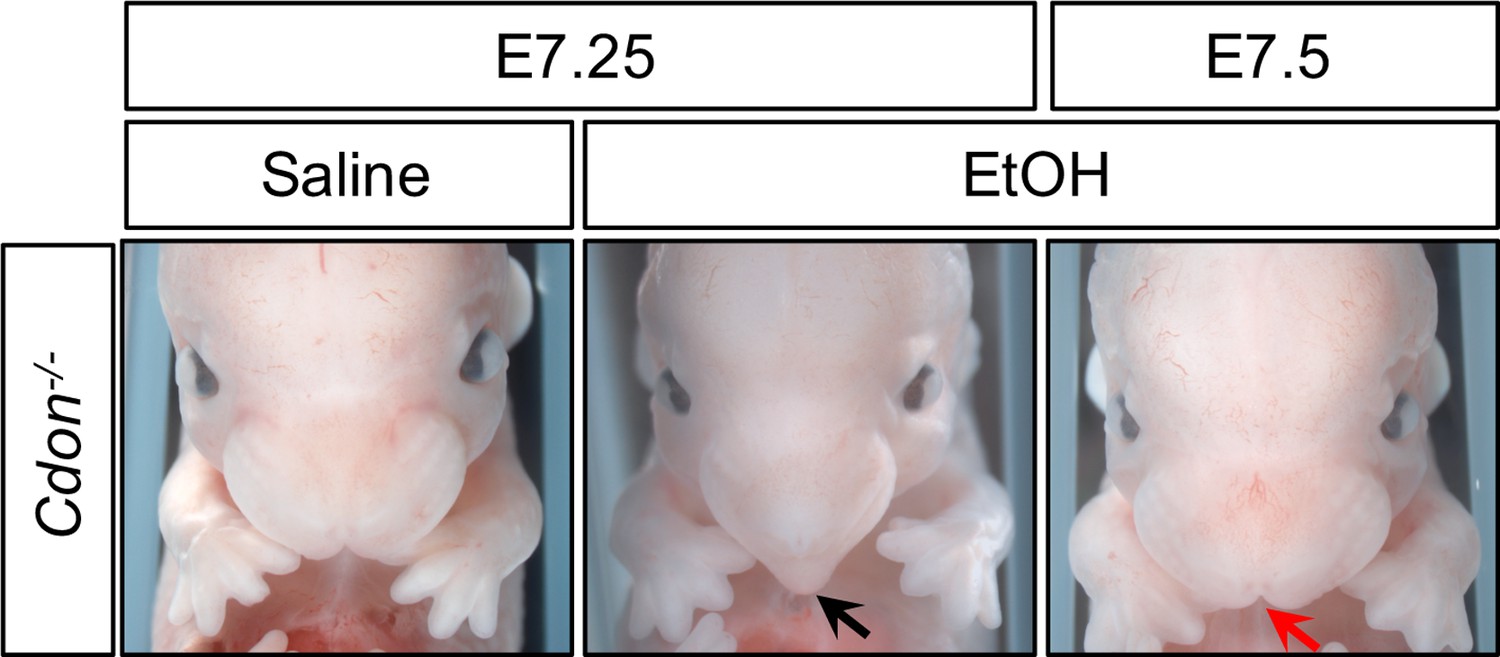
Time course of EtOH-Induced HPE in Cdon-/- Embryos.
Frontal views of E14.0 embryos. Treatment of Cdon-/- embryos with EtOH at E7.25, but not E7.5, results in HPE (see Table 1 for quantification). The Cdon-/-embryo treated with EtOH at E7.25 displays a fused upper lip and single nostril (black arrow), whereas the Cdon-/-embryo treated with EtOH at E7.5 does not and resembles the saline control (red arrow).
Figure 2
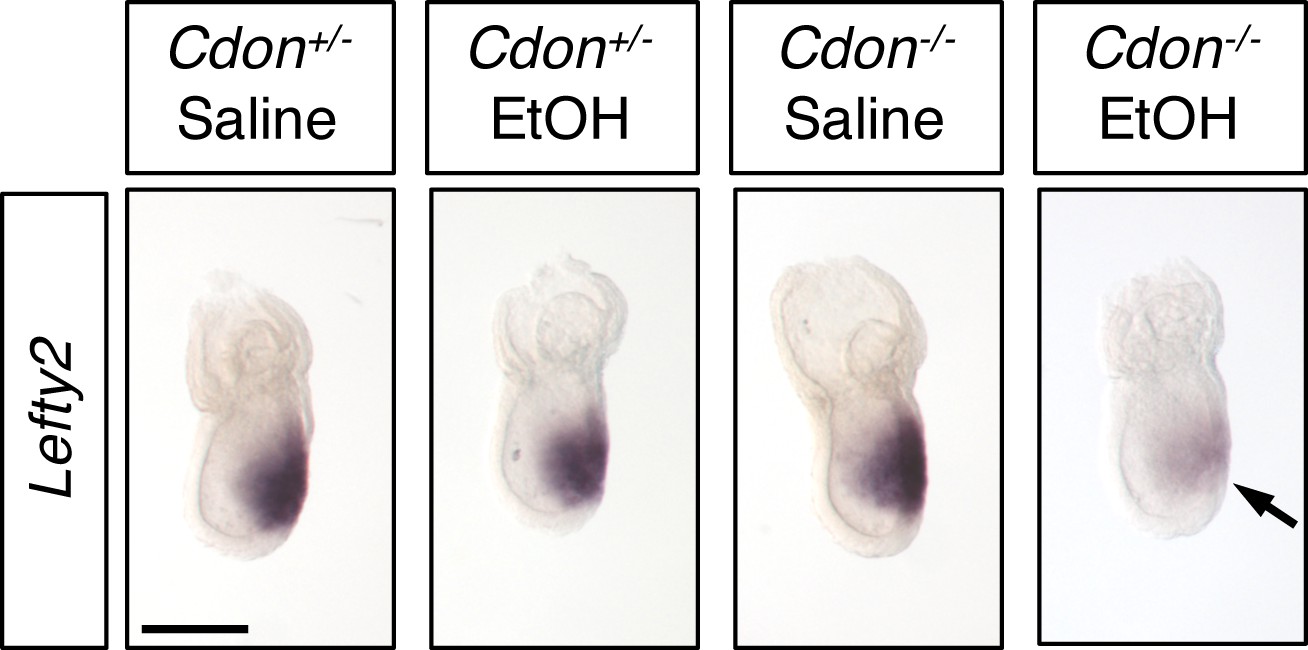
Defective Expression of Lefty2 at the Primitive Streak Stage of EtOH-Treated Cdon-/- Embryos.
Whole mount in situ hybridization analyses of Lefty2 in embryos of the indicated genotype and treatment harvested at E7.25. Lefty2 expression was decreased specifically in EtOH-treated Cdon-/- embryos. Numbers of embryos with similar results: Cdon+/- (saline) = 6; Cdon+/- (EtOH) = 4; Cdon-/- (saline) = 9; Cdon-/- (EtOH) = 9. Scale Bar, 200 μm.
Figure 3
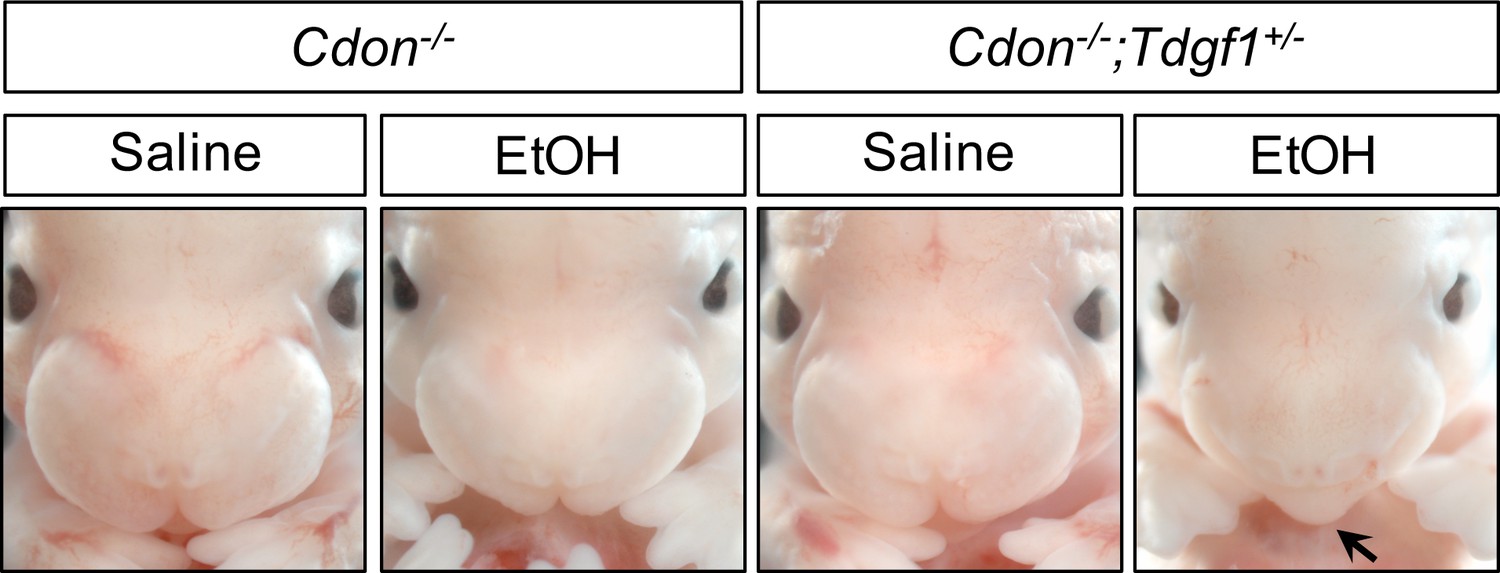
Tdgf1 Heterozygosity Enhances EtOH-Induced HPE in Cdon-/- Embryos.
Frontal views of E14.0 embryos. Removal of one copy of Tdgf1 enhanced the response of Cdon-/- embryos to a dose of 2.9 g/kg EtOH (see Table 2 for quantification). The EtOH-treated Cdon-/-;Tdgf1+/- embryo displays a fused upper lip (arrow).
Figure 4

Lefty2 Heterozygosity Suppresses EtOH-Induced HPE in Cdon-/- Embryos.
Frontal views of E14.0 embryos. Removal of one copy of Lefty2 suppressed formation of single nostril in Cdon-/- embryos in response to a dose of 3.48 g/kg EtOH (see Table 3 for quantification). The EtOH-treated Cdon-/- embryo displays a fused upper lip and single nostril (black arrow), whereas the EtOH-treated Cdon-/-;Lefty2+/- embryo has a fused upper lip and two nostrils (red arrow).
Figure 5 with 1 supplement
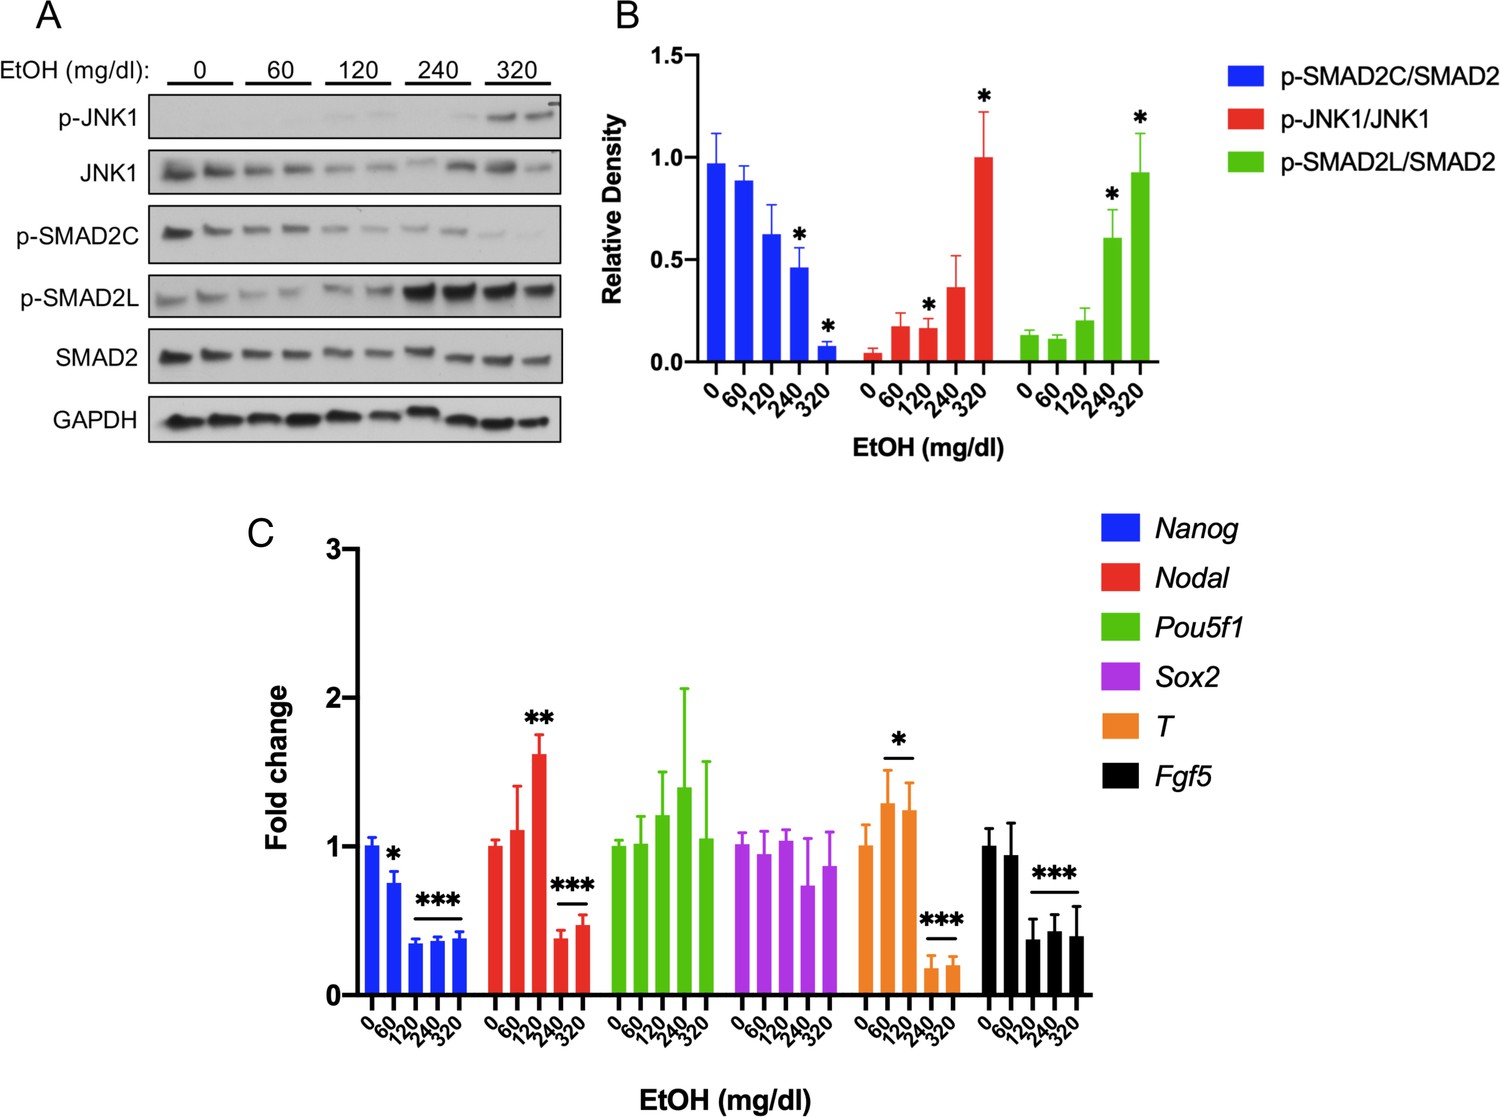
Acute EtOH treatment inhibits activin/nodal signaling in mEpiSCs.
(A) Representative western blot of mEpiSCs treated with the indicated doses of EtOH for 6 hr. GAPDH was used as a loading control. (B) Densitometric quantification of p-SMAD2C levels, relative to total Smad2; p-JNK1 levels, relative to total JNK1; and p-SMAD2L levels, relative to total SMAD2, with the indicated doses of EtOH. N = 3 experiments with two biological replicates (as shown in (A)) in each experiment. (C) qRT-PCR analysis of Nanog, Nodal, Pou5f1, and Sox2 expression in mEpiSCs treated with the indicated doses of EtOH for 6 hr. Expression was normalized to Gapdh expression. N = 3 experiments with two biological replicates in each experiment. Values for (B) and (C) are means ± SEM, *p<0.05, **p<0.01, ***p,0.001 by Student’s t-test.
-
Figure 5—source data 1
Source data for quantification of western blot results shown in Figure 5A and B.
- https://cdn.elifesciences.org/articles/60351/elife-60351-fig5-data1-v1.xlsx
-
Figure 5—source data 2
Source data for quantification of qRT-PCR results shown in Figure 5C.
- https://cdn.elifesciences.org/articles/60351/elife-60351-fig5-data2-v1.xlsx
Figure 5—figure supplement 1
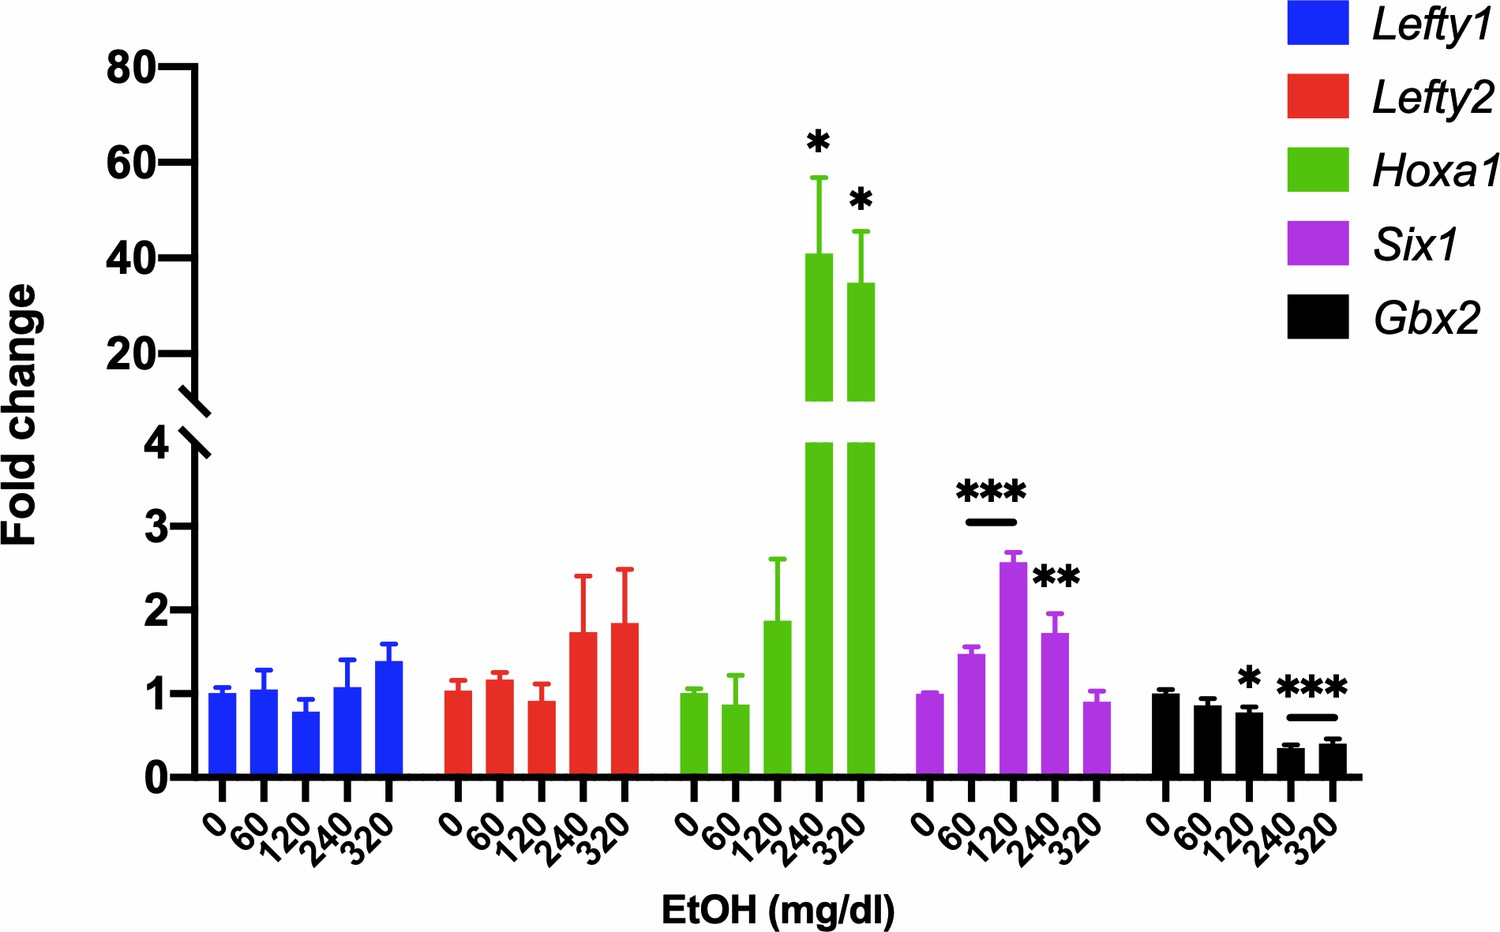
Analysis of gene expression in EtOH-treated mEpiSCs.
qRT-PCR analysis of Lefty1, Lefty2, Hoxa1, Six1, and Gbx2 expression in mEpiSCs treated with the indicated doses of EtOH for 6 hr. Expression was normalized to Gapdh expression. N = 3 experiments with two biological replicates in each experiment. Values are means ± SEM, *p<0.05, **p<0.01, ***p,0.001 by Student’s t-test.
-
Figure 5—figure supplement 1—source data 1
Source data for quantification of qRT-PCR results shown in Figure 5.
- https://cdn.elifesciences.org/articles/60351/elife-60351-fig5-figsupp1-data1-v1.xlsx
Figure 6
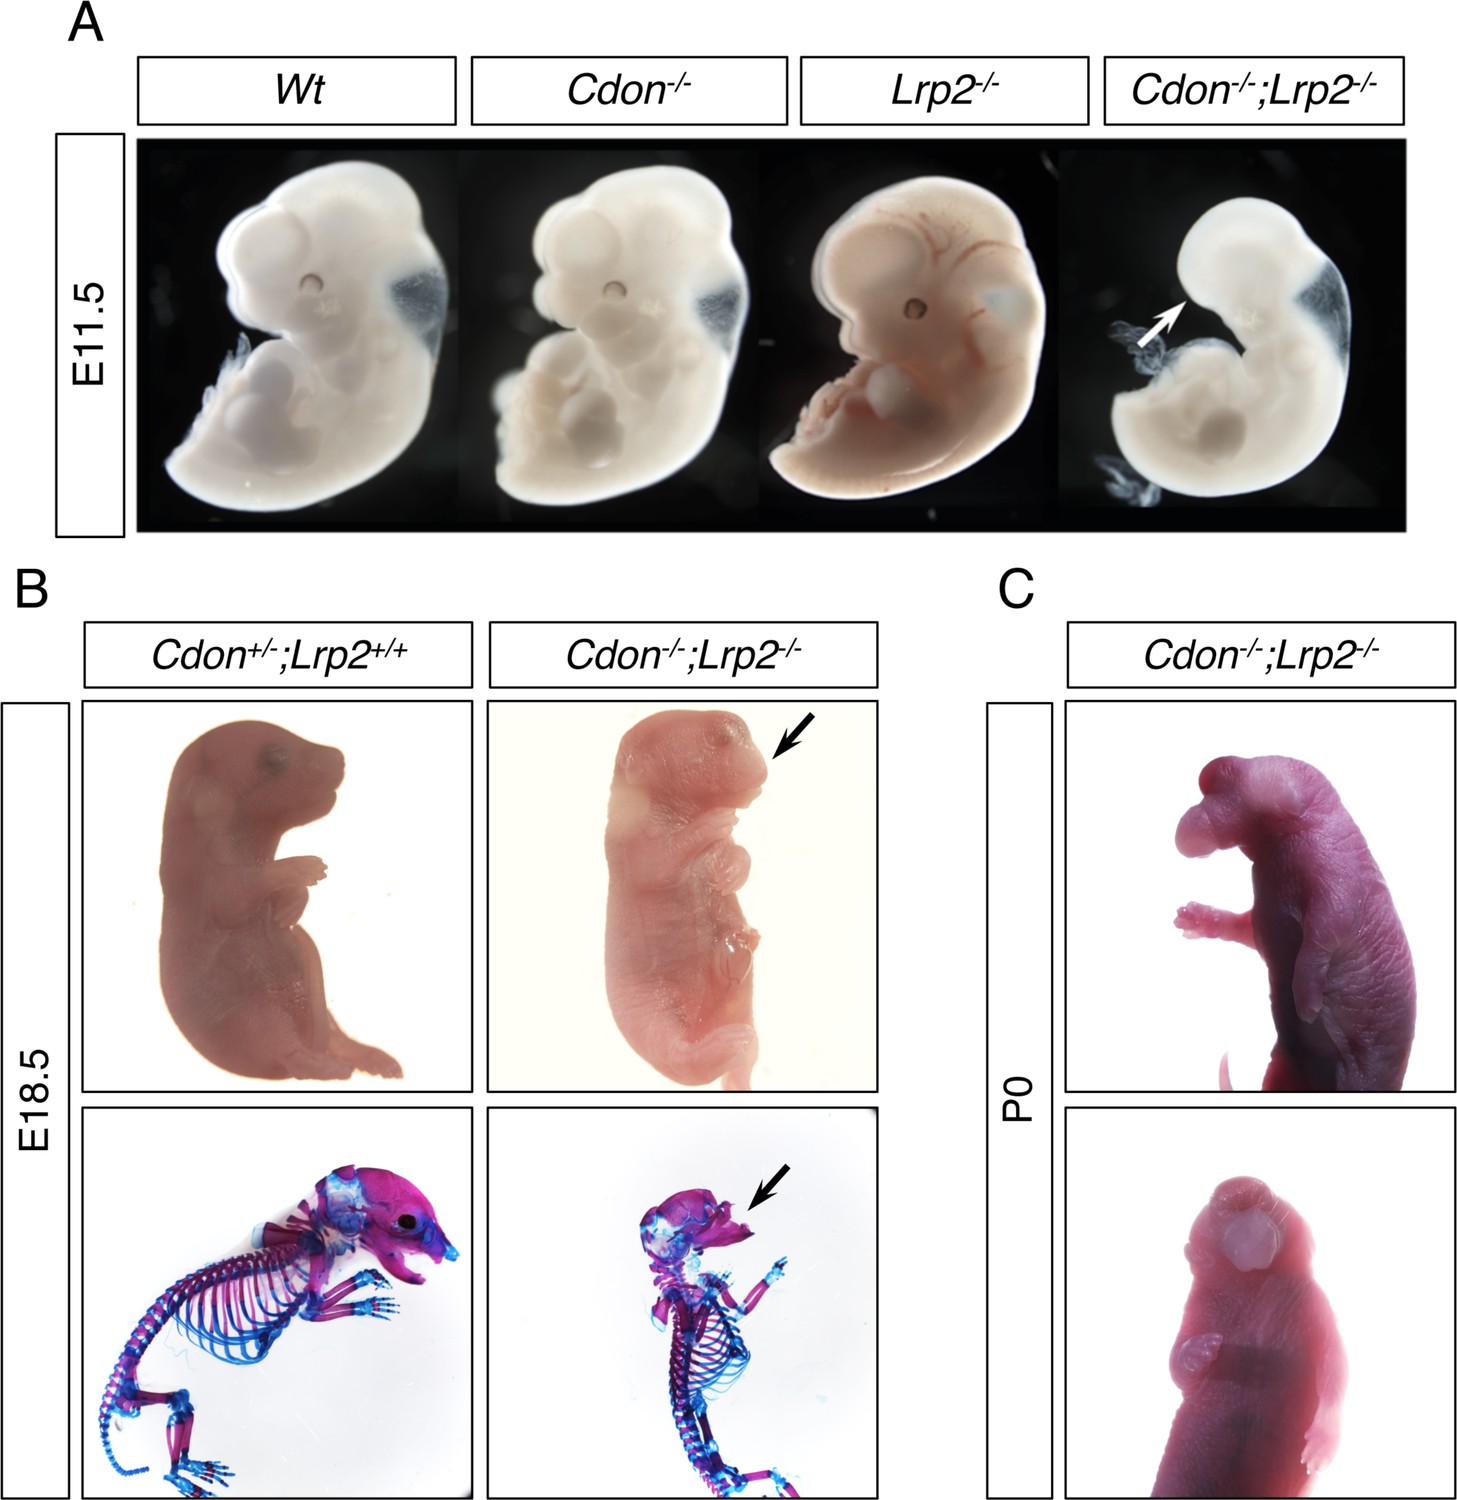
Cdon and Lrp2 Interact Genetically to Produce HPE and Anterior Truncations in Mice.
(A) Whole mount E11.5 embryos of the indicated genotype. Note the loss of anterior head structures in the Cdon-/-;Lrp2-/- embryo (arrow). (B) E18.5 embryos of the indicated genotype in whole mount and alizarin red/alcian blue-stained skeleton preparations. Note the craniofacial truncation in the Cdon-/-;Lrp2-/- embryos (arrows). (C) Whole mount P0 Cdon-/-;Lrp2-/- embryo showing severe HPE.
Figure 7 with 1 supplement

CDON and LRP2 Bind to TDGF1.
(A) The indicated AP-tagged proteins were co-expressed with CDON-Fc, and equivalent amounts of AP proteins in conditioned medium (CM) were pulled down. Levels of CDON-Fc in CM and in the pull down were detected by western blot. (B) CDON-Fc was pulled down from CM derived from transfections as in (A), the amount of CDON-Fc from various CM normalized, and associated AP enzyme activity quantified, N = ≥4 for (A) and (B). (C) Schematic of full length LRP2 and recombinant mini-receptor variants used. Each mini-receptor spans one of the four repetitive modules of the extracellular receptor domain and was expressed either as soluble ectodomain fragments fused to IgG Fc (designated sR1- sR4) or as a membrane-bound mini-receptor fused to the authentic transmembrane and intracellular domains of LRP2 (designated R1- R4). Soluble ectodomain fragments sR1 – sR4 were studied in panel (D), whereas mini-receptors R1 – R4 were used in Figure 7—figure supplement 1 . Amino acid numbers next to the full-length receptor polypeptide indicate the extent of individual receptor domains. (D) The indicated Fc-tagged proteins were pulled down from CM derived from transfections as in (A), the amount of Fc-tagged protein from various CM normalized, and associated AP enzyme activity quantified, N = 3. Values for (B) and (D) are means ± SEM, *p<0.05, **p<0.01 by Student’s t-test.
-
Figure 7—source data 1
Source data for quantification of AP activity in CDON-Fc pulldown experiments shown in Figure 7B.
- https://cdn.elifesciences.org/articles/60351/elife-60351-fig7-data1-v1.xlsx
-
Figure 7—source data 2
Source data for quantification of AP activity in CDON-Fc and soluble LRP2 minireceptor-Fc pulldown experiments shown in Figure 7D.
- https://cdn.elifesciences.org/articles/60351/elife-60351-fig7-data2-v1.xlsx
Figure 7—figure supplement 1
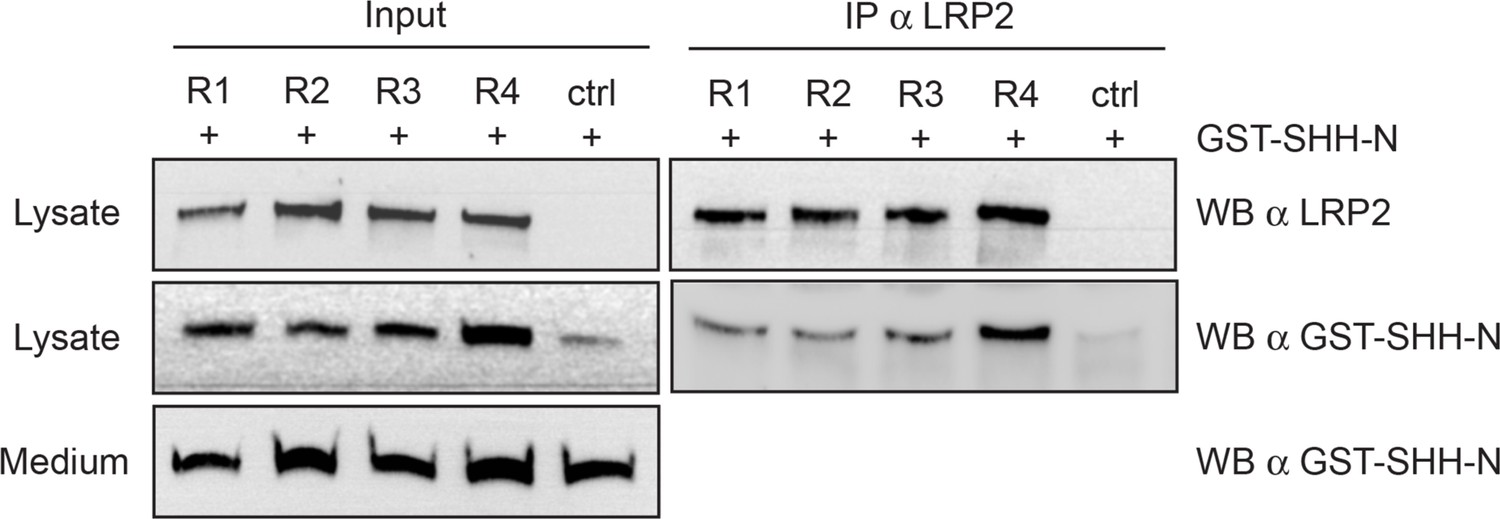
HEK293 cell transfectants expressing the indicated LRP2 mini-receptor were incubated with GST-SHH-N, and cell lysates immunoprecipitated with antibody to LRP2 and blotted with antibodies to LRP2 and GST.
Tables
Table 1
Time course of EtOH-Induced HPE in Cdon-/- Embryos
| EtOH treatment: | E7.25 | E7.5 | ||||
|---|---|---|---|---|---|---|
| Saline | EtOH | EtOH | ||||
| Phenotype* | Cdon+/- | Cdon-/- | Cdon+/- | Cdon-/- | Cdon+/- | Cdon-/- |
| Fused upper lip | 0/17 | 2/14 | 0/21 | 13/24** | 0/13 | 0/22 |
| Single nostril | 0/17 | 0/14 | 0/21 | 5/24 | 0/13 | 0/22 |
| Proboscis | 0/17 | 0/14 | 0/21 | 2/24 | 0/13 | 0/22 |
-
* All embryos with HPE had fused upper lip, a fraction of these showed single nostril and proboscis.
**p=0.0165 by Fisher’s two-tailed exact test, when compared to EtOH-treated Cdon+/- embryos.
Table 2
Tdgf1 Heterozygosity Enhances EtOH-Induced HPE in Cdon-/- Embryos.
| Treatment | Genotype (# embryos with HPE/total (%))* | |||
|---|---|---|---|---|
| Cdon+/-;Tdgf1+/- | Cdon-/-;Tdgf1+/+ | Cdon-/-;Tdgf1+/- | ||
| Saline | 0/23 (0%) | 0/11 (0%) | 2/27 (7.4%) | |
| EtOH (2.9 g/kg) | 1/48 (2.1%) | 9/32 (28.1%) | 31/56 (55.4%)** | |
-
* Crosses between the following genotypes were used to generate the genotypes scored above:
Cdon+/-;Tdgf1+/- x Cdon+/-;Tdgf1+/-.
-
Cdon+/-;Tdgf1+/- x Cdo-+/-;Tdgf1+/-.
Cdon+/- x Cdon+/-;Tdgf1+/-.
-
Cdon+/- x Cdon-/-;Tdgf1+/-.
Cdon-/- x Cdon+/-;Tdgf1+/-.
-
No HPE was found in offspring genotypes other than those shown.
** p=0.014 by Fisher's two-tailed exact test, when compared to EtOH-treated Cdon-/-; Tdgf1 +/+ embryos.
Table 3
Lefty2 Heterozygosity Supresses EtOH-Induced HPE in Cdon-/- Embryos.
| Treatment | Genotype (# affected/total (%))* | |||
|---|---|---|---|---|
| Total HPE | Single nostril | |||
| Cdon-/-;Lefty2+/+ | Cdon-/-;Lefty2+/- | Cdon-/-;Lefty2+/+ | Cdon-/-;Lefty2+/- | |
| Saline | 1/12 (8.3%) | 0/10 (0%) | 0/12 (0%) | 0/10 (0%) |
| EtOH (3.48 g/kg) | 33/47 (70.2%) | 26/48 (54.2%) | 10/47 (21.3%) | 3/48 (6.3%)** |
-
* Crosses between the following genotypes were used to generate the genotypes scored above:
Cdon+/-;Lefty2+/- x Cdon+/-;Lefty2+/-.
-
Cdon+/-;Lefty2+/- x Cdo-+/-;Lefty2+/-.
Cdon+/- x Cdon+/-;Lefty2+/-.
-
Cdon+/- x Cdo-/-;Lefty2+/-.
Cdon-/- x Cdon+/-;Lefty2+/-.
-
No HPE was found in offspring genotypes other than those shown.
**p=0.04 by Fisher's two-tailed exact test, when compared to EtOH-treated Cdon-/-;Lefty2+/+ embryos with a single nostril.
Key resources table
| Reagent type (species) or resource | Designation | Source or reference | Identifiers | Additional information |
|---|---|---|---|---|
| Genetic reagent (Mus musculus) | Cdon- | MGI | MGI:1926387 | |
| Genetic reagent (Mus musculus) | Cripto- | MGI | MGI:98658 | |
| Genetic reagent (Mus musculus) | Lefty2- | MGI | MGI:2443573 | |
| Genetic reagent (Mus musculus) | Lrp2- | MGI | MGI:95794 | |
| Cell line (Human) | HEK293T | ATCC | ||
| Cell line (Mus musculus) | EpiSC9 | Najm et al., 2011 | Huang et al., 2017 Kojima et al., 2014 | |
| Antibody | anti-Smad2 (Rabbit mAB) | Cell Signaling | #5339 | WB (1:1000) |
| Antibody | anti-phospho-Smad2C (Rabbit mAB) | Cell Signaling | #3108 | WB (1:1000) |
| Antibody | anti-phospho-Smad2L (Rabbit mAB) | Cell Signaling | #3104 | WB (1:1000) |
| Antibody | anti-JNK (Rabbit polyclonal) | Cell Signaling | #9252 | WB (1:1000) |
| Antibody | anti-phospho-JNK (Rabbit polyclonal) | Cell Signaling | #9251 | WB (1:1000) |
| Antibody | anti-Gapdh (Mouse mAB) | Cell Signaling | #97166 | WB (1:5000) |
| Antibody | anti-DIG AP conjugated | Roche | 11093274910 | WM in situ (1:2000) |
| Antibody | anti-LRP2 (Goat) | Willnow et al., 1996 | WB (1:1000) | |
| Recombinant DNA reagent | SHH-N-AP (plasmid) | This paper | ||
| Recombinant DNA reagent | CD164-AP (plasmid) | This paper | ||
| Recombinant DNA reagent | ActRIIA-AP (plasmid) | This paper | ||
| Recombinant DNA reagent | ALK4-AP (plasmid) | This paper | ||
| Recombinant DNA reagent | Cripto-AP (plasmid) | This paper | ||
| Recombinant DNA reagent | LRP2 sR1-Fc (plasmid) | This paper | ||
| Recombinant DNA reagent | LRP2 sR2-Fc (plasmid) | This paper | ||
| Recombinant DNA reagent | LRP2 sR3-Fc (plasmid) | This paper | ||
| Recombinant DNA reagent | LRP2 sR4-Fc (plasmid) | This paper | ||
| Recombinant DNA reagent | Cdon-Fc (plasmid) | Kang et al., 2003 | ||
| Peptide, recombinant protein | Human Plasma Fibronectin purified protein | MilliporeSigma | FC010 | 10 μg/ml/cm2 |
| Peptide, recombinant protein | Activin A | R and D Systems | 338-AC | 20 ng/ml |
| Peptide, recombinant protein | FGF2 | R and D Systems | 234-FSE | 12 ng/ml |
| Peptide, recombinant protein | IgG Fc (human) | Jackson Laboratories | 009-000-008 | |
| Peptide, recombinant protein | Protein G-agarose beads | Roche | 11243233001 | |
| Peptide, recombinant protein | Anti-AP-conjugated agarose beads | Sigma | A2080 | |
| Commercial assay or kit | AP yellow liquid substrate | Sigma | P7998 | |
| Commercial assay or kit | BM Purple | Roche | 11442074001 | |
| Commercial assay or kit | DIG-labeling kit | Roche | 11277073910 | |
| Commercial assay or kit | Effectene transfection reagent | Qiagen | 301425 | |
| Commercial assay or kit | RNA easy mini kit | Qiagen | 74104 | |
| Commercial assay or kit | Superscript III First strand synthesis system | Invitrogen | 18080051 | |
| Commercial assay or kit | iQ SyBR Green Supermix | BioRad | 1708882 | |
| Software, algorithm | Prism 8 | GraphPad | Prism 8 for MacOS ver 8.4.3 | |
| Sequence-based reagent | GAPDH_F | Invitrogen Dong et al., 2008 | PCR primers | AACGACCCCTTCATTGAC |
| Sequence-based reagent | GAPDH_R | Invitrogen; Dong et al., 2008 | PCR primers | TCCACGACATACTCAGCAC |
| Sequence-based reagent | Fgf5_F | Invitrogen; Liu et al., 2018 | PCR primers | GCTGTGTCTCAGGGGATTGT |
| Sequence-based reagent | Fgf5_R | Invitrogen; Liu et al., 2018 | PCR primers | CACTCTCGGCCTGTCTTTTC |
| Sequence-based reagent | Gbx2_F | Invitrogen; Harvard Primer Bank 133892275c2 | PCR primers | GCAACTTCGACAAAGCCGAG |
| Sequence-based reagent | Gbx2_R | Invitrogen; Harvard Primer Bank 133892275c2 | PCR primers | CCTTGCCCTTCGGGTCATC |
| Sequence-based reagent | Hoxa1_F | Invitrogen; Matt et al., 2005 | PCR primers | CGCACAATGTTCTGATGTCC |
| Sequence-based reagent | Hoxa1_R | Invitrogen; Matt et al., 2005 | PCR primers | TGCAAGCTTCATGACAGAGG |
| Sequence-based reagent | Lefty1_F | Invitrogen; Liu et al., 2018 | PCR primers | AACCGCACTGCCCTTAT |
| Sequence-based reagent | Lefty1_R | Invitrogen; Liu et al., 2018 | PCR primers | CGCGAAACGAACCAACTTGT |
| Sequence-based reagent | Lefty2_F | Invitrogen; Liu et al., 2018 | PCR primers | CAGCCAGAATTTTCGAGAGGT |
| Sequence-based reagent | Lefty2_R | Invitrogen; Liu et al., 2018 | PCR primers | CAGTGCGATTGGAGCCATC |
| Sequence-based reagent | Nanog_F | Invitrogen; Chng et al., 2010 | PCR primers | GGACTTTCTGCAGCCTTACG |
| Sequence-based reagent | Nanog_R | Invitrogen; Chng et al., 2010 | PCR primers | GCTTCCAAATTCACCTCCAA |
| Sequence-based reagent | Nodal_F | Invitrogen; Liu et al., 2018 | PCR primers | CCTGGAGCGCATTTGGATG |
| Sequence-based reagent | Nodal_R | Invitrogen; Liu et al., 2018 | PCR primers | ACTTTCTGCTCGACTGGACA |
| Sequence-based reagent | Pou5f1_F | Invitrogen; Liu et al., 2018 | PCR primers | AGTTGGCGTGGAGACTTTGC |
| Sequence-based reagent | Pou5f1_R | Invitrogen; Liu et al., 2018 | PCR primers | CAGGGCTTTCATGTCCTGG |
| Sequence-based reagent | Six1_F | Invitrogen; Chng et al., 2010 | PCR primers | TTAAGAACCGGAGGCAAAGA |
| Sequence-based reagent | Six1_R | Invitrogen; Chng et al., 2010 | PCR primers | GGGGGTGAGAACTCCTCTTC |
| Sequence-based reagent | Sox2_F | Invitrogen; Liu et al., 2018 | PCR primers | GCGGAGTGGAAACTTTTGTCC |
| Sequence-based reagent | Sox2_R | Invitrogen; Liu et al., 2018 | PCR primers | CGGGAAGCGTGTACTTATCCTT |
| Sequence-based reagent | T_F | Invitrogen; Liu et al., 2018 | PCR primers | CTCGGATTCACATCGTGAGAG |
| Sequence-based reagent | T_R | Invitrogen; Liu et al., 2018 | PCR primers | AAGGCTTTAGCAAATGGGTTGTA |
Additional files
Download links
A two-part list of links to download the article, or parts of the article, in various formats.
Downloads (link to download the article as PDF)
Open citations (links to open the citations from this article in various online reference manager services)
Cite this article (links to download the citations from this article in formats compatible with various reference manager tools)
Cdon mutation and fetal alcohol converge on Nodal signaling in a mouse model of holoprosencephaly
eLife 9:e60351.
https://doi.org/10.7554/eLife.60351


