Regulation of dynamic pigment cell states at single-cell resolution
- Department of Molecular and Cellular Biology Division of Biology and Medicine Brown University, United States
- Department of Biology Valdosta State University, United States
Figures
Figure 1
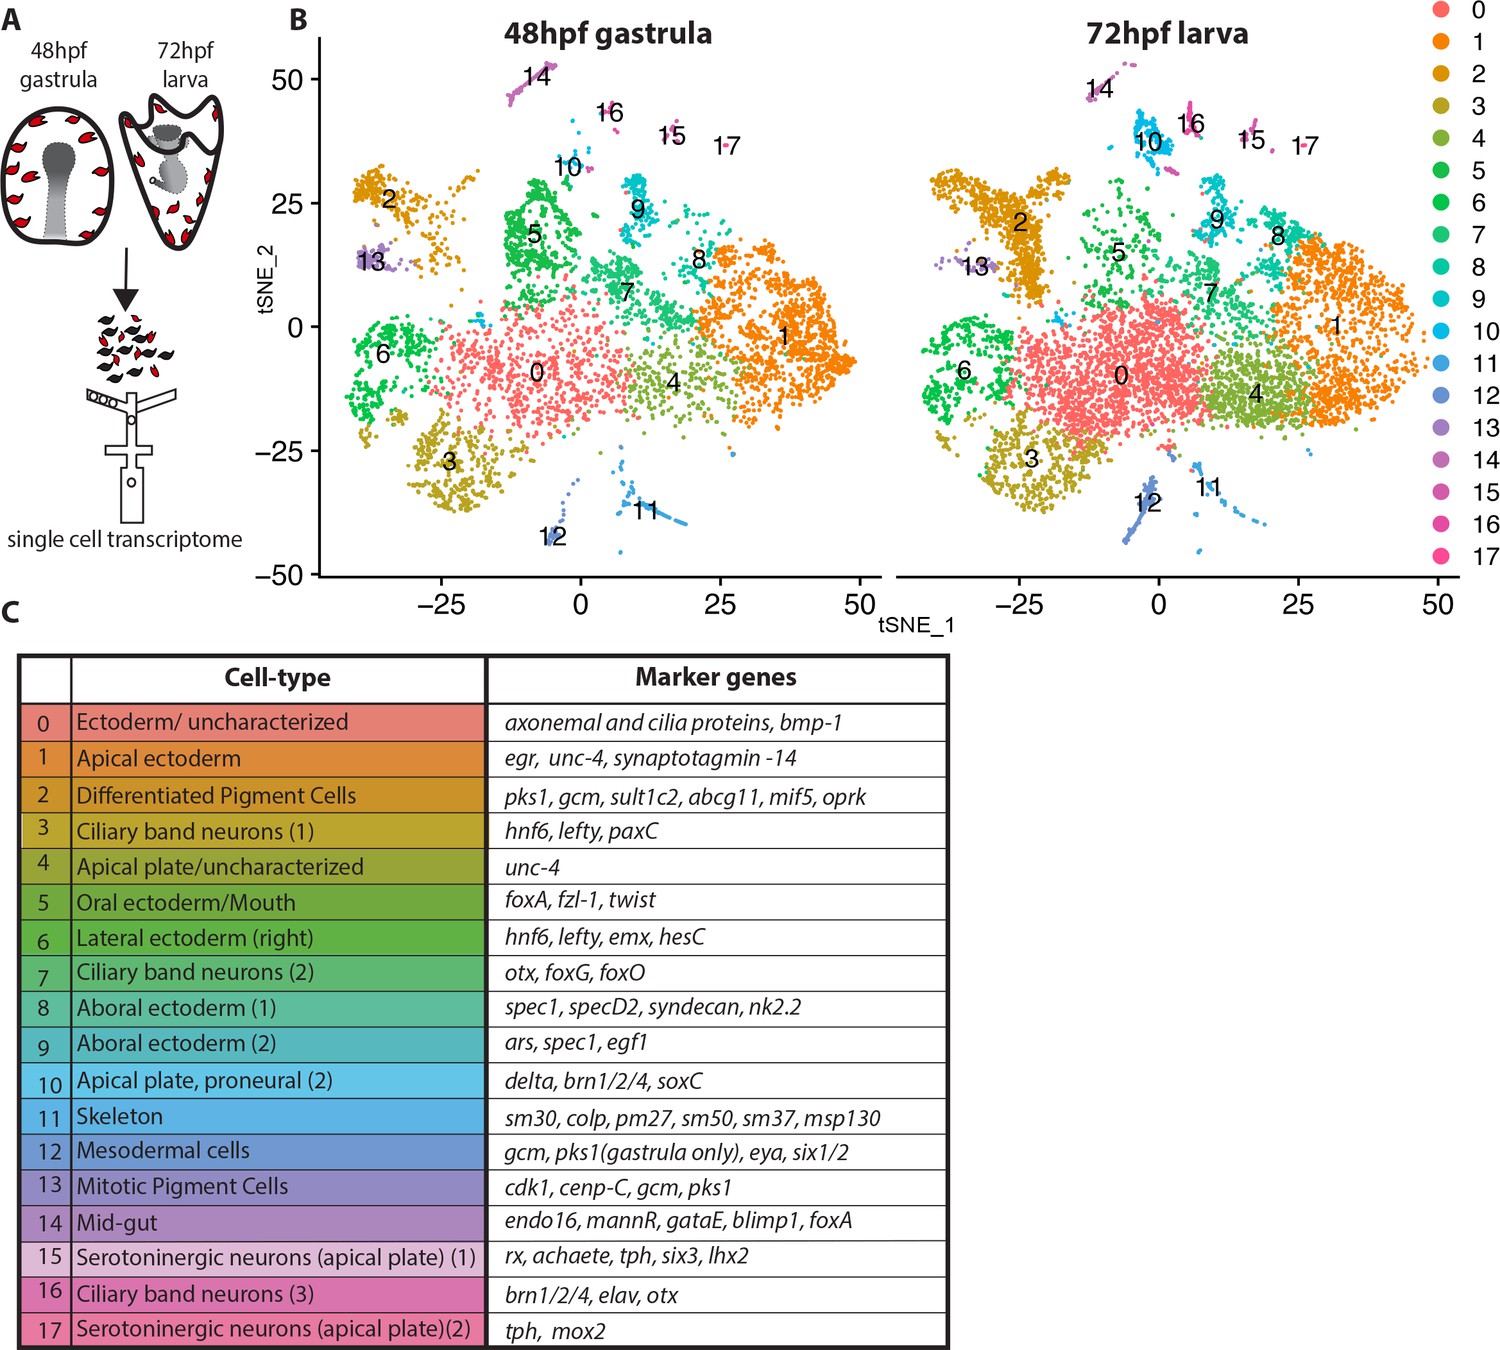
Dissection of S. purpuratus ectodermal cell-types by scRNA-seq.
(A) Cartoon summarizing the dissociation of gastrulae and larvae (pigment cells in red, other cell-types in black), cell separation through drop-seq technology and RNA sequencing. Our single cell sequence datasets detected 20,489 reads/genes and a median 2,909 UMI counts per cell at 48hpf as well as 19,716 reads/genes and a median 1,136 UMI counts per cell at 72hpf. (B) tSNE plots of gastrula (48hpf) and larvae (72hpf) enriched for the ectodermal cell-types. Colors indicate major cell-types grouped by gene expression similarity. In the 48hpf sample, 5688 single cells were captured for downstream analysis, sequenced at a level of 81,121 reads per cell. The 72hpf sample includes 8178 single cells with an average of 54,788 reads per cell. The two samples were integrated to identify conserved cell types and cluster marker genes using Seurat. (C) Table summarizing the cell-type for each cluster (48hpf +72hpf) with the most representative marker genes (colors in the table reflect colors of the tSNE plot clusters).
Figure 2 with 2 supplements
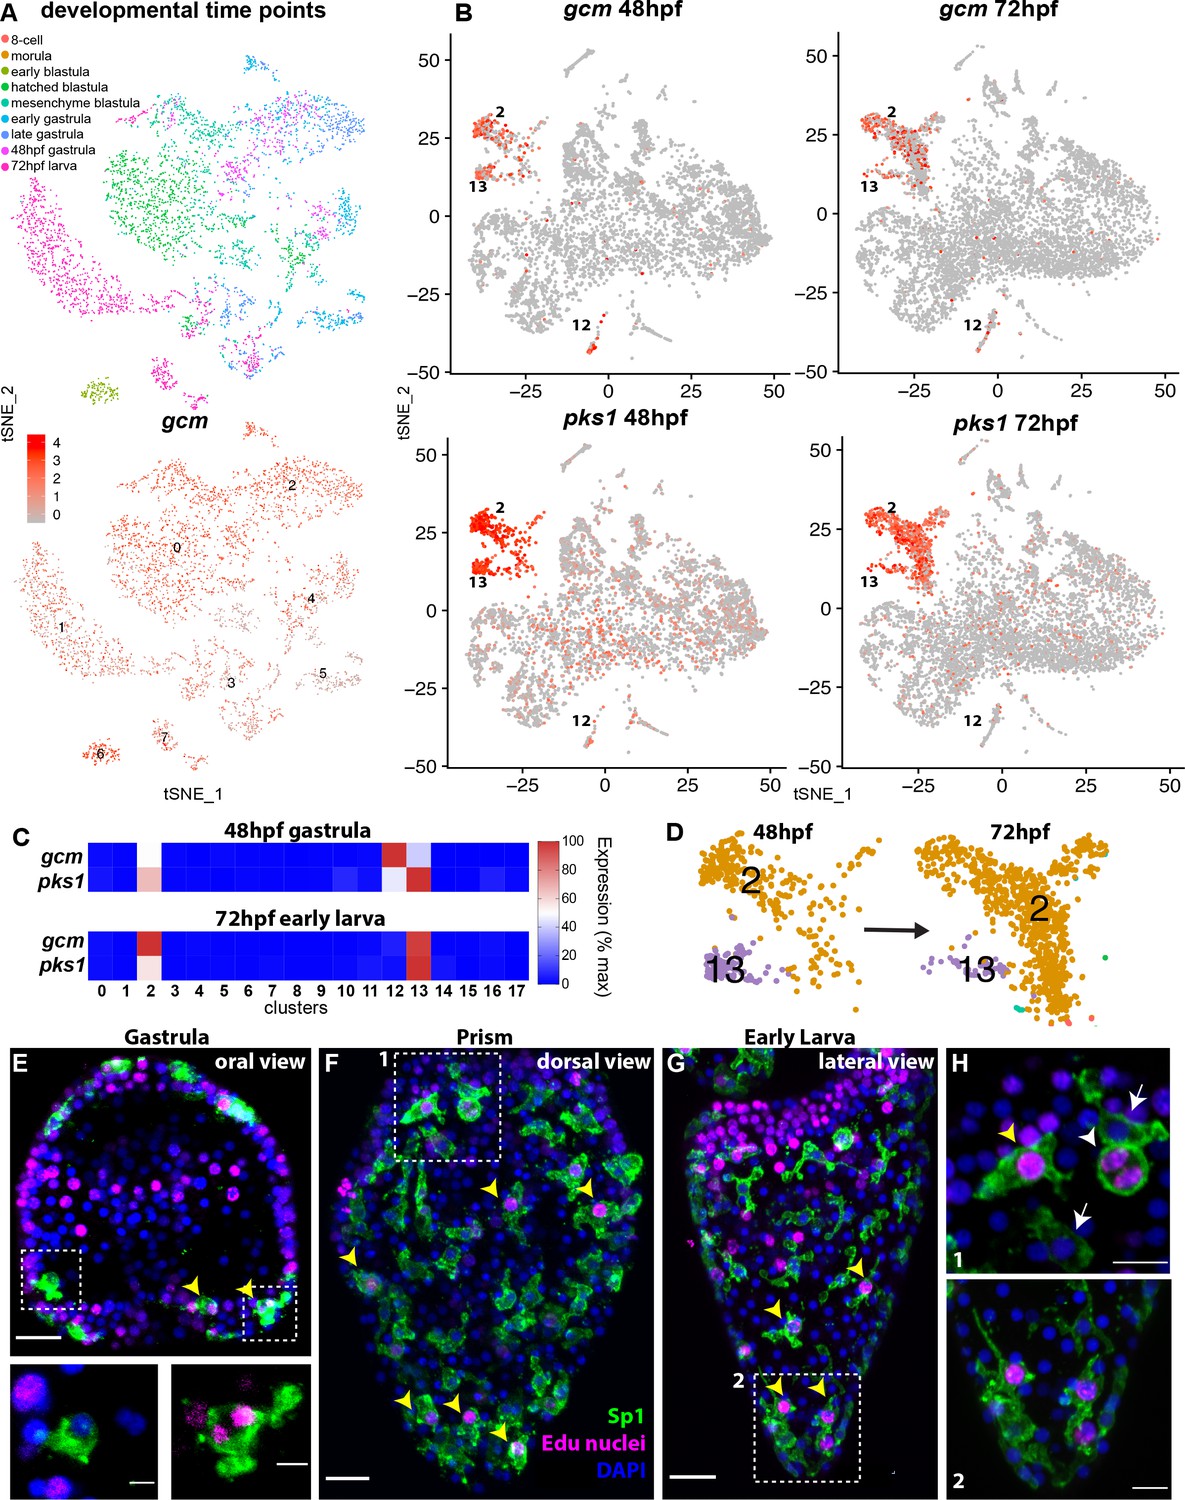
gcm marks pigment cell mitotic and post-mitotic populations.
(A) tSNE plot showing integration of gcm enriched clusters from datasets encompassing nine time points across sea urchin development: 8 cell stage, morula, early blastula, hatched blastula, mesenchyme blastula, early gastrula, late gastrula, 48hpf, and 72hpf. Cells are colored by time point. Feature plots for selected genes are provided in Figure 2—figure supplement 1. Using the dataset of Foster et al., 2020 we found that Gcm was first detected at 64 cell stage, when there are nine gcm+ cells, 1% of total cells. At morula stage 125 cells express gcm, 3.48%. Early blastula:13.9% Hatched: 9.5% Mesenchyme blastula: 7.6% Early gastrula: 6.5% and late gastrula 4.7%. (B) Feature plots of gastrulae and larvae colored for gcm or pks1 showing gene expression in clusters 2 and 13 at 48hpf and 72hpf, and cluster 12 at 48hpf. Violin plots showing expression of gcm and pks1 are in Figure 2—figure supplement 2. (C) Heatmap from scRNA-seq data represents expression of gcm and pks1 in the three clusters mitotic (13) and differentiated (2) pigment cells, and mesodermal cells (12). gcm expression is high in the mesodermal cluster at 48hpf, but decreases at 72hpf. (D) Magnification of tSNE plot from Figure 1B shows that the number of cells in the differentiated pigment cells cluster (2) increases over time, while the mitotic cluster (13) decreases. (E,F,G) Double staining for pigment cells (Sp1 antibody) and Edu labeling to mark cells that have recently synthesized DNA (yellow arrowheads). Note that mitotic pigment cells are broadly distributed within the embryos and larvae. (H) Magnifications of boxes 1 and 2 from figure F and G. White arrowheads show a pigment cell undergoing mitosis, yellow arrowhead shows another mitotic pigment cell, arrows show pigment cells that are non-mitotic. Scale bars are 100 μm (F, G), 20 μm (E) and 5 μm (H). All images are stacks of merged confocal Z sections.
Figure 2—figure supplement 1
Examples of cell states across developmental stages.
(A) Feature plots showing expression of pigment cell markers across developmental stages. Co-expression of these markers identifies pigment cells in the data. (B) Feature plots showing co-expression of stomach cell genes, blimp1/krox, foxA, and gataE in cluster 6.
Figure 2—figure supplement 2
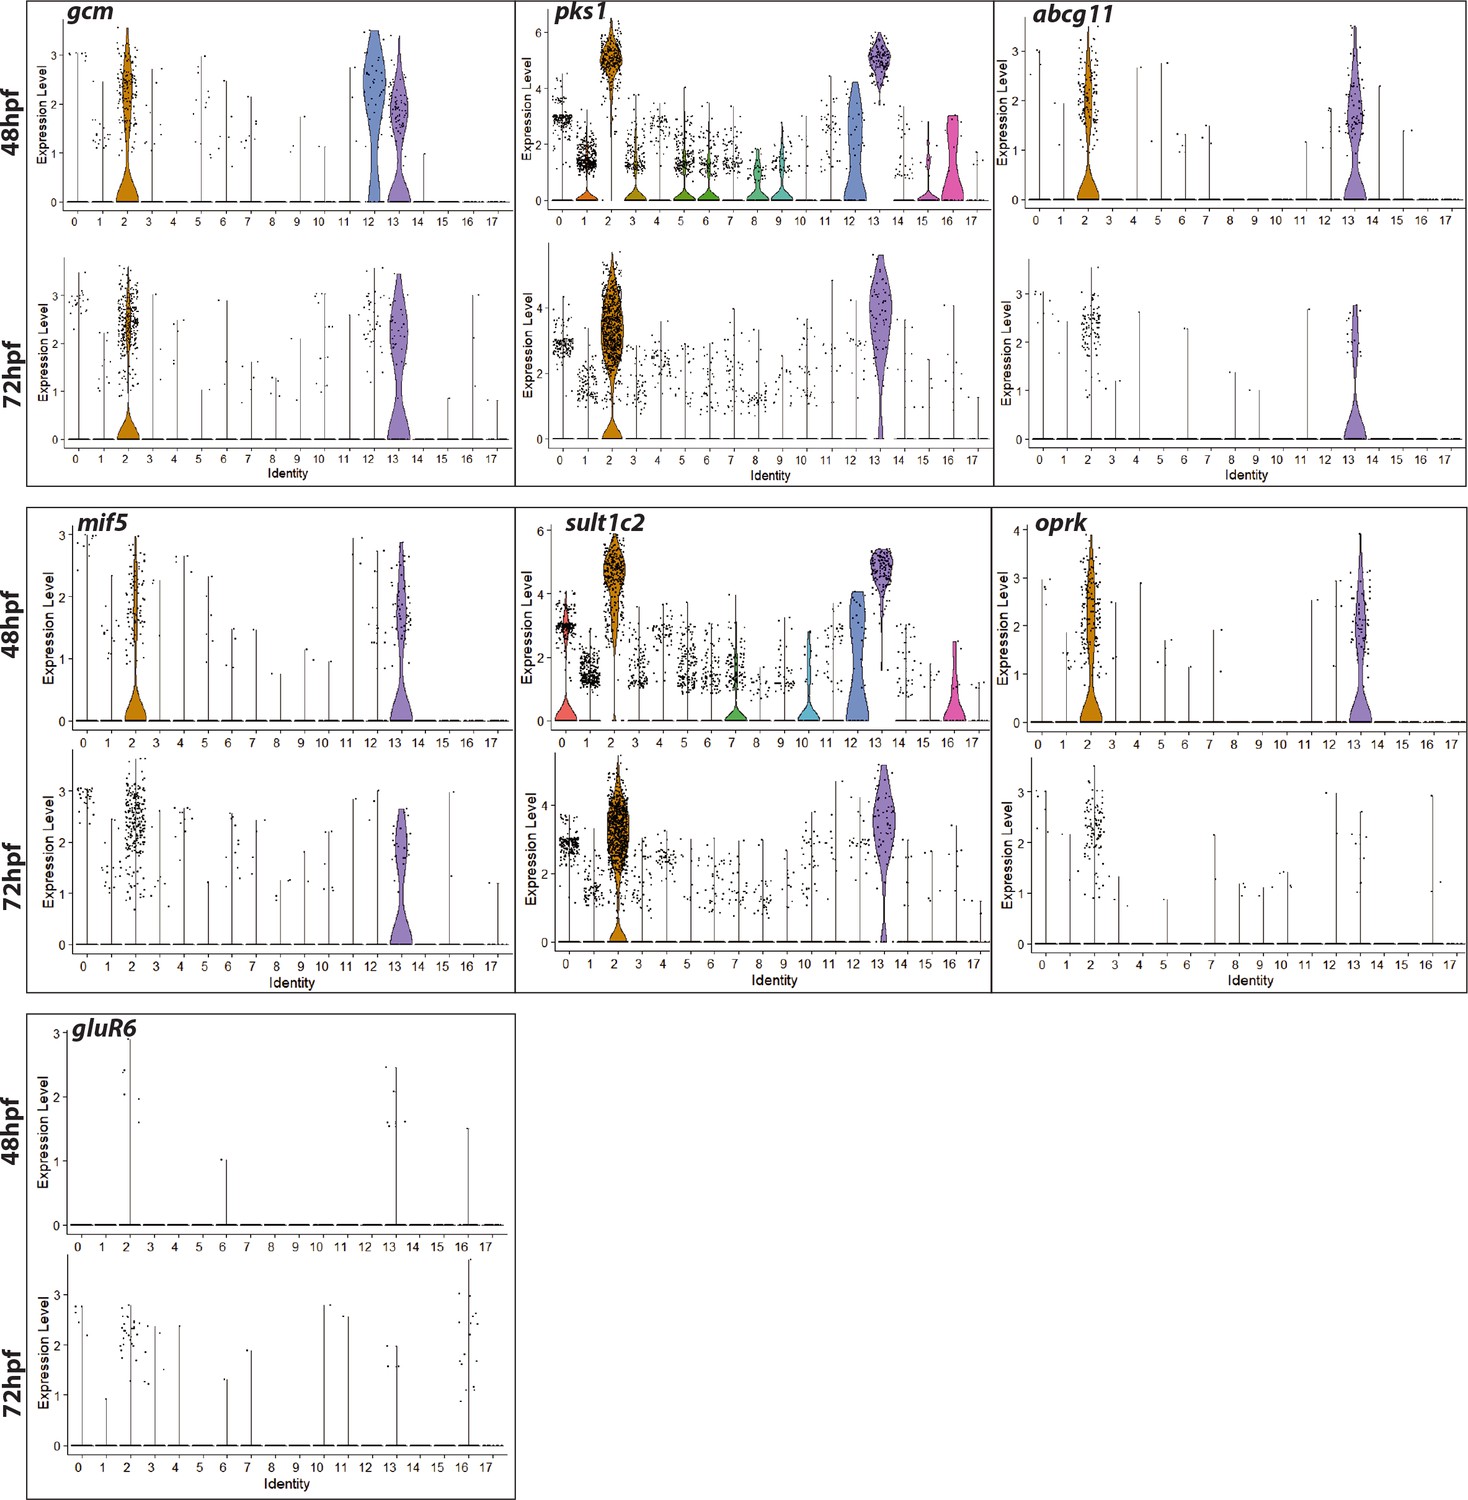
Violin plots showing expression of pigment cell marker genes across different clusters at gastrula and early larval stage.
A violin plot has more information than a box plot. While a box plot shows summary statistics such as mean/median and interquartile ranges, the violin plot shows the full distribution of the data. The difference is particularly useful when the data distribution is multimodal (more than one peak). Normalized gene expression values at log scale shown per cell cluster identity. Plots depict probability density at different expression levels. Each dot represents one cell. Enrichment of pigment cell markers in clusters 2 and 12 show enriched expression of pigment cell marker genes.
Figure 3
Gene expression in the pigment cells revealed by single cell RNAseq.
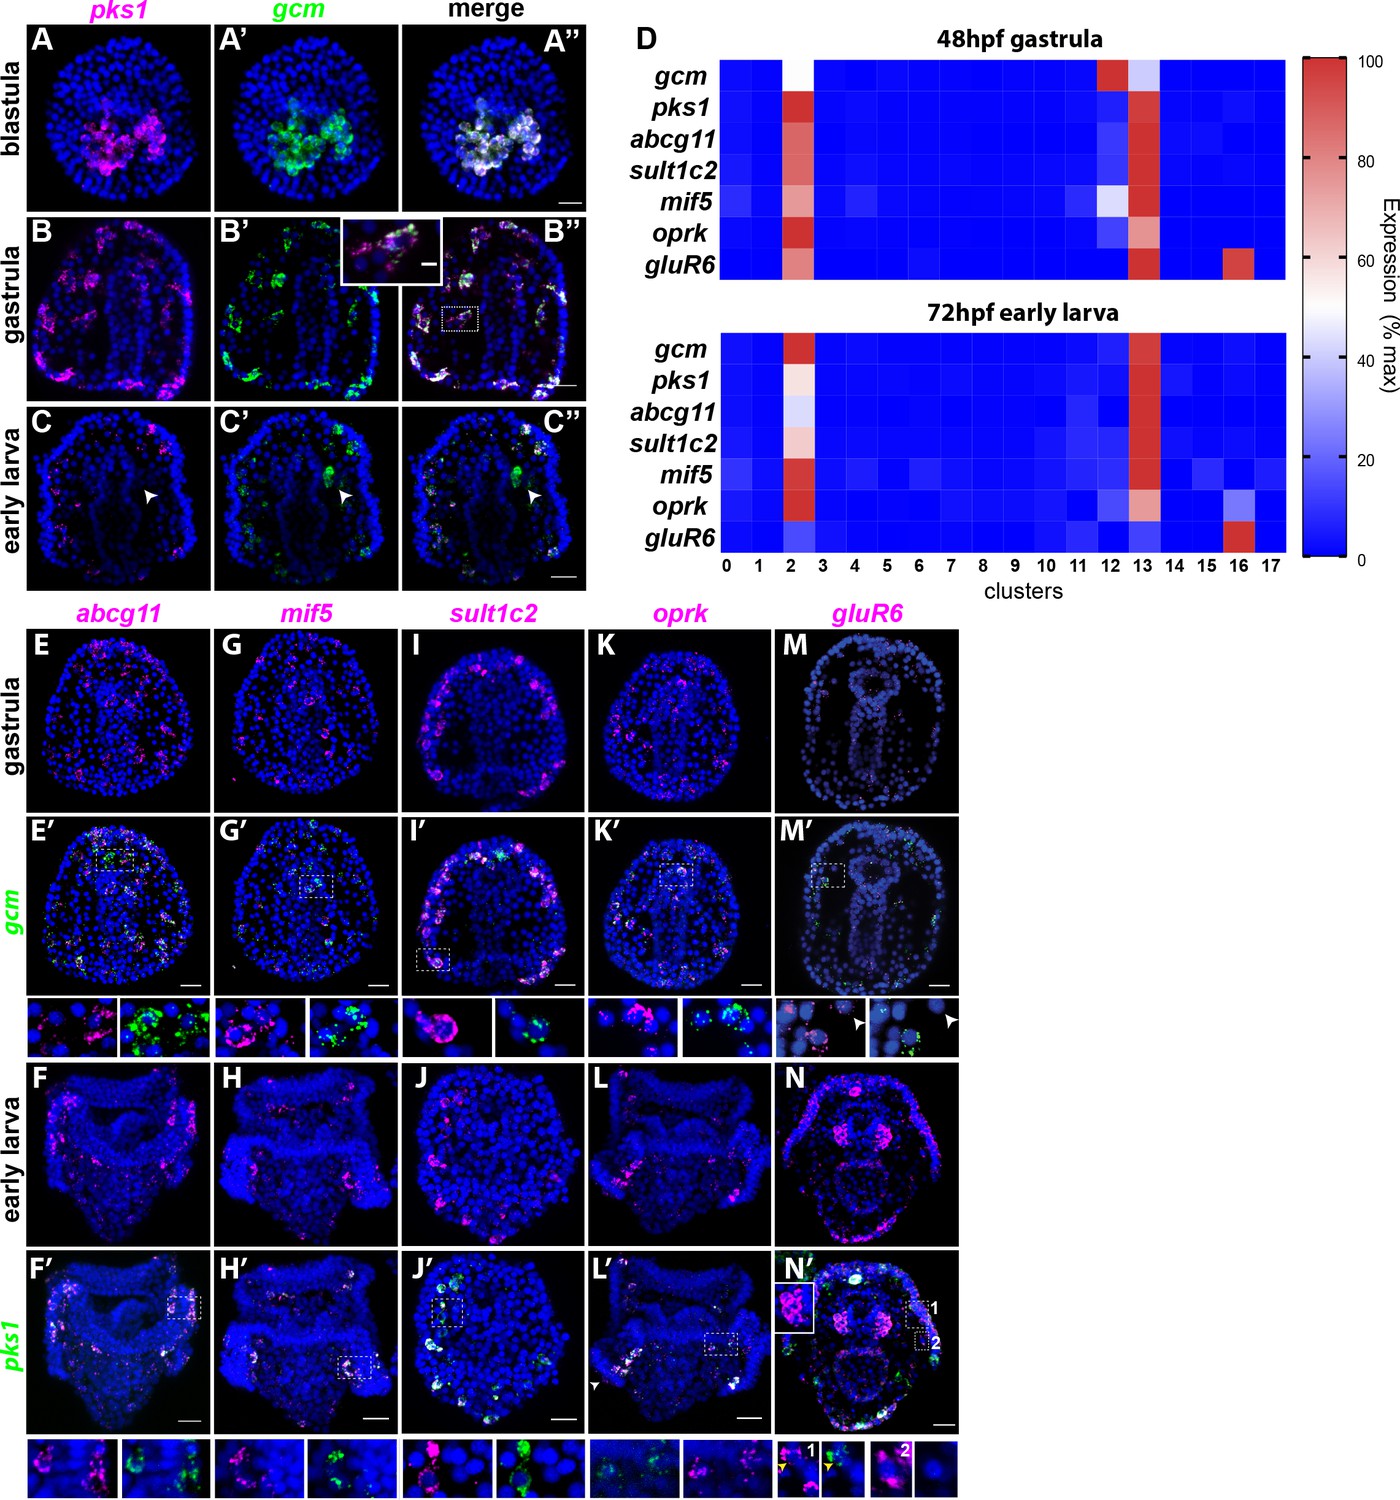
(A–C’’) Double fluorescent in situ hybridization (FISH) of the pigment cell markers gcm and pks1. The pks1 and gcm genes are expressed in the same pigment cells in blastulae and gastrulae. Dashed line box indicates the cell magnified in B’’ showing that mRNA for the two genes is expressed in the same cell. In larvae, gcm is expressed in pigment cells and in the left coelomic pouch (white arrowheads). Nuclei are stained in blue (DAPI). (D) Heat map of pigment genes. At 48hpf, gcm is highly expressed in cluster 12, and the other genes are expressed at intermediate levels. At 72hpf gcm expression in cluster 12 decreased and also the expression of the other pigment genes decreased. GluR6 and oprk are also expressed in cluster 16, ciliary band neurons. (E–N’) Double FISH of identified pigment genes with either gcm or pks1 to mark pigment cells in gastrulae and larvae, respectively. Dashed line boxes indicate cells magnified below each picture. Violin and feature plots for the pigment cell genes are shown in Figure 2—figure supplement 2. (M–M’). GluR6 expression in gastrulae is low. In larvae, gluR6 is expressed in pigment cells (yellow arrowheads in J’ inset 1) and in neurons (cluster 16) that appear to be lateral ganglions (inset 1 and 2 white arrowheads in N’). GluR6 is also expressed in both coelomic pouches (inset in N’). Nuclei are depicted in blue (DAPI). Scale bars 50 μm, inset in B’-B’’ scale bar 20 μm. All images are stacks of merged confocal Z sections.
Figure 4 with 1 supplement
A unique group of fmo genes is specifically expressed in pigment cells.
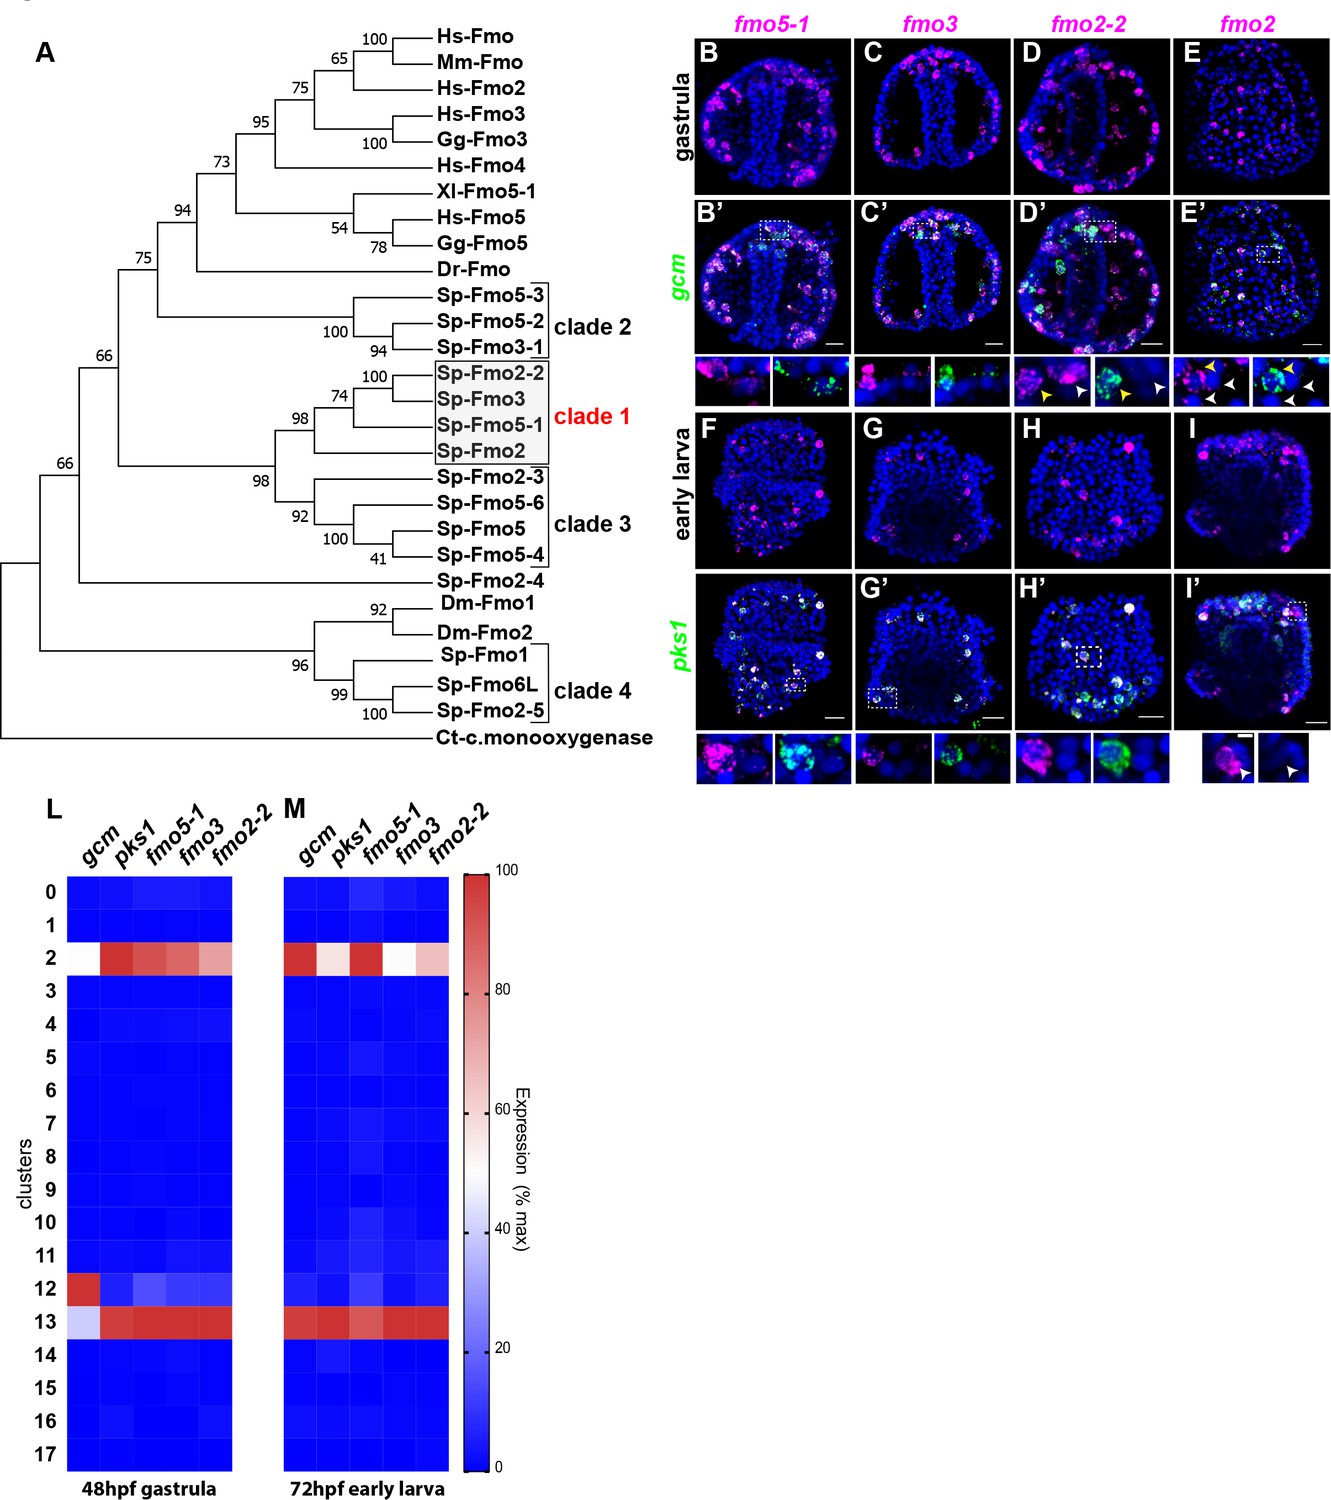
(A) Maximum Likelihood tree showing the relationship of sea urchin flavin-dependent monooxygenases (FMOs) to other FMO proteins. Branches corresponding to partitions reproduced in less than 50% bootstrap replicates (500 replicates) are collapsed. Baeyer–Villiger monooxygenase was used as an outgroup. The same phylogeny was also supported by a maximum parsimony tree. (B–I’) Double FISH of fmos from clade one with gcm or pks1. In the insets, yellow arrowheads indicate co-expression in the pigment cells, white arrowheads indicate cells that are not pigment cells. Dashed line boxes indicate cells magnified below each picture. Nuclei are depicted in blue (DAPI). Scale bars 50 μm in whole embryo images and 20 μm in magnifications. All images are stacks of merged confocal Z sections. (L–M) single cell data show that the fmos of clade one are found in clusters 2 and 13.
Figure 4—figure supplement 1
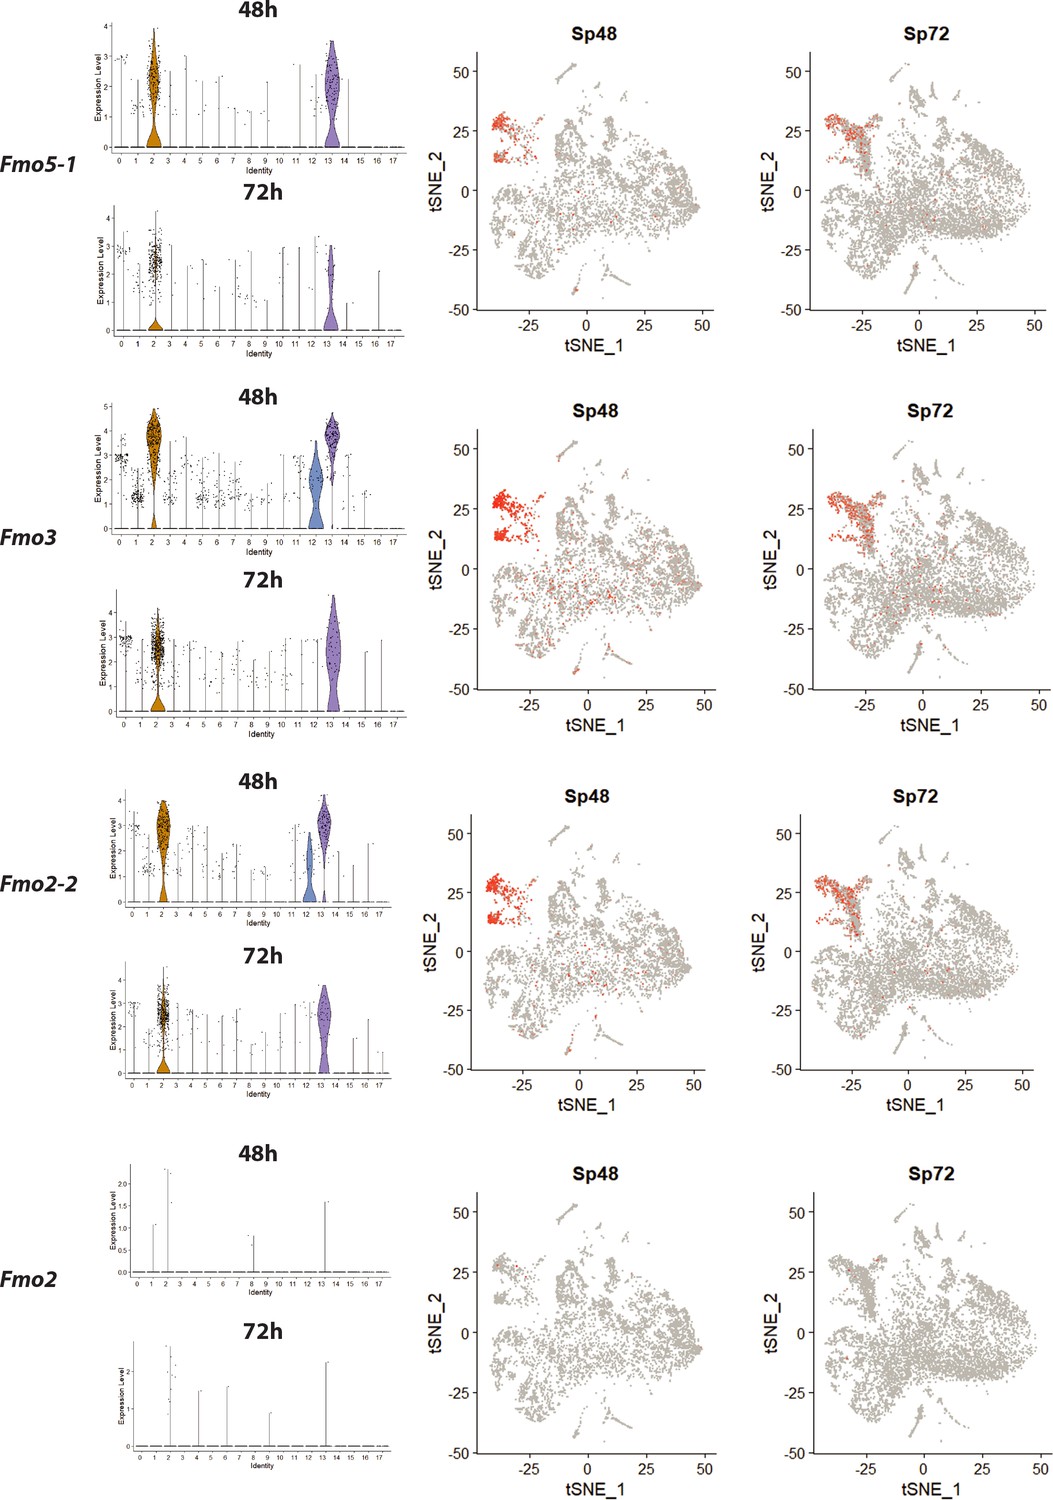
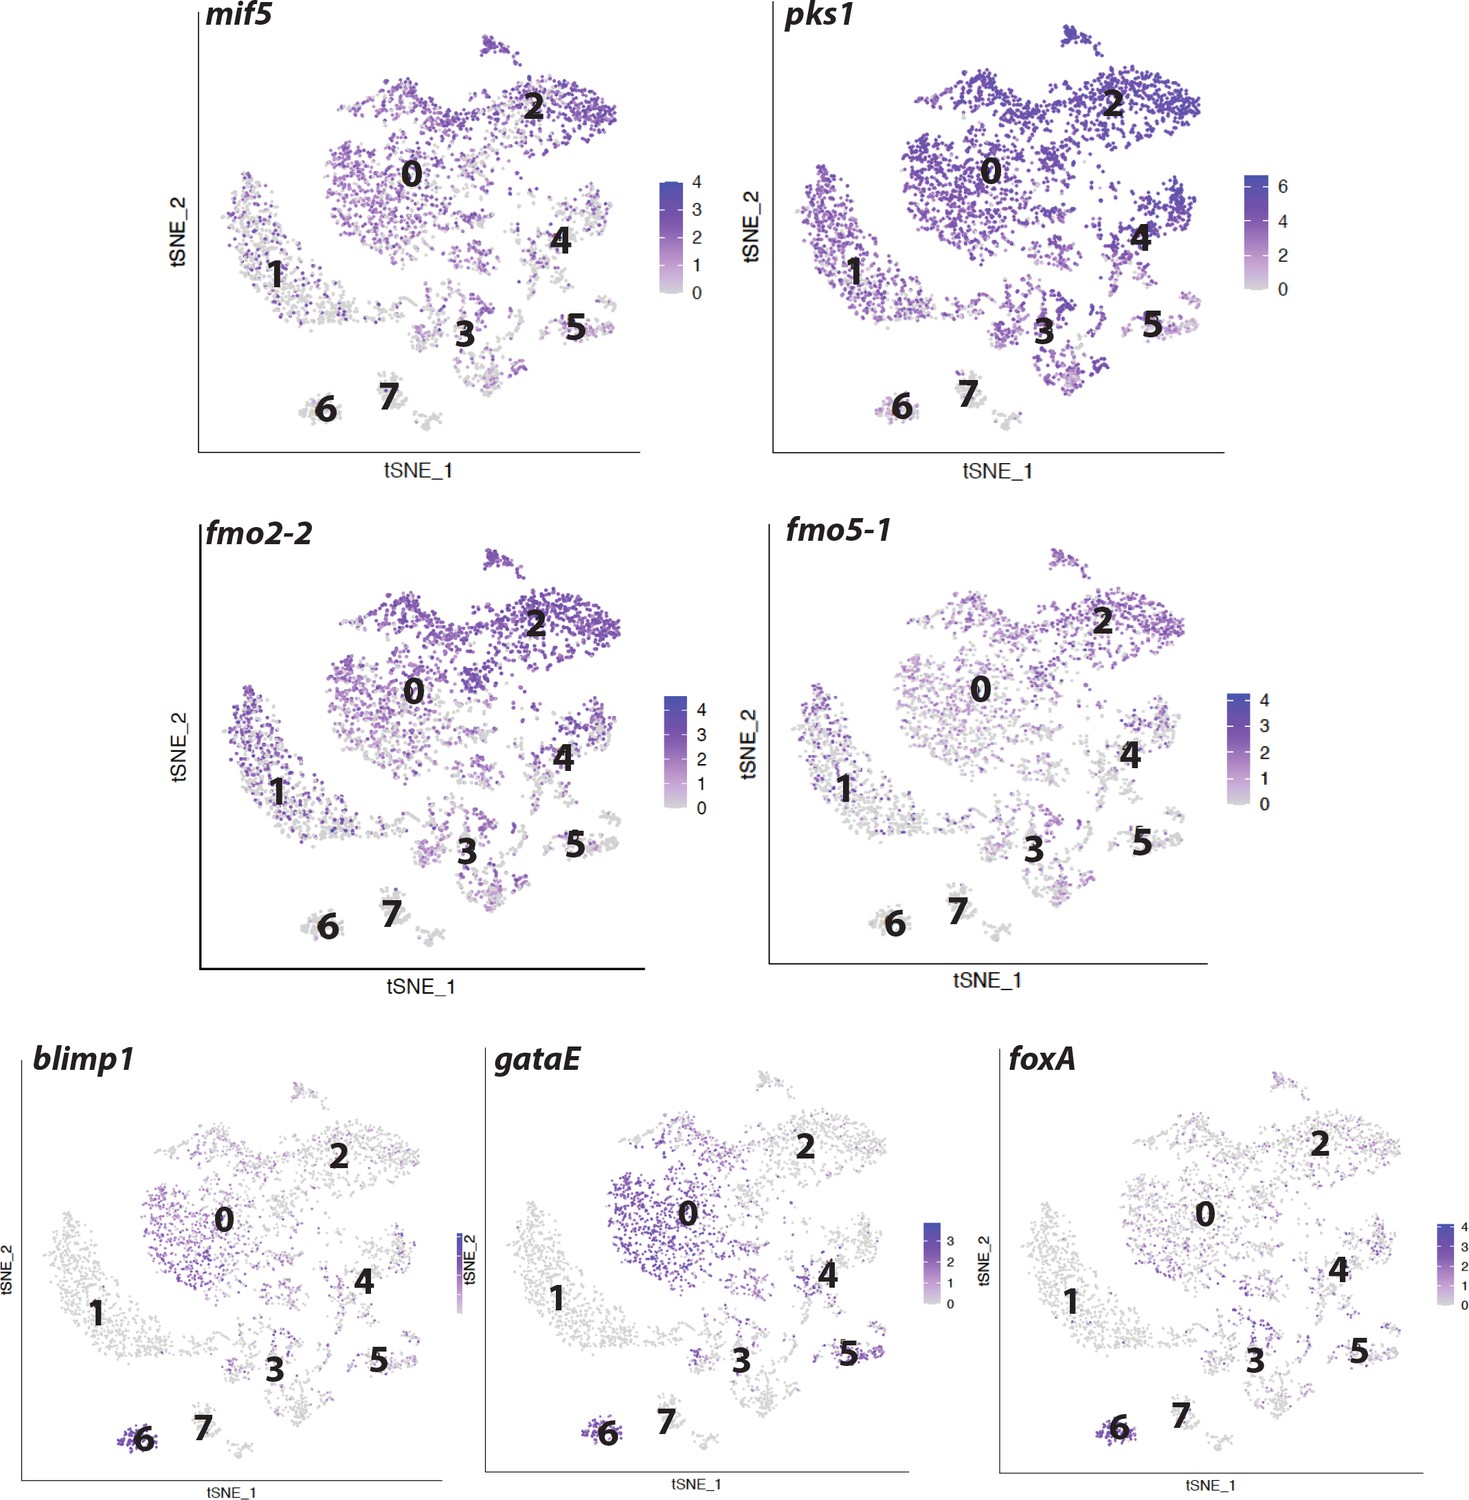
Distribution of fmos in the single cell transcriptome shows high fmo gene expression in cluster 2, 12 and 13.
The same data areshown in the feature plots on the right.
Figure 5 with 1 supplement
Fmos from clade one are expressed in embryonic pigment cells and in adult coelomocytes.
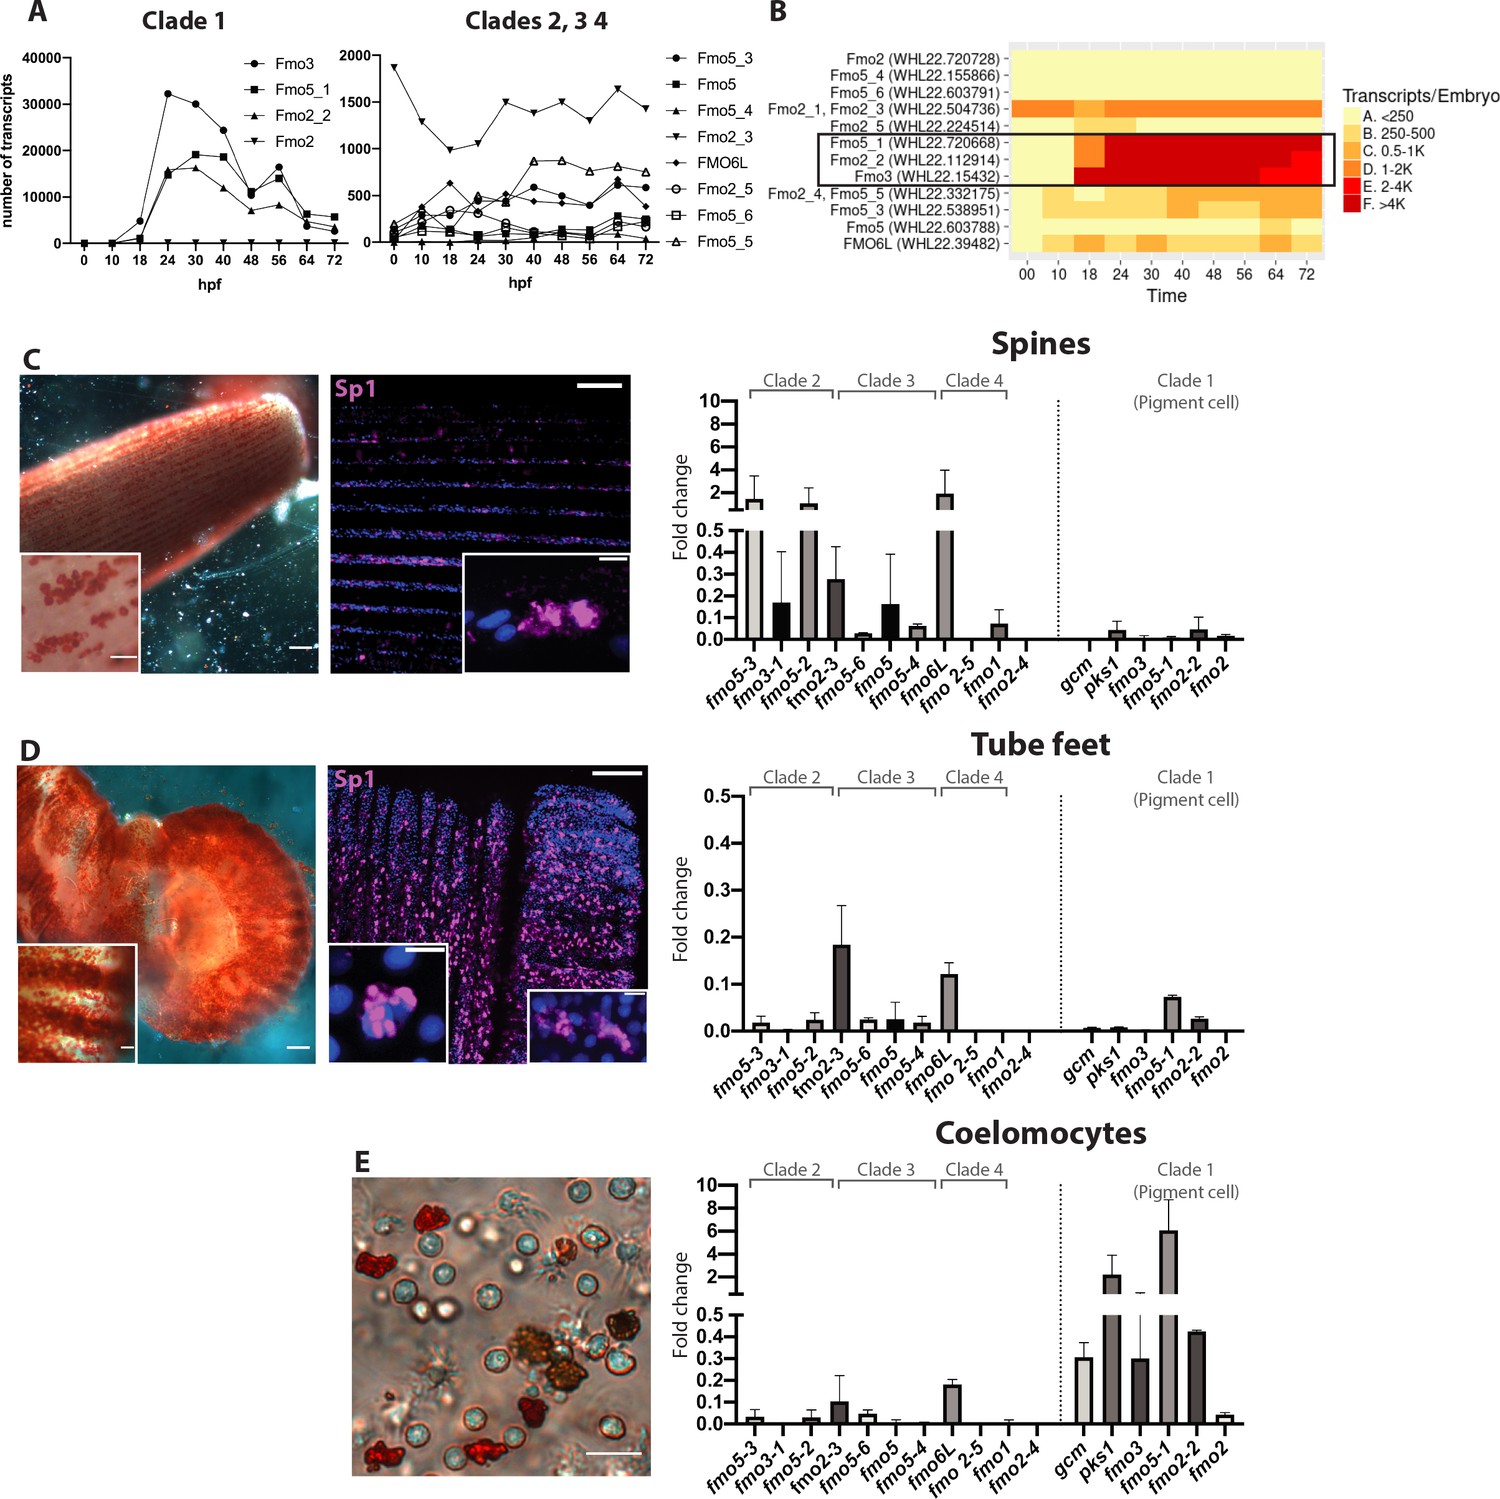
(A, B) Transcripts abundance of the four fmo clades in the embryo, 0 to 72 hr post fertilization (hpf). This graph was made using the online resource http://www.spbase.org:3838/quantdev/. All fmos in clade 1 (fmo5-1, fmo2-2, fmo3, squared box) and fmo2-3 from clade three are expressed in the embryo. A and B represent the same data. (C, D, E) Spine, tube feet and coelomocytes bright field images show red pigmented cells. Scale bars are 100 μm, magnification scale bars 20 μm. Confocal images of spines and tube feet labeled with the pigment cell marker Sp1, showing that adult structures have common features with embryonic pigment cells. Nuclei are in blue (DAPI); scale bar 100 μm and 5 μm for insets. qPCR of fmos in the adult spines (C), tube feet (D) and coelomocytes (E) show that clade one is expressed in coelomocytes. Gcm and pks1 are expressed in the coelomocytes, but not in spines or tube feet. All experiments were repeated in three biological replicates. Fold change = 2^(-Dct). FISH of genes not in clade one is in Figure 5—figure supplement 1.
Figure 5—figure supplement 1

Spatial expression of other fmo genes that are not present in clade 1.
Double FISH of gcm with fmo1 (from clade 4), fmo2-3, and fmo5 (from clade 3) shows that these genes are not exclusively expressed in the pigment cells (marked by gcm), but rather broadly expressed. Nuclei are depicted in blue (DAPI). All images are stacks of merged confocal Z sections. Scale bar 20 μm.
Figure 6 with 4 supplements
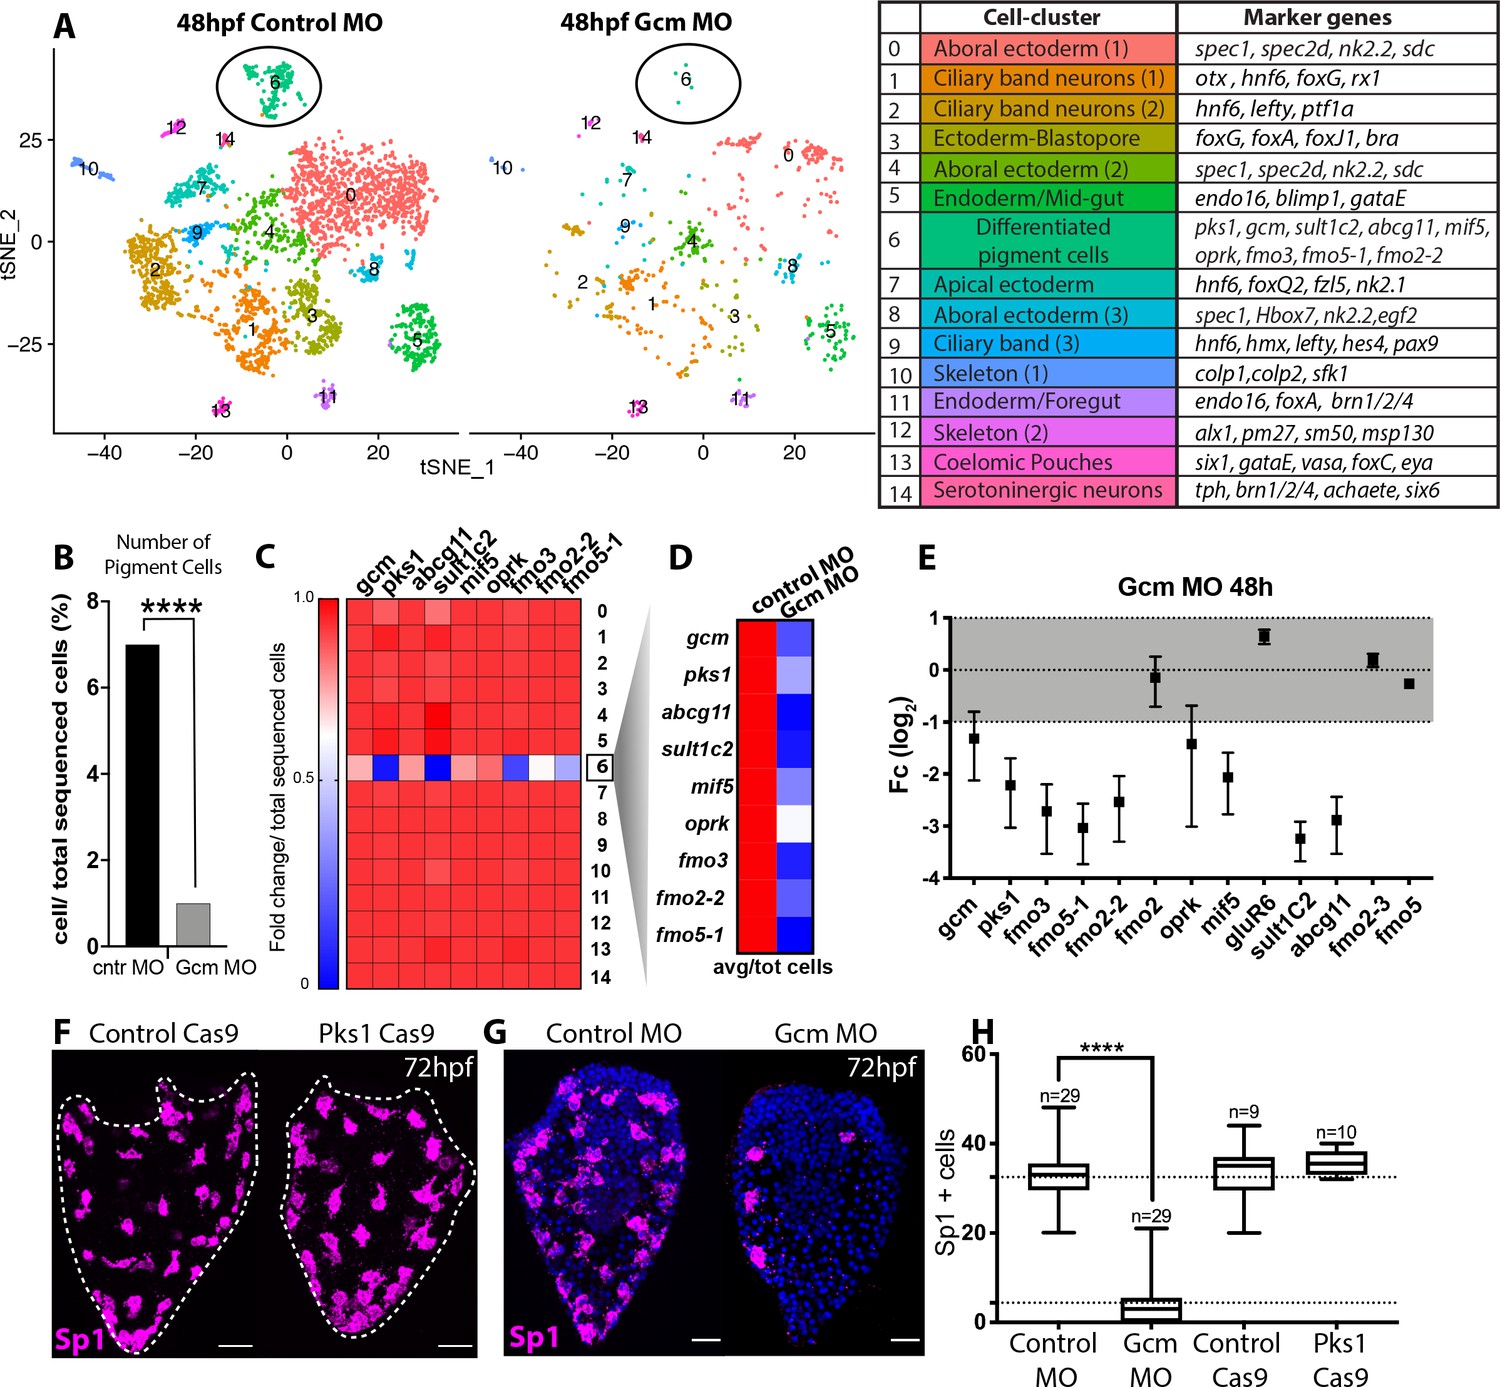
Gcm controls pigment cell specification.
(A) Global visualization of single cell profiled in control MO and gcm MO gastrulae. tSNE plots show that in controls and morphants there is no change in general cluster organization. Pigment cell cluster is number 6, green. The table summarizes the main cell-types and relative marker genes, colors represent clusters in the tSNE plots. In the 48hpf control morpholino injected sample, 3402 single cells were captured for downstream analysis, sequenced at a level of 56,550 reads per cell. The 48hpf gcm morpholino sample includes 643 single cells with an average of 379,895 reads per cell. The two samples were integrated to identify conserved cell types and cluster marker genes using Seurat. Feature and violin plot of pigment cell genes in controls and gcm depleted embryos are shown in Figure 6—figure supplement 2 and Figure 6—figure supplement 3. (B) Percentage of Pigment Cells relative to total sequenced cells in control MO versus gcm MO experiments, two-sided Chi-square and Fisher’s exact test gave p<0.001 (****); Chi-square df 31,35, 1, z 5.599. A graph with percentage of cells relative to total sequenced cells for each cluster is shown in Figure 6—figure supplement 1. (C) Expression of pigment genes in gcm MO (Fold change, Fc) compared to control MO normalized by number of total sequenced cells in each experiment (average LogFc*number of cells in each cluster/total sequenced cells in each experiment). (D) Expression levels of pigment genes normalized for the total sequenced cells shows that there is an overall decrease in gene expression in the pigment gene clusters. (E) qPCR of pigment genes in gcm MO gastrulae. Experiments were performed in three biological replicates (error bars). (F) Sp1 Ab staining of 72hpf larvae depleted of pks1 by CRISPR Cas9 shows that distribution of pigment cells does not change. A qPCR of pigment genes in control and pks1 depleted embryos is shown in Figure 6—figure supplement 4. (G) Sp1 Ab staining in gcm MO early larva (72hpf). Nuclei are stained with DAPI. (H) Number of Sp1 positive cells decreases in gcm MO compared to controls (n = number of larvae, two-tailed student t-test p<0.001 (****) corresponds to p=1,44704E-17; 95% confidence interval of −31,07 to −25,21), (mean for control MO is 35,51; mean for gcm MO is 4.37), and it is unchanged in pks1 Cas9 (two-tailed student t-test p value 0,4191; 95% confidence interval of −3,326 to 7,393; mean of control Cas9 is 33,67, mean of pks1 Cas9 is 35,70). Additional file in Figure 6—source data 1. Images are confocal Z-projections, scale bar 50 μm.
-
Figure 6—source data 1
Number of Sp1+ cells in gcm MO, control MO, pks1 Cas9 and Cas9 controls.
- https://cdn.elifesciences.org/articles/60388/elife-60388-fig6-data1-v3.xlsx
Figure 6—figure supplement 1
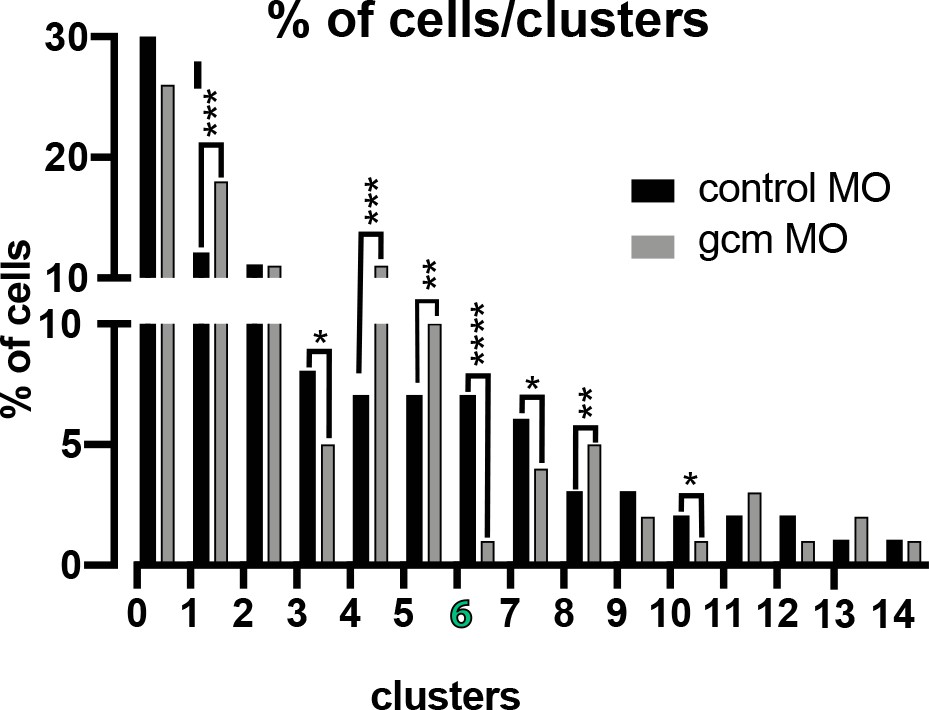
Number of cells in each cluster in control embryos versus embryos depleted of Gcm.
Number of cells in each cluster are normalized to the total sequenced cells in each experimental condition. Number of cells in cluster 6 (pigment cells) goes significantly down. Significance was assessed by X2 test (****p<0.001). Additional file, Figure 6—figure supplement 1—source data 1.
-
Figure 6—figure supplement 1—source data 1
Distribution of pigment genes in single cell transcriptomes of control and gcm depleted embryos.
- https://cdn.elifesciences.org/articles/60388/elife-60388-fig6-figsupp1-data1-v3.xlsx
Figure 6—figure supplement 2
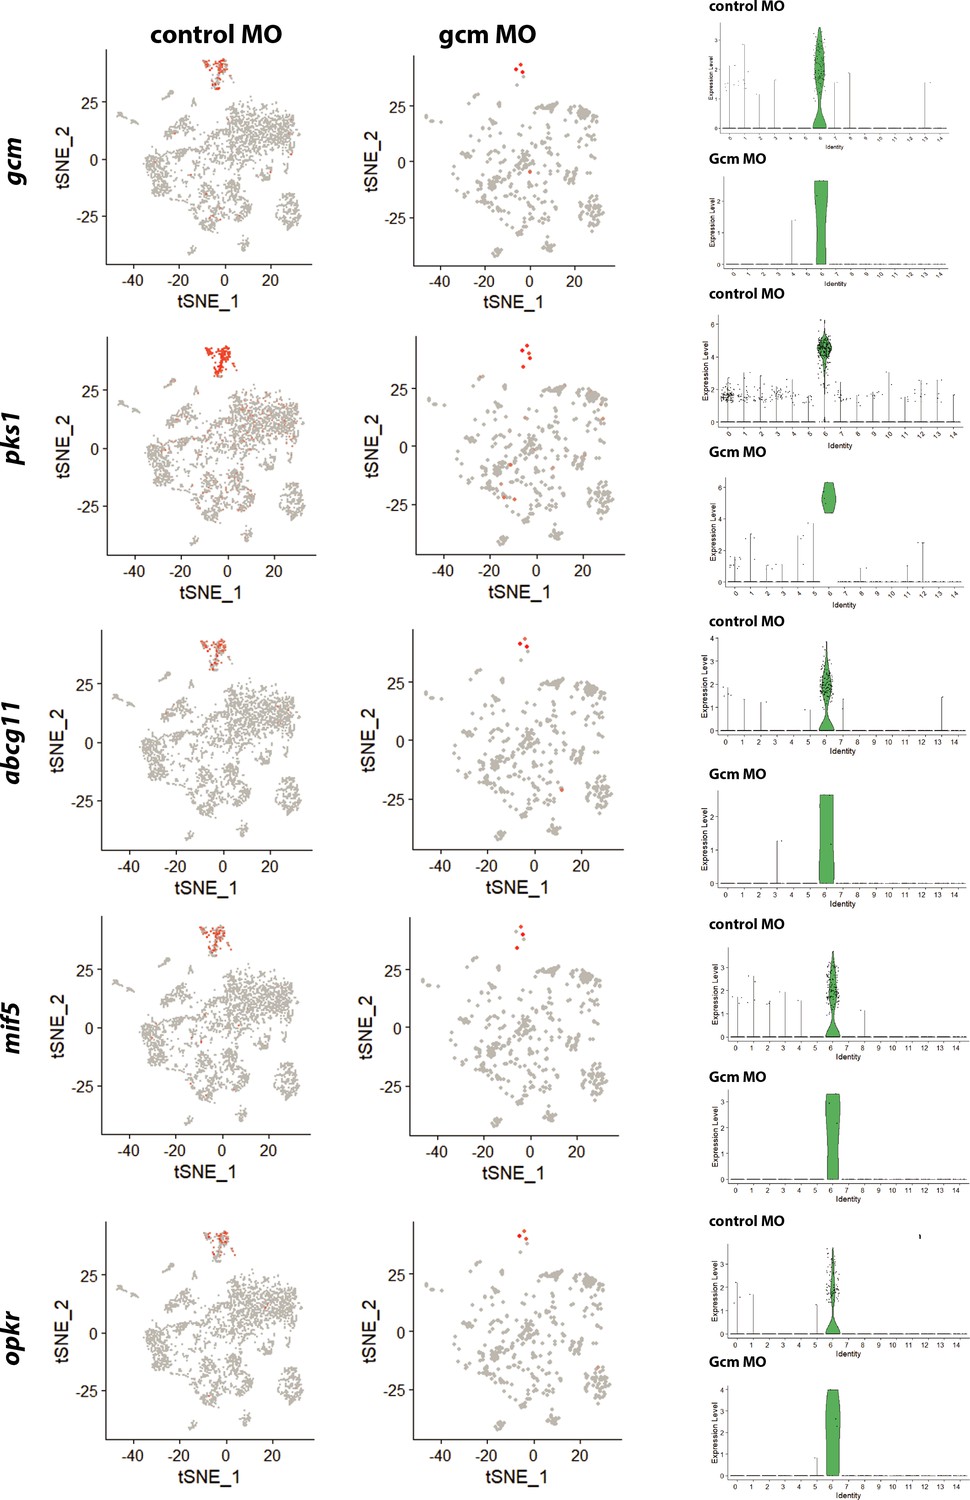
Distribution of pigment genes in single cell transcriptomes of control and gcm depleted embryos.
Data for each gene are shown with a feature plot that provides a clear overview of single cells expressing that unique transcript in the context of all other clusters (left), and violin plot that clearly shows the expression levels of that specific transcript for each cluster (right).
Figure 6—figure supplement 3
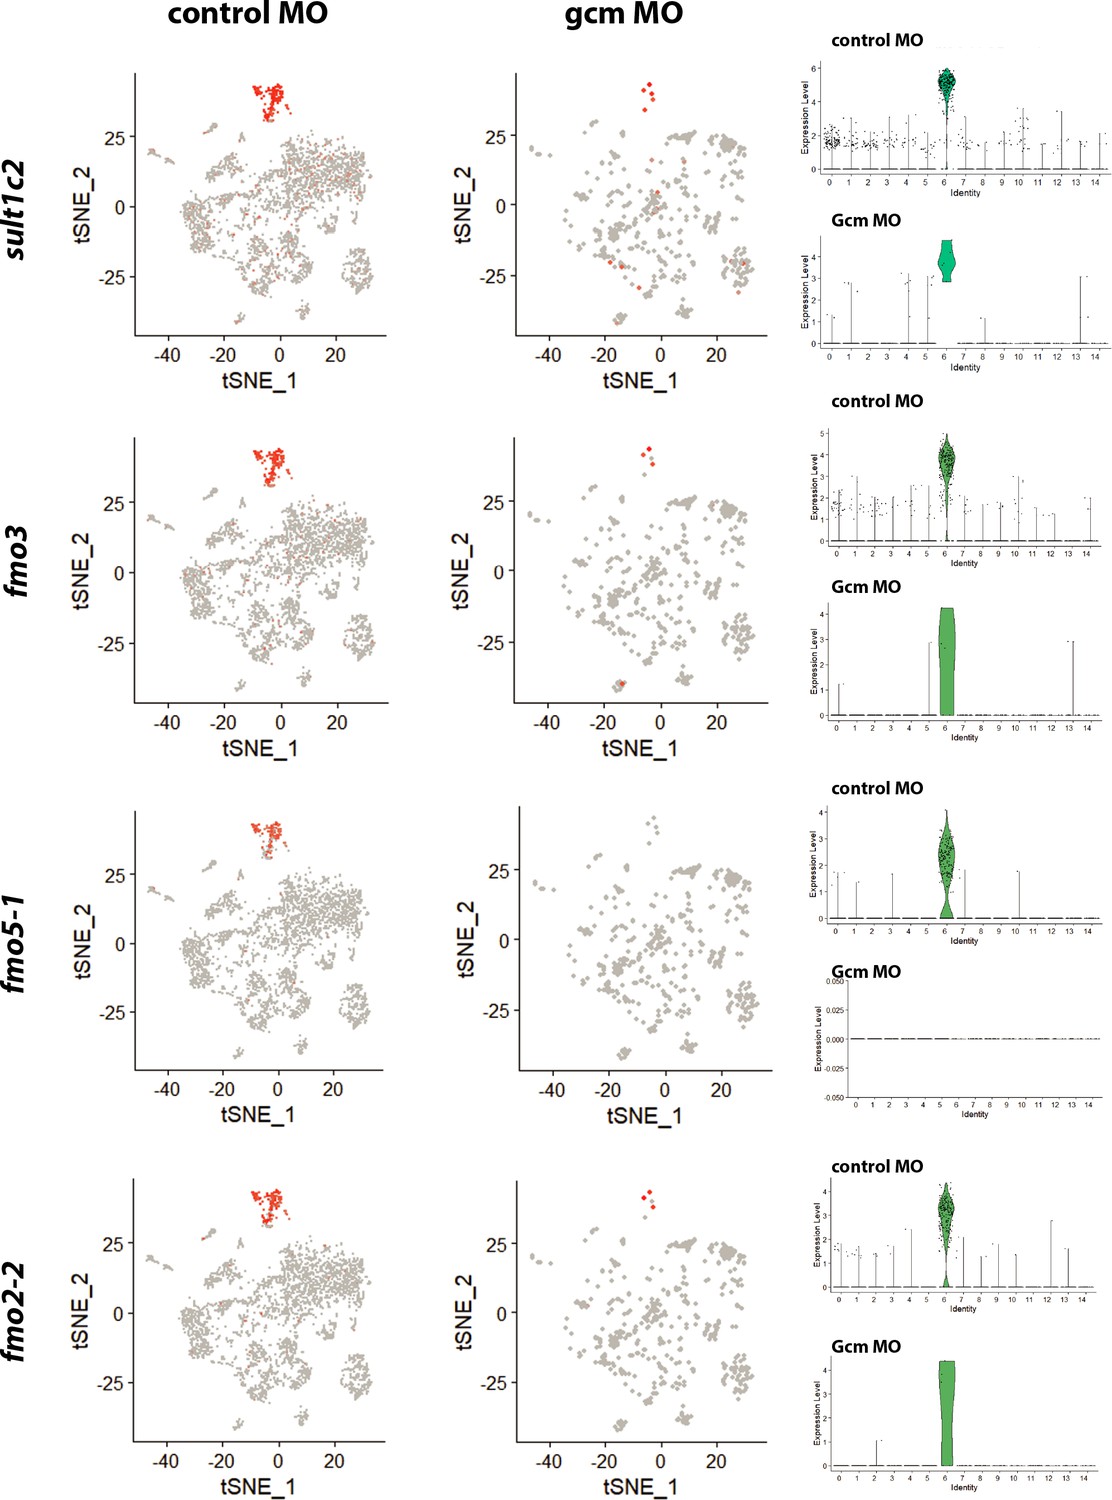
Distribution of pigment genes in single cell transcriptomes of control and gcm depleted embryos.
Figure 6—figure supplement 4
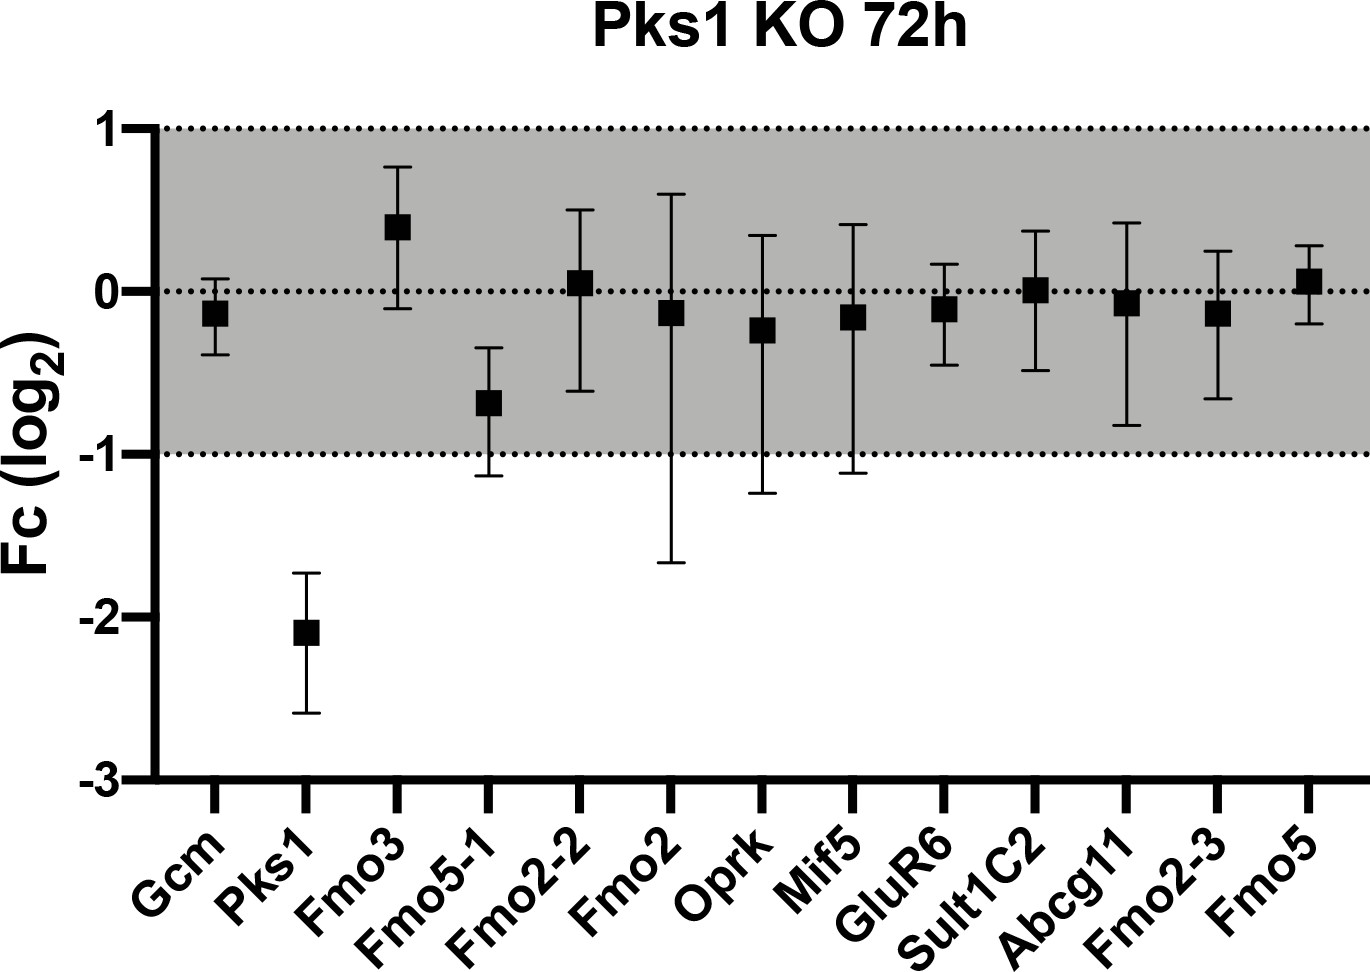
Gene expression of candidate genes in pks1- larvae is indistinguishable from controls.
qPCR of pigment genes in pks1Cas9 knock out embryos. Note that pks1 gene expression goes down, confirming the gene was knocked out. The graph represents three biological replicae (error bar).
Figure 7
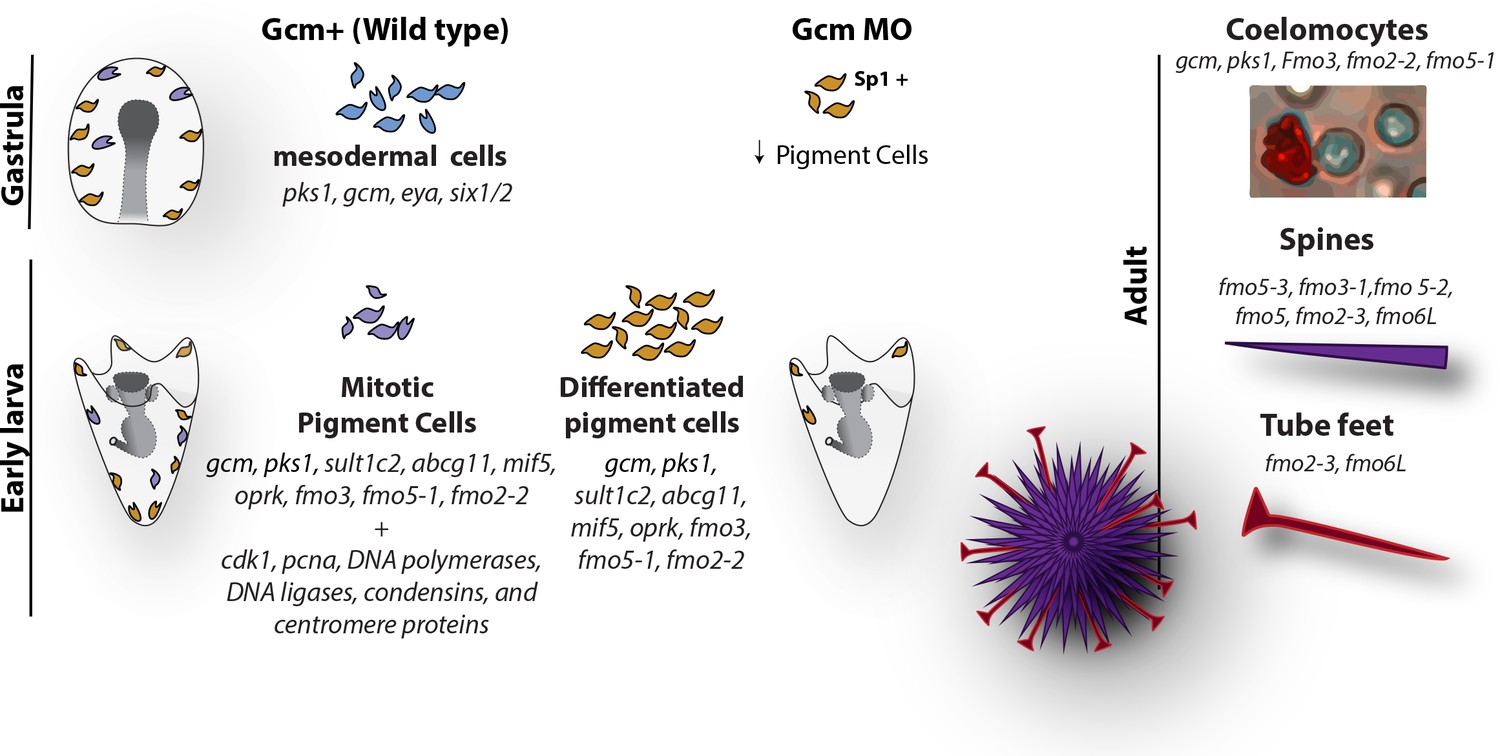
Diagram summarizing the fate of pigment cells in wild type and gcm MO embryos.
In wild type embryos there are 3 subpopulations of cells expressing gcm: mesodermal cells not yet differentiated, differentiated pigment cells and mitotic pigment cells. Colors are derived from the clusters of Figure 1. Larvae have both differentiated and mitotic pigment cells. In embryos where gcm is depleted there are fewer pigment cells. Adult sea urchins express different levels of fmo genes in their pigmented structures. Fmos that are expressed in the embryonic pigment cells are also expressed in the adult red spherule cells, both groups of cells having immune functions.
Tables
Key resources table
| Reagent type (species) or resource | Designation | Source or reference | Identifiers | Additional information |
|---|---|---|---|---|
| Gene (Strongylocentrotus purpuratus) | gcm | Echinobase | SPU_006462 | |
| Gene (Strongylocentrotus purpuratus) | pks1 | Echinobase | SPU_002895 | |
| Gene (Strongylocentrotus purpuratus) | fmo2 | Echinobase | SPU_002963 | |
| Gene (Strongylocentrotus purpuratus) | fmo3 | Echinobase | SPU_017374 | |
| Gene (Strongylocentrotus purpuratus) | fmo2-2 | Echinobase | SPU_014947 | |
| Gene (Strongylocentrotus purpuratus) | fmo5-1 | Echinobase | SPU_012348 | |
| Gene (Strongylocentrotus purpuratus) | sult1c2 | Echinobase | SPU_006187 | |
| Gene (Strongylocentrotus purpuratus) | oprk1c | Echinobase | SPU_000719 | |
| Gene (Strongylocentrotus purpuratus) | mif5 | Echinobase | SPU_020036 | |
| Gene (Strongylocentrotus purpuratus) | glur6 | Echinobase | SPU_028455 | |
| Gene (Strongylocentrotus purpuratus) | abcg11 | Echinobase | SPU_020849 | |
| Antibody | anti-Sp1 (mouse monoclonal) | DSHB | Cat# Sp1, RRID:SCR_013527 | IF(1:50) |
| Sequenced-based reagent | control MO; control morpholino | Gene Tools | 5’-GCTTTGGAGTAACCTTCTGCACCAT-3’ (0.5 mM) | |
| Sequenced-based reagent | gcm MO; gcm morpholino | Gene Tools | 5’-GCTTTGGAGTAACCTTCTGCACCAT-3’ (0.5 mM) | |
| Software, algorithm | Image J | Image J | RRID:SCR_003070 | |
| Software, algorithm | Seurat v 3.1.4 | SEURAT | SEURAT, RRID:SCR_007322 | |
| Other | DAPI stain | Invitrogen | D1306 | (1 µg/mL) |
Additional files
-
Supplementary file 1
Example of cluster 12 comparisons to clusters 13 at 48 hr (12 vs 13 at 48 hr) and at 72 hr (12 vs 13 at 72 hr) shows that three pigment cell genes (pks1, sult1c2, fmo5) are less expressed in cluster 12 than 13.
- https://cdn.elifesciences.org/articles/60388/elife-60388-supp1-v3.xlsx
-
Supplementary file 2
Comparisons of clusters 2 versus 13.
Negative values indicate genes enriched in cluster 13 compared to cluster 2.
- https://cdn.elifesciences.org/articles/60388/elife-60388-supp2-v3.xlsx
-
Supplementary file 3
List of primers used for in situ hybridization probes.
- https://cdn.elifesciences.org/articles/60388/elife-60388-supp3-v3.xlsx
-
Supplementary file 4
List of primers used for qPCRs.
- https://cdn.elifesciences.org/articles/60388/elife-60388-supp4-v3.xlsx
-
Transparent reporting form
- https://cdn.elifesciences.org/articles/60388/elife-60388-transrepform-v3.pdf
Download links
A two-part list of links to download the article, or parts of the article, in various formats.
Downloads (link to download the article as PDF)
Open citations (links to open the citations from this article in various online reference manager services)
Cite this article (links to download the citations from this article in formats compatible with various reference manager tools)
Regulation of dynamic pigment cell states at single-cell resolution
eLife 9:e60388.
https://doi.org/10.7554/eLife.60388


