Cortical encoding of acoustic and linguistic rhythms in spoken narratives
- Key Laboratory for Biomedical Engineering of Ministry of Education, College of Biomedical Engineering and Instrument Sciences, Zhejiang University, China
- Research Center for Advanced Artificial Intelligence Theory, Zhejiang Lab, China
Figures
Figure 1

Stimulus.
(A and B) Two types of stories are constructed: metrical stories and nonmetrical stories. (A) Metrical stories are composed of disyllabic words and pairs of monosyllabic words, so that the odd terms in the syllable sequence (referred to as σ1) must be the onset of a word. Here the onset syllable of each word is shown in bold. All syllables are presented at a constant rate of 4 Hz. A 500 ms gap is inserted at the position of any punctuation. The red curve illustrates cortical activity synchronous to word onsets, and it shows a 2-Hz rhythm, which can be clearly observed in the spectrum shown on the right. The stories are in Chinese and English examples are shown for illustrative purposes. (B) In the nonmetrical stories, word onsets are not regularly positioned, and activity that is synchronous to word onsets does not show 2-Hz rhythmicity. (C) Natural speech. The stories are naturally read by a human speaker and the duration of syllables is not controlled. (D) Amplitude-modulated isochronous speech is constructed by amplifying either σ1 or σ2 by a factor of 4, creating a 2-Hz amplitude modulation. The red and blue curves illustrate responses that are synchronous to word onsets and amplified syllables, respectively. The response synchronous to word onsets is identical for σ1- and σ2-amplified speech, that is, the phase difference was 0° at 2 Hz. In contrast, the response synchronous to amplified syllables is offset by 250 ms between conditions, that is, the phase difference was 180° at 2 Hz.
Figure 2 with 1 supplement

Electroencephalogram (EEG) response spectrum.
Response spectrum is averaged over participants and EEG electrodes. The shaded area indicates one standard error of the mean (SEM) across participants. Stars indicate significantly higher power at 2 or 4 Hz than the power averaged over four neighboring frequency bins (two on each side). *p<0.05, **p<0.001 (bootstrap, false discovery rate [FDR] corrected). The color of the star is the same as the color of the spectrum. The topography on the top of each plot shows the distribution of response power at 2 Hz and 4 Hz. The five black dots in the topography indicate the position of electrodes FCz, Fz, Cz, FC3, and FC4. (A–D) Response spectrum for isochronous speech and amplitude-modulated speech during two tasks. To facilitate the comparison between stimuli, the red curves in panels A and C are repeated in panels B and D, respectively. (E) Response spectrum when the participants listen to natural speech. In this analysis, the response to natural speech is time warped to simulate the response to isochronous speech, and then transformed into the frequency-domain.
-
Figure 2—source data 1
Preprocessed electroencephalogram (EEG) data recorded in Experiments 1–3.
- https://cdn.elifesciences.org/articles/60433/elife-60433-fig2-data1-v2.mat
Figure 2—figure supplement 1
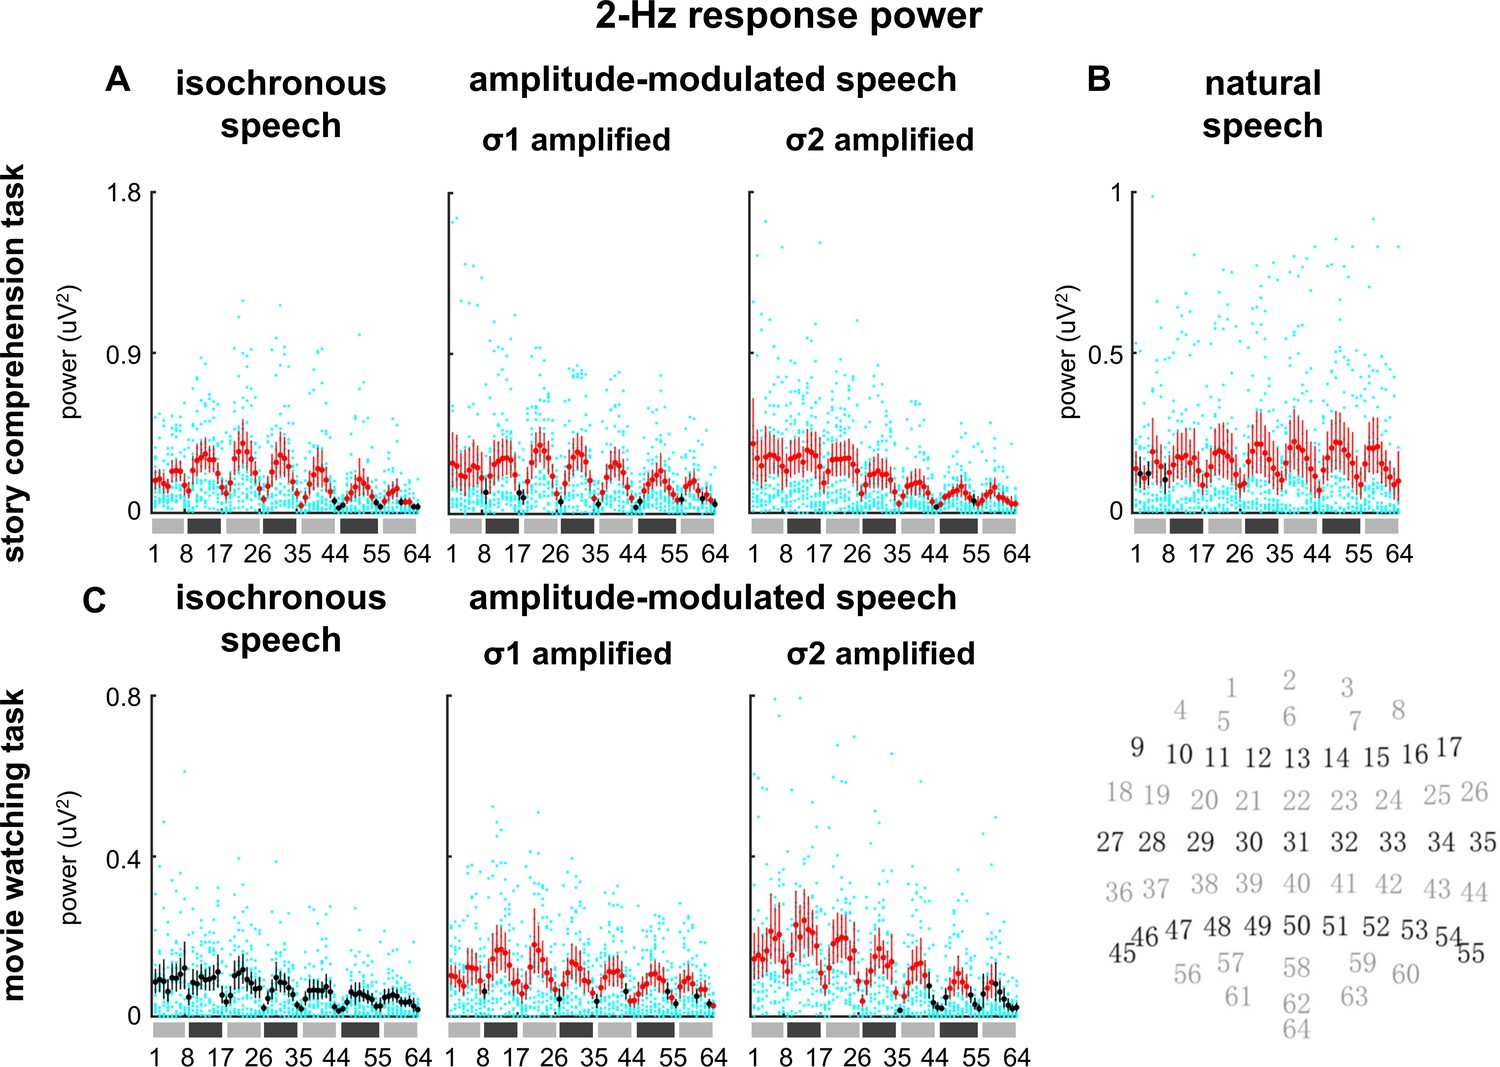
2-Hz response power in individual electroencephalogram (EEG) electrodes and individual participants.
The x-axis is the EEG electrodes and the electrode index, from 1 to 64, which goes from left to right. The approximate scalp position of each electrode is shown at the bottom right corner. Individual results are shown as cyan dots. For each EEG electrode, the 2-Hz power averaged over participants is shown by a red or black dot, and the 95% confidence interval across participants is shown by a vertical bar. The dot and bar are red if the 2-Hz power is significantly stronger than the power averaged over four neighboring frequency bins (p<0.05, bootstrap, false discovery rate [FDR] corrected) and black otherwise.
Figure 3 with 1 supplement

Response power and phase.
(A and B) Response power at 2 and 4 Hz. Color of the bars indicates the stimulus. Black stars indicate significant differences between different types of speech stimuli while red stars indicate significant differences between tasks. *p<0.05, **p<0.01 (bootstrap, false discovery rate [FDR] corrected). Throughout the manuscript, in all bar graphs of response power, the response power at a target frequency is subtracted by the power averaged over four neighboring frequency bins (two on each side) to reduce the influence of background neural activity. (C) The difference in 2-Hz response phase between the σ1- and σ2-amplified conditions at 2 Hz. The phase difference is averaged across participants, and the polar histogram shows the distribution of phase difference across 64 electrodes.
-
Figure 3—source data 1
Preprocessed EEG data recorded in Experiment 1-3.
- https://cdn.elifesciences.org/articles/60433/elife-60433-fig3-data1-v2.mat
Figure 3—figure supplement 1
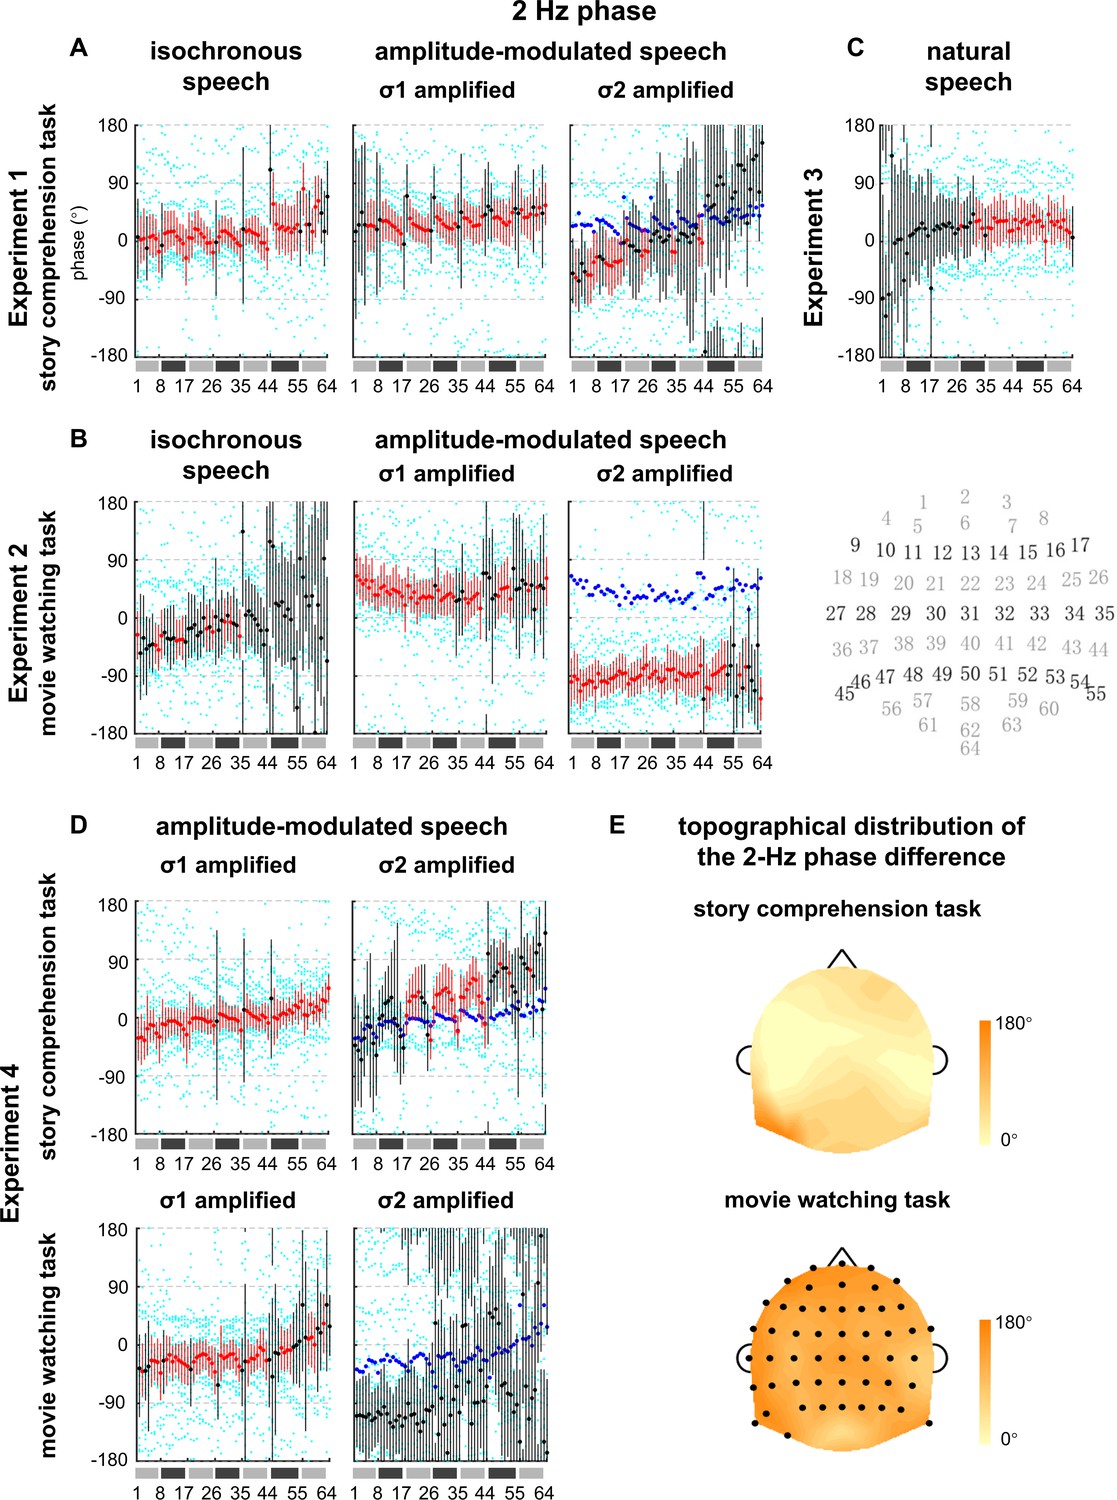
2-Hz response phase in individual electroencephalogram (EEG) electrodes.
The x-axis is the EEG electrode index, from 1 to 64, which goes from left to right. The approximate scalp position of each electrode is shown at the central right corner. Individual results are shown as cyan dots. For each EEG electrode, the 2-Hz phase averaged over participants is shown by a red or black dot, and the 95% confidence interval across participants is shown by a vertical bar. The dot and bar are red if the inter-participant phase coherence is significantly higher than chance (p<0.05, see Materials and methods, false discovery rate [FDR] corrected) and black otherwise. To facilitate the comparison between the σ1- and σ2-amplified conditions, the mean phase in the σ1-amplified condition is repeated in the plot for the σ2-amplified condition as blue dots. (A–D) 2-Hz response phase for Experiments 1–4. The inter-participant phase coherence shows different patterns between the σ1- and σ2-amplified conditions during the story comprehension task. (E) Topographical distribution of the 2-Hz phase difference between the σ1- and σ2-amplified conditions. The phase difference is calculated for each participant and each electrode, and then averaged over participants. The black dots indicate the electrodes showing a significant phase difference between the σ1- and σ2-amplified conditions (p<0.05, bootstrap, false discovery rate [FDR] corrected).
Figure 4

Word and amplitude modulation (AM) responses to amplitude-modulated speech.
(A–D) Neural responses in σ1- and σ2-amplified conditions are aligned based on either word onsets (AB) or amplified syllables (CD), and averaged to extract the 2-Hz response synchronous to words or AM, respectively. Panels A and C illustrate the procedure. The red and blue curves illustrate the response components synchronous to word onsets and the AM respectively, which are mixed in the electroencephalogram (EEG) measurement and shown separately for illustrative purposes. The spectrum and topography in panels B and D are shown the same way as they are shown in Figure 2. *p<0.05, **p<0.001 (bootstrap, false discovery rate [FDR] corrected). (E) Response power at 2 Hz. Black stars indicate significant differences between the word and AM responses, while red stars indicate a significant difference between tasks. *p<0.05, **p<0.01 (bootstrap, FDR corrected). (F) The left panel shows the power difference between the word and AM responses in single electrodes. The right panel shows the difference in normalized topography, that is, topography divided by its maximal value. Black dots indicate electrodes showing a significant difference between the word and AM responses (p<0.05, bootstrap, FDR corrected).
-
Figure 4—source data 1
Preprocessed electroencephalogram (EEG) data recorded in Experiments 1–3.
- https://cdn.elifesciences.org/articles/60433/elife-60433-fig4-data1-v2.mat
Figure 5 with 1 supplement
Replication of the neural response to amplitude-modulated speech.
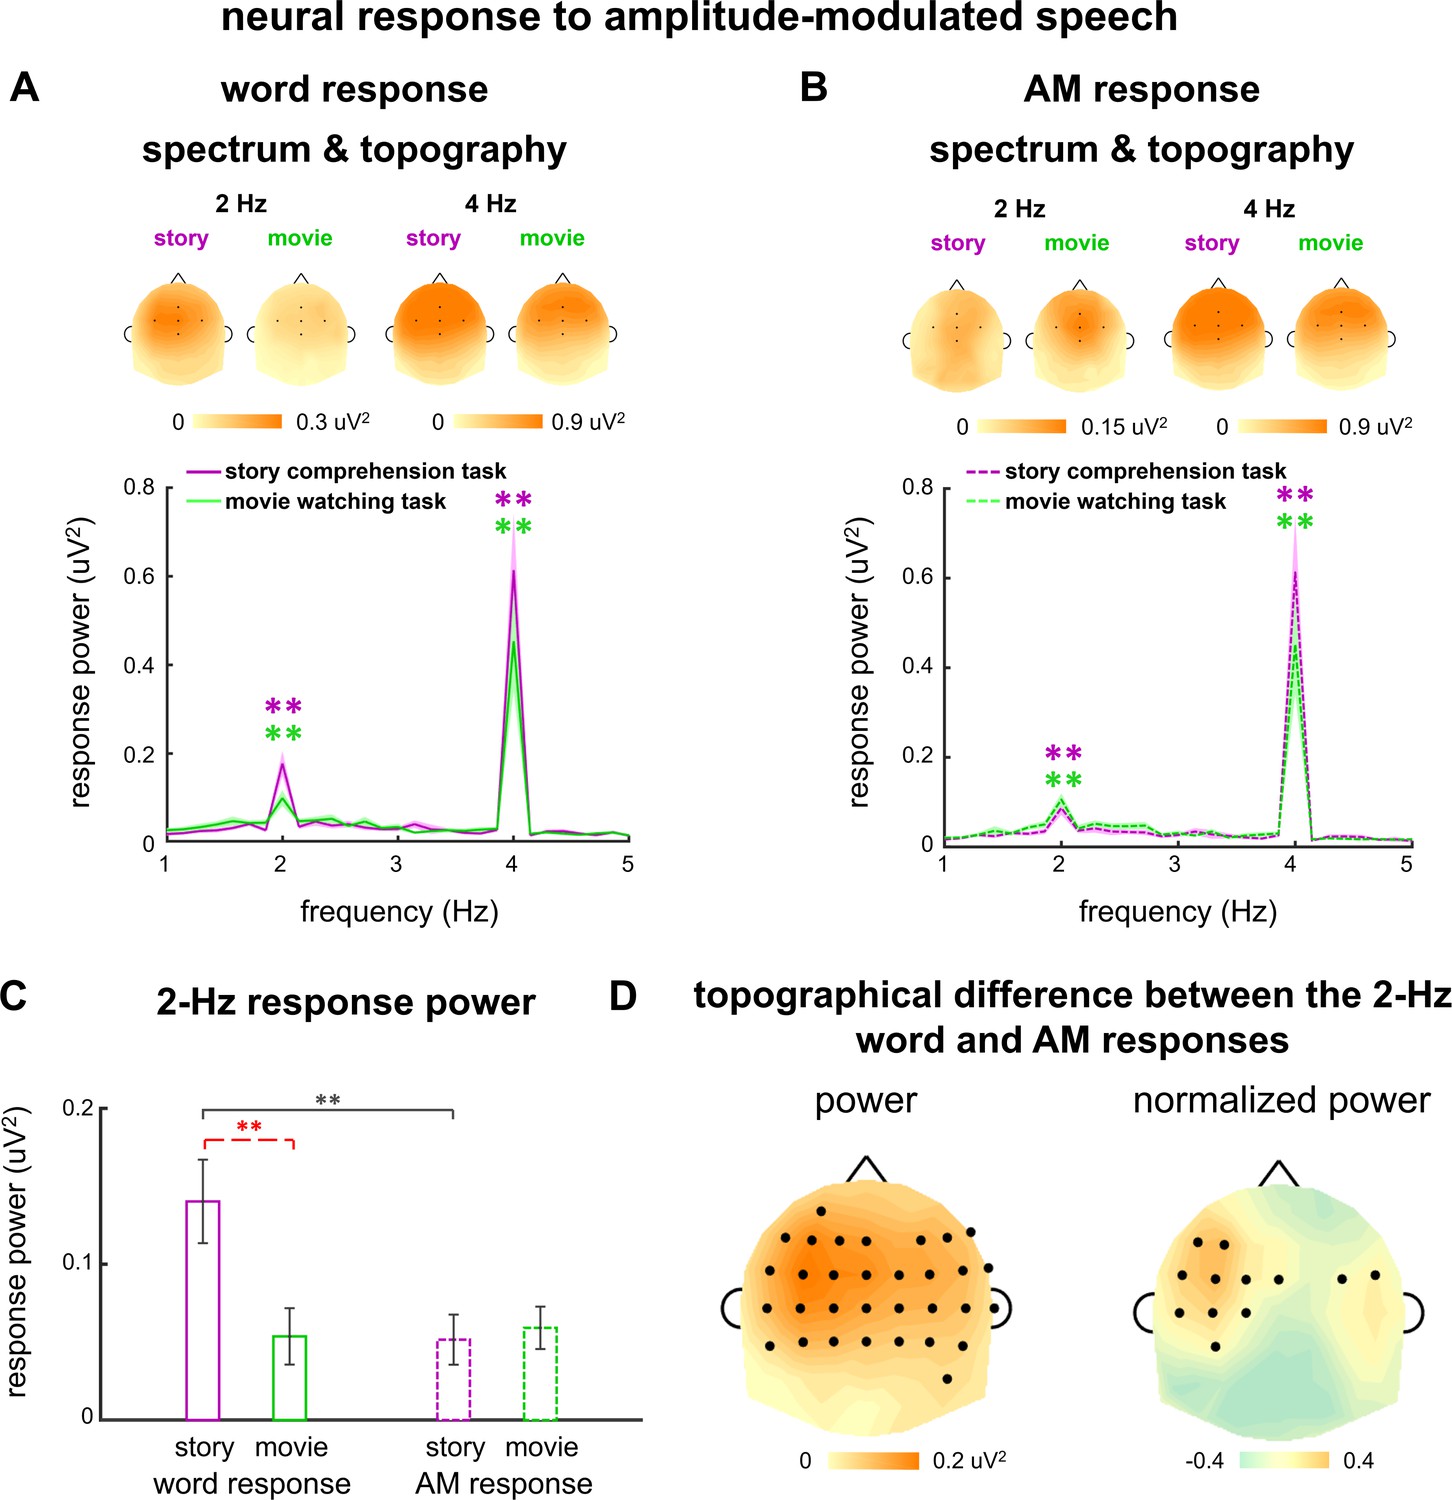
(A and B) Spectrum and topography for the word response (A) and amplitude modulation (AM) response (B). Colored stars indicate frequency bins with stronger power than the power averaged over four neighboring frequency bins (two on each side). *p<0.05, **p<0.001 (bootstrap, false discovery rate [FDR] corrected). The topography on the top of each plot shows the distribution of response power at 2 Hz and 4 Hz. (C) Response power at 2 Hz. Black stars indicate significant differences between the word and (AM) responses, while red stars indicate a significant difference between tasks. *p<0.05, **p<0.01 (bootstrap, FDR corrected). (D) Power difference between the word and AM responses in individual electrodes are shown in the left panel. To further illustrate the difference in topographical distribution instead of the response power, each response topography is normalized by dividing its maximum value. The difference in the normalized topography is shown in the right panel. Black dots indicate electrodes showing a significant difference between the word and AM responses (p<0.05, bootstrap, FDR corrected).
-
Figure 5—source data 1
Preprocessed electroencephalogram (EEG) data recorded in Experiment 4.
- https://cdn.elifesciences.org/articles/60433/elife-60433-fig5-data1-v2.mat
Figure 5—figure supplement 1
Electroencephalogram (EEG) response spectrum and 2-Hz phase difference in the replication experiment.
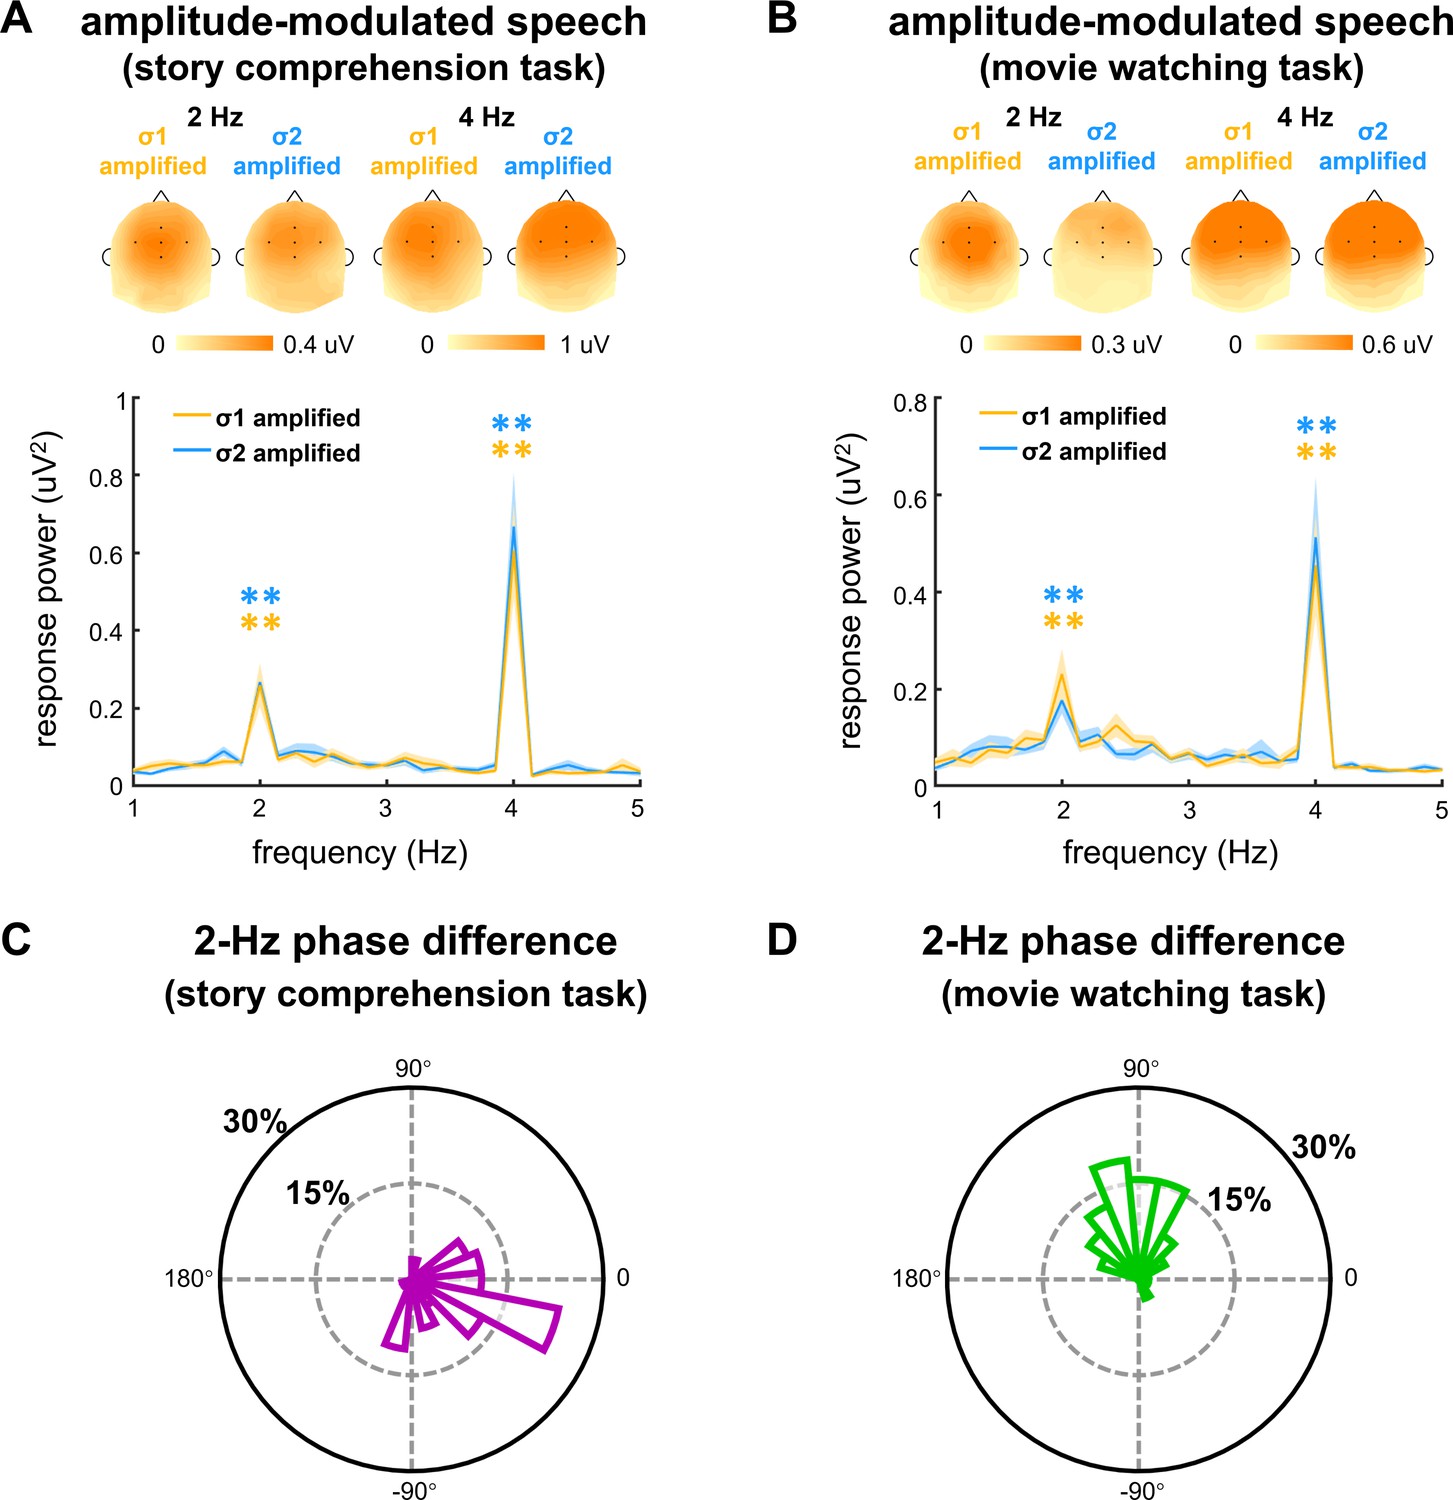
(A and B) Response spectrum averaged over participants and EEG electrodes. The shaded area indicates one standard error of the mean (SEM) across participants. Stars indicate significantly higher power at 2 Hz or 4 Hz than the power averaged over four neighboring frequency bins (two on each side). The color of the star is the same as the color of the spectrum. The topography on the top of each plot shows the distribution of response power at 2 Hz and 4 Hz. The five black dots in the topography indicate the position of electrodes FCz, Fz, Cz, FC3, and FC4. (C and D) Phase difference between the σ1- and σ2-amplified conditions at 2 Hz. The phase difference is averaged across participants, and the polar histogram shows the distribution of phase difference from 64 electrodes.
Figure 6 with 1 supplement
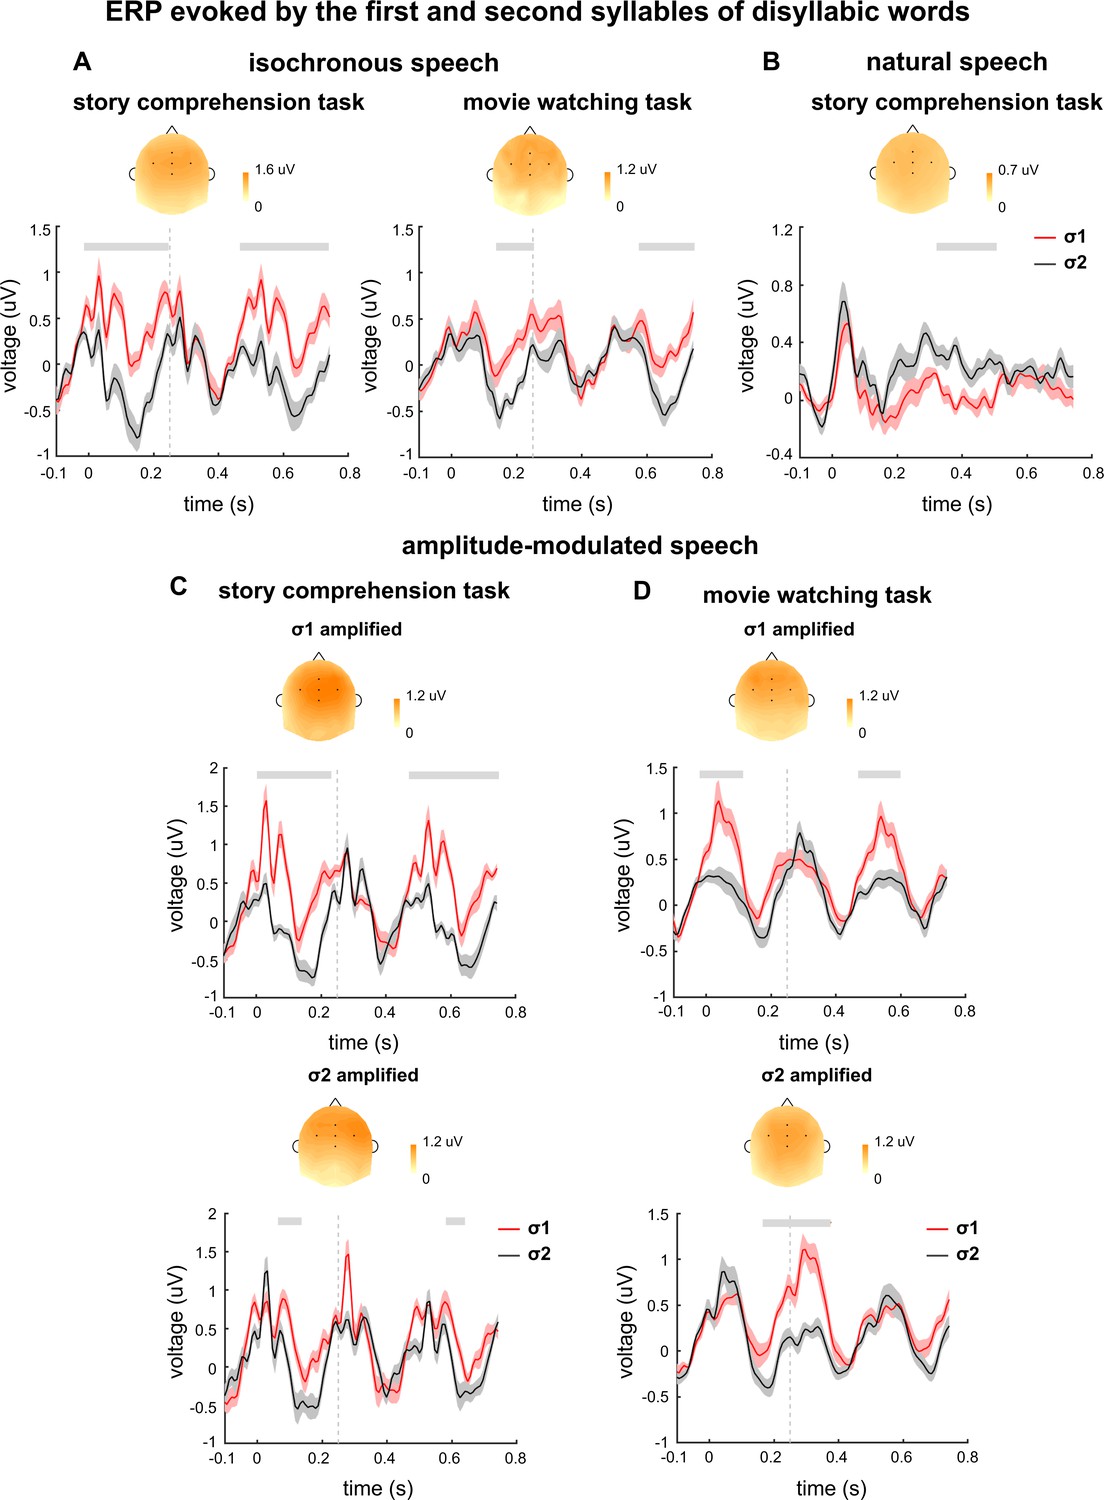
Event-related potential (ERP) responses evoked by disyllabic words.
The ERP responses evoked by σ1 and σ2 are shown in red and black, respectively. The ERP response is averaged over participants and electrodes. The shaded area indicates 1 SEM across participants. The gray lines on top denote the time intervals in which the two responses are significantly different from each other (p<0.05, cluster-based permutation test). The topography on top is averaged over all time intervals showing a significant difference between the two responses in each plot. Time 0 indicates syllable onset.
-
Figure 6—source data 1
Preprocessed electroencephalogram (EEG) data recorded in Experiments 1–3.
- https://cdn.elifesciences.org/articles/60433/elife-60433-fig6-data1-v2.mat
Figure 6—figure supplement 1
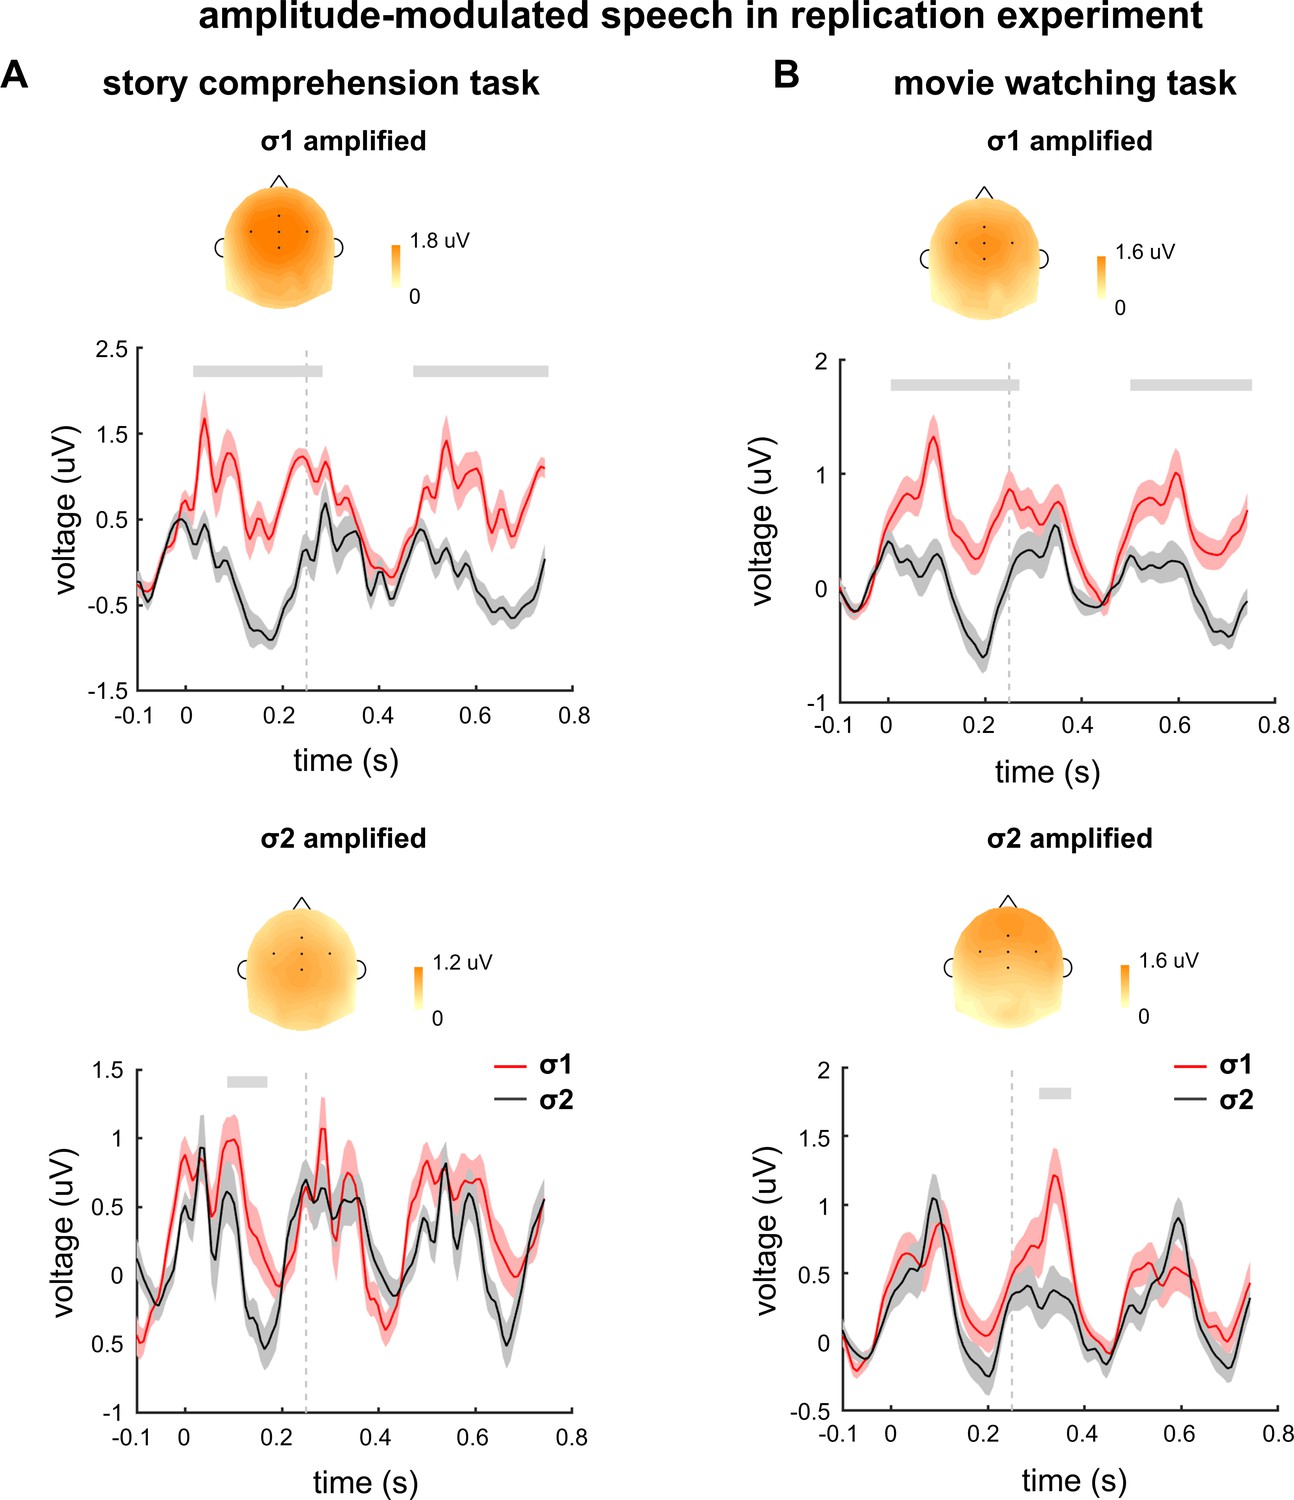
Event-related potential (ERP) responses evoked by disyllabic words in the replication experiment.
The ERP responses evoked by σ1 and σ2 are shown in red and black, respectively. The ERP response is averaged over participants and electrodes. The shaded area indicates 1 SEM across participants. The gray lines on top denote the time intervals in which the two responses are significantly different from each other (p<0.05, cluster-based permutation test). The topography on top is averaged over all time intervals showing a significant difference between the two responses in each plot. Time 0 indicates syllable onset.
Author response image 1
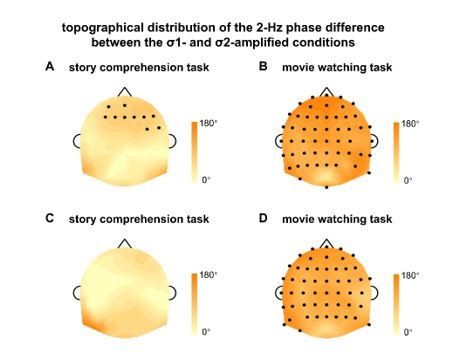
Topographical distribution of the 2-Hz phase difference between the σ1- and σ2-amplified conditions.
The phase difference is calculated for each participant and each electrode, and then averaged over participants. The black dots indicate electrodes showing a significant phase difference between the σ1- and σ2-amplified conditions (P < 0.05, bootstrap, FDR corrected). (AB) The 2-Hz phase difference in the original experiment. (CD) The 2-Hz phase difference pooled over the original experiment and the replication experiment.
Author response image 2

Spectrum of the EEG response averaged over sentences.
This analysis is restricted to sentences that had at least 10 syllables, and only the response to the first 10 syllables is analyzed. The response during the first two syllables is removed to avoid the onset response and the rest 2 seconds of response is averaged over sentences. The averaged response is transformed into the frequency-domain using the DFT. Response spectrum averaged over participants and EEG electrodes. The shaded area indicates 1 standard error of the mean (SEM) across participants. Stars indicate significantly higher power at 2 Hz or 4 Hz than the power averaged over 4 neighboring frequency bins (2 on each side). The color of the star is the same as the color of the spectrum **P < 0.01(bootstrap, FDR corrected).
Author response image 3

Topographical distribution of the 2-Hz phase difference between the σ1- and σ2-amplified conditions using the average of sixty-four electrodes as the reference.
The phase difference is calculated for each participant and each electrode, and then averaged over participants. The black dots indicate the electrodes showing a significant phase difference between the σ1- and σ2-amplified conditions (P < 0.05, bootstrap, FDR corrected).
Author response image 4
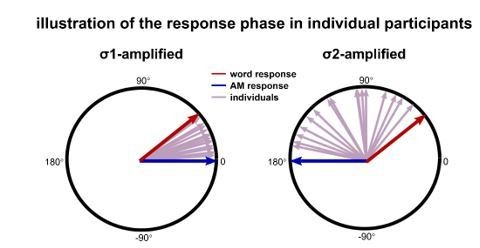
Illustration of the response phase for individuals.
The red and blue arrows indicate the phase of word response and AM response, which are assumed to be consistent across individuals. The AM response is 180° out of phase between the σ1 and σ2-amplified conditions, while the word response phase is the same in both conditions. The measured response is the vector sum of the AM and word responses. The purple arrows indicate the phase of the measured response for individual participants. If the phase of the AM response is more consistent with the phase of the word response in the σ1-amplified condition, the inter-participants phase coherence is higher for the σ1-amplified condition than the σ2-amplified condition.
Additional files
-
Source code 1
The MATLAB code to process data in Experiments 1–3 and plot the results as displayed in Figure 2.
- https://cdn.elifesciences.org/articles/60433/elife-60433-code1-v2.zip
-
Source code 2
The MATLAB code to process data in Experiments 1–3 and plot the results as displayed in Figure 3.
- https://cdn.elifesciences.org/articles/60433/elife-60433-code2-v2.zip
-
Source code 3
The MATLAB code to process data in Experiments 1–3 and plot the results as displayed in Figure 4.
- https://cdn.elifesciences.org/articles/60433/elife-60433-code3-v2.zip
-
Source code 4
The MATLAB code to process data in Experiment 4 and plot the results as displayed in Figure 5.
- https://cdn.elifesciences.org/articles/60433/elife-60433-code4-v2.zip
-
Source code 5
The MATLAB code to process data in Experiments 1–3 and plot the results as displayed in Figure 6.
- https://cdn.elifesciences.org/articles/60433/elife-60433-code5-v2.zip
-
Source code 6
MATLAB functions used in other source codes.
- https://cdn.elifesciences.org/articles/60433/elife-60433-code6-v2.rar
-
Supplementary file 1
Assessment of the stimulus.
- https://cdn.elifesciences.org/articles/60433/elife-60433-supp1-v2.docx
-
Supplementary file 2
Post-hoc effect size calculation.
- https://cdn.elifesciences.org/articles/60433/elife-60433-supp2-v2.docx
-
Supplementary file 3
Samples of the stimulus including isochronous speech, natural speech, σ1-amplified speech, and σ2-amplified speech.
- https://cdn.elifesciences.org/articles/60433/elife-60433-supp3-v2.rar
-
Transparent reporting form
- https://cdn.elifesciences.org/articles/60433/elife-60433-transrepform-v2.docx
Download links
A two-part list of links to download the article, or parts of the article, in various formats.
Downloads (link to download the article as PDF)
Open citations (links to open the citations from this article in various online reference manager services)
Cite this article (links to download the citations from this article in formats compatible with various reference manager tools)
Cortical encoding of acoustic and linguistic rhythms in spoken narratives
eLife 9:e60433.
https://doi.org/10.7554/eLife.60433


