Asymmetric neurogenic commitment of retinal progenitors involves Notch through the endocytic pathway
- Max Planck Institute of Molecular Cell Biology and Genetics, Germany
- Instituto Gulbenkian de Ciência, Portugal
Figures
Figure 1 with 3 supplements
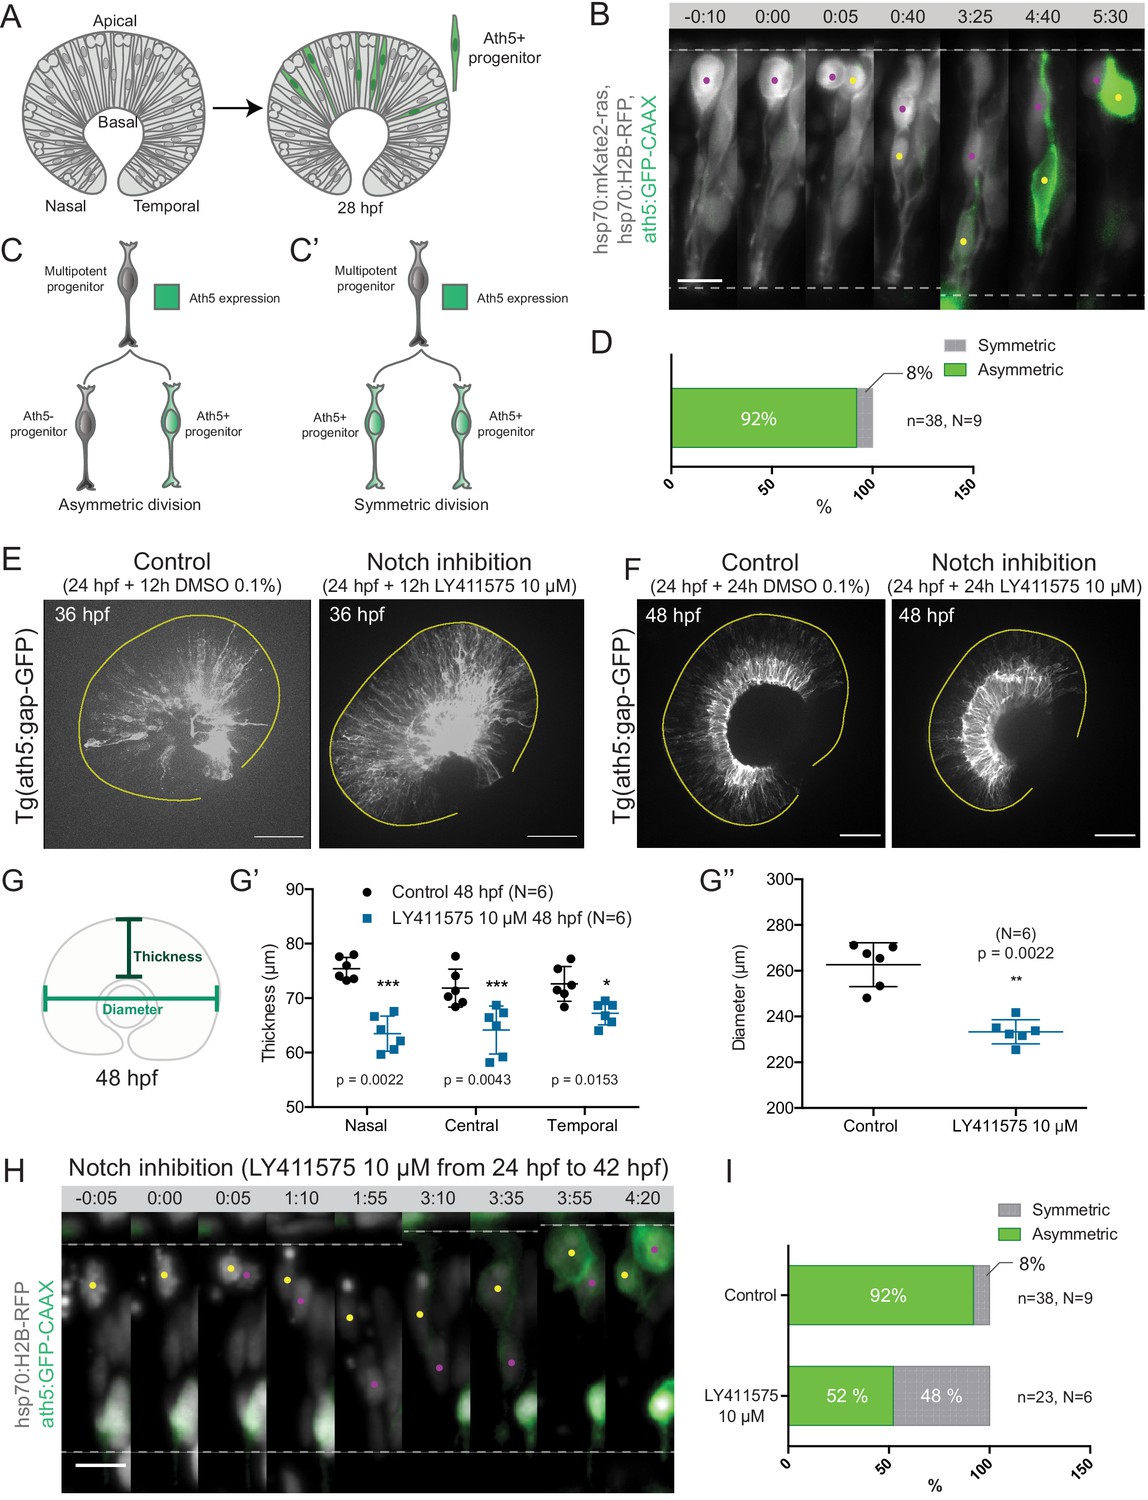
Asymmetric cell divisions generate Ath5+ progenitors in a Notch-dependent manner.
(A) Schematic of mosaic Ath5 expression in the retina (green) at 28 hpf. Injection of ath5:GFP-CAAX construct at 1 cell stage. (B) Example of an asymmetric multipotent progenitor division with regards to Ath5 expression onset. hsp70:H2B-RFP (nuclei, grey), hsp70:mkate2-ras (cell membrane, grey), ath5:GFP-CAAX (Ath5, green). Dashed lines show apical and basal sides of the retinal neuroepithelium. Scale bar, 10 μm. Magenta and yellow dots label sister cells. (C–C’) Schematics of multipotent progenitor cells dividing asymmetrically (C) or symmetrically (C’) with regards to Ath5 expression. (D) Distribution of asymmetric vs symmetric divisions observed in live imaging experiments. N = number of embryos, n = number of divisions. (E) Ath5+ cells (grey) at 36 hpf in control (left) vs Notch inhibition (right). Scale bar, 50 μm. The yellow line delimits the apical side of the retinal neuroepithelium. (F) Ath5+ cells (grey) at 48 hpf in control (left) vs Notch inhibition (right). Scale bar, 50 μm. The yellow line delimits the apical side of the retinal neuroepithelium. (G) Schematic of retinal neuroepithelium measurements at 48 hpf, (G’) retinal thickness control vs Notch inhibition, (G’’) retinal diameter control vs Notch inhibition. Mann-Whitney test used for comparison. Vertical bars represent standard deviation. (H) Example of symmetric progenitor division upon Notch inhibition. hsp70:H2B-RFP (nuclei, grey), ath5:GFP-CAAX (Ath5, green). Dashed lines show apical and basal sides of the retinal neuroepithelium. Scale bar, 10 μm. Magenta and yellow dots label sister cells. (I) Distribution of asymmetric vs symmetric divisions observed in live imaging experiments in Notch inhibition compared to controls.
-
Figure 1—source data 1
Source data for panels G’,G’’.
- https://cdn.elifesciences.org/articles/60462/elife-60462-fig1-data1-v2.xlsx
Figure 1—figure supplement 1
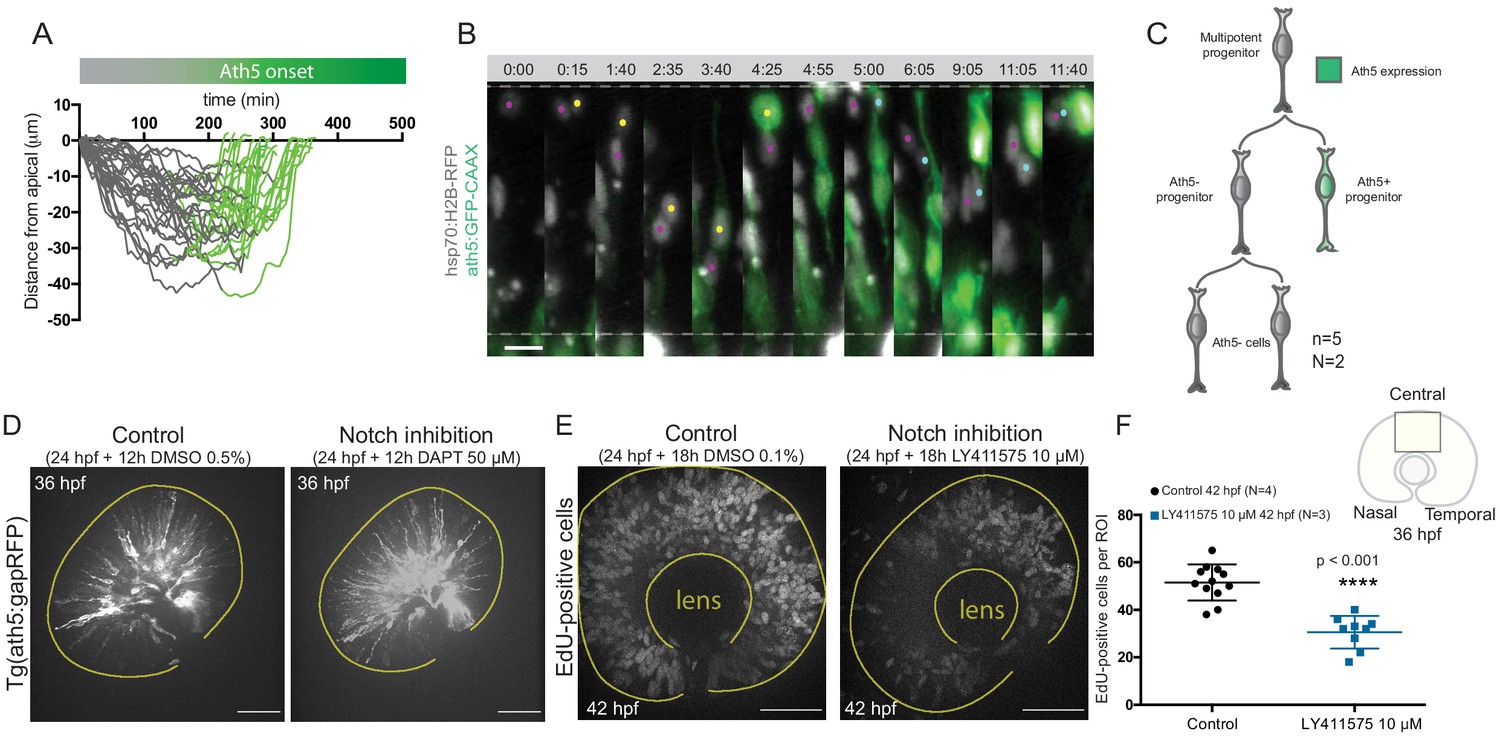
Ath5- sister cells do not enter the Ath5 lineage in the next cell cycle.
Notch inhibition affects progenitor division patterns. (A) Onset of Ath5 expression (green) in Ath5+ progenitors between divisions. (B) Example of Ath5- sister cell followed to next division. hsp70:H2B-RFP (nuclei, grey), ath5:GFP-CAAX (Ath5, green). Scale bar, 10 μm. (C) Schematics of lineage tree of Ath5- cell. (D) Ath5+ cells (grey) at 36 hpf in control (left) and upon Notch inhibition (right) with DAPT 50 μM. Scale bar, 50 μm. The yellow line delimits the apical side of the retinal neuroepithelium. (E) EdU+ cells (grey) at 42 hpf in control (left) and upon Notch inhibition (right) treated with 10 μM LY411575. Scale bar, 50 μm. The yellow lines delimit the apical and basal side of the retinal neuroepithelium. (F) Quantification of EdU-positive cells in the central portion of the retina in control (black) and upon Notch inhibition (blue). Unpaired t-test with Welch’s correction. Error bars represent standard deviation.
Figure 1—video 1
Asymmetric division of multipotent retinal progenitors.
Part 1: Example of an asymmetric division of multipotent progenitors, generating one Ath5+ and one Ath5- cell. Membranes of progenitors are labelled by hsp70:mkate2-ras (grey), nuclei by hsp70:H2B-RFP (grey). Ath5 expression is followed using ath5:GFP-CAAX (green). Time is shown in hours and minutes. Yellow and magenta dots label Ath5+ and Ath5- sister cells, respectively. Part 2: Example of the division of an Ath5- sister cell. Cell nuclei are labelled by hsp70:H2B-RFP (grey) and Ath5 expression is followed using ath5:GFP-CAAX (green). Yellow dot labels Ath5+ sister cell. Magenta and cyan dots label Ath5- sister cell and its daughters.
Figure 1—video 2
Symmetric division of a multipotent progenitor upon Notch inhibition with 10 µM LY411575, generating two Ath5+ progenitors.
Nuclei of progenitors are labelled by hsp70:H2B-RFP (grey) and Ath5 expression is followed using ath5:GFP-CAAX (green). Time is shown in hours and minutes. Yellow and magenta dot label sister cells.
Figure 2 with 2 supplements

Asymmetry of division generating Ath5+ progenitors is independent of basal soma positioning in the neuroepithelium.
(A) Schematic of progenitor cell soma moving along the apicobasal axis between divisions. (B) Maximum basal position of sister cells. Paired t-test was used to compare sister cells. Lines connect sister cells. (C) Difference in maximum basal position between sister cells. Vertical error bars represent standard deviation. (D) Maximum basal position of sister cells in cases in which Ath5+ sister cells translocate more basally (27/35, 78%). (E) Maximum basal position of sister cells in cases in which Ath5- sister cells translocate more basally (8/35, 22%). (F) Difference in maximum basal position between sister cells, comparing Ath5+ and Ath5- cells at most basal positions. (G) Ath5+ progenitor trajectories between divisions. Start = 0 min, mitosis of mother cell. End, onset of cell rounding. (H) Ath5- progenitor trajectories between divisions. Start = 0 min, mitosis of mother cell. End, onset of cell rounding. (I) Mean + standard deviation of Ath5+ and Ath5- progenitor pooled tracks from panels G (Ath5+, green) and H (Ath5-, grey). (J) Asymmetric division upon DN-dynactin overexpression. hsp70:H2B-RFP (nuclei, grey), hsp70:DNdynactin-mKate2 (dynactin, grey) ath5:GFP-CAAX (Ath5, green). Scale bar, 10 μm. Dashed lines show apical and basal sides of the neuroepithelium. Magenta and yellow dots label sister cells. (K) Maximum basal position of sister cells upon dynactin inhibition. Paired t-test to compare sister cells. (L) Percentage of asymmetric and symmetric divisions observed upon disruption of dynactin function compared to control.
-
Figure 2—source data 1
Source data for panels B, C, D, E, F, G, H and K. .
- https://cdn.elifesciences.org/articles/60462/elife-60462-fig2-data1-v2.xlsx
Figure 2—figure supplement 1

Depth of basal translocation is not linked to sister cell fate.
(A) Maximum basal position of Ath5- and Ath5+ cells. Unpaired t-test with Welch’s correction. (B) Integral mean of Ath5- and Ath5+ cells. Vertical bars represent standard deviation. Kolmogorov-Smirnov test. (C) Directionality ratio of Ath5+ and Ath5- progenitors cell soma for basal translocation. Data from Figure 2D–E. Error bars represent SEM. (D) Average velocity of Ath5+ and Ath5- cell bodies between 0 and 100 min, corresponding to basal translocation. Vertical bars represent standard deviation. Unpaired t-test. (E) Comparison between maximum basal position of sister cells in control (purple dots) and dynactin dominant negative (dynactin DN, cyan dots) from Figure 2B and K, respectively. Line connects sister cells.
-
Figure 2—figure supplement 1—source data 1
Source data for panels B, C and D of Figure 2—figure supplement 1.
- https://cdn.elifesciences.org/articles/60462/elife-60462-fig2-figsupp1-data1-v2.xlsx
Figure 2—video 1
Somal translocation of sister cells after asymmetric divisions upon dynactin inhibition.
Dynactin is labelled by hsp70:DNdynactin-mKate2 (grey), nuclei by hsp70:H2B-RFP (grey) and Ath5 expression is followed using ath5:GFP-CAAX (green). Time is shown in hours and minutes. Yellow and magenta dots label Ath5+ and Ath5- sister cell, respectively.
Figure 3 with 3 supplements
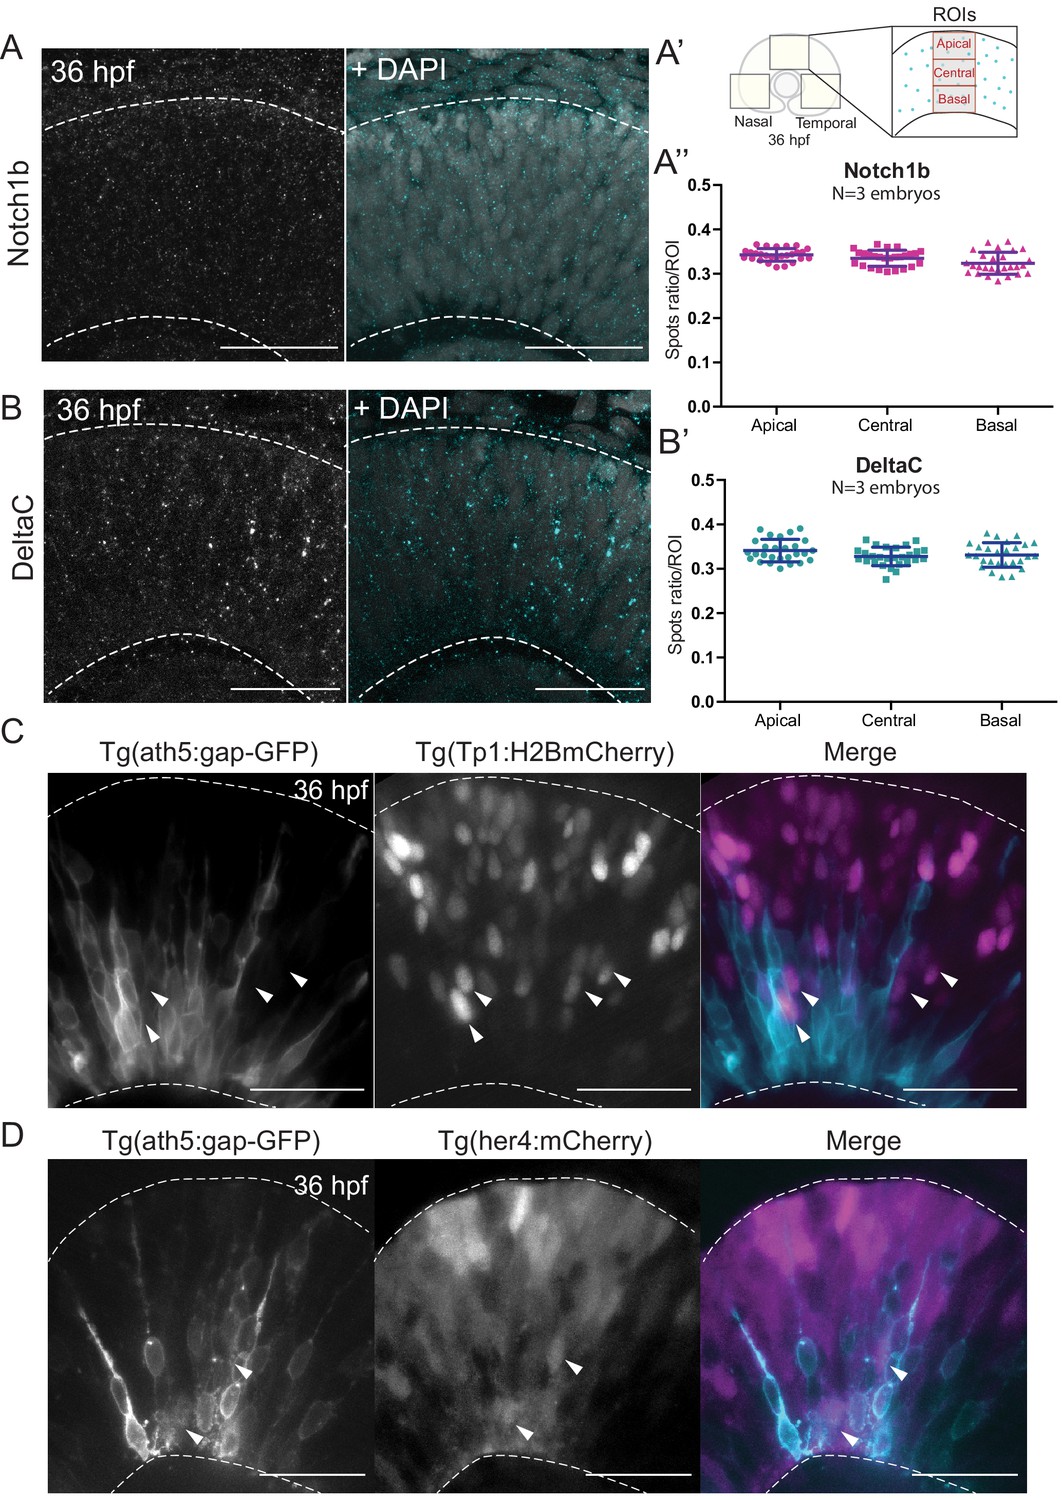
Notch signalling components are uniformly distributed along the apicobasal axis of the retinal neuroepithelium.
(A) Staining 36 hpf embryos for Notch1b. Dashed lines show apical and basal sides of the retinal neuroepithelium. Scale bar, 30 μm. DAPI labels nuclei. (A’) Schematic of regions of interest (ROIs) along the apicobasal axis used to measure the DeltaC and Notch1b spot ratio. (A’’) Spot ratio distribution for Notch1b along the apicobasal axis. Unpaired t-test with Welch’s correction. P values: central vs apical, p=0.0896; basal vs central, p=0.0630; basal vs apical, p=0.012. (B) Staining of 36 hpf embryos for DeltaC. Dashed lines show apical and basal sides of the retinal neuroepithelium. Scale bar, 30 μm. DAPI labels nuclei. (B’) Spot ratio distribution for DeltaC along the apicobasal axis. Unpaired t-test with Welch’s correction. P values: central vs apical, p=0.0759; basal vs central, p=0.6697; basal vs apical, p=0.3053. (C) Images of retinae expressing Tp1:H2BmCherry (magenta) and ath5:gap-GFP (cyan) at 36 hpf. Scale bar, 30 μm. Arrows show Tp1 positive Ath5 negative cells. Dashed lines show apical and basal sides of the retinal neuroepithelium. (D) Images of retinae expressing her4:mCherry (magenta) and ath5:gap-GFP (cyan) at 36 hpf. Scale bar, 30 μm. Arrows show her4 positive but Ath5 negative cells. Dashed lines show apical and basal sides of the retinal neuroepithelium.
-
Figure 3—source data 1
Source data for panels A’’ and B’.
- https://cdn.elifesciences.org/articles/60462/elife-60462-fig3-data1-v2.xlsx
Figure 3—figure supplement 1

Controls for Notch1b and DeltaC stainings in the retinal neuroepithelium.
(A) Notch1b staining of 36 hpf embryos injected with control-MO (upper row), notch1b-MO 1 ng/embryo (middle row) and notch1b-MO 2 ng/embryo (lower row). Dashed lines indicate apical and basal sides of the retinal neuroepithelium. Scale bar, 30 μm. DAPI labels nuclei (grey). (B) DeltaC staining of 36 hpf embryos injected with control-MO (upper row), deltaC-MO1 (middle row) and deltaC-MO2 (lower row). Dashed lines indicate apical and basal side of the retinal neuroepithelium. Scale bar, 30 μm. DAPI labels nuclei (grey). (C) Staining 36 hpf embryos for Notch1b in the tail. Arrowheads indicate positive staining of somites. Scale bar, 50 μm. DAPI labels nuclei (grey).
Figure 3—figure supplement 2
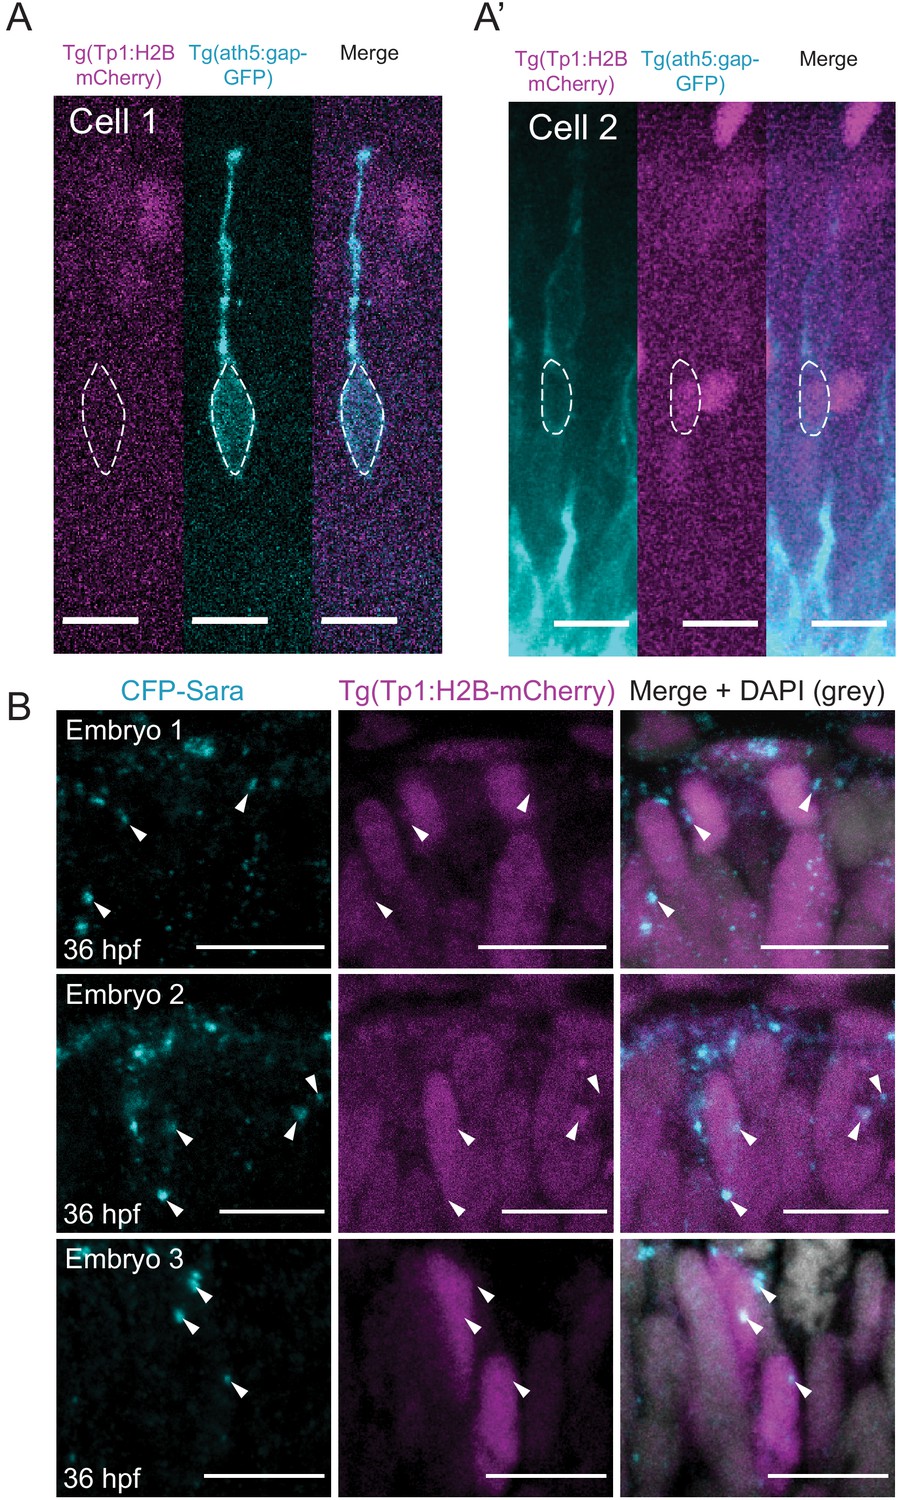
Ath5+ progenitors do not carry active Notch signalling.
(A) Example of Ath5+ cell (cyan) that does not express Tp1 (magenta). Dashed line outlines cell body. Scale bar, 10 μm. (A’) Example of Ath5+ cell (cyan) that expresses weak Tp1 signal (magenta). Dashed line outlines cell body. Scale bar, 10 μm. (B) Three different 36 hpf embryos showing Tp1-positive cells (magenta) that carry Sara-positive endosomes (cyan). White arrowheads indicate Sara endosomes. Scale bar, 10 μm. DAPI labels nuclei (grey).
Figure 3—video 1
Progenitors showing active Notch signalling occupy the entire apicobasal axis.
Part 1: Tg(Tp1:H2B-mCherry),Tg(ath5:gap-GFP) double transgenic line is imaged at the onset of neurogenesis. Notch activity is shown by Tp1:H2BmCherry (grey), neurogenic cells by ath5:gap-GFP (green). Time is shown in hours and minutes. Part 2: Basal translocation of a progenitor cell with Notch activity. Progenitor cells nuclei are labelled with hsp70:H2B-RFP (magenta), Notch activity is labelled by her4:EGFP (cyan). Blastomere transplantation of double transgenic Tg(her4:EGFP),Tg(hsp70:H2B-RFP) into wild type was used to achieve mosaic labelling. Time is shown in hours and minutes. White dot indicates a basal-translocating progenitor, cyan arrowheads point to her4 expression.
Figure 4 with 1 supplement

Basal soma translocation of Ath5+ progenitors is facilitated by basal process inheritance and stabilised microtubules.
(A) Asymmetric inheritance of basal process during progenitor division. hsp70:mKate2-ras labels cell membrane (grey). Arrowheads: basal process. Scale bar, 10 μm. Magenta and yellow dots label sister cells. Dashed lines show apical and basal side of retinal neuroepithelium. (B) Mean square displacement (MSD) for Ath5+ and Ath5- progenitors, calculated for basal translocation within the first 100 min after mitosis of the mother cell. Data from Figure 2G and H. (C) Maximum basal position of sister cells not inheriting the basal process (No BP) vs inheriting the basal process (BP) after division. (D) Proportion of Ath5+ and Ath5- progenitor cells inheriting the basal process. (E) Acetylated tubulin staining (magenta) of Tg(ath5:gap-GFP, cyan) with nuclei labelled by DAPI (grey) at 24 (upper left panel), 28 (upper right), 32 (bottom left) and 36 hpf (bottom right). Scale bar, 30 μm. Arrows mark acetylated tubulin staining in the primary cilium (upper left), retinal progenitors (upper right and bottom left) and retinal ganglion cells (bottom right). Dashed lines show apical and basal sides of the retinal neuroepithelium. (F) Example of basal translocation of progenitors upon Stathmin1 overexpression induced at 28 hpf. hsp70:Stathmin1-mKate2 (stathmin, grey), ath5:GFP-CAAX (Ath5, green). Scale bar, 5 μm. Magenta and yellow dots label sister cells. Dashed lines show apical and basal sides of the retinal neuroepithelium. (G) Percentage of asymmetric and symmetric divisions observed upon Stathmin1 overexpression compared to control. (H) Ath5- progenitor trajectories between divisions upon Stathmin1 overexpression. Start = 0 min, mitosis of mother cell. End, onset of cell rounding. (I) Ath5+ progenitor trajectories between divisions upon Stathmin1 overexpression. Start = 0 min, mitosis of mother cell. End, onset of cell rounding. (J) Mean and Standard Deviation of Ath5- progenitor trajectories in control (magenta) and Stathmin1 overexpression (grey). (K) Mean and Standard Deviation of Ath5+ progenitor trajectories in control (light green) and Stathmin1 overexpression (dark green).
-
Figure 4—source data 1
Source data for panels B, C, H and I.
- https://cdn.elifesciences.org/articles/60462/elife-60462-fig4-data1-v2.xlsx
Figure 4—video 1
Somal translocation of sister cells after asymmetric divisions upon stathmin overexpression.
Stathmin is labelled by hsp70:Stathmin1-mKate2 (grey) and Ath5 expression is followed using ath5:GFP-CAAX (green). Time is shown in hours and minutes. Yellow and magenta dots label Ath5+ and Ath5- sister cell, respectively.
Figure 5 with 2 supplements
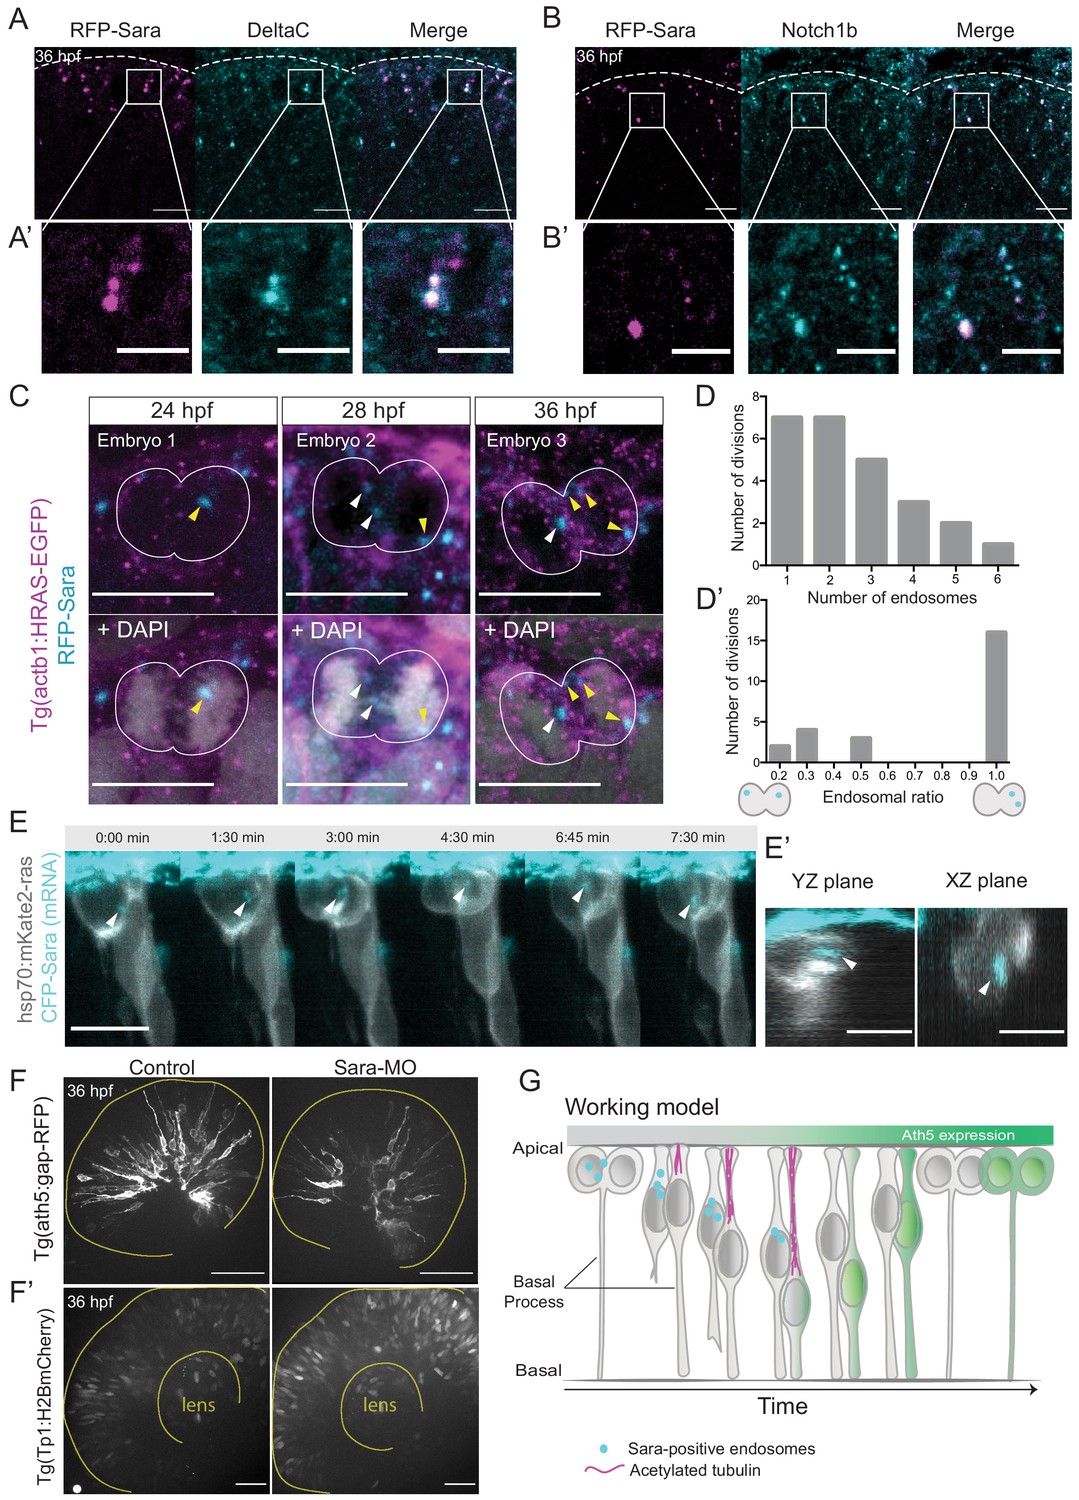
Notch signalling affects neurogenic commitment through Sara endosomes.
(A) Co-localisation of Sara-positive endosomes (RFP-Sara, magenta) and DeltaC staining (cyan) in 36 hpf embryos. Scale bar, 10 μm. Dashed line represents the apical side. (A’) Close-up of co-localisation. Scale bar, 5 μm. (B) Co-localisation of Sara-positive endosomes (RFP-Sara, magenta) and Notch1b staining (cyan) in 36 hpf embryos. Scale bar, 10 μm. Dashed line represents the apical side. (B’) Close-up of co-localisation. Scale bar, 5 μm. (C) Asymmetric distribution of Sara-positive endosomes in dividing progenitor cells in three different embryos fixed at three different developmental stages, 24, 28 and 36 hpf. Tg(actb1:HRAS-EGFP) (membrane, magenta), RFP-Sara (Sara-positive endosomes, cyan), DAPI (chromatin, grey). Scale bar, 10 μm. (D) Number of endosomes within dividing cells. n = 25 cells, 7 embryos. (D’) Histogram of endosomal ratio between dividing cells. n = 25 cells, 7 embryos. (E) Asymmetric distribution of Sara-positive endosomes in dividing cells in live samples at 32 hpf. hsp70:mkate2-ras (membrane [grey], CFP-Sara [Sara-positive endosomes, cyan]). Scale bar, 10 μm. Arrowheads point to the endsosomes (E’) YZ (left) and XZ (right) view of sister cells (grey) and Sara endosomes (cyan) at minute 3:00. Scale bar, 10 μm. Arrowheads point to the endsosomes. (F) Ath5+ cells (grey) in retinal neuroepithelium at 36 hpf in control (left) and Sara knockdown (Sara-MO, right). Scale bar, 50 μm. The yellow line delimits the apical side of the retinal neuroepithelium. (F’) Tp1+ cells (grey) at 36 hpf in control (left) and Sara morpholino knockdown (right). Scale bar, 30 μm. The yellow line delimits the apical side of the retinal neuroepithelium and the lens. (G) Scheme recapitulating the main findings of this study presenting a working model for Sara-positive endosomes inheritance and its role in asymmetric divisions.
Figure 5—figure supplement 1

Sara-positive endosomes are asymmetrically distributed during cell division.
(A) Ath5+ cells (grey) in the retinal neuroepithelium at 36 hpf in embryos injected with control-MO (upper row) and 2.5 ng/embryo Sara-MO (lower row). Scale bar, 50 μm. The yellow lines delimit the apical and basal side of the retinal neuroepithelium. (B) pH3 staining (cyan) in 36 hpf Tg(ath5:gap-GFP) embryos (grey) injected with control-MO (upper row) and 2.5 ng/embryo Sara-MO (lower row). Scale bar, 50 μm. The yellow lines delimit the apical side of the retinal neuroepithelium. (C) EdU+ cells (grey) at 36 hpf in control (upper row) and upon Sara knockdown (lower row) in Tg(ath5:gap-GFP) embryos (green). Scale bar, 50 μm. (D) Quantification of EdU-positive cells in the central portion of the retina in control (black) and Sara knockdown (blue). Unpaired t-test with Welch’s correction. Error bars represent standard deviation. (E) Example of an asymmetric inheritance of Sara-positive endosomes (left) within asymmetric division of multipotent progenitors generating Ath5+ progenitors (right). hsp70:mkate2-ras (cells membrane, grey), CFP-Sara (Sara-positive endosomes, cyan), ath5:GFP-CAAX (Ath5, green). Dashed lines show apical and basal sides of the retinal neuroepithelium. Scale bar, 10 μm. Magenta and yellow dots label sister cells. White arrow points to the Sara-positive endosome.
Figure 5—video 1
Asymmetric inheritance of Sara endosomes during asymmetric progenitor division.
Membranes of progenitors are labelled by hsp70:mkate2-ras (grey), Sara endosomes by CFP-Sara (cyan) and Ath5 expression is followed using ath5:GFP-CAAX (green). Time is shown in hours and minutes, 1 min time resolution during division, 5 min time resolution afterwards to follow Ath5 expression onset. White arrow points to the asymmetrically distributed endosome. Yellow and magenta dots label Ath5+ and Ath5- sister cell, respectively.
Author response image 1

In situ hybridization showing mRNA expression levels of notch1b (left) and deltaC (right).
RNA probes targeting notch receptor 1b and deltaC were synthesized with digoxigenin label. Zebrafish embryos at 32 hpf were fixed overnight at 4 °C in PFA 4% (dissolved in PBS) and kept in 100% methanol at 20 °C until hybridization. The embryos were permeabilized with Proteinase K at room temperature. Hybridization was performed at 68 °C overnight, the probes were detected with anti-Dig antibody and alkaline phosphatase activity was revealed with BM purple.
Tables
Key resources table
| Reagent type (species) or resource | Designation | Source or reference | Identifiers | Additional information |
|---|---|---|---|---|
| Genetic reagent (Danio rerio) | Tg(ath5:gap-GFP) | Zolessi et al., 2006 | ID_source: ZDB-TGCONSTRCT-070129–1 | |
| Genetic reagent (Danio rerio) | Tg(ath5:gap-RFP) | Zolessi et al., 2006 | ID_source: ZDB-TGCONSTRCT-070129–2 | |
| Genetic reagent (Danio rerio) | Tg(her4.1:mcherry-CreERT2) | Kroehne et al., 2011 | ID_source: ZDB-TGCONSTRCT-111102–1 | |
| Genetic reagent (Danio rerio) | Tg(her4:EGFP) | Yeo et al., 2007 | ID_source: ZDB-TGCONSTRCT-070612–3 | |
| Genetic reagent (Danio rerio) | Tg(Tp1bglob:H2BmCherry) | Ninov et al., 2012 | ID_source: ZDB-TGCONSTRCT-120419–6 | |
| Genetic reagent (Danio rerio) | Tg(actb1:HRAS-EGFP) | Cooper et al., 2005 | ID_source: ZDB-TGCONSTRCT-120412–2 | |
| Genetic reagent (Danio rerio) | Tg(hsp70:H2B-RFP) | Dzafic et al., 2015 | ||
| Antibody | Notch1b (Zebrafish, polyclonal) | GeneTEx | RRID:AB_10625877 | IF(1:100) |
| Antibody | DeltaC (goat, monoclonal) | Abcam | RRID:AB_2043260 | IF(1:100) |
| Antibody | GFP (rabbit, polyclonal) | Proteintech | RRID:AB_11042881 | IF(1:100) |
| Antibody | Acetylated tubulin (mouse, monoclonal) | Sigma-Aldrich | RRID:AB_477585 | IF(1:250) |
| Antibody | Phospho-histone H3 (rat, monoclonal) | Abcam | RRID:AB_2295065 | IF(1:500) |
| Antibody | DAPI | Thermofisher | RRID:AB_2629482 | IF(1:1000) |
| Recombinant DNA reagent | ath5:GFP-CAAX (plasmid DNA) | Kwan et al., 2007; Icha et al., 2016a | RRID:Addgene_105958 | 15 ng/µl |
| Recombinant DNA reagent | hsp70:H2B-RFP (plasmid DNA) | Strzyz et al., 2015 | RRID:Addgene_105953 | 10 ng/µl |
| Recombinant DNA reagent | hsp70:mKate2-ras (plasmid DNA) | Strzyz et al., 2015 | RRID:Addgene_105945 | 15 ng/µl |
| Recombinant DNA reagent | hsp70:Stathmin1-mKate2 (plasmid DNA) | Taverna et al., 2016 | RRID:Addgene_105969 | 15 ng/µl |
| Recombinant DNA reagent | hsp70:mKate2-dynactin (1-811) (plasmid DNA) | Taverna et al., 2016 | RRID:Addgene_105970 | 15 ng/µl |
| Sequence-based reagent | Sara morpholino | Kressmann et al., 2015 | N/A | TGAACTAGAGAC TTTACCTTGCCAC |
| Sequence-based reagent | p53 morpholino | Robu et al., 2007 | ZFIN ID: ZDB-MRPHLNO-070126–7 | GCGCCATTGC TTTGCAAGAATTG |
| Sequence-based reagent | Standard control morpholino | Gene tools | N/A | CCTCTTACCTCAG TTACAATTTATA |
| Sequence-based reagent | notch1b morpholino | This study | N/A | GTATTGCATTCTCC TCTCCCGTCTG |
| Sequence-based reagent | deltaC-MO1 | Zhang et al., 2008 | ZFIN ID: ZDB-MRPHLNO-050531–1 | AGCCATCTTTGCC TTCTTGTCTGCT |
| Sequence-based reagent | deltaC-MO2 | Holley et al., 2002; Okigawa et al., 2014 | ZFIN ID: ZDB-MRPHLNO-050531–2 | CGATAGCAGACTG TGAGAGTAGTCC |
| Commercial assay or kit | EdU Click-iT-Alexa 488 | Invitrogen | ID_source:C10337 | |
| Commercial assay or kit | EdU Click-iT-Alexa 647 | Invitrogen | ID_source:C10340 | |
| Commercial assay or kit | mMessage mMachine | Ambion | ID_source:AM1344 | |
| Chemical compound, drug | DMSO | Sigma-Aldrich | ID_source:M81802 | |
| Chemical compound, drug | DAPT | Sigma-Aldrich | ID_source:D5942 | |
| Chemical compound, drug | LY411575 | Sigma-Aldrich | ID_source: T5648 | |
| Chemical compound, drug | Agarose (low gelling temperature) | Sigma-Aldrich | ID_source: A9414-250G | |
| Chemical compound, drug | MS-222 | Sigma-Aldrich | N/A | |
| Chemical compound, drug | Triton | Sigma-Aldrich | ID_source:T9284 | |
| Chemical compound, drug | PTU (N-phenylthiourea) | Sigma-Aldrich | ID_source:P7629 | |
| Software, algorithm | ZEN 2014 (black edition) | Carl Zeiss Microscopy | ||
| Software, algorithm | Andor iQ 3.6 | Andor | ||
| Software, algorithm | ZEN 2011 (black edition) | Carl Zeiss Microscopy | ||
| Software, algorithm | Fiji | Schindelin et al., 2012 | ||
| Software, algorithm | Instantaneous velocities (Python 3) | This study | https://git.mpi-cbg.de/ nerli/nerli-et-al-2020-scripts | |
| Software, algorithm | Integral mean (Python 3) | This study | https://git.mpi-cbg.de/nerli/ nerli-et-al-2020-scripts | |
| Software, algorithm | Spot counter plugin (Fiji) | Nico Stuurman, ValelabUtils package | https://imagej.net/ SpotCounter | |
| Software, algorithm | ClearVolume (Fiji) | Royer et al., 2015 | ||
| Other | CFP-Sara (mRNA) | Kressmann et al., 2015 | 100 pg/embryo | |
| Other | mRFP-Sara (mRNA) | Kressmann et al., 2015 | 100 pg/embryo |
Table 1
DNA constructs used in this study.
| Plasmid | Concentration | Heat shock | Reference(s) |
|---|---|---|---|
| ath5:GFP-CAAX | 15 ng/μl | – | Kwan et al., 2007; Icha et al., 2016a |
| hsp70:H2B-RFP | 10 ng/μl | 37°C, 15 min | Strzyz et al., 2015 |
| hsp70:mKate2-ras | 15 ng/μl | 37°C, 15 min | Strzyz et al., 2015 |
| hsp70:Stathmin1-mKate2 | 15 ng/μl | 39°C, 10 min | Taverna et al., 2016 |
| hsp70:mKate2-dynactin (1-811) | 15 ng/μl | 39°C, 15 min | Taverna et al., 2016 |
Additional files
Download links
A two-part list of links to download the article, or parts of the article, in various formats.
Downloads (link to download the article as PDF)
Open citations (links to open the citations from this article in various online reference manager services)
Cite this article (links to download the citations from this article in formats compatible with various reference manager tools)
Asymmetric neurogenic commitment of retinal progenitors involves Notch through the endocytic pathway
eLife 9:e60462.
https://doi.org/10.7554/eLife.60462


