Differential impact of BTK active site inhibitors on the conformational state of full-length BTK
- Roy J. Carver Department of Biochemistry, Biophysics and Molecular Biology, Iowa State University, United States
- Department of Chemistry and Chemical Biology, Northeastern University, United States
Figures
Figure 1
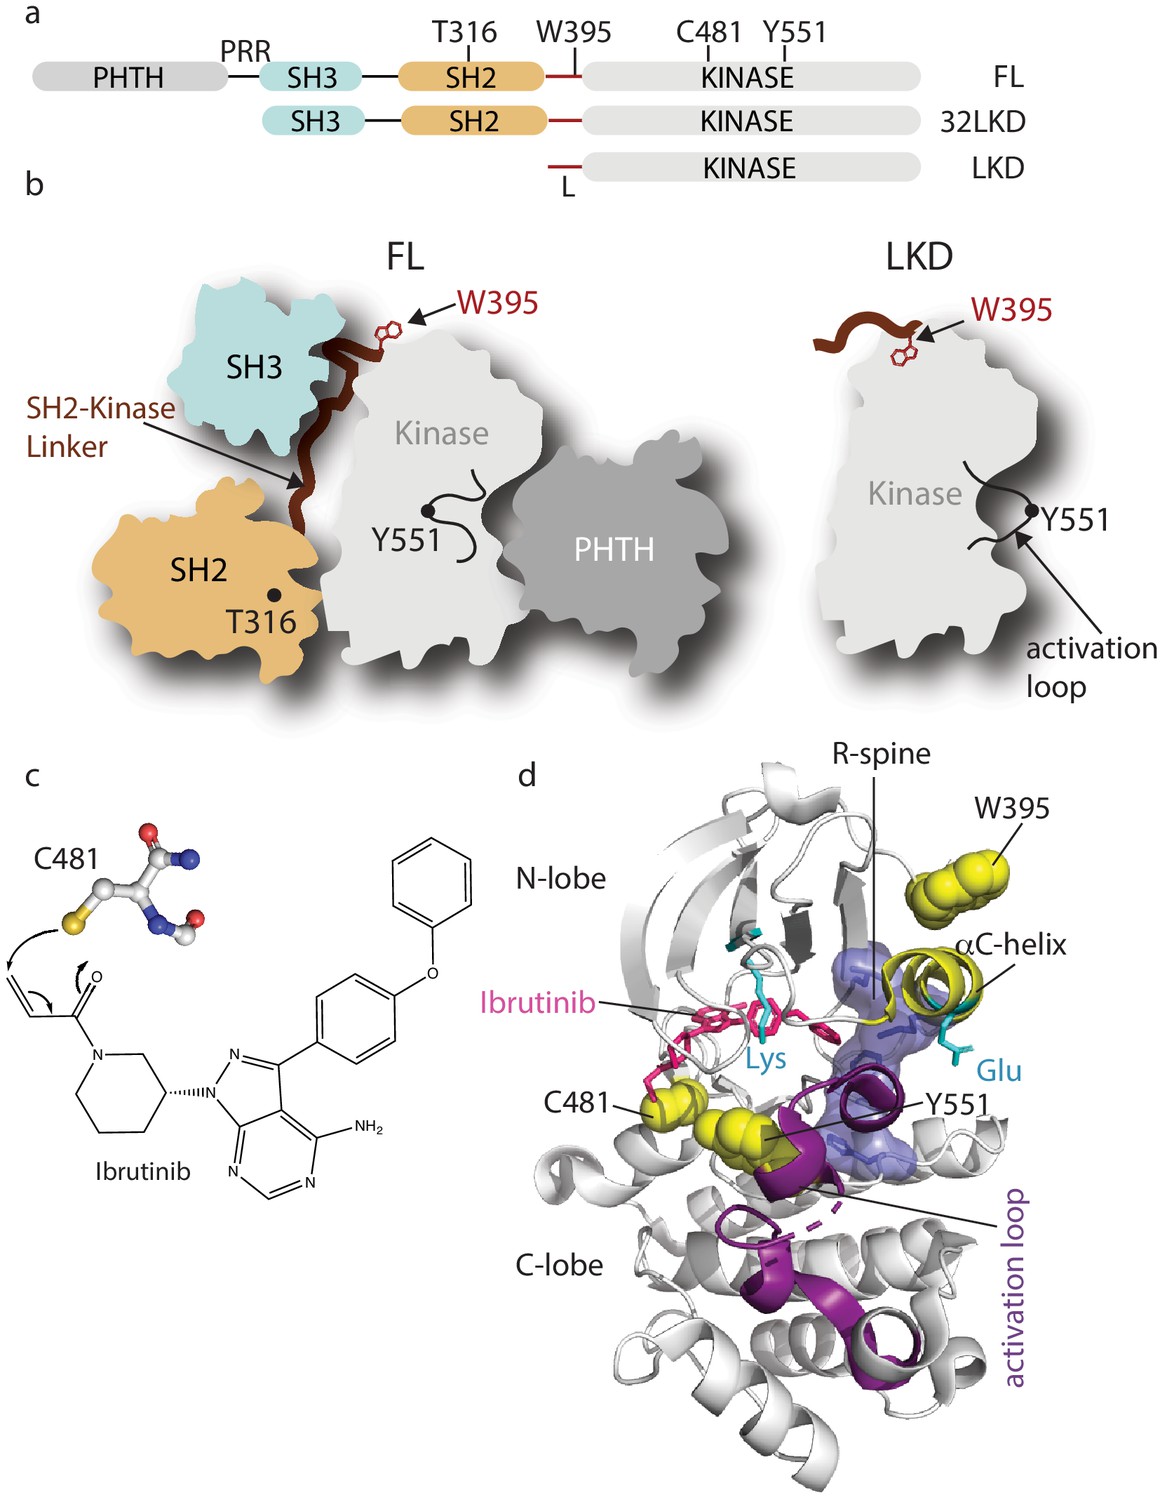
Domain organization of full-length Bruton’s tyrosine kinase (BTK) and Ibrutinib binding site.
(a) The BTK fragments used in this study are shown with key residues indicated above each domain. PHTH, Pleckstrin homology-Tec homology domain; PRR, proline-rich region; SH3, Src homology three domain; SH2, Src homology two domain; L, SH2-kinase linker; FL, full-length; 32LKD, SH3-SH2-linker-kinase domain; and LKD, linker-kinase domain. (b) Domain arrangement of BTK full-length (FL) in the autoinhibited conformation (left) based on the crystal structure of the BTK SH3-SH2-kinase (32LKD) fragment (PDB ID: 4XI2) and solution data supporting an autoinhibitory interaction between the PHTH domain and the activation loop face of the kinase domain (Amatya et al., 2019; Devkota et al., 2017). The location of T316 in the SH2 domain is indicated with a black circle. The active LKD fragment is depicted on the right. (c) The thiol group of C481 in the BTK kinase domain forms a covalent bond with the α,β unsaturated ketone of Ibrutinib. (d) Crystal structure (PDB ID: 5P9J) of BTK kinase domain (gray cartoon) bound to Ibrutinib, represented in pink sticks. The kinase domain N- and C-lobes are labeled, the activation loop is purple, the αC-helix yellow, side chains of the Lys/Glu pair are shown in cyan, sidechains of W395, Y551, and C481 are shown in yellow spheres, and the regulatory spine (R-spine) residues are shown as blue sticks and transparent surface.
Figure 2 with 2 supplements
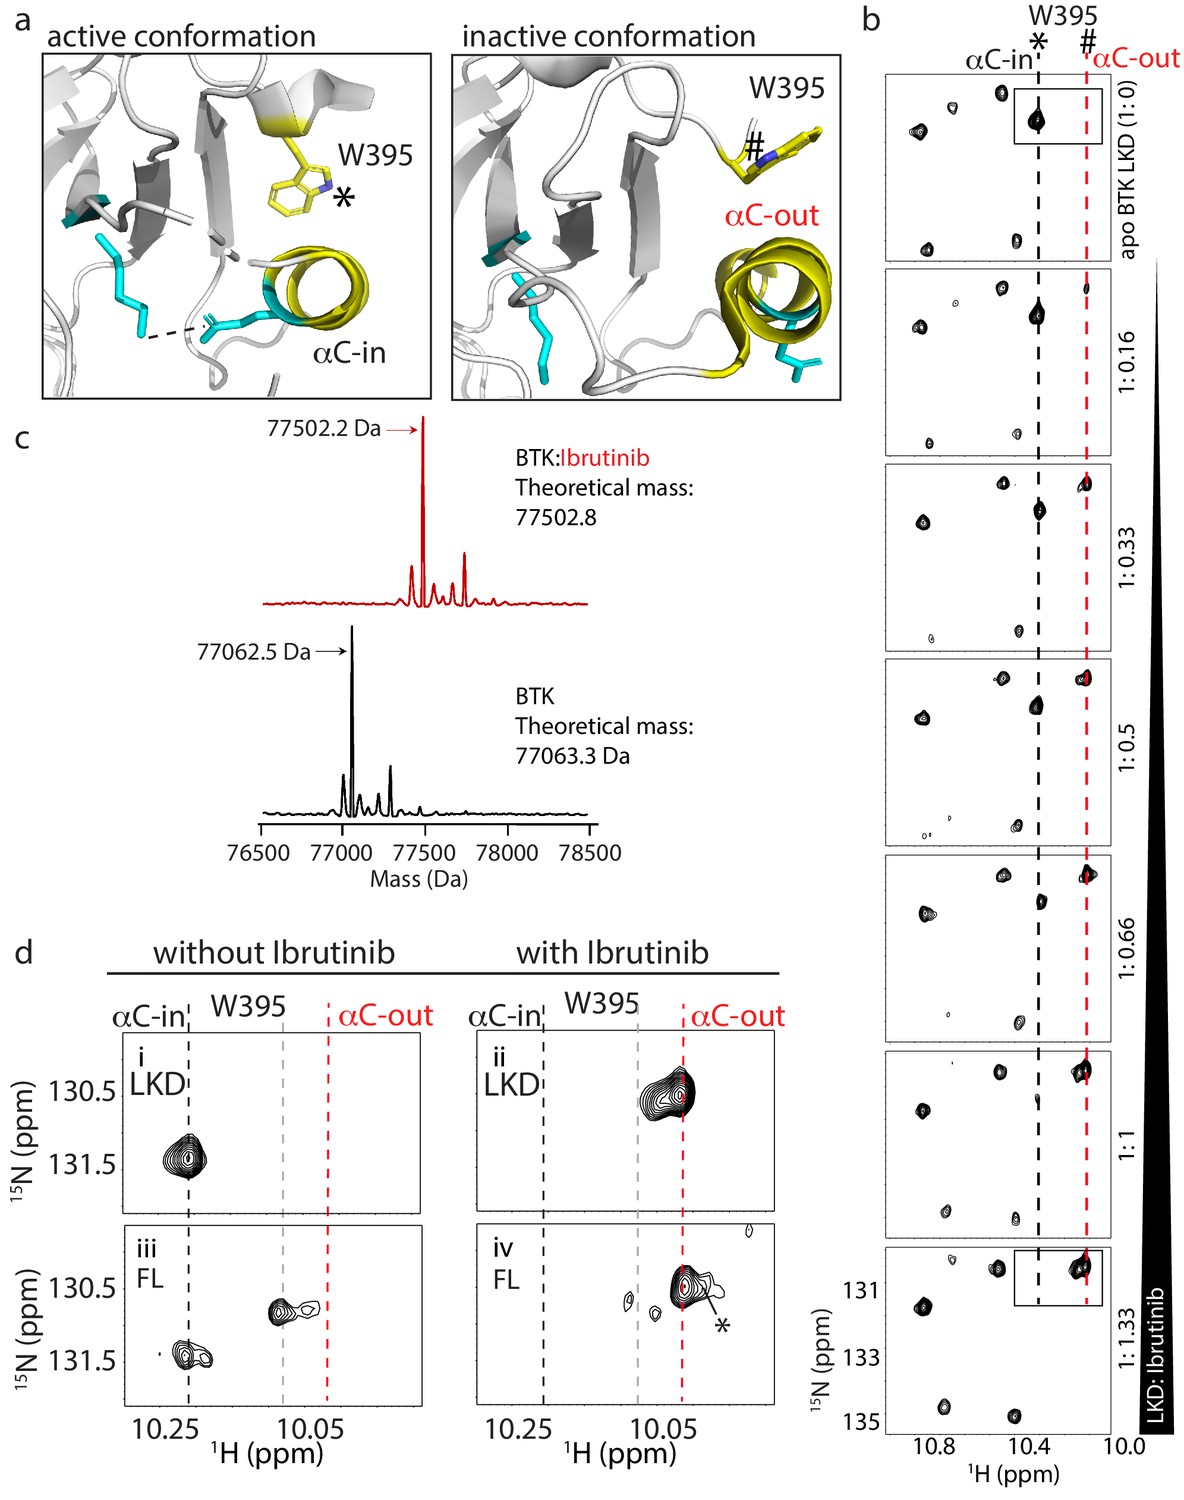
W395 indole NH resonance reports on the conformation of BTK.
(a) Close-up of the structural differences surrounding the αC helix, W395, and the Lys/Glu salt bridge for structures of the active Bruton’s tyrosine kinase (BTK) kinase domain conformation (PDB ID: 3K54) and the inactive BTK kinase domain conformation (PDB ID: 5P9J). W395 and the αC helix are labeled depicted in yellow while the Lys/Glu sides chains are shown in cyan (as in Figure 1d). A dashed line between the Lys/Glu pair indicates the presence of the salt bridge between these side chains in the active kinase conformation. The downfield resonance in (b) corresponds to the W395 indole NH indicated with * and the upfield resonance in (b) corresponds to the W395 indole NH indicated with #. (b) Titration of Ibrutinib into 15N-labeled BTK LKD. Tryptophan side chain region of the 1H-15N TROSY HSQC spectrum of BTK LKD shows that addition of increasing concentrations of Ibrutinib (top to bottom) decreases the intensity of the downfield BTK W395 resonance (corresponding to the kinase active (αC-in) conformation, dashed black line), and increases the intensity of the W395 resonance in the upfield position, corresponding to the kinase inactive (αC-out) state (dashed red line). The molar ratio of linker kinase domain (LKD) to Ibrutinib is indicated on the left of each panel. All samples contain the same DMSO concentration. The * and # symbols are defined in (a). (c) Intact mass analysis of wild-type FL BTK before (bottom spectrum, black) and after 15-min incubation with a twofold molar excess of Ibrutinib (top spectrum, red) showing a mass increase of one Ibrutinib molecule. The peaks corresponding to the mass of BTK or BTK:Ibrutinib are identified with arrows. (d) Expanded tryptophan side chain region of the 1H-15N TROSY HSQC spectra showing the resonance(s) of W395 for BTK LKD and FL without (left, i and iii) and with Ibrutinib (right panels, ii and iv) The black dashed line in the most downfield position and the upfield red dashed line corresponds to that in (a). The gray dashed line indicates the position of the W395 1H frequency in FL BTK in the apo inactive (αC-out) state. Asterisk indicate the additional peak (W251) that is evident upon Ibrutinib binding to FL. All NMR samples contain 2% DMSO to ensure the solubility of Ibrutinib. At this concentration, DMSO does not perturb the structure of the protein as comparison of 1H-15N TROSY HSQC spectra of the BTK proteins in the presence or absence of 2% DMSO shows no significant changes (data not shown).
Figure 2—figure supplement 1
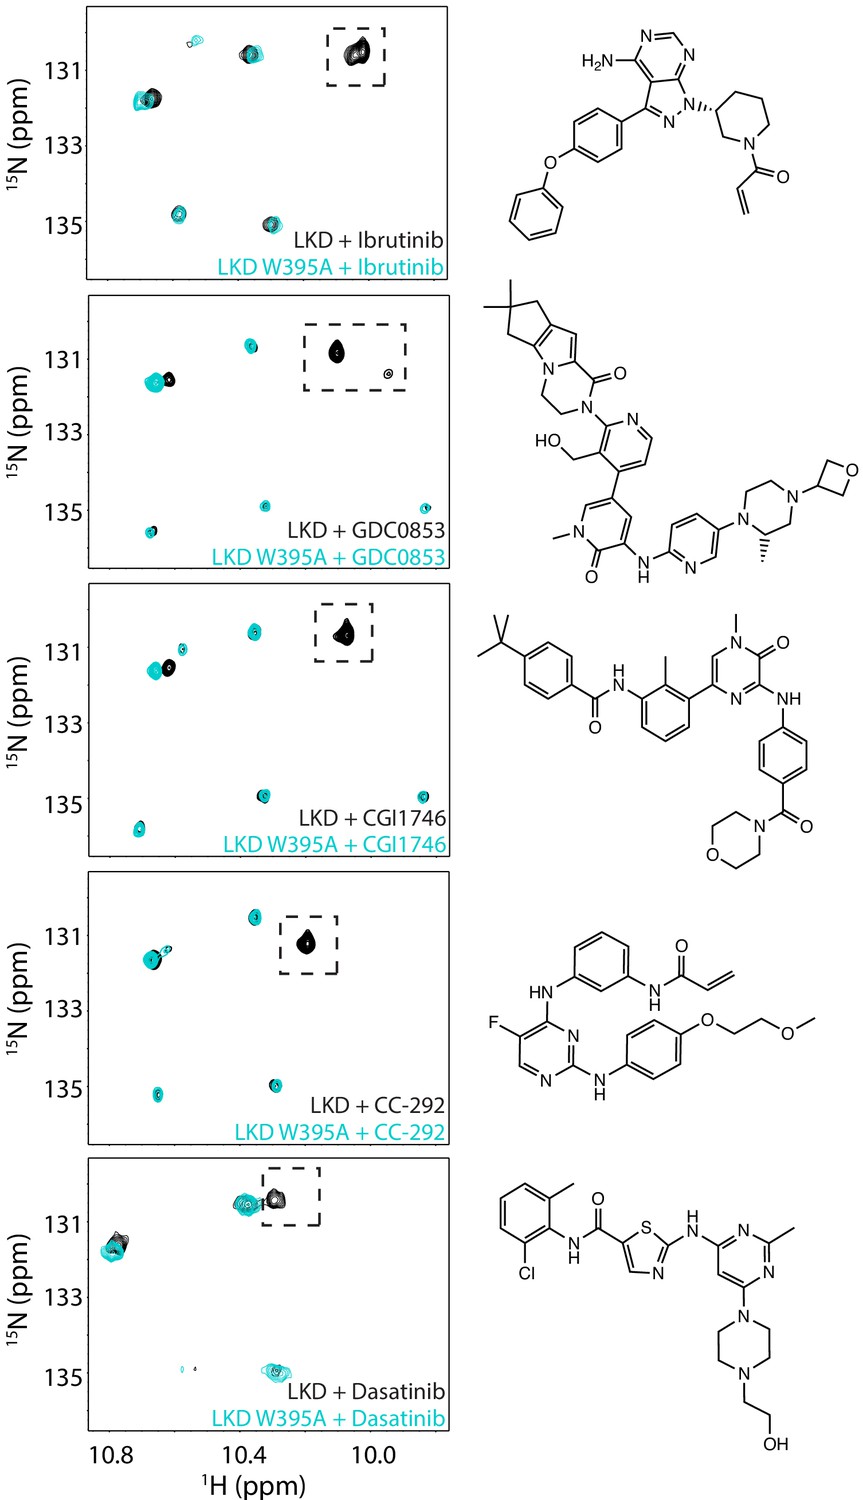
Assignment of W395 indole NH resonance in the inhibitor-bound spectra of BTK linker kinase domain (BTK LKD).
Spectral overlay of 15N-labeled BTK LKD wild-type (black spectrum) and LKD W395A mutant (cyan spectrum) in the presence of the five inhibitors. The broken boxed peak corresponds to the BTK W395 resonance that is missing in each of the W395A mutant spectra. The structures of the inhibitors are shown on the right.
Figure 2—figure supplement 2
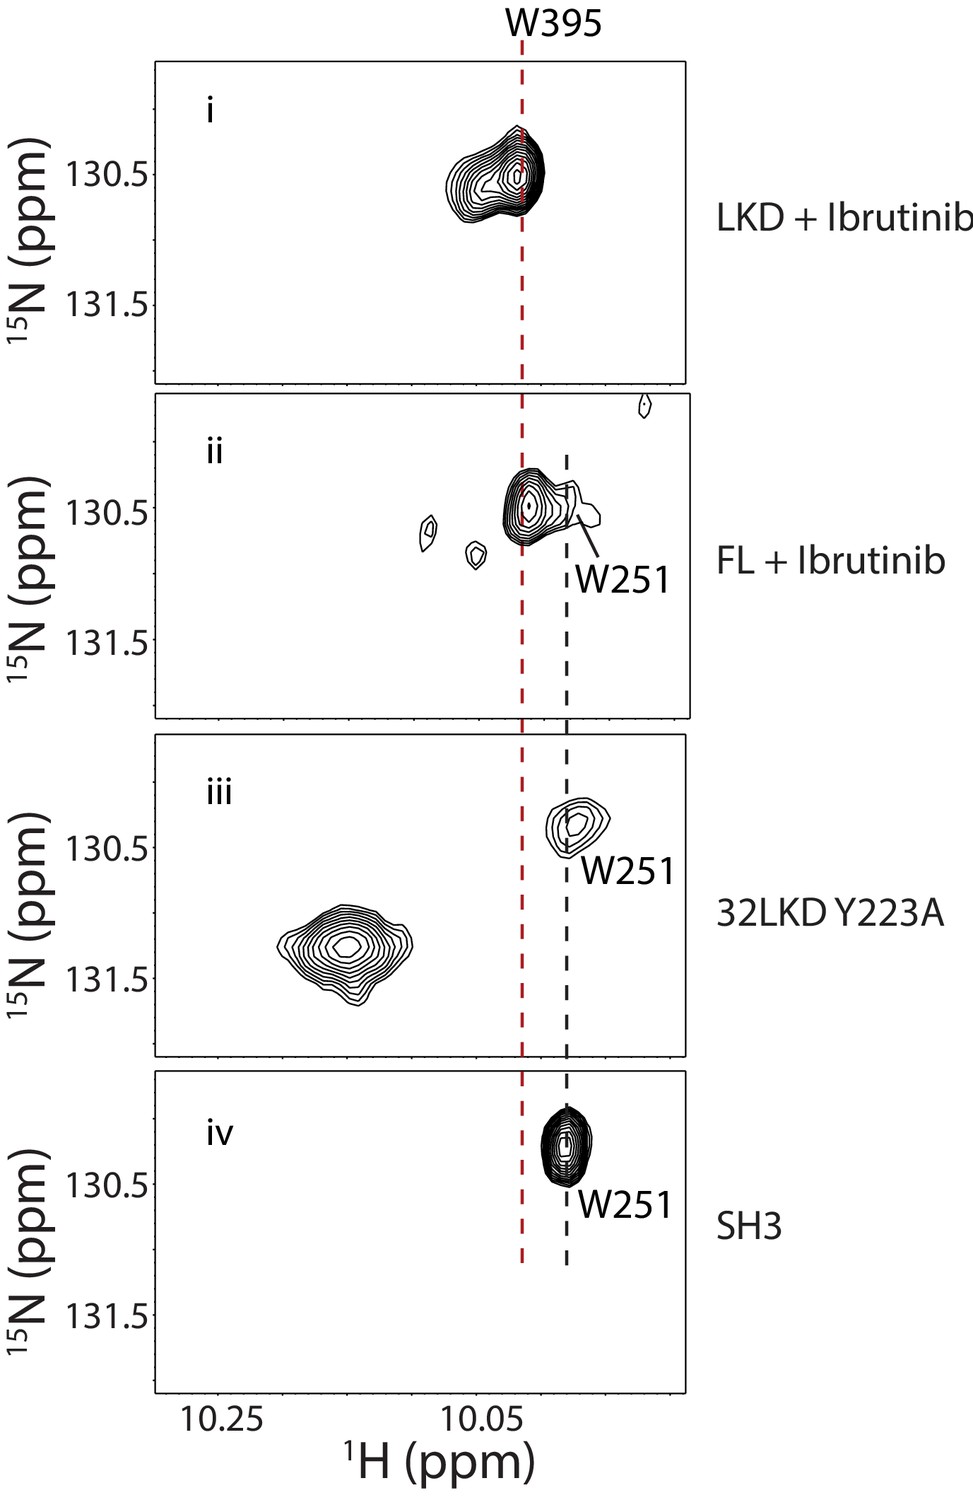
NMR data indicate that Ibrutinib binding to BTK FL releases the SH3 domain from the autoinhibited conformation.
Tryptophan side chain region of the 1H-15N TROSY HSQC spectra of 15N-labeled Ibrutinib-bound BTK linker kinase domain (i) or BTK FL (ii) compared to apo BTK 32LKD Y223A (iii) and the isolated BTK SH3 domain (iv). The BTK Y223A mutation has been previously shown to disrupt the autoinhibited conformation of BTK by releasing the SH2-kinase linker from the SH3 domain (Joseph et al., 2017). W251 resonance in the BTK SH3 domain is labeled, and the gray dashed line shows the position of the W251 resonance in spectra (ii) and (iii). The broken red line indicates the position of W395 resonance in the Ibrutinib-bound state.
Figure 3
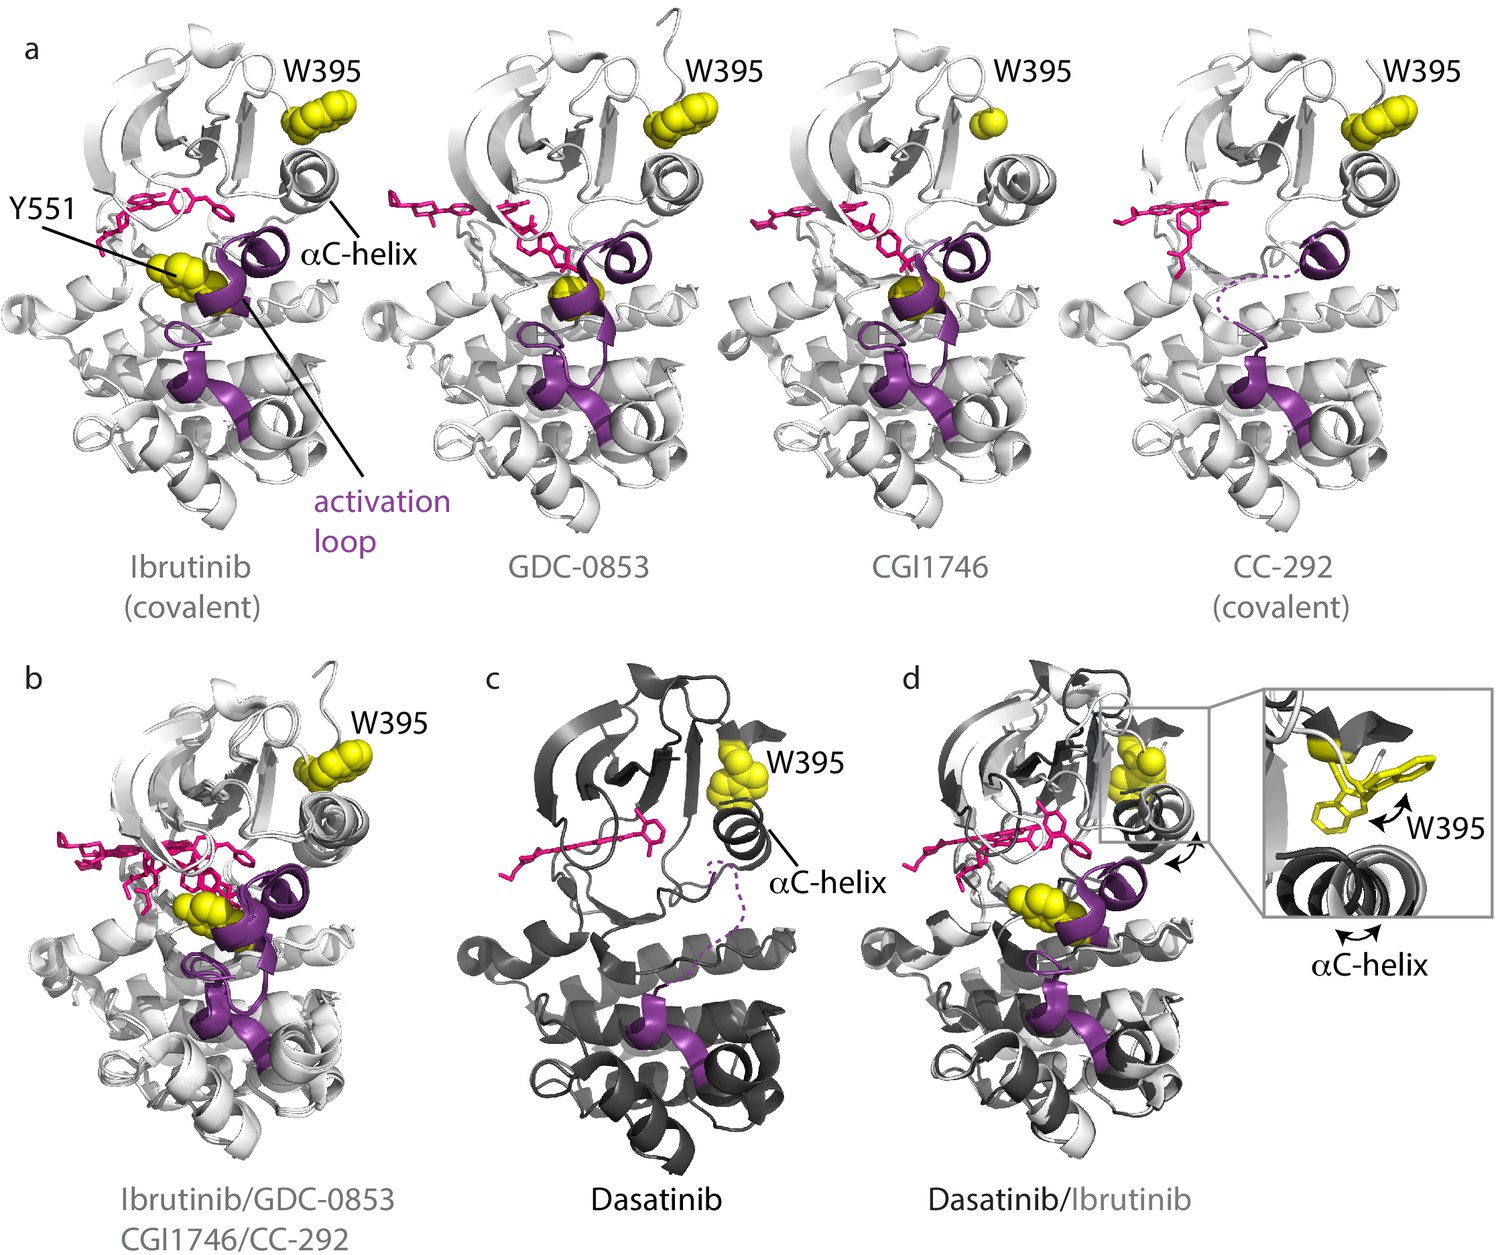
Inhibitors stabilize different conformations of the BTK kinase domain.
(a) Co-crystal structures of BTK linker-kinase domain (light gray cartoon) bound to Ibrutinib (PDB ID: 5P9J), GDC-0853 (PDB ID: 5VFI), CGI1746 (PDB ID: 3OCS), and CC-292 (PDB ID: 5P9L) in the inactive kinase conformation. The inhibitors are shown as pink sticks, the kinase activation loop is purple and the Y551 and W395 residues are shown as yellow spheres. The αC-helix is labeled in the first structure and the two irreversible, covalent inhibitors, Ibrutinib and CC-292, are indicated. Electron density for W395 in the BTK:CGI1746 co-crystal structure and part of the activation loop (purple dashed line) in the BTK:CC-292 co-crystal structure is missing. (b) Superposition of the BTK:Ibrutinib, GDC-0853, CGI1746, and CC-292 co-crystal structures shows no major structural variations in the kinase domains. (c) Structure of BTK linker-kinase domain (dark gray cartoon) bound to Dasatinib (PDB ID: 3K54) in the active kinase conformation. The activation loop is missing in the structure and is shown as a purple dashed line. Dasatinib is shown as pink sticks, W395 (yellow spheres) and the αC-helix are labeled. (d) Superposition of the Dasatinib- (dark gray) and Ibrutinib-bound (light gray) BTK linker-kinase co-crystal structures show the inward movement of the αC-helix and the change in W395 rotamer conformation that accompanies kinase activation (see expanded inset). The BTK:Dasatinib crystal complex was obtained by co-crystallization, whereas the other BTK drug complexes were obtained by soaking BTK crystals with the drug (Bender et al., 2017; Marcotte et al., 2010).
Figure 4

Assessing the BTK kinase domain conformational state as a function of inhibitor binding by solution NMR.
The structures of each inhibitor are shown on the right. The broken lines show the positions of the BTK W395 resonance in the active (αC-in) and inactive (αC-out) states as in Figure 2b. (a) The tryptophan side chain region of the 1H-15N TROSY HSQC spectra of 15N-labeled apo BTK linker-kinase domain (top panel) or bound to various inhibitors (below). The BTK W395 NH resonance (boxed peak) is in the inactive position in the Ibrutinib-, GDC0853-, and CGI1746-bound BTK LKD samples. The BTK W395 resonance is maintained in the active, downfield position in the BTK:CC-292 complex and shifted further downfield in the spectrum of the BTK:Dasatinib complex. The chemical shift change observed for A524 resonance in the BTK LKD:CC-292-bound spectrum confirms the binding of CC-292 to BTK LKD despite lack of change in the W395 resonance. (b) The tryptophan side chain region of the 1H-15N TROSY HSQC spectra of 15N-labeled apo BTK full-length (top panel) or bound to various inhibitors (below). The BTK W395 NH resonance is in the inactive (αC- out) position in the Ibrutinib-, GDC0853-, and CGI1746-bound BTK FL samples. Multiple peaks are observed spanning the active and inactive positions of W395 in the CC-292-bound BTK FL spectrum suggesting that the kinase domain is dynamic and adopts a range of conformations. The W395 resonance is broadened beyond detection in the Dasatinib-bound BTK FL spectrum.
Figure 5
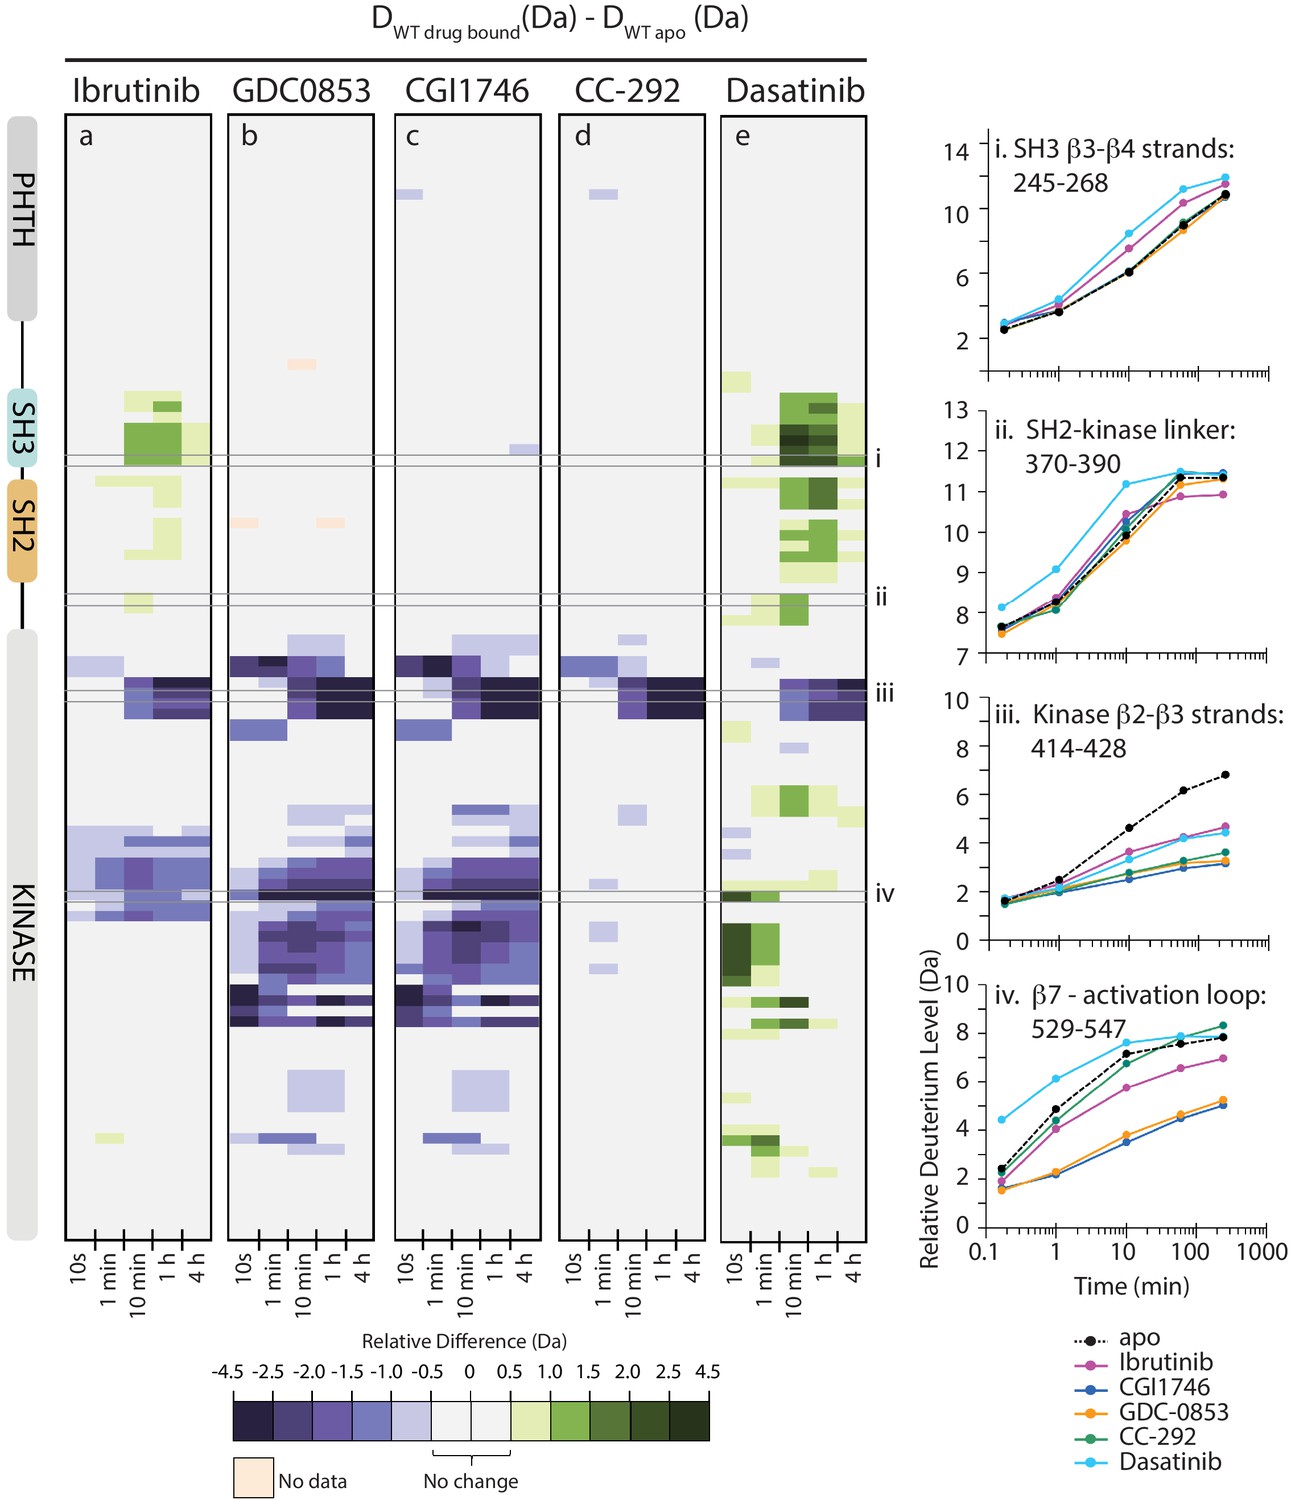
Active site inhibitors induce different conformational responses in full-length BTK.
(a–e) The measured relative deuterium level of peptides in apo BTK was subtracted from the deuterium level of the corresponding peptide from each drug-bound form of BTK (Ddrug-bound-Dapo) and the differences colored according to the scale shown. In this and subsequent figures, peptic peptides are shown from N- to C-terminus, top to bottom, and the amount of time in deuterium is shown left to right. The relative difference data shown here represents a curated set of peptides that are coincident across all six states (apo and five drug-bound BTK forms). The identification of these chosen peptides, the relative difference values, and the complete data set for each state can be found in Source data 1. The approximate position of the domains of BTK, as described in Figure 1a, is shown at the left. Deuterium uptake curves of selected peptides (indicated with a gray box in panels a-e and labeled i-iv) from various regions of the protein are shown on the right.
Figure 6
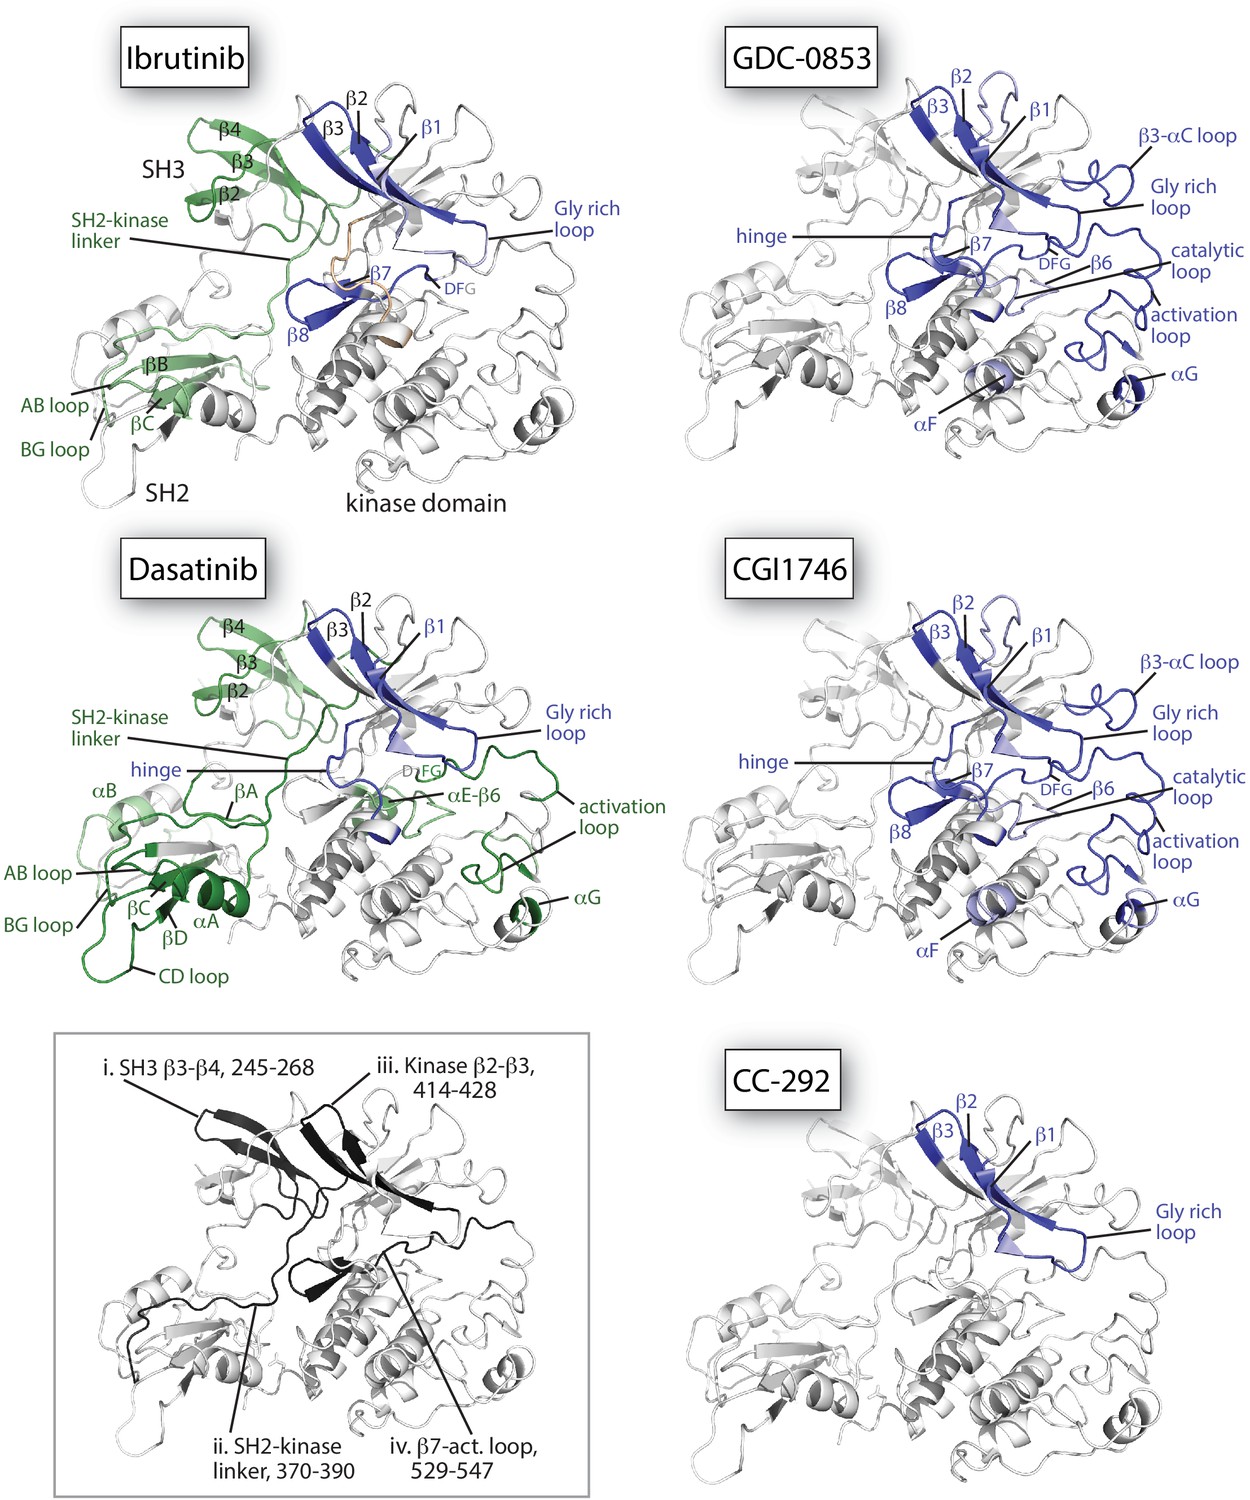
Mapping HDX-MS changes induced by each drug on the structure of the BTK SH3-SH2-kinase fragment (PDB ID: 4XI2).
For the five drug:BTK complexes the colors from Figure 5 are used: major differences greater than 1.0 Da are shown as dark blue (decrease) or dark green (increase); modest differences between 0.5 Da and 1.0 Da are shown as light blue (decrease) and light green (increase). Localization of the changes in deuterium incorporation was accomplished using overlapping peptides included in the complete peptide data set provided in Source data 1. The inset shows the location of peptides i – iv from Figure 5 (each peptide is black and labeled with residue numbers spanning the N- to C-termini of the peptic fragment).
Figure 7
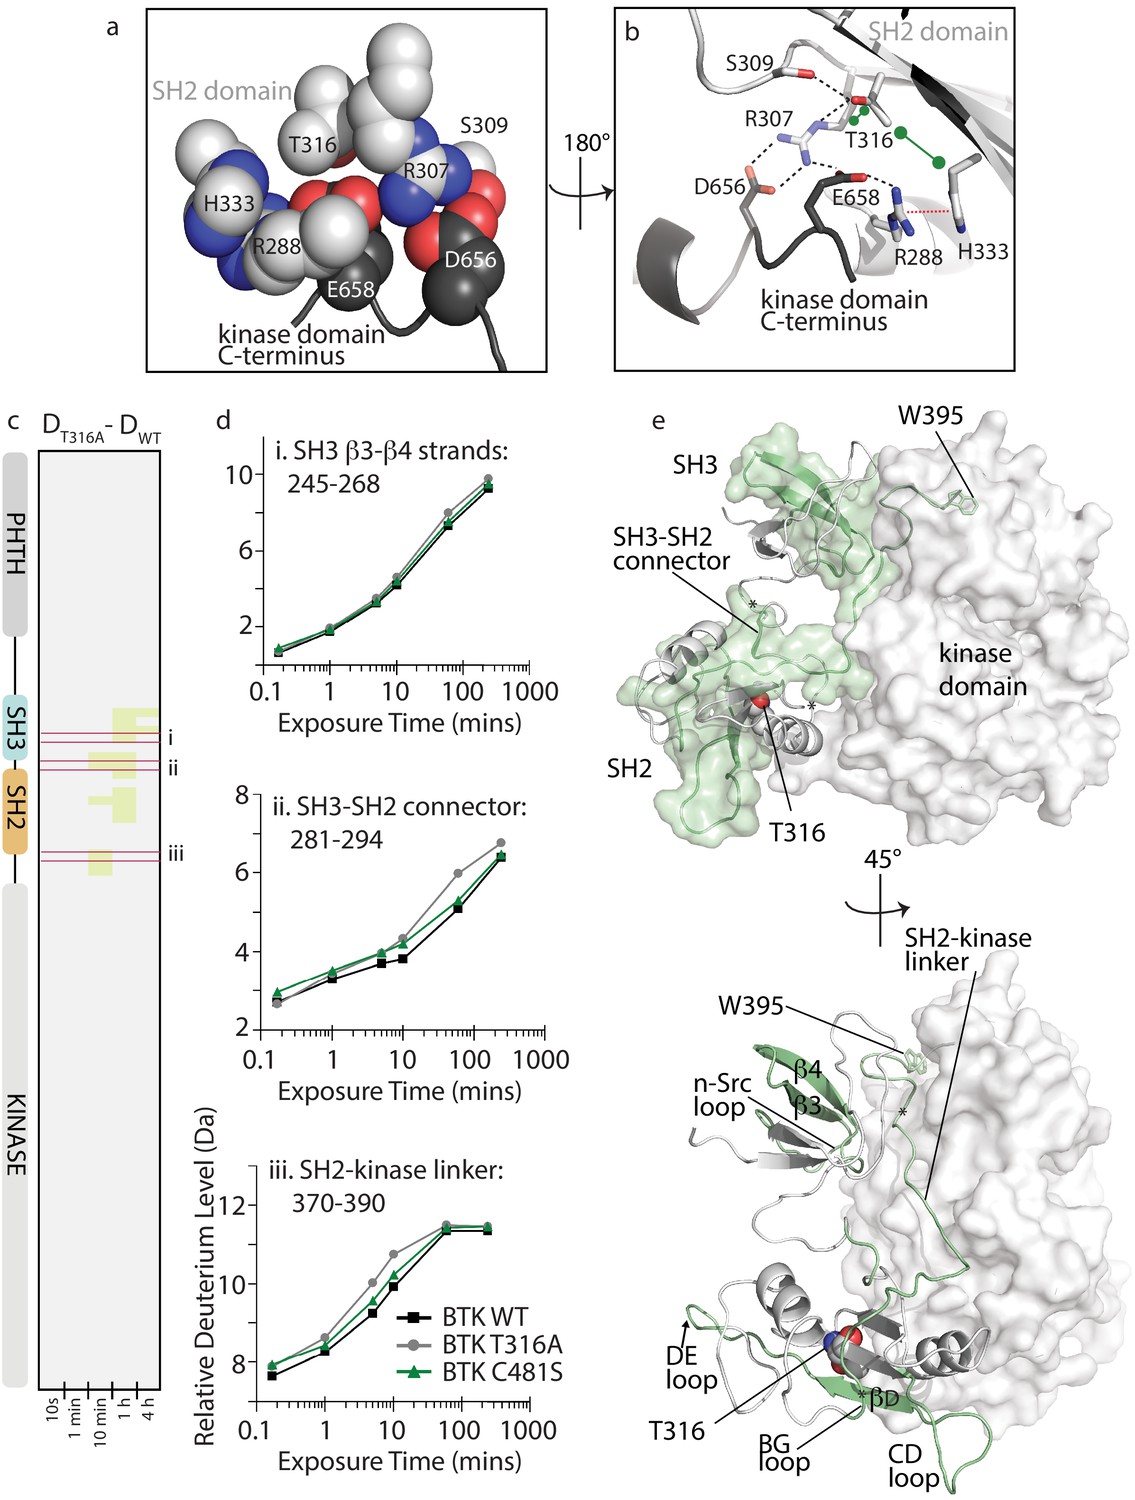
BTK T316A mutation disrupts the autoinhibitory conformation of BTK.
(a,b) Close-up views of the BTK 32LKD structure (PDB ID: 4XI2) illustrating the network of interactions involving the side chain of T316. In (a), the sidechains are depicted in spheres and labeled, all SH2 sidechains are in light gray, and the two sidechains from the kinase domain C-terminus are in dark gray. Using the same color scheme, the structure is rotated in (b) and shows the sidechains in stick format as well as the cartoon of this part of the SH2 domain structure. Black dashed lines indicate potential for hydrogen bonds, the red dashed line indicates a cation-pi interaction, and the green dumbbell indicates potential for hydrophobic packing. (c) HDX difference data for the BTK T316A mutant (DT316A-DWT). Color scale and peptide/time course arrangement are the same as in Figure 5. See Source data 1 for additional information, including all peptide identifications and deuterium values. (d) Deuterium uptake curves from peptides indicated by red boxes in panel c, (labeled i, ii, and iii), which show an increase in deuterium uptake in the BTK T316A mutant versus BTK WT. (e) Two views of the structure of BTK 32LKD (PDB ID: 4XI2) showing the regions of increased deuteration (green surface and cartoon) upon T316A mutation. T316 sidechain in the BTK SH2 domain is indicated in spheres. Specific regions of secondary structure in the SH3 and SH2 domains that are more deuterated upon T316A mutation are labeled in the lower panel.
Figure 8 with 2 supplements
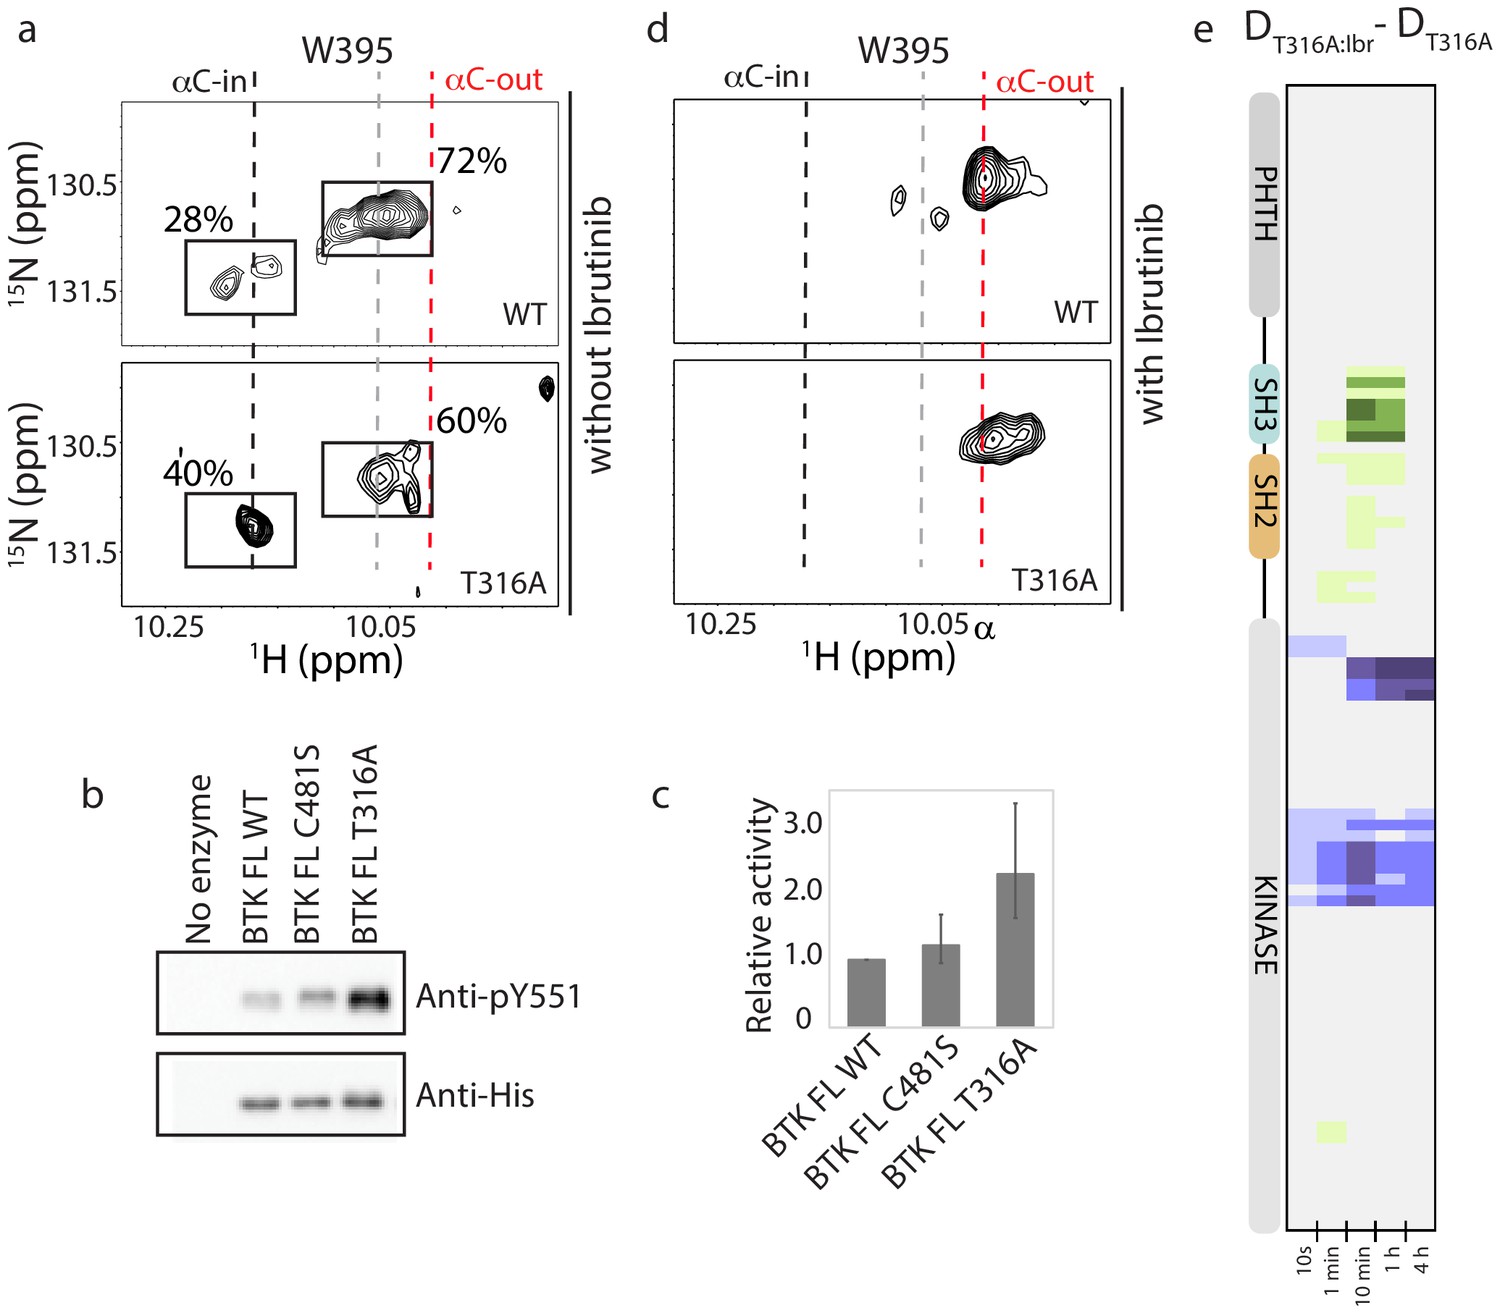
BTK T316A mutation increases the population of active BTK.
(a) Tryptophan side chain region of the 1H-15N TROSY HSQC spectra of full-length BTK WT and T316A in the absence of Ibrutinib and DMSO. The black, gray and red dashed lines are as described for Figure 2d. The relative intensities of the peaks corresponding to the active (αC-in) and inactive (αC-out) kinase domain conformations are indicated as percentages. (b) Western blot comparing the kinase activity of full-length (FL) BTK wild-type, C481S and T316A mutants. BTK autophosphorylation monitored using the BTK pY551 antibody and the total protein levels monitored using the Anti-His antibody. (c) Histogram quantifying the western blots shown in (b). The blots were quantified and normalized as described in the Materials and methods. Data shown are the average of three independent experiments. Phosphorylation levels of FL BTK WT, C481S, and T316A on Y551 were undetectable by western immuno-detection prior to the start of the activity assay. (d) Tryptophan side chain region of the 1H-15N TROSY HSQC spectra of full-length BTK WT and T316A in the presence of Ibrutinib. (e) HDX difference data upon Ibrutinib binding to BTK T316A (DT316A:Ibr-DT316A). Color scale and peptide/time course arrangement are the same as in Figure 5. See Source data 1 for additional information, including all peptide identifications and deuterium values. A side-by-side comparison of data in (e) with data in Figure 5 is provided in Figure 8—figure supplement 1.
Figure 8—figure supplement 1
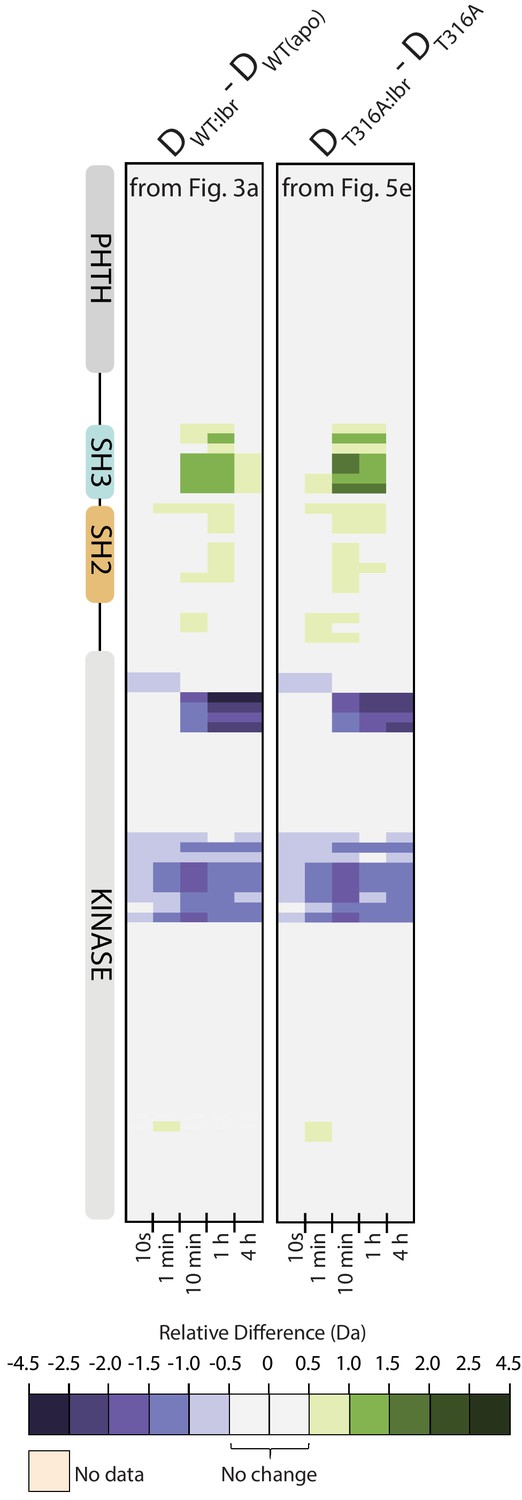
Side-by-side comparison of HDX-MS data from Figure 5 and Figure 8.
See also Source data 1.
Figure 8—figure supplement 2
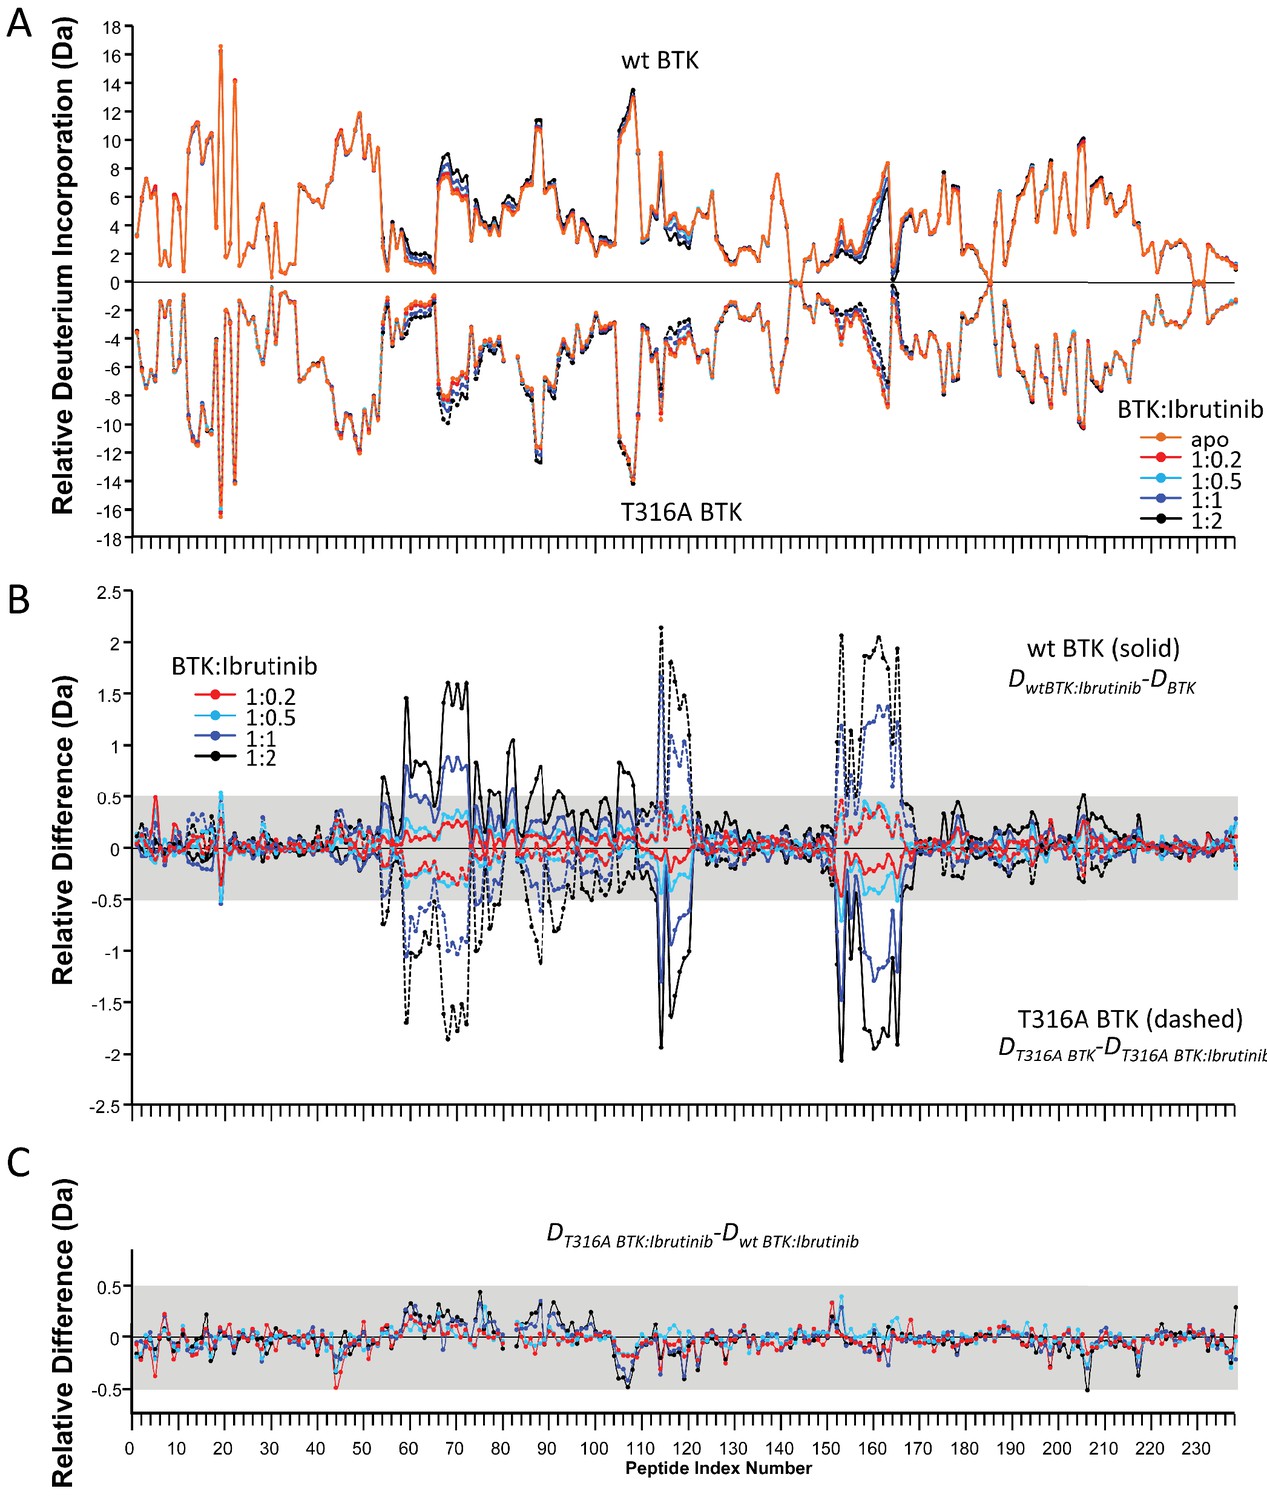
HDX-MS Ibrutinib titration into FL BTK wild-type or T316A.
For clarity, each peptide is given a peptide index number ordered from N-to-C-terminal, as listed in Source data 1 The varying molar ratios of Bruton’s tyrosine kinase (BTK) to Ibrutinib are colored separately (orange: apo BTK; red: 1:0.2; cyan: 1:0.5; blue: 1:1; black: 1:2). Note that all other HDX-MS studies outside this titration are performed using the black ratio, BTK:Ibrutinib 1:2, see Materials and methods. (A) Relative deuterium incorporation for wild-type (top, solid line) and T316A (bottom, dashed line) measured at 10 min. (B) Relative difference in deuterium incorporation for wild-type (solid line) and T316A (dashed line) as described by the equations shown. The gray band indicates differences that are too small to be considered meaningful based on the error of the measurements. (C) Relative difference in deuterium incorporation between FL BTK wild-type and T316A BTK conjugated to Ibrutinib as described by the equation shown. The gray band is as described in panel b.
Figure 9
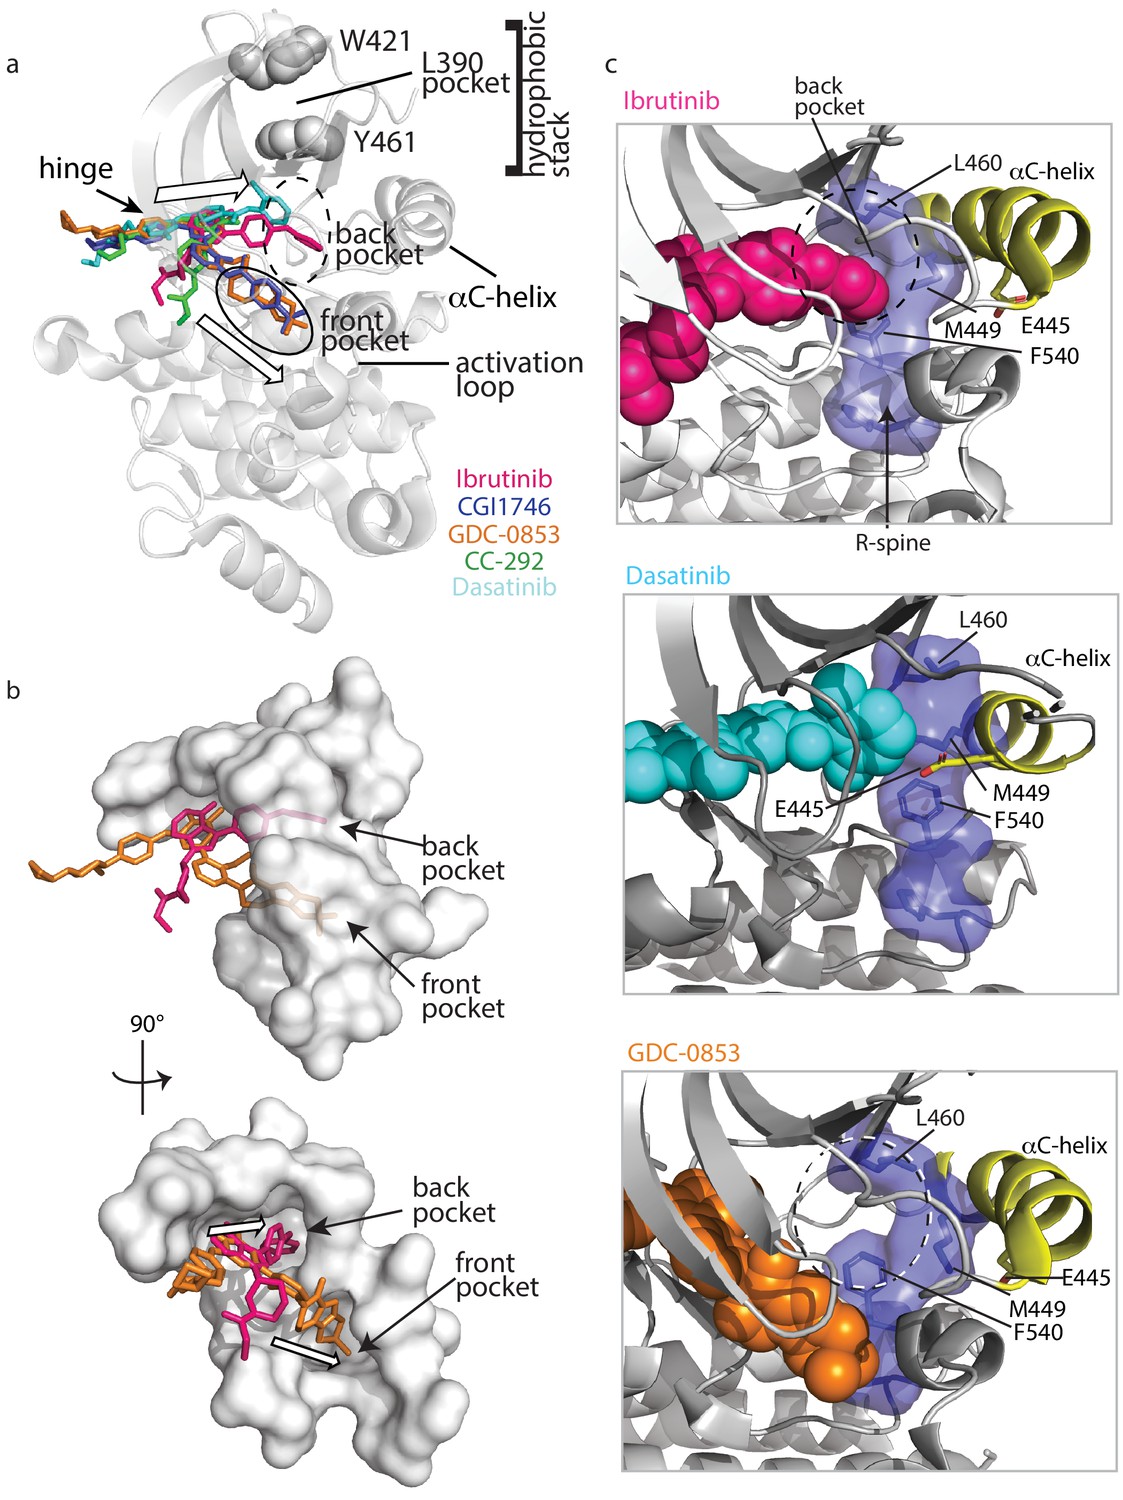
Ibrutinib and Dasatinib occupy the back pocket of the BTK active site.
(a) Superposition of the five inhibitor-bound structures of BTK linker-kinase domain (gray cartoon) show that Dasatinib and Ibrutinib are oriented toward the back of the kinase and GDC-0853, CGI1746, and CC-292 fill the front pocket. The five drugs are displayed as sticks and colored as in Figure 5, and only one kinase domain is included for clarity. (b) An enlargement of the region surrounding the active site, with surface rendering of the active site pockets. Two views are shown and only Ibrutinib and GDC-0853 are included for clarity as they represent the two binding modes. (c) Close-up view of the BTK active site with Ibrutinib (top), Dasatinib (middle), and GDC-0853 (bottom) depicted in spheres. L460 lines the kinase back pocket. The R-spine is shown in blue sticks and transparent surface with L460, M449, and F540 labeled. The αC-helix is in yellow with E445 shown in sticks.
Additional files
-
Source data 1
Microsoft Excel file providing enhanced experimental details for HDX-MS (including minimum criteria specified by Masson et al., 2019), peptic peptide maps, lists of all peptides by residue number and sequence, and deuterium levels measured for each Figure.
The value of each deuterium difference for every colored box in each Figure can be found in this file.
- https://cdn.elifesciences.org/articles/60470/elife-60470-data1-v2.xlsx
-
Transparent reporting form
- https://cdn.elifesciences.org/articles/60470/elife-60470-transrepform-v2.docx
Download links
A two-part list of links to download the article, or parts of the article, in various formats.
Downloads (link to download the article as PDF)
Open citations (links to open the citations from this article in various online reference manager services)
Cite this article (links to download the citations from this article in formats compatible with various reference manager tools)
Differential impact of BTK active site inhibitors on the conformational state of full-length BTK
eLife 9:e60470.
https://doi.org/10.7554/eLife.60470


