Switch-like control of helicase processivity by single-stranded DNA binding protein
- Department of Physics, University of Illinois, Urbana-Champaign, United States
- Center for Biophysics and Quantitative Biology, University of Illinois, Urbana-Champaign, United States
- Department of Biochemistry, Carver College of Medicine, University of Iowa, United States
- Center for the Physics of Living Cells, University of Illinois, Urbana-Champaign, United States
Figures
Figure 1 with 2 supplements
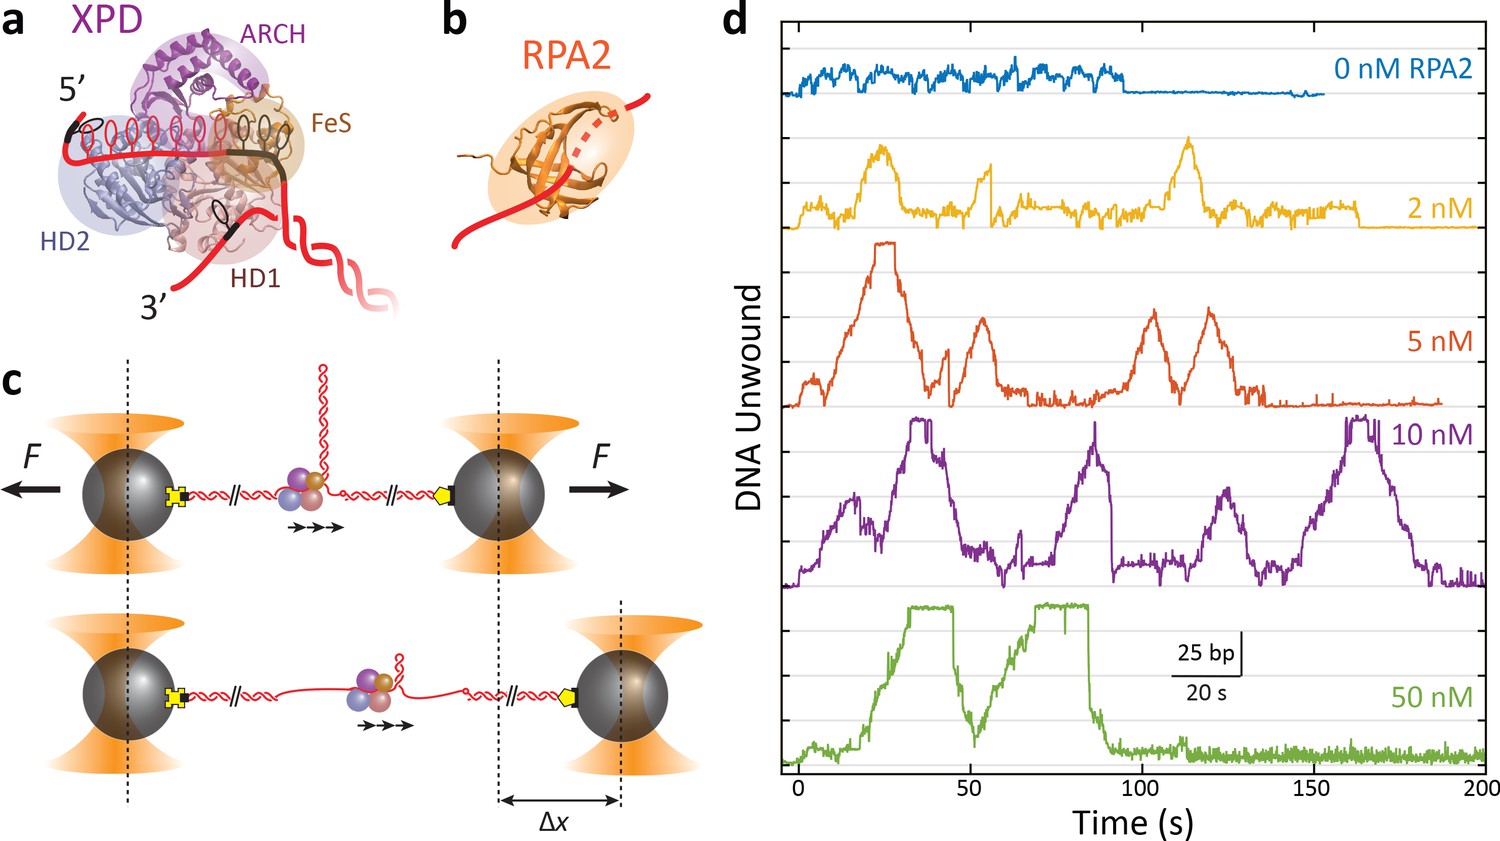
RPA2 increases xeroderma pigmentosum group D (XPD) helicase processivity.
(a) Schematic of FacXPD based on Sulfolobus acidocaldarius XPD structure (PDB 3CRV). XPD is composed of four domains: helicase domains 1 and 2 (HD1, pink; HD2, blue), which form the motor core, and the ARCH domain (purple) and FeS cluster (brown). A model of the DNA fork (red) shows ~10 nt bound to the motor core and secondary contacts (black) to each strand of the fork. (b) Schematic of FacRPA2 based on partial crystal structure of Methanococcus maripaludis replication protein A (RPA) (PDB 2K5V). RPA2 consists of a single OB-fold that binds to ssDNA in the C-shaped cavity. (c) Single-molecule hairpin unwinding assay. A DNA hairpin consisting of an 89 bp stem and (dT)4 loop is tethered between trapped beads by biotin–streptavidin (yellow cross) and digoxigenin-antibody linkages (pentagon) and held at a constant force. A 10 nt poly-dT site at the 5′ end of the hairpin allows one XPD molecule to load, and an abasic site at the 3′ end prevents XPD unwinding past the hairpin. Unwinding of the hairpin by XPD increases the end-to-end extension of the construct by an amount, Δx, proportional to the number of base pairs unwound. Arrows indicate the 5′ to 3′ direction of XPD translocation along ssDNA. (d) Representative traces of a single molecule of XPD unwinding in the presence of varying concentrations of RPA2 (0–50 nM) at constant force (F = 12 pN). ATP and RPA2 are added at t = 0 s. XPD processivity increases with RPA2 concentration.
Figure 1—figure supplement 1
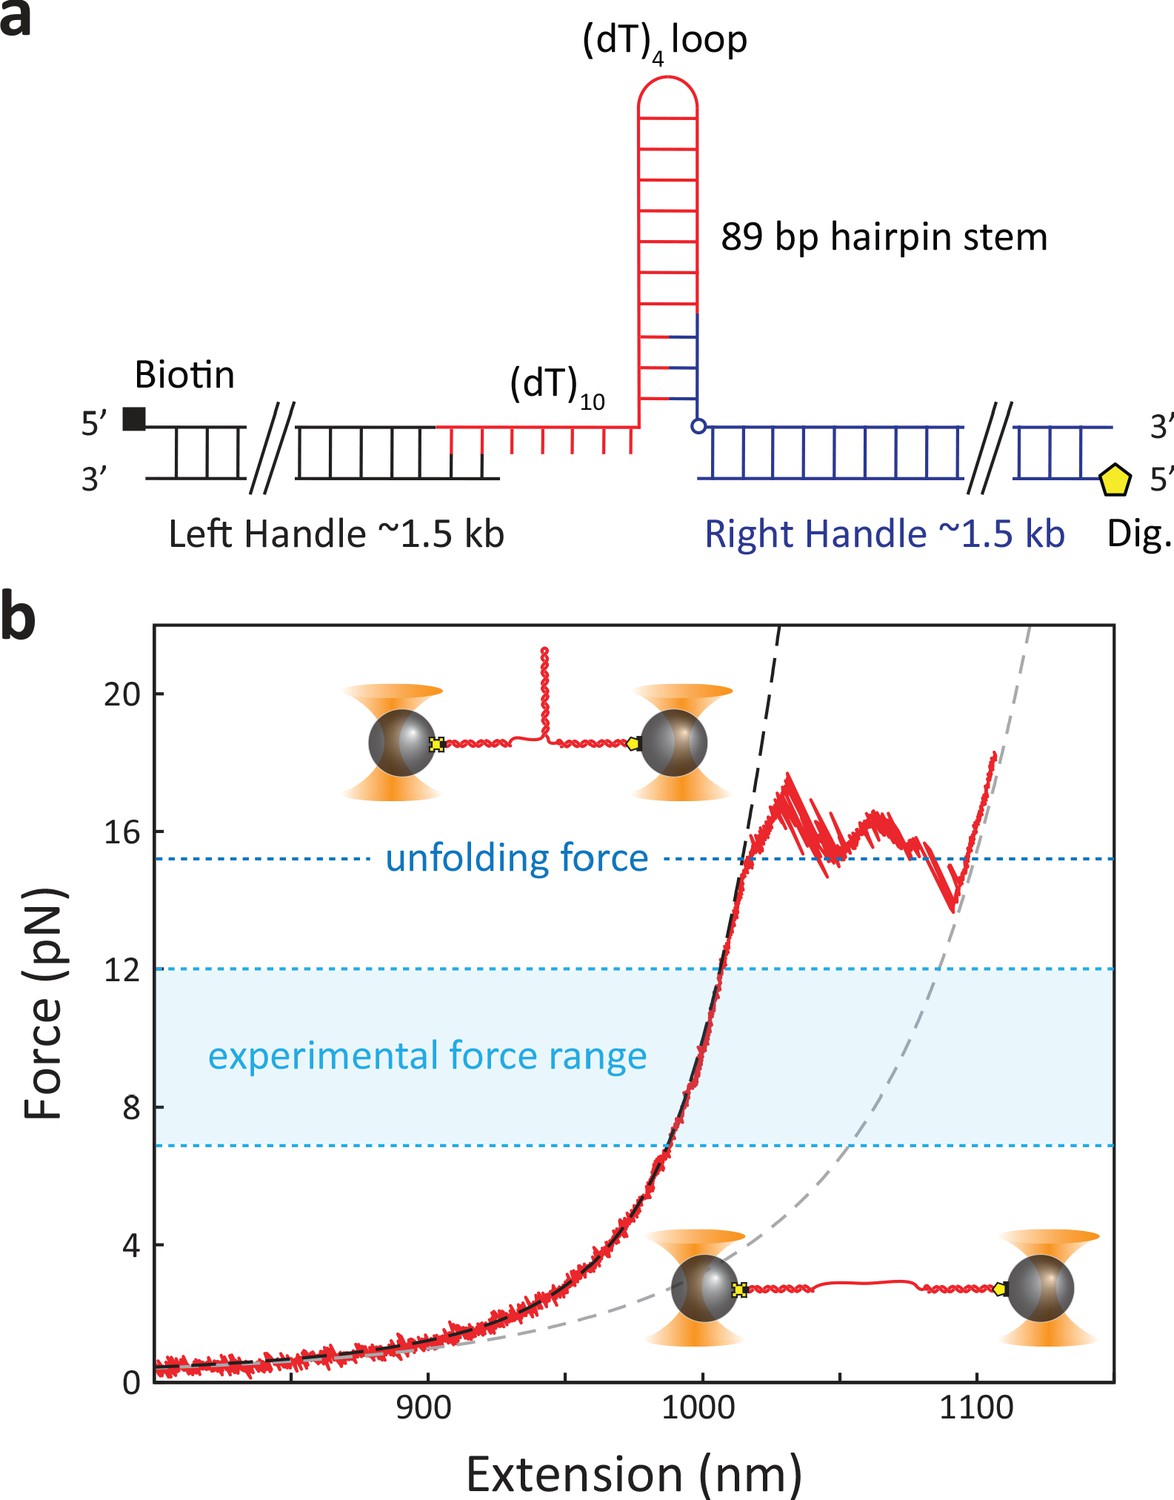
DNA hairpin construct.
(a) The hairpin construct consists of three ligated DNA fragments: left (black) and right (blue) dsDNA handles and an 89 bp hairpin that includes a 5′ 10 nt ssDNA protein loading site. The left and right handles are modified with a 5′ biotin (black square) and 5′ digoxigenin (yellow pentagon), respectively, for attachment to beads. (b) Representative force–extension curve of a DNA hairpin. The experimental curve (red solid line) is fit to a model of the closed (black dashed line) and open (gray dashed line) hairpin (see Materials and methods).
Figure 1—figure supplement 2
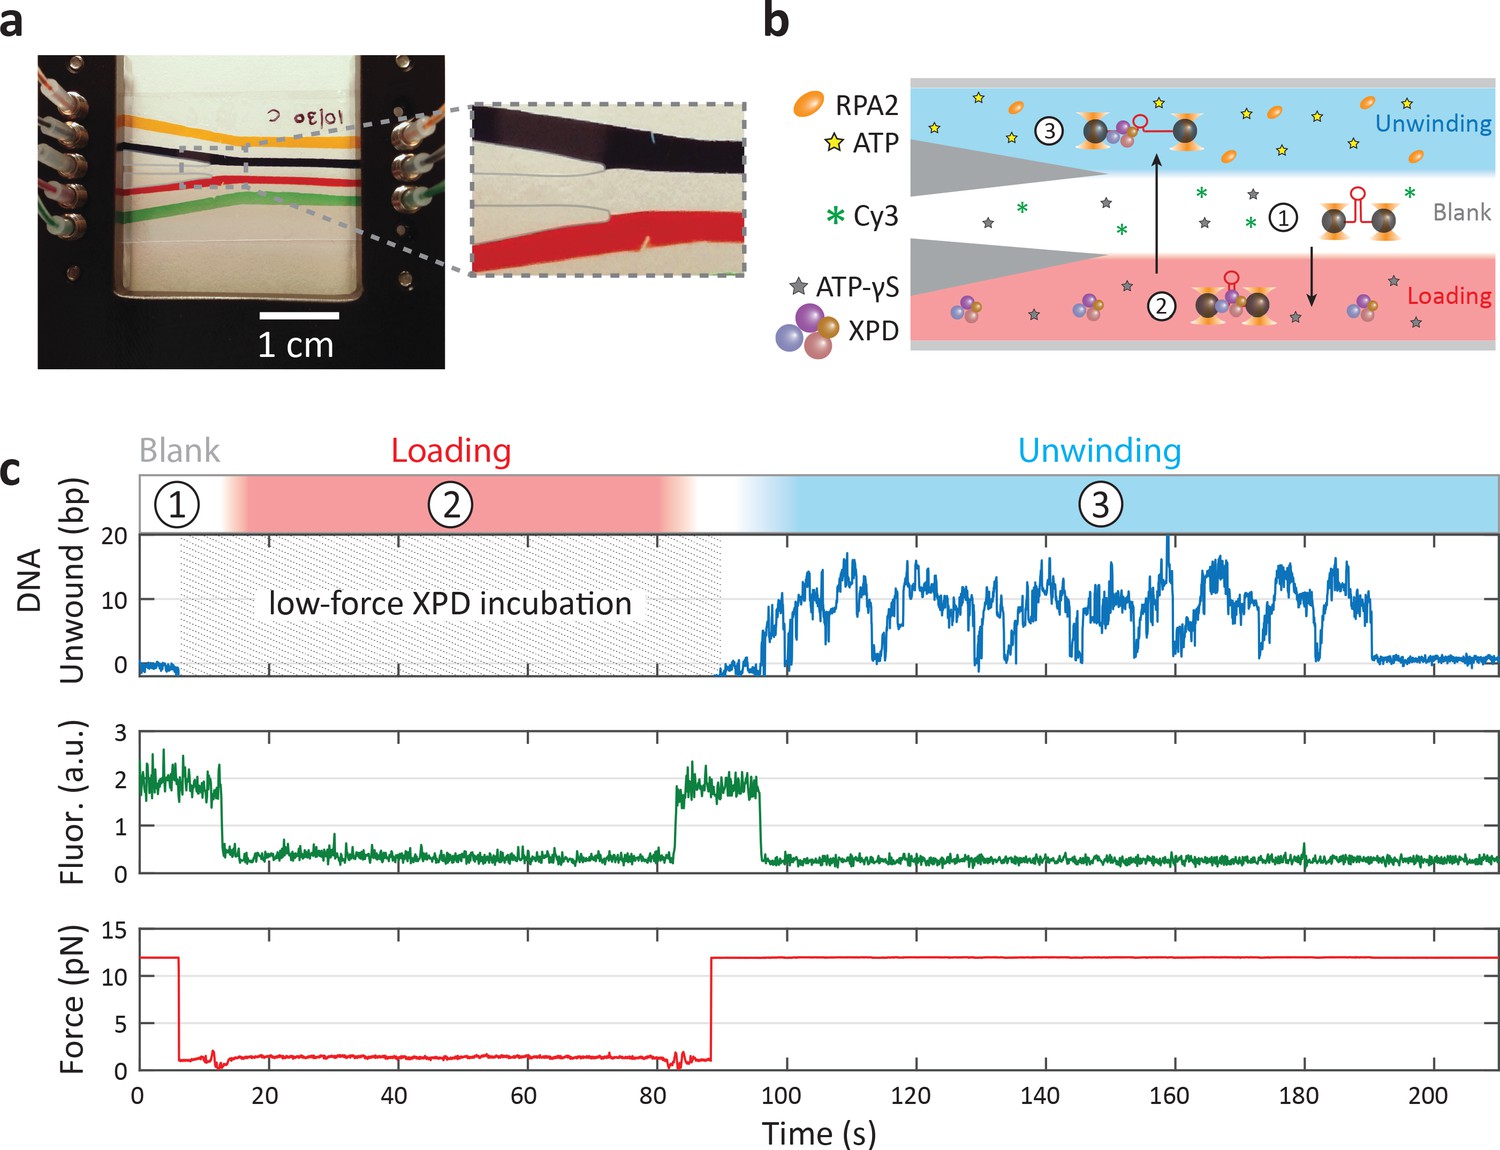
Laminar flow chamber.
(a) Photograph of laminar flow chamber. Colored food dye highlights the different flow streams. Parafilm in the central channel is recolored to enhance contrast. The bead channels (yellow and green) are connected via capillaries to the central trapping region (inset). Three streams (dark blue, uncolored, and red) meet in the center channel but mix minimally. (b) Typical experimental protocol. The ‘loading’ stream (red) of the central channel is filled with 60 nM xeroderma pigmentosum group D (XPD) and 500 μM ATP-γS, the ‘blank’ stream (white) with 500 μM ATP-γS, and the ‘unwinding’ stream (blue) with buffer containing 500 μM ATP and 0–50 nM replication protein A 2 (RPA2) (or 250 nM T4 gene protein 32), The dye Cy3 is added to the ‘blank’ stream to detect, via fluorescence imaging, the precise locations of the stream boundaries. A DNA hairpin is tethered between trapped beads in the blank stream (step 1), and its force–extension behavior characterized (see Figure 1—figure supplement 1). The trapped beads and DNA are next moved into the loading stream (step 2) for 40–60 s for a single XPD to bind at low force, ~2 pN. Then, they are moved into the unwinding stream (step 3) to initiate XPD unwinding as the force is increased and maintained constant. (c) Example trace of a single XPD unwinding at 12 pN and 0 nM RPA2. Colored regions and numbers above the trace correspond to chamber locations in (b). Cy3 fluorescence intensity indicates when the traps are in the blank stream. Unwinding activity begins as soon as XPD enters the unwinding stream (t = 95 s). XPD unwinds in repetitive ‘bursts’ of activity until it dissociates (t = 190 s).
Figure 2 with 1 supplement
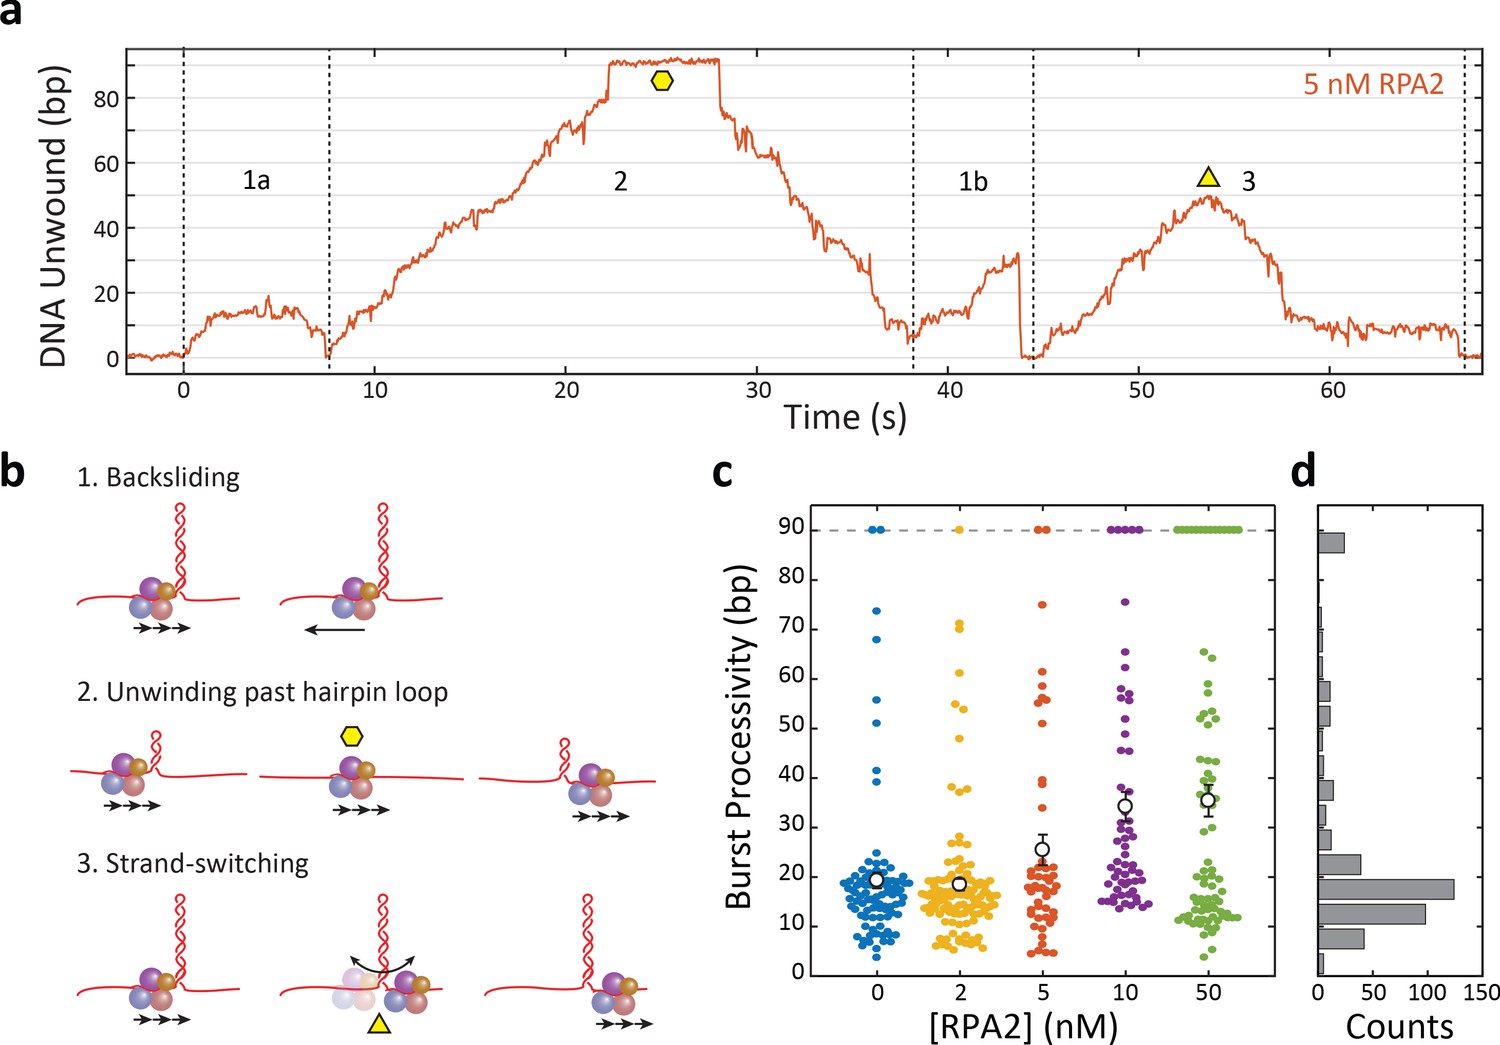
Xeroderma pigmentosum group D (XPD) unwinds in bursts of varying processivity whose average increases with replication protein A 2 (RPA2) concentration.
(a) Representative trace of a single molecule of XPD unwinding in the presence of RPA2 (5 nM) at constant force (F = 12 pN). One XPD exhibits repetitive bursts of activity, making multiple attempts to unwind hairpin DNA. Processivity can vary widely from burst to burst. Example time trace with (1a) 20 bp- and (1b) 30 bp-processivity bursts composed of forward unwinding followed by backsliding to the hairpin base; (2) a high-processivity burst during which XPD completely unwinds the 90 bp hairpin past the hairpin loop (time point indicated by yellow hexagon) and translocates on the opposing strand, allowing the hairpin to rezip; and (3) a 50 bp-processivity burst during which XPD unwinds and switches strand mid-hairpin (indicated by yellow triangle), allowing the hairpin to rezip. (b) Schematics representing the behaviors in (a). (c) Processivity of each burst (colored circles) vs. RPA2 concentration. The mean processivity (open circles) increases with RPA2 concentration. Error bars represent s.e.m. (d) Histogram of all burst processivities at all RPA2 concentrations.
-
Figure 2—source data 1
XPD burst processivity vs. [RPA2].
- https://cdn.elifesciences.org/articles/60515/elife-60515-fig2-data1-v2.xlsx
Figure 2—figure supplement 1
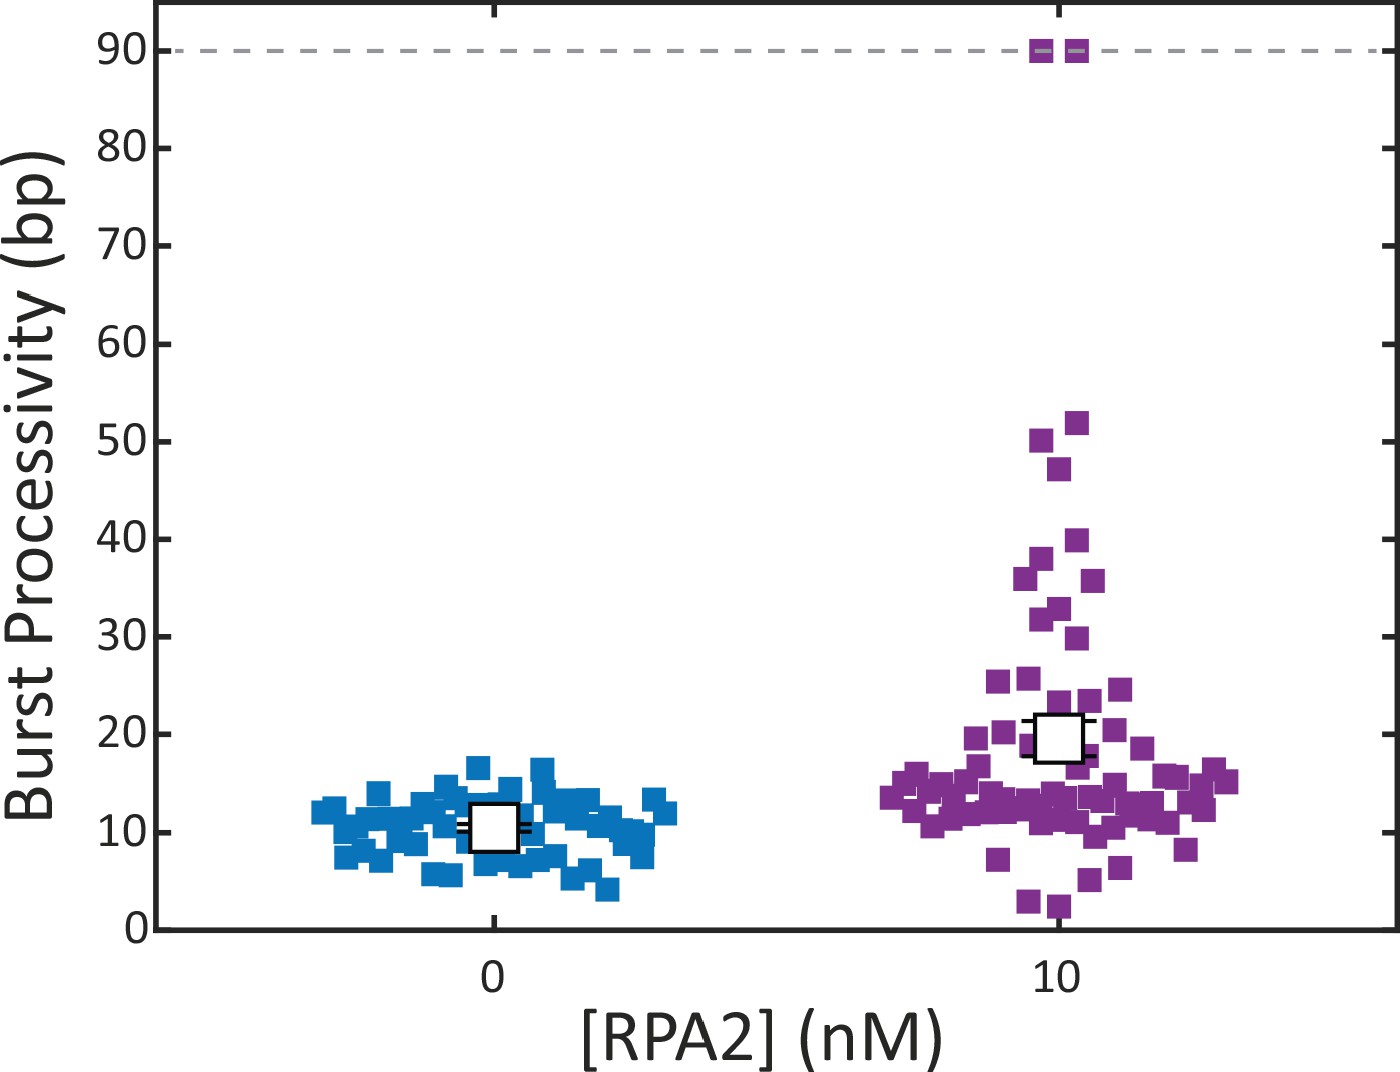
Xeroderma pigmentosum group D (XPD) burst processivity increases with replication protein A 2 (RPA2) concentration at a force of 9 pN.
Processivity of each burst (colored squares) for XPD alone (blue) and in the presence of RPA2 (10 nM; purple) at a constant force (F = 9 pN). The mean processivity (open squares) increases in the presence of RPA2. Error bars represent s.e.m. throughout.
Figure 3 with 4 supplements
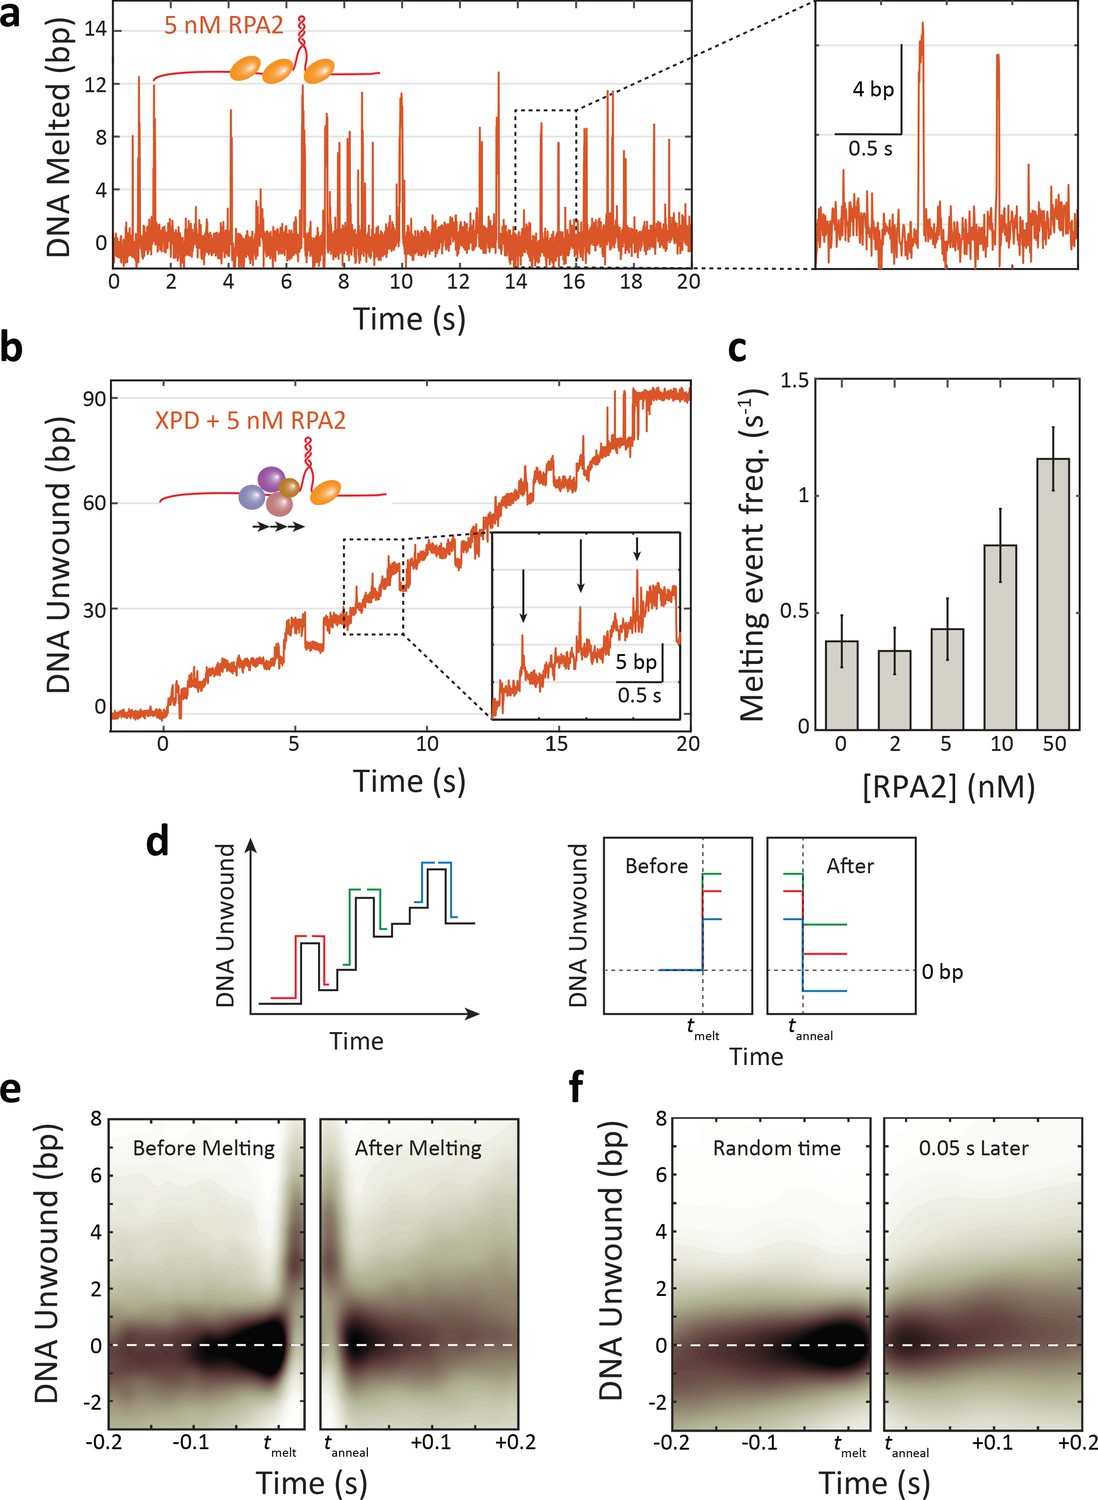
Replication protein A 2 (RPA2) transiently melts hairpin duplex but does not assist xeroderma pigmentosum group D (XPD) unwinding.
(a) Representative time trace of RPA2 transiently destabilizing hairpin dsDNA at a constant force (F = 12 pN). Inset: RPA2 melts ~8 bp, which then rapidly reanneals (see Figure 3—figure supplement 1). (b) RPA2 is able to melt dsDNA at a fork occupied with XPD. Inset: transient RPA2-like melting events during XPD unwinding (see Figure 3—figure supplement 2). (c) The frequency of RPA2 melting events increases with RPA2 concentration. Error bars represent s.e.m. (d) Analysis of RPA2 melting events and their effect on XPD unwinding. The schematic shows all RPA2 melting events identified and divided into ‘melting’ and ‘reannealing’ transitions. Each transition is aligned temporally such that all melting transitions begin at the same time tmelt and corresponding reannealing transitions end at the same time tanneal. Both types of transitions are aligned spatially relative to the starting extension before melting (x = 0). (e) Probability distribution of all aligned RPA2 melting events. Although RPA2 melts an average of 5 bp of hairpin DNA (left), it reanneals by the same amount (right), and there is no net progress of XPD due to melting. (f) Probability distribution at a random time point (left) and 0.06 s later (right). Net progress of XPD after an RPA2 melting event is indistinguishable from net progress at a random time point. Probability distributions were obtained using kernel density estimation (see Materials and methods).
-
Figure 3—source data 1
RPA2 melting statistics and XPD burst processivity vs. [gp32].
- https://cdn.elifesciences.org/articles/60515/elife-60515-fig3-data1-v2.xlsx
Figure 3—figure supplement 1
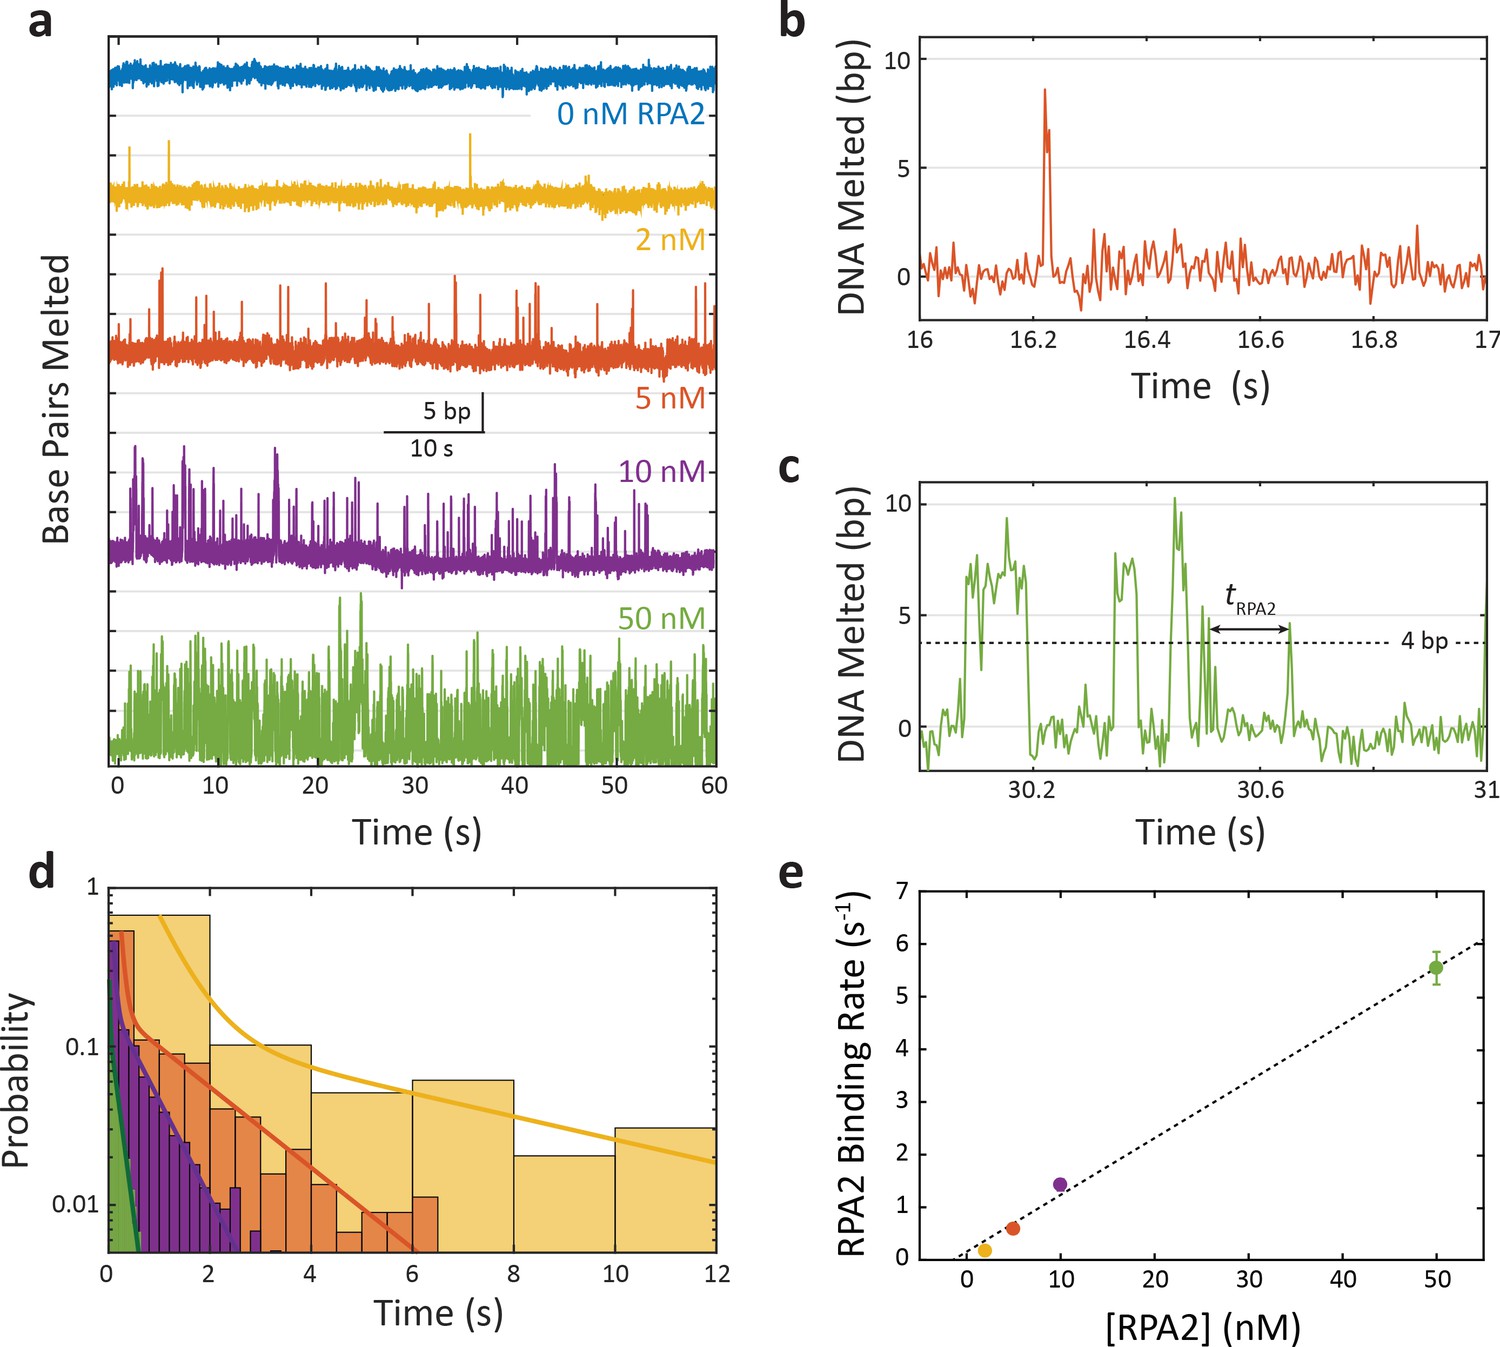
Replication protein A 2 (RPA2) transiently melts DNA under force.
(a) Representative time traces of RPA2 transiently destabilizing hairpin dsDNA at a constant force (F = 12 pN) and at varying RPA2 concentrations. The hairpin is exposed to varying concentrations of RPA2 at t = 0. In the absence of RPA2, the hairpin remains stably zipped. In the presence of RPA2, brief (<0.1 s) events consisting of 5–10 bp dsDNA melting followed by rapid reannealing are observed. The frequency of these events increases with RPA2 concentration. (b, c) Selected RPA2 melting events from traces with 5 and 50 nM RPA2. Melting events are identified at time points where >4 bp of DNA is unwound, and melting kinetics are quantified from the time between events, tRPA2. (d) Probability distribution of tRPA2 across RPA2 concentrations (colors same as in a). The distributions are best fit to a bi-exponential with one slow and one fast rate constant. The slow process depends on [RPA2] and corresponds to RPA2 binding and melting the hairpin DNA. The fast process is independent of [RPA2] (data not shown) and attributed to already-bound RPA2 ‘re-melting’ the DNA. (e) The effective RPA2 binding rate, kRPA2, determined from the slow rate constant in (d), increases linearly with RPA2 concentration. Error bars represent s.e.m.
Figure 3—figure supplement 2
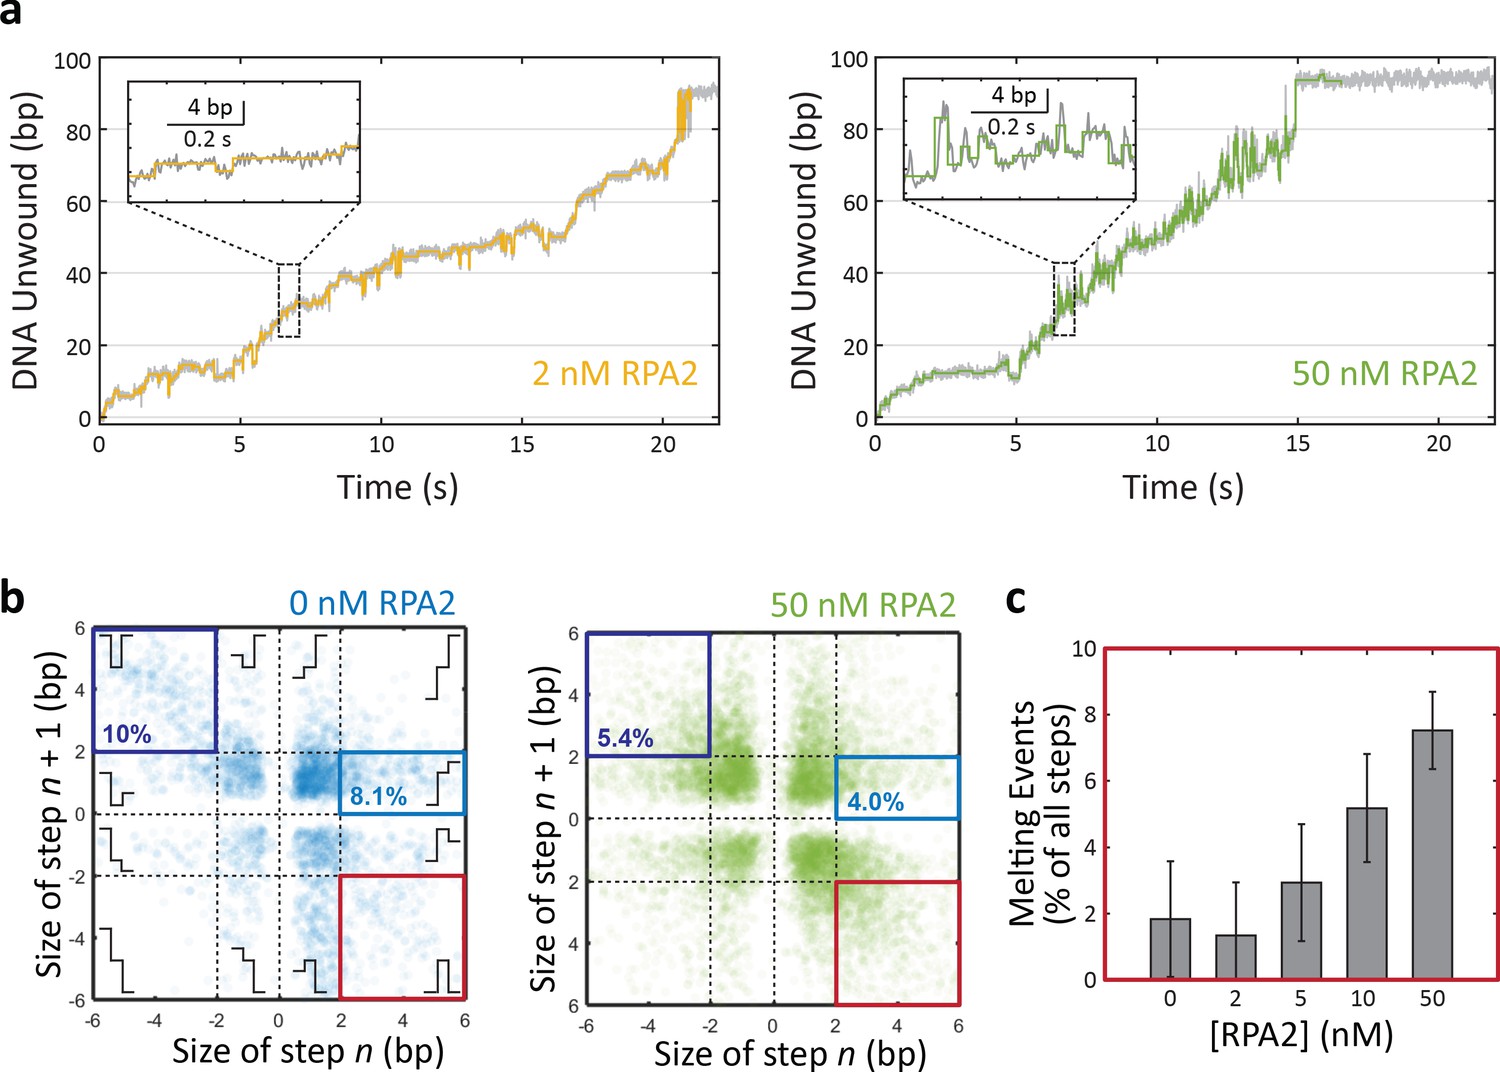
Detecting replication protein A 2 (RPA2) melting events during xeroderma pigmentosum group D (XPD) unwinding.
(a) Representative time traces of XPD unwinding in the presence of 2 and 50 nM RPA2 (data in gray) and corresponding step-fitting analysis (colored line) used to identify putative RPA2 melting events. Inset: steps fitted (colored lines) to unwinding data (gray). (b) Scatter plot of step size for pairs of consecutive steps for XPD unwinding in 0 and 50 nM RPA2 (blue and green, respectively). Schematics illustrate the step pairs. In the absence of RPA2, small steps (<2 bp) account for the majority of unwinding behavior. In the presence of RPA2, a detectable fraction of step pairs corresponds to a large (>2 bp) forward step followed by a large backward step (red box; lower right corner). A subset of these events with the appropriate duration (~0.06 s) are selected as RPA2 melting events. Other events highlighted are ~5 bp forward step/1 bp unwinding step pairs (light blue box) and 5 bp backward step/5 bp forward step pairs (dark blue box), the latter attributed to DNA dynamics at a secondary, regulatory binding site on XPD. Both types of events are less frequent in the presence of RPA2 (compare 0 and 50 nM RPA2; numbers indicate the % of all step pair events contained in each box. see Discussion). (c) The probability of RPA2 melting events identified in (b) increases with RPA2 concentration, confirming their connection to RPA2 activity. Some events are detected in the absence of RPA2 due to detection errors. Error bars represent s.e.m.
Figure 3—figure supplement 3
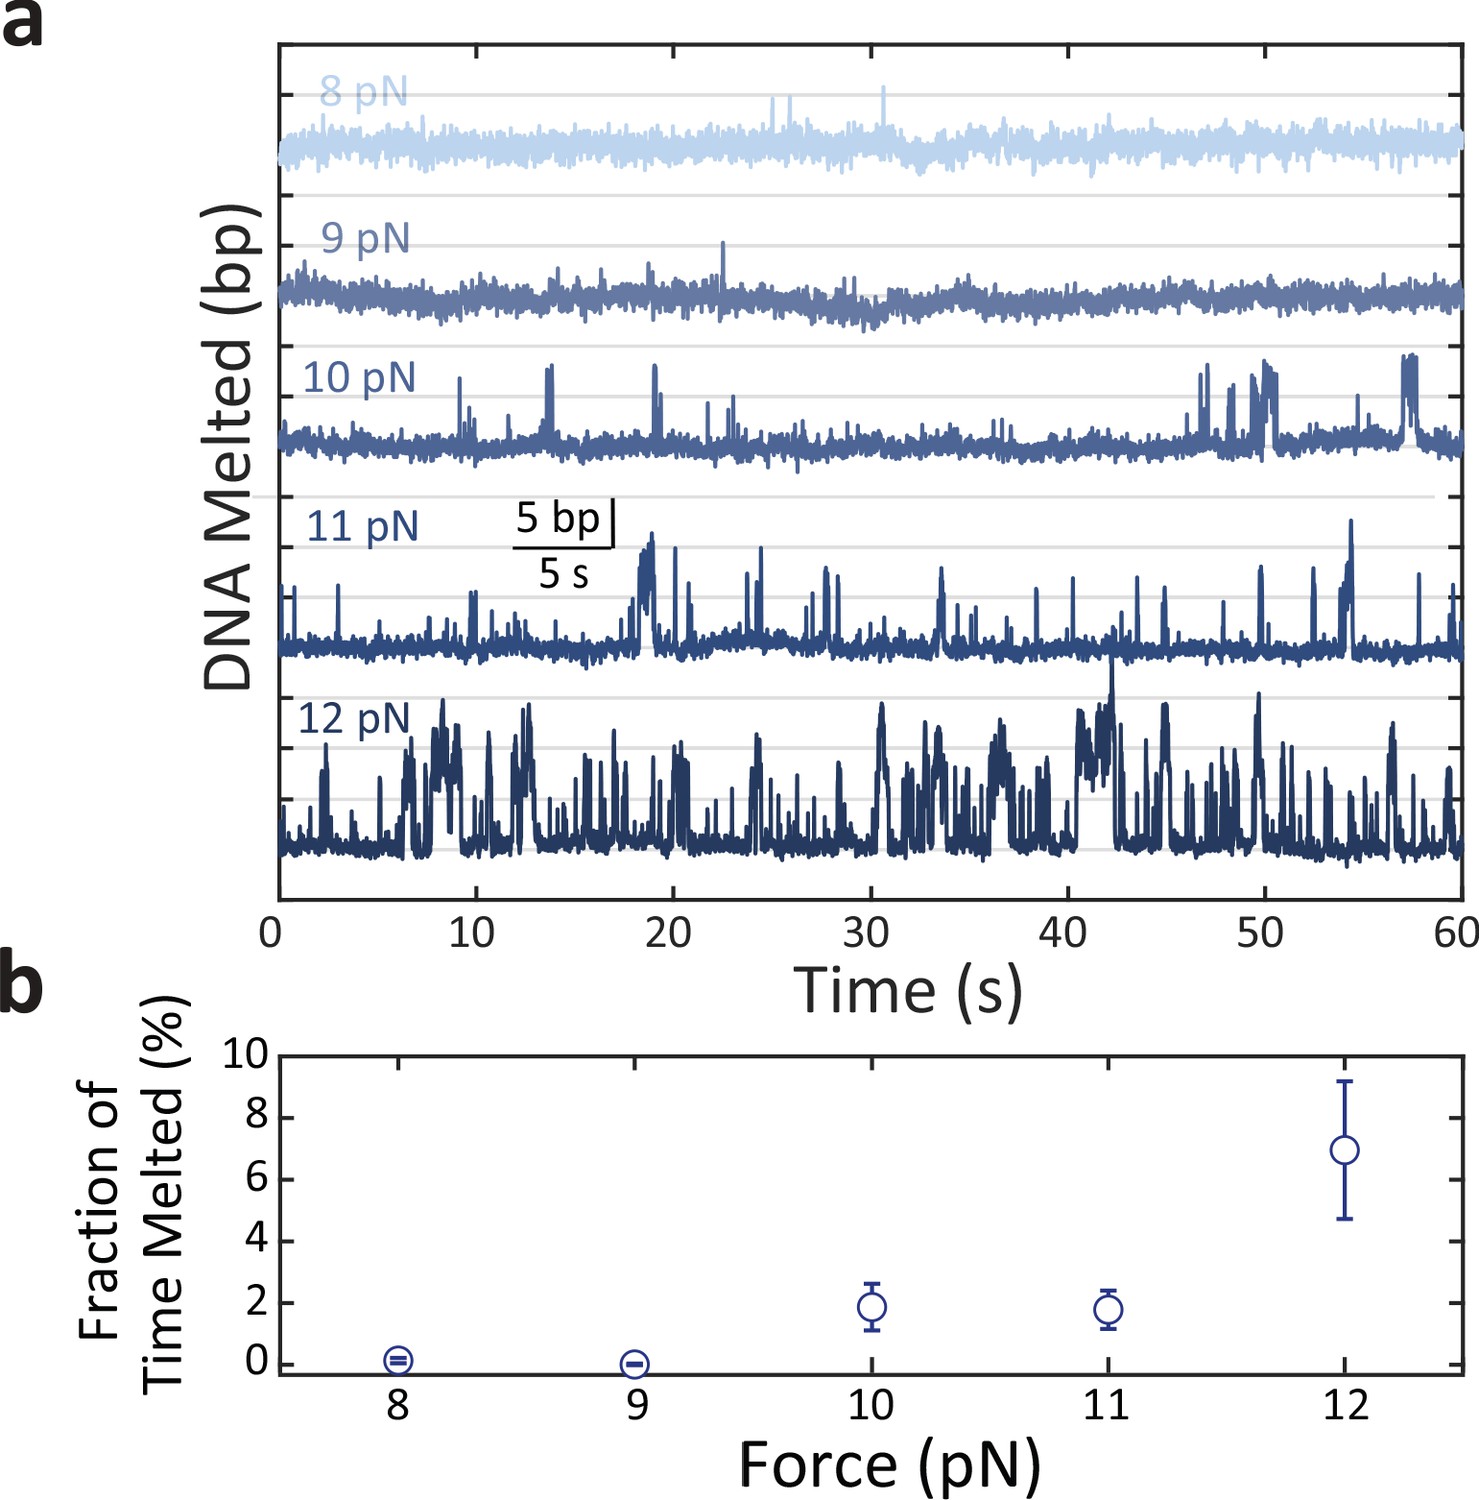
Replication protein A 2 (RPA2) transient melting of DNA depends on force.
(a) Representative time traces of RPA2 transiently destabilizing hairpin dsDNA at a constant concentration (35 nM) and at different forces (F = 8–12 pN). The frequency of transient 5–10 bp dsDNA melting events increases with force. (b) The fraction of time the hairpin DNA is melted by >4 bp due to RPA2 increases with force at a constant RPA2 concentration. Error bars represent s.e.m.
Figure 3—figure supplement 4
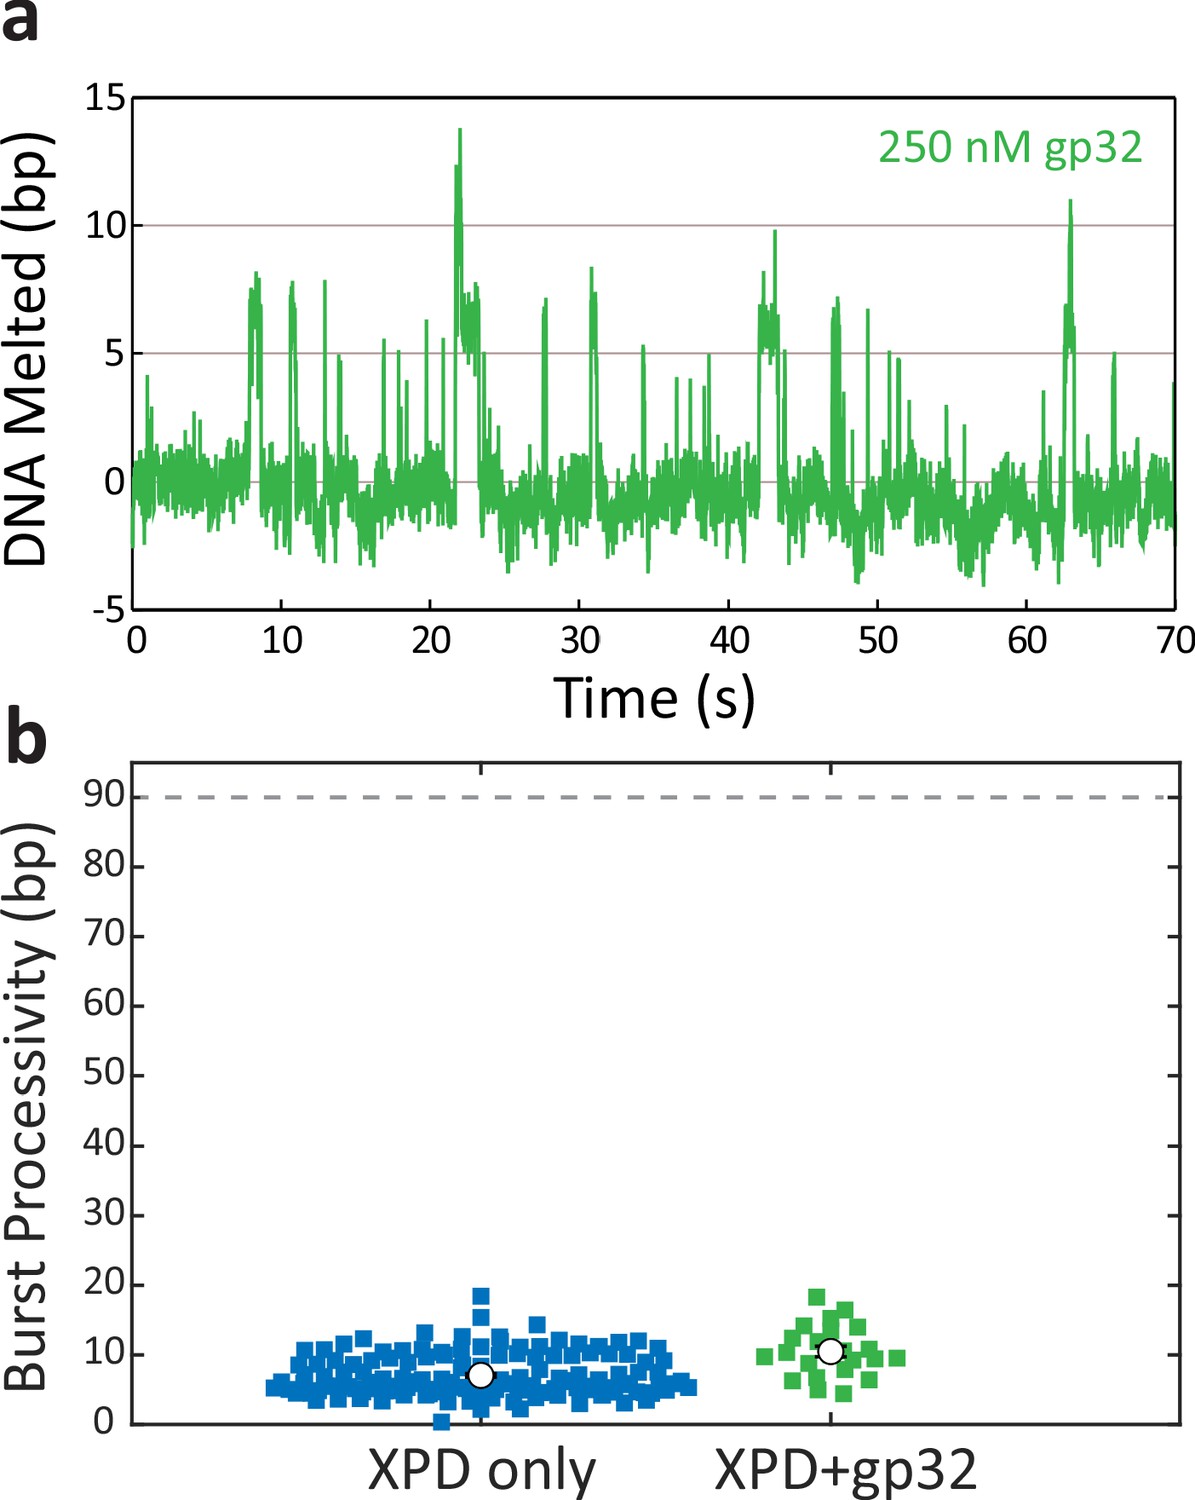
T4 gene protein 32 (gp32) transiently melts hairpin duplex but does not assist xeroderma pigmentosum group D (XPD) unwinding.
(a) Representative time trace of T4 gp32 transiently destabilizing hairpin dsDNA at a concentration of 250 nM and constant force of F = 8 pN. (b) Processivity of each burst (colored circles) for XPD alone (blue) and XPD in the presence of gp32 (250 nM; green) in the force range of 7–8 pN. The mean processivity (open circles) remains low in the presence of gp32. Error bars represent s.e.m.
Figure 4 with 2 supplements

Xeroderma pigmentosum group D (XPD) exhibits two burst types, the fraction of which is replication protein A 2 (RPA2) dependent.
(a) Plot of XPD unwinding bursts, aligned to start at t = 0 and grouped by RPA2 concentration (colored traces). XPD unwinding bursts come in two types: low processivity, never unwinding more than 25 bp (light colors); and high processivity, unwinding more than 25 bp (dark colors). (b) The fraction of high-processivity bursts (>25 bp) increases with RPA2 concentration. Fit to model described in the text (dashed line; see Materials and methods). (c) Averages of all low-processivity bursts (light colored lines) and all high-processivity bursts (dark colored lines) at each RPA2 concentration. Comparison to averages of low- and high-processivity burst types over all RPA2 concentrations (dark gray and black lines, respectively). Shaded regions represent s.e.m. throughout. Unwinding behavior within each burst category remains the same over all RPA2 concentrations.
-
Figure 4—source data 1
High-processivity fraction and burst duration vs. [RPA2], and XPD speed vs. position.
- https://cdn.elifesciences.org/articles/60515/elife-60515-fig4-data1-v2.xlsx
Figure 4—figure supplement 1
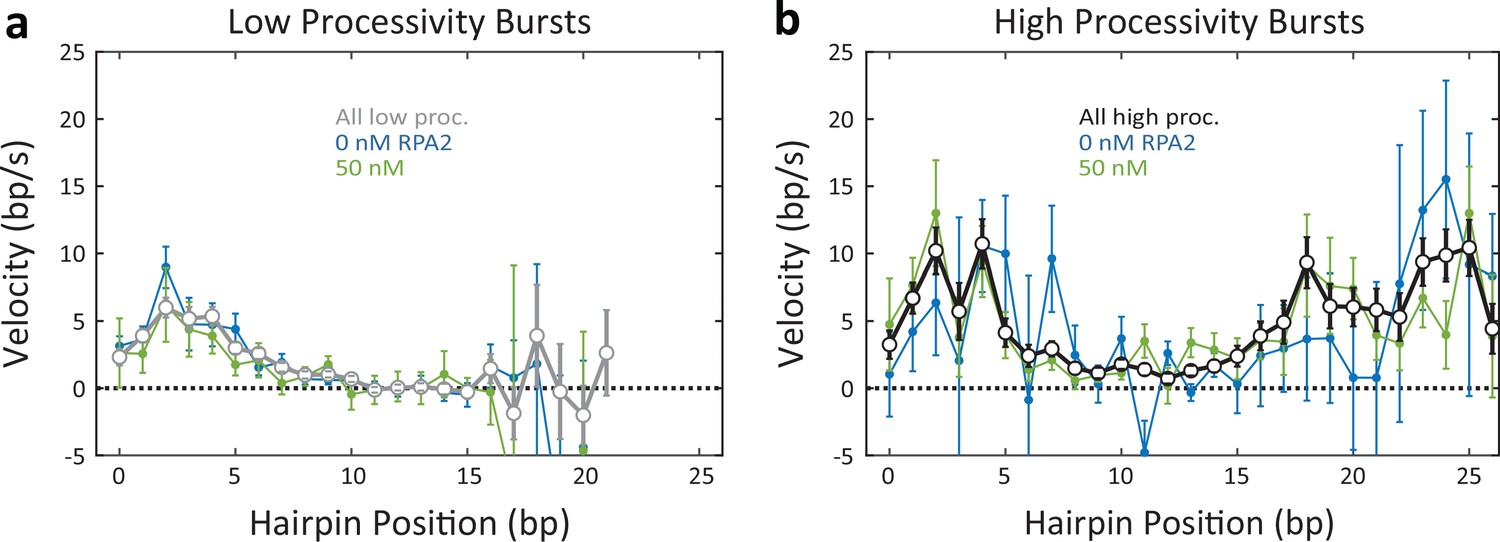
Unwinding velocity varies with processivity type but not replication protein A 2 (RPA2) concentration.
(a, b) Average unwinding velocity as a function of hairpin position for low-processivity (a) and high-processivity (b) bursts at two representative RPA2 concentrations, 0 (blue) and 50 nM (green). Velocities averaged over all RPA2 concentration for high- and low- processivity burst types are shown for comparison (black and gray, respectively). Velocity profiles are similar within each processivity type, independent of RPA2 concentration. However, velocity profiles for high-processivity bursts differ significantly from those of low-processivity bursts, particularly at positions > 10 bp. Error bars represent s.e.m.
Figure 4—figure supplement 2
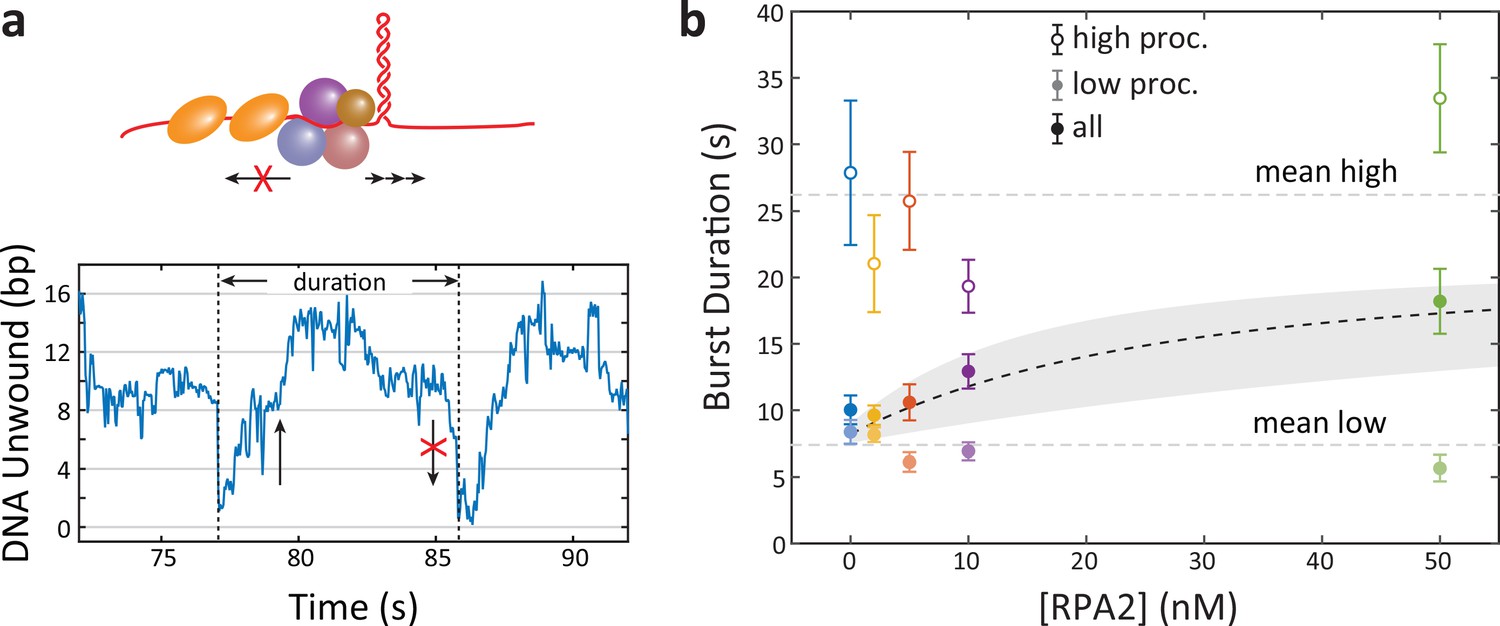
Xeroderma pigmentosum group D (XPD) backward motion varies with processivity type but not replication protein A 2 (RPA2) concentration.
(a) Schematic representation of the sequestration model, in which RPA2 binding to ssDNA prevents XPD’s backward motion, enhancing unwinding. The model predicts that burst duration should increase with RPA2 concentration since each burst ends when backward motion takes XPD to the base of the hairpin. (b) Average burst duration for low-processivity (light-colored circles) and high-processivity (open colored circles) remains constant with RPA2 concentration. Burst durations averaged over both burst types (colored circles) increase with RPA2 due to the increasing fraction of high-processivity bursts, consistent with the quantitative model (shaded gray region) based on Figure 4b (see Materials and methods).
Figure 5 with 2 supplements
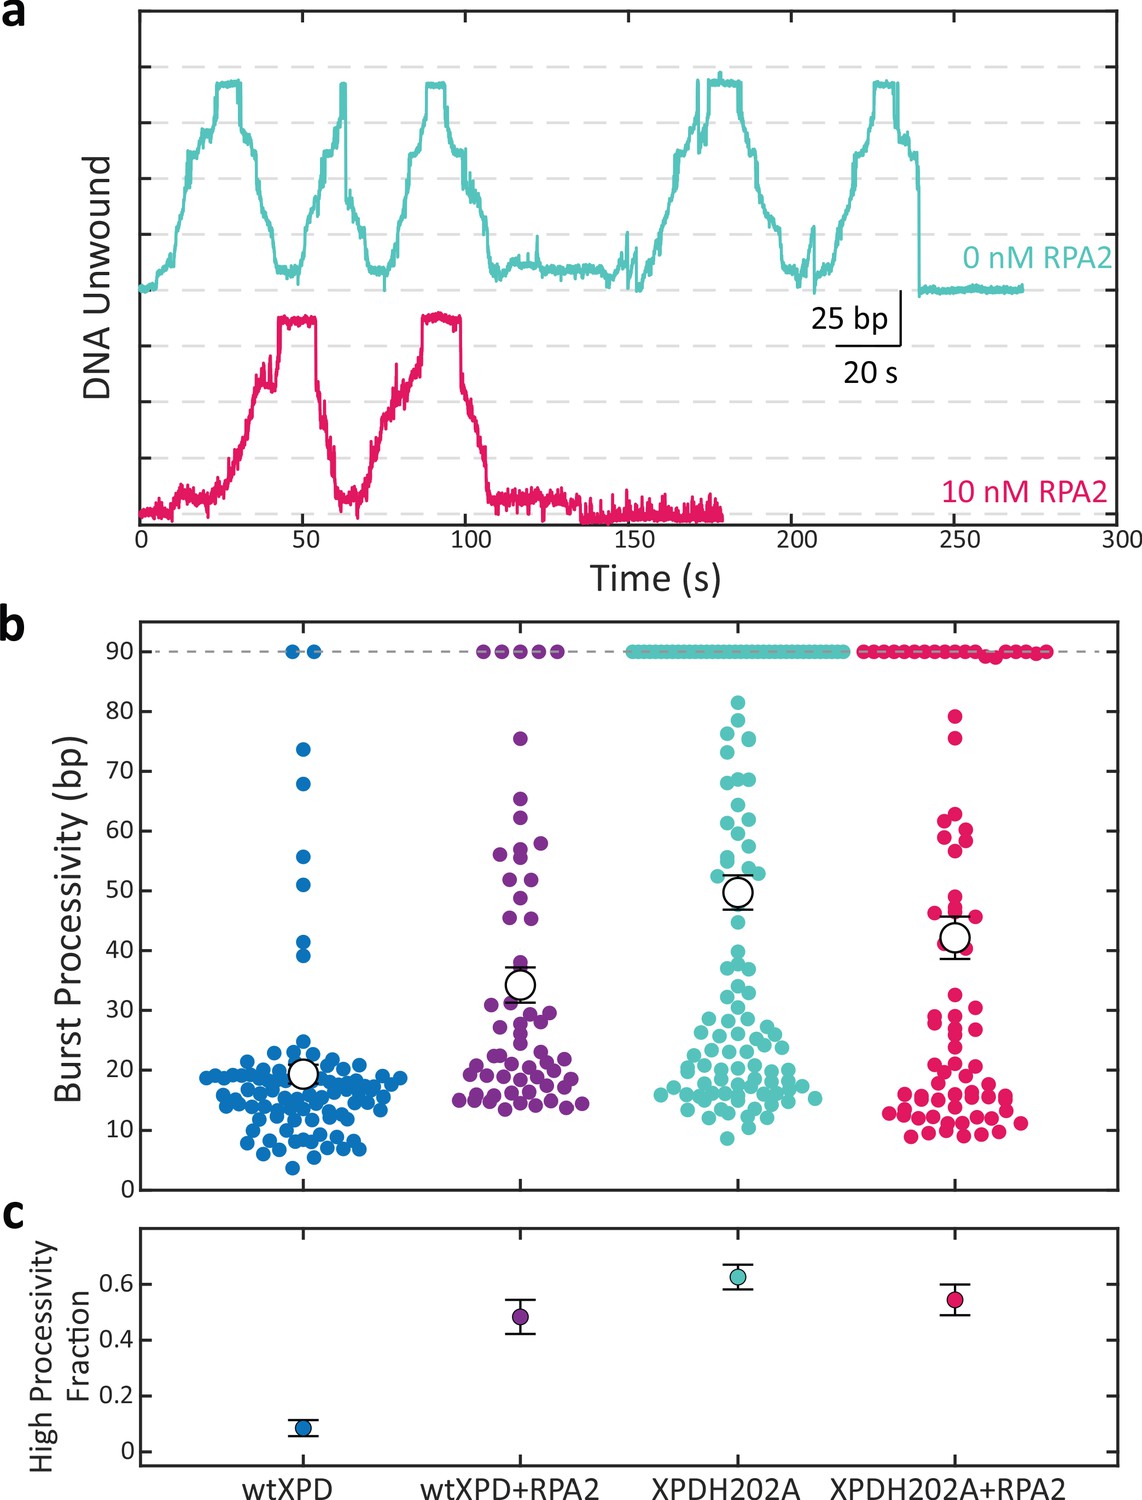
A point mutation in xeroderma pigmentosum group D (XPD) enhances its processivity similarly to replication protein A 2 (RPA2).
(a) Representative traces of a single molecule of the mutant XPDH202A unwinding at constant force (F = 12 pN) alone (cyan) and in the presence of RPA2 (10 nM; magenta). (b) Processivity of individual bursts (colored circles) at a constant force of 12 pN for wild-type XPD alone (blue) and with 10 nM RPA2 (purple), and for XPDH202A alone (cyan) and with 10 nM RPA2 (magenta). The H202A mutation increases XPD’s mean processivity (open circles); addition of RPA2 does not enhance processivity further. (c) The fraction of high-processivity bursts (>25 bp) corresponding to (b). The H202A mutation increases the fraction of high-processivity bursts to a level similar to that of XPD with RPA2. Error bars represent s.e.m. throughout.
-
Figure 5—source data 1
XPD and mutant burst processivity vs. [RPA2], and complex formation statistics .
- https://cdn.elifesciences.org/articles/60515/elife-60515-fig5-data1-v2.xlsx
Figure 5—figure supplement 1
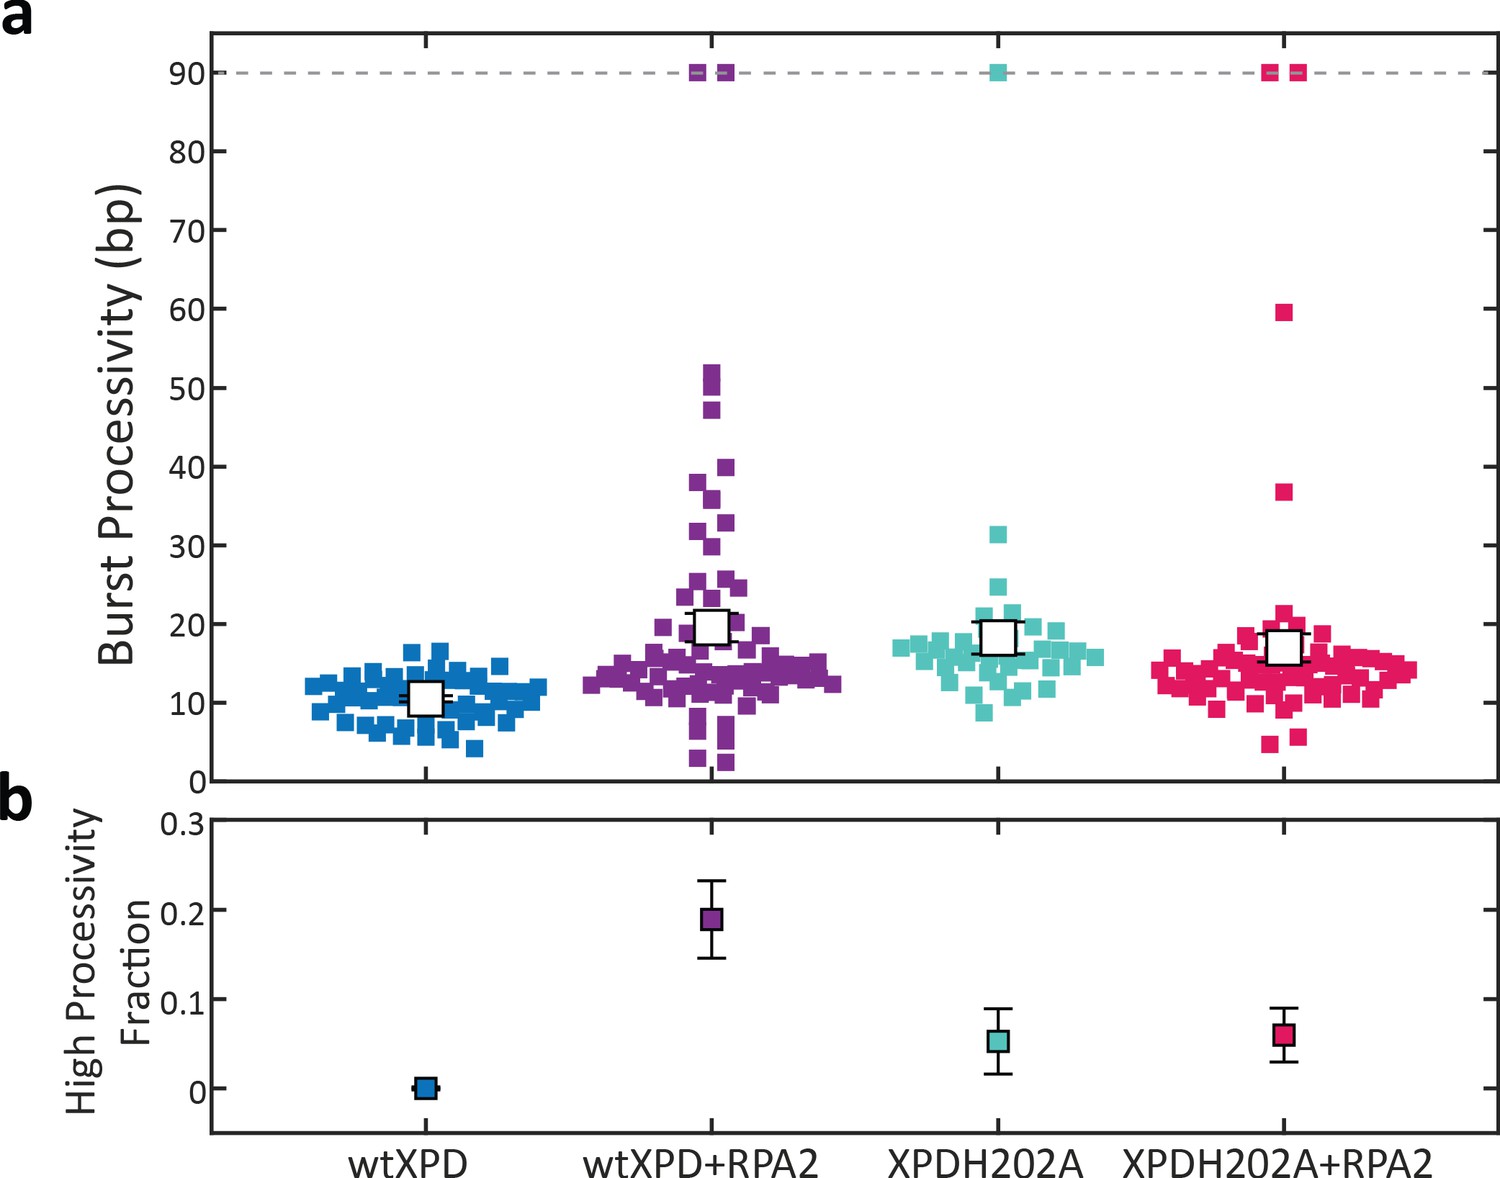
A point mutation in xeroderma pigmentosum group D (XPD) enhances its processivity similarly to replication protein A 2 (RPA2) at a force of 9 pN.
(a) Processivity of individual bursts (colored squares) at a constant force of 9 pN for wild-type XPD alone (blue) and with 10 nM RPA2 (purple), and for XPDH202A alone (cyan) and with 10 nM RPA2 (magenta). The H202A mutation increases XPD’s mean processivity (open circles); addition of RPA2 does not enhance processivity further. (b) The fraction of high-processivity bursts (>25 bp) corresponding to (b). The H202A mutation increases the fraction of high-processivity bursts. Error bars represent s.e.m. throughout.
Figure 5—figure supplement 2
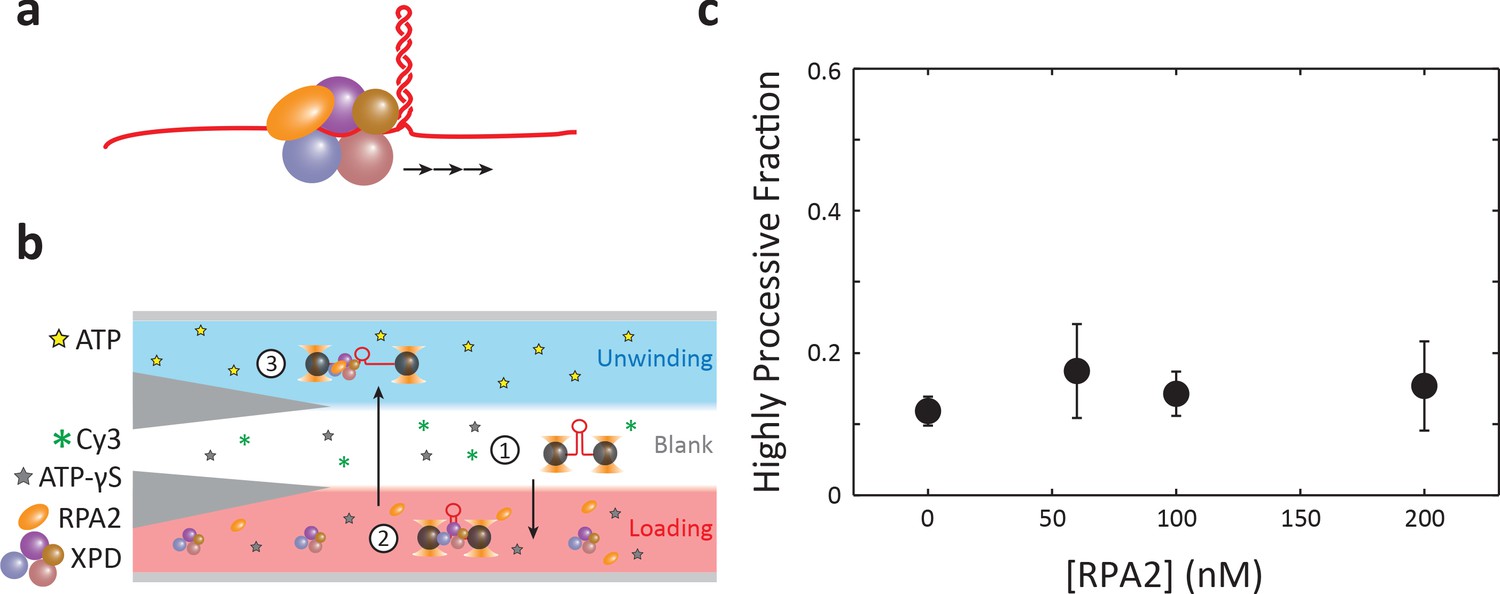
Test of stable complex formation.
(a) In the complex formation model, replication protein A 2 (RPA2) forms a complex with xeroderma pigmentosum group D (XPD) that activates it for processive unwinding. (b) Flow chamber configuration for testing the complex formation model. The protein ‘loading’ stream contains 60 nM XPD, 500 μM ATP-γS, and 0–200 nM RPA2. This configuration allows pre-loading an XPD–RPA2 complex during incubation. Unwinding processivity of the putative complex is measured upon entering into the ‘unwinding’ stream containing 500 μM ATP. (c) Although an XPD–RPA2 complex is expected to be more likely as RPA2 concentration increases, the high-processivity fraction remains constant with increasing RPA2 concentration. Error bars represent s.e.m. (N = 6–43 molecules).
Figure 6

Replication protein A 2 (RPA2) activates a high-processivity state of xeroderma pigmentosum group D (XPD).
(a) Model of XPD enhancement by RPA2. Schematic of XPD–DNA complex (left; side and front views), with 5 nt of ssDNA (black) bound at a regulatory secondary binding site on HD1 that contains H202. XPD can adopt one of two intrinsic states—a low (left) and high (right) processivity state—that correspond to different DNA fork conformations. Interconversion between both states occurs either spontaneously or through RPA2 binding of the 5 nt at the regulatory site. XPDH202A adopts a similar conformation (right). (b) Kinetic model of XPD processivity and the effect of RPA2. XPD interconverts between low and high states with rates k1 and k-1, and RPA2 shifts the equilibrium toward the high state. XPD can dissociate from DNA only from the low state with rate koff. Only in the high state is XPD able to unwind in excess of 25 bp, which occurs at a rate k2. Once an XPD molecule unwinds >25 bp, it is scored as being in the high-processivity state. (c) Representative traces of XPD exhibiting high-processivity unwinding. The time t>25 denotes the first time at which XPD crosses the 25 bp threshold. (d) Fraction of all XPD molecules that have reached high processivity (>25 bp) after time t for each RPA2 concentration. The curves are globally fit to the model in (a) using as parameters the rate constants k1, k-1, k2, and koff. (e) The rate of entry into the high-processivity state, k1, depends linearly on RPA2 concentration. For more details on the kinetic model, see Materials and methods.
-
Figure 6—source data 1
High-processivity fraction vs. time and high-processivity state entry rate vs. [RPA2].
- https://cdn.elifesciences.org/articles/60515/elife-60515-fig6-data1-v2.xlsx
Tables
Table 1
Data statistics.
| Force (pN) | 7–8 | 9 | 12 | ||||||||||
|---|---|---|---|---|---|---|---|---|---|---|---|---|---|
| XPD | wt | wt | H202A | wt | H202A | ||||||||
| [RPA2] (nM) | 0 | 10 | 0 | 10 | 0 | 2 | 5 | 10 | 50 | 0 | 10 | ||
| [gp32] (nM) | 0 | 250 | |||||||||||
| No. of XPD molecules | 10 | 8 | 6 | 25 | 11 | 11 | 20 | 19 | 27 | 20 | 21 | 29 | 16 |
| No. of bursts | 141 | 23 | 54 | 74 | 38 | 67 | 94 | 123 | 79 | 60 | 82 | 123 | 79 |
| No. of bursts/XPD | 14.1 | 2.9 | 9 | 3 | 3.5 | 6.1 | 4.7 | 6.5 | 2.9 | 3.0 | 3.9 | 4.2 | 4.9 |
| No. of low-processivity bursts | 141 | 23 | 54 | 60 | 36 | 63 | 86 | 109 | 61 | 31 | 45 | 46 | 36 |
| No. of high-processivity bursts | 0 | 0 | 0 | 14 | 2 | 4 | 8 | 14 | 18 | 29 | 37 | 77 | 43 |
| XPD: xeroderma pigmentosum group D; RPA2: replication protein A 2; gp32: gene protein 32. | |||||||||||||
Table 2
Model fit parameters.
| Rate constant | Fit value (s−1) |
|---|---|
| k-1 | 0.18 ± 0.13 |
| k2 | 0.170 ± 0.017 |
| koff | 0.037 ± 0.019 |
| 0 | |
| k1, [RPA2]=0 nM | 0.02 ± 0.006 |
| k1, 2 nM | 0.059 ± 0.017 |
| k1, 5 nM | 0.065 ± 0.019 |
| k1, 10 nM | 0.200 ± 0.059 |
| k1, 50 nM | 1.15 ± 0.39 |
| Error bars represent 95% confidence intervals. RPA2: replication protein A 2. | |
Additional files
Download links
A two-part list of links to download the article, or parts of the article, in various formats.
Downloads (link to download the article as PDF)
Open citations (links to open the citations from this article in various online reference manager services)
Cite this article (links to download the citations from this article in formats compatible with various reference manager tools)
Switch-like control of helicase processivity by single-stranded DNA binding protein
eLife 10:e60515.
https://doi.org/10.7554/eLife.60515


