nNOS-expressing interneurons control basal and behaviorally evoked arterial dilation in somatosensory cortex of mice
- Bioengineering Graduate Program, Pennsylvania State University, United States
- Molecular, Cellular, and Integrative Biology Graduate Program, Pennsylvania State University, United States
- Cell and Developmental Biology Graduate Program, Pennsylvania State University, United States
- Departments of Engineering Science and Mechanics, Biomedical Engineering, and Neurosurgery, Pennsylvania State University, United States
Figures
Figure 1 with 5 supplements
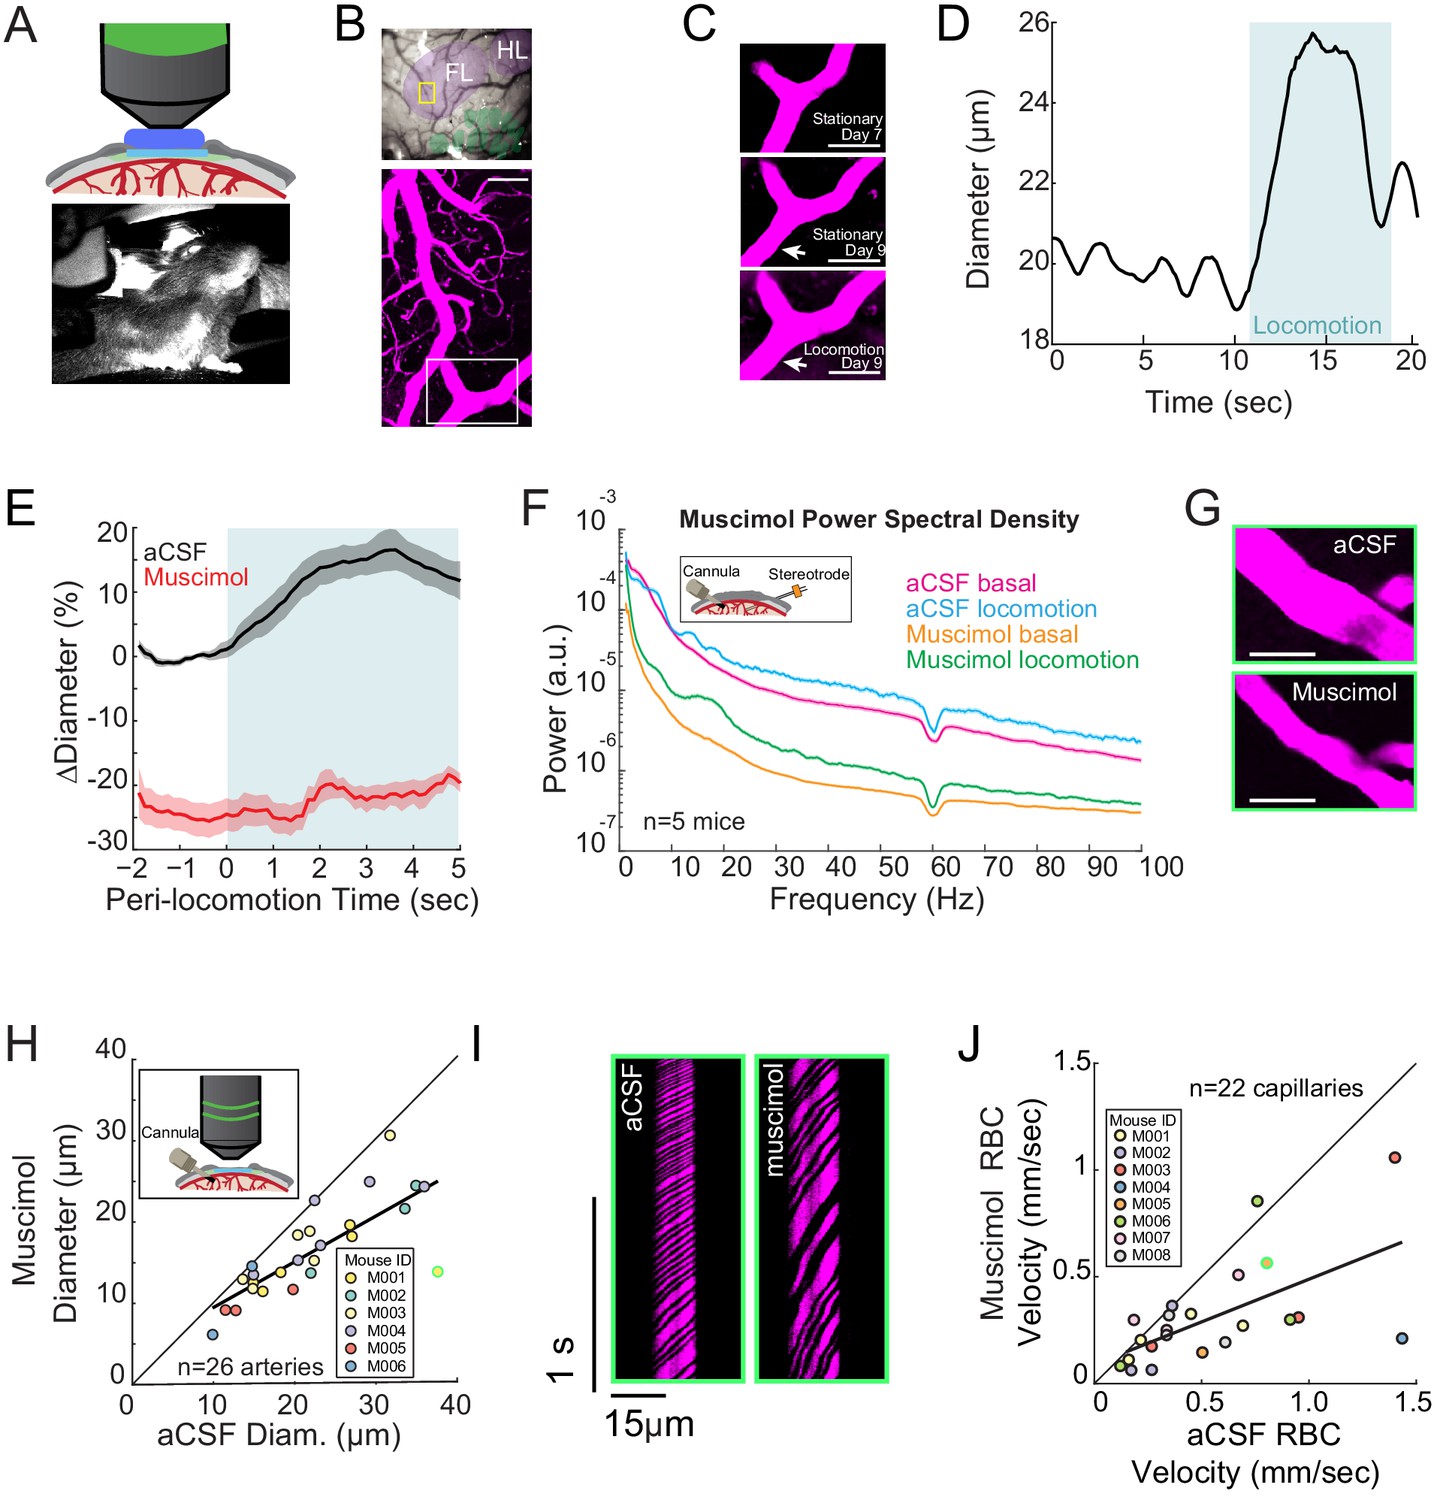
Local neural activity controls basal and evoked arteriole diameter.
(A) Top, schematic of imaging window. Bottom, photo of mouse on spherical treadmill. (B) Top, photo of the pial vasculature of the somatosensory cortex through the PoRTs window. Cytochrome oxidase staining localized the forelimb/hindlimb (FL/HL, purple) and vibrissae cortex (green). Bottom, a maximum projection of two-photon images of vasculature within the yellow box in the top image. Scale bar 50 μm. (C) Top and middle, two-photon images (from white box in B, bottom) of the same arteriole 7 and 9 days after window implantation, both from stationary periods. Bottom, arteriole 9 days after implantation during locomotion. Scale bar 50 μm. (D) Locomotion induces rapid dilation in pial arterioles. Diameter (from region marked by white arrow in C) plotted versus time for a single locomotion event. Blue shading denotes period of locomotion. (E) Population locomotion-triggered averages following aCSF and muscimol infusions for arterioles ≤ 25 µm in basal diameter. For both cases, the individual diameters are normalized by the average basal diameter of the vessel after vehicle infusion. Note the rapid rise to peak in the control, and the lack of dilation in muscimol-infused mice, showing the locomotion-triggered response is under local neural control. Shading represents mean ± standard error. (F) LFP power spectra during stationary periods (basal) and locomotion after muscimol infusion, normalized to vehicle infusion in the same animal. Shading represents mean ± standard error. (G) Representative images of a pial arteriole during periods of no locomotion after vehicle infusion (top) and after muscimol infusion (bottom). Scale bar 50 μm. (H) Basal arteriole diameter following vehicle infusion plotted versus basal diameter after muscimol infusion. Each point is a single vessel, and the mouse identity is represented by the color. The black line shows the linear regression of aCSF vs. muscimol diameter. The point outlined in green is representative image from G. (I) Representative space-time image of linescans of the same capillary after aCSF or muscimol infusion. (J) Basal red blood cell (RBC) velocity plotted after vehicle infusion (x-axis) vs. after muscimol infusion (y-axis). The point outlined in green is the vessel shown in I.
Figure 1—figure supplement 1
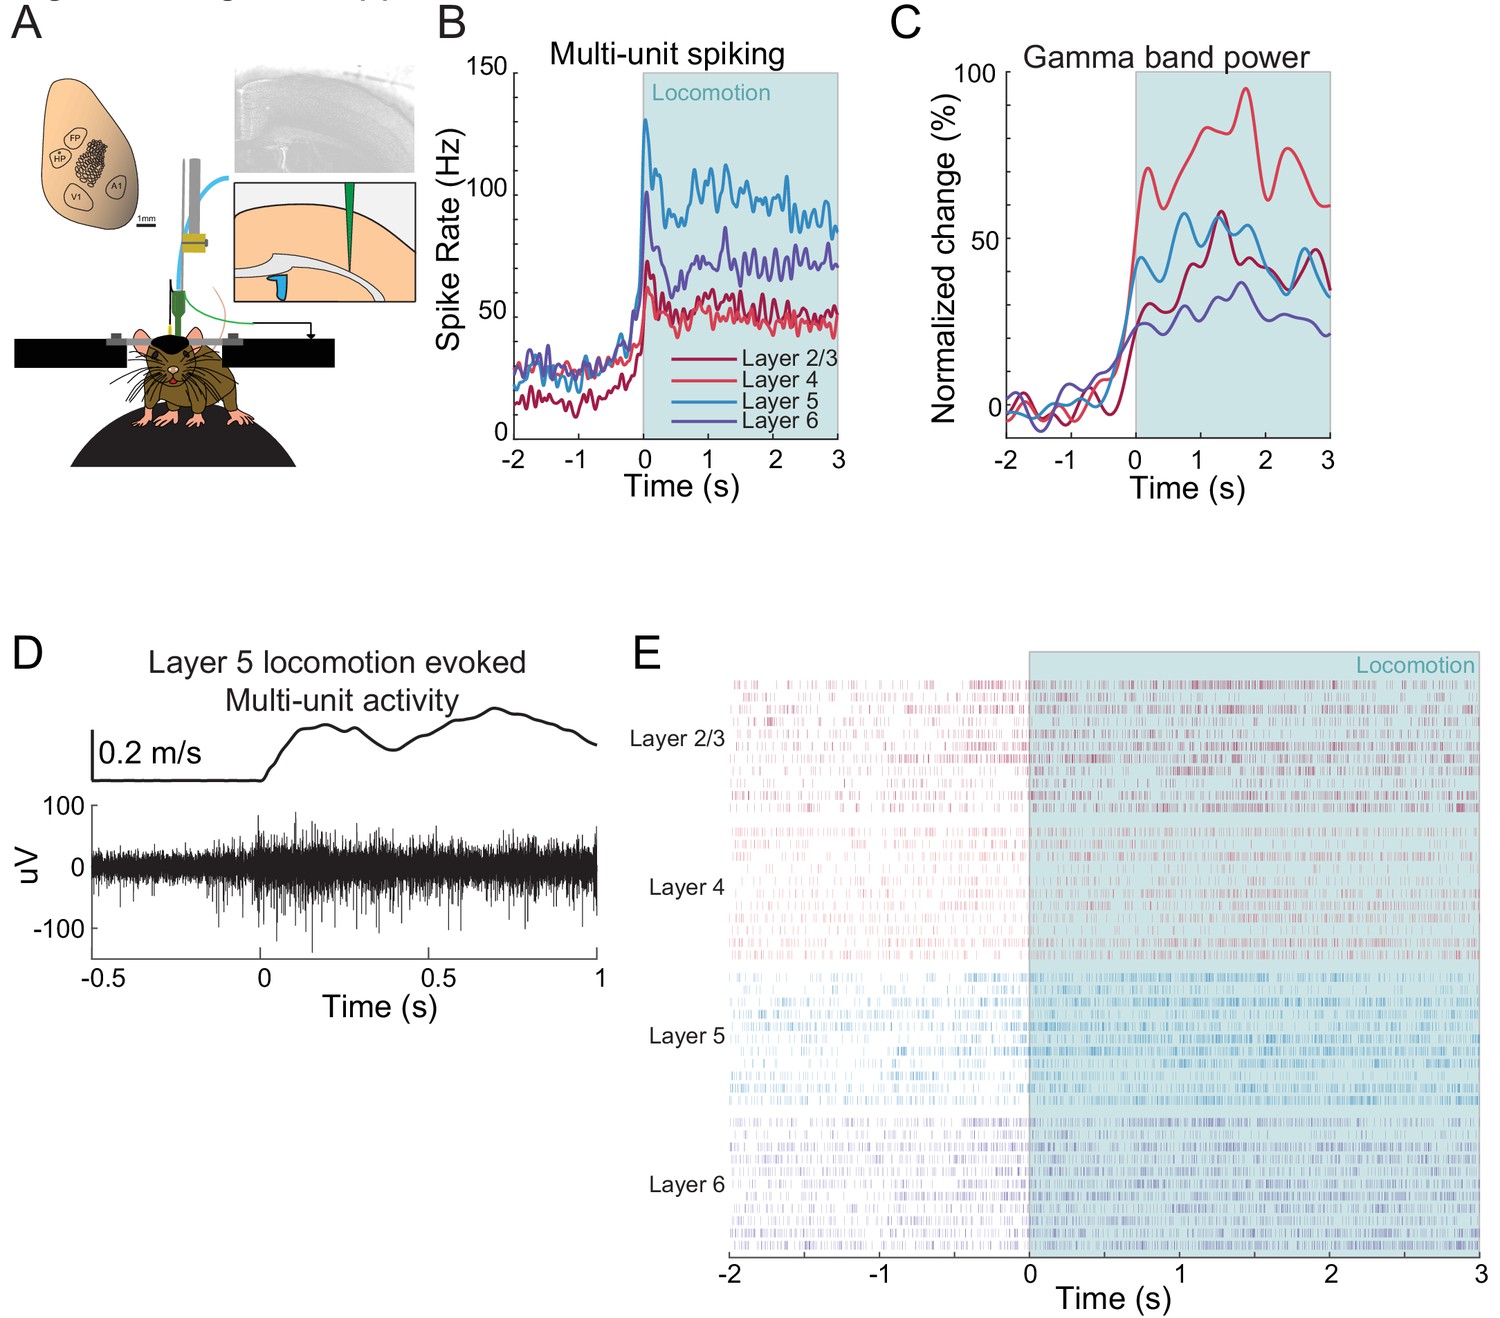
Example neural responses in forelimb/hindlimb representation of somatosensory cortex during voluntary locomotion.
(A) Schematic showing experimental setup of electrophysiological measurements taken with multi-electrode array. (B) Average locomotion-evoked multi-unit spiking from a single site in the FL/HL representation in S1. (C) Average locomotion-evoked gamma-band power change from a single site in the FL/HL representation in S1. (D) Example of multi-unit activity recorded in layer five during locomotion. Top shows velocity of treadmill. (E) Locomotion-triggered spike rasters for several locomotion events.
Figure 1—figure supplement 2
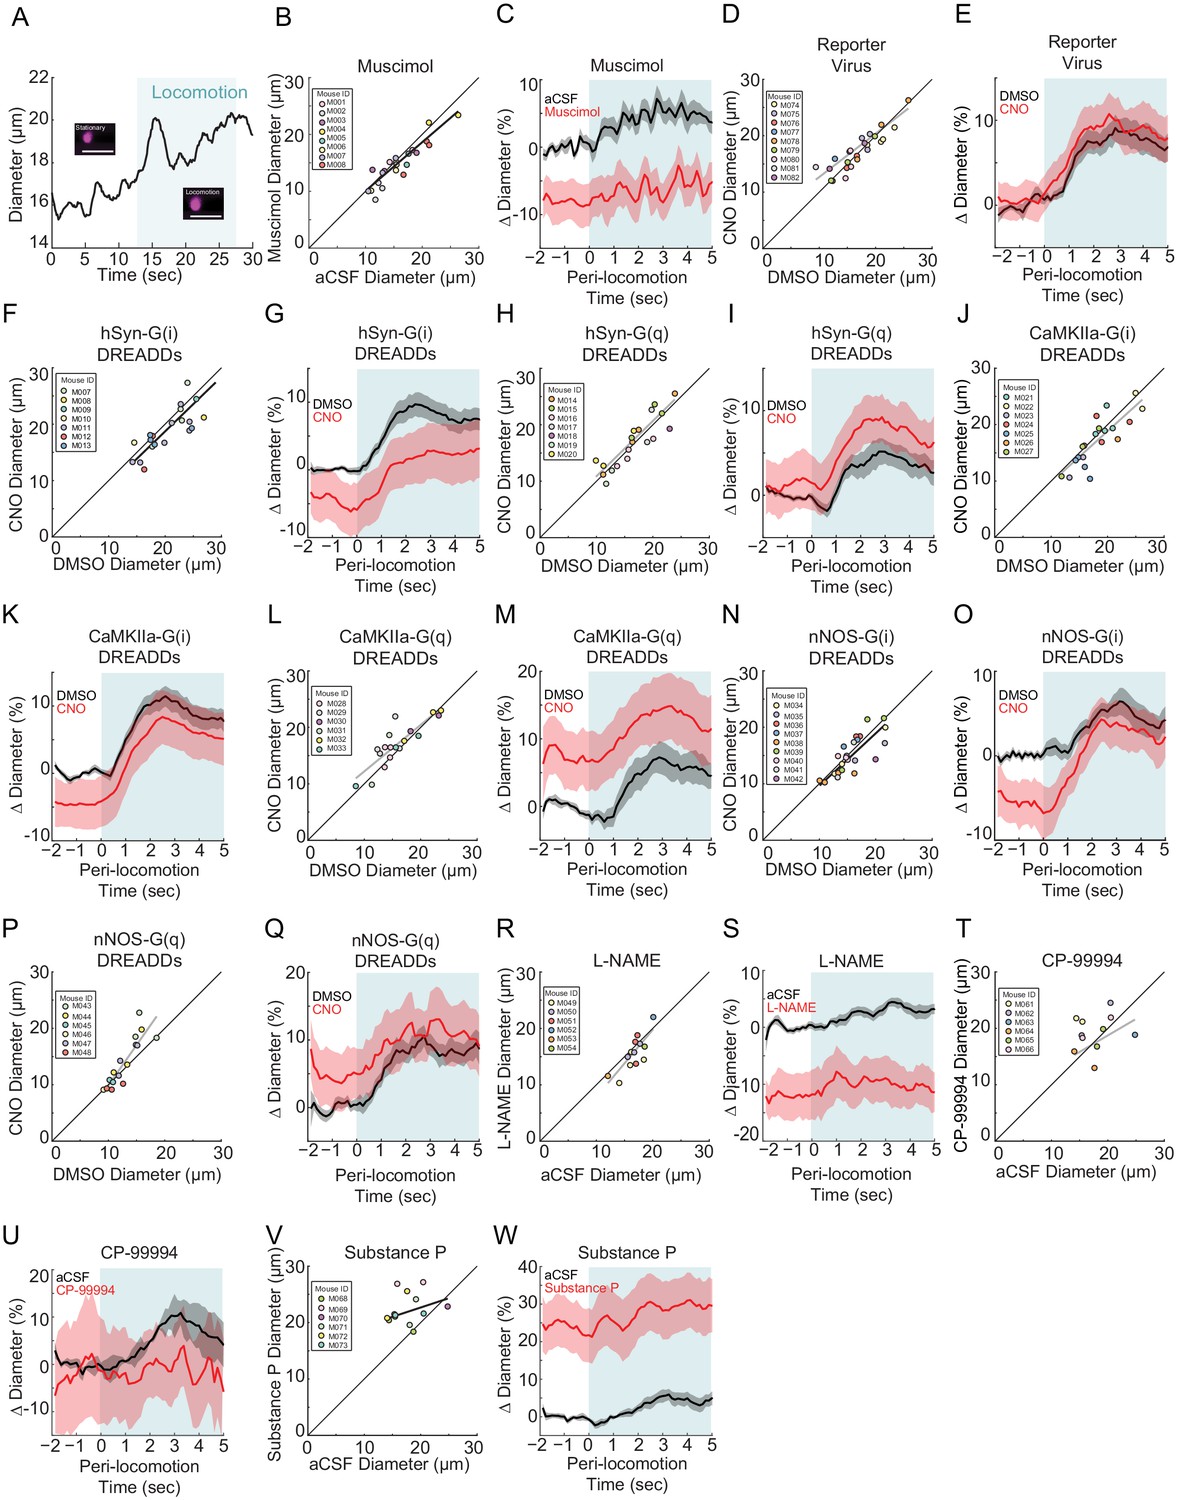
Diameter changes in penetrating arterioles.
All data is taken from penetrating arterioles imaged ~100 µm below the pial surface. Statistical comparisons of locomotion triggered averages are of the control and manipulation are done with both normalized to the pre-locomotion baseline in the control condition. (A) Example of locomotion-induced dilation in a penetrating arteriole. Inset shows the vessel during a stationary period and during locomotion. Blue shading denotes periods of locomotion. Data in B and C are from penetrating arteries in mice infused with muscimol and aCSF. (B) Basal diameter of penetrating arteries after vehicle infusion (x-axis) versus muscimol infusion (y-axis). There was a significant decrease in basal diameter in the muscimol infused condition (−7.8 ± 1.4%, LME p<0.01 n = 5 mice, 13 vessels). (C) Population locomotion-triggered averages after vehicle (black) and muscimol (red) infusions (LME p<0.35, n = 5 mice, 13 arterioles in FL/HL representation). Data in D and E are from penetrating arteries in mice infected with AAV-CMV-TurboRFP-WPRE-rBG (reporter virus), and IP injected with CNO or vehicle control. (D) Basal arteriole diameter of penetrating arteries after vehicle injection (x-axis) versus CNO injection (y-axis) was not significantly different (−0.3 ± 14.2%, LME p<0.24 n = 5 mice, 13 vessels). (E) Population locomotion-triggered averages for arterioles ≤ 25 µm in basal diameter after vehicle (black) or CNO (red) injection (LME p<1, n = 9 mice, 13 arterioles in FL/HL representation). Data in F and G are from penetrating arteries in mice infected with AAV-hSYN-HA-hM4D(Gi)-mCherry, data in H and I is from penetrating arteries in mice infected with AAV-hSYN-HA-hM3D(Gq)-mCherry (pan-neuronal expression). (F) Basal diameter of penetrating arteries after vehicle injection (x-axis) versus CNO injection (y-axis) was significantly decreased by CNO (−6.7 ± 12.0%, LME p<0.03, n = 7 mice, 21 vessels). (G) Population locomotion-triggered averages after vehicle (black) and CNO (red) injection (LME p<1, n = 7 mice, 21 arterioles in FL/HL representation). (H) Basal diameter of penetrating arteries after vehicle injection (x-axis) versus CNO injection (y-axis). There was no significant difference between the conditions (+2.3 ± 13.9%, LME p<0.92 n = 7 mice, 19 vessels). (I) Population locomotion-triggered averages after vehicle (black) and CNO (red) injection (LME p<1, n = 7 mice, 19 arterioles in FL/HL representation). Data in J and K are from penetrating arteries in mice infected with AAV-CaMKIIa-hM4D(Gi)-mCherry, data in L and M is from penetrating arteries in mice infected with AAV-CaMKIIa-hM4D(Gq)-mCherry (expression in pyramidal neurons). (J) Basal arteriole diameter of penetrating arteries after vehicle injection (x-axis) versus CNO injection (y-axis) showed no significant difference (−4.1 ± 13.5%, LME p<0.06 n = 7 mice, 20 vessels). (K) Population locomotion-triggered averages after vehicle (black) and CNO (red) injection (LME p<1, n = 7 mice, 20 arterioles in FL/HL representation). (L) Basal arteriole diameter of penetrating arteries after vehicle injection (x-axis) versus CNO injection (y-axis) showing significant increases (+8.5 ± 14.6%, LME p<0.04 n = 7 mice, 18 vessels). (M) Population locomotion-triggered averages after vehicle (black) and CNO (red) injection (LME p<0.83, n = 7 mice, 18 arterioles in FL/HL representation). Data in N and O are from penetrating arteries in nNOS-cre mice injected with AAV-hSyn-DIO-hM4D(Gi)-mCherry, data in P and Q is from penetrating arteries in nNOS-cre mice injected with AAV-hSyn-DIO-hM4D(Gq)-mCherry (nNOS+ expression). (N) Basal diameter of penetrating arteries after vehicle injection (x-axis) versus CNO injection (y-axis) showing no significant difference (−7.5 ± 12.6%, LME p<0.24 n = 9 mice, 23 vessels). (O) Population locomotion-triggered averages after vehicle (black) and CNO (red) injection (LME p<1, n = 9 mice, 23 arterioles in FL/HL representation). (P) Basal diameter of penetrating arteries after vehicle injection (x-axis) versus CNO injection (y-axis) showing no significant difference (+7.3 ± 16.4%, LME p<0.12 n = 6 mice, 16 vessels). (Q) Population locomotion-triggered averages after vehicle (black) and CNO (red) injection (LME p<1, n = 6 mice, 16 arterioles in FL/HL representation). Data in R and S are from penetrating arteries in mice after L-NAME and aCSF infusions. (R) Basal diameter of penetrating arteries after vehicle infusion (x-axis) versus L-NAME infusion (y-axis). There was no significant change in arterial diameter (−14.8 ± 10.9%, LME p<0.08 n = 6 mice, 14 vessels). (S) Population locomotion-triggered averages after vehicle (black) and L-NAME (red) infusion (LME p<0.07, n = 6 mice, 14 arterioles in FL/HL representation). Data in T and U are from penetrating arteries in mice after CP-99994 and aCSF infusions. Data in V and W is from penetrating arteries in mice after Substance P and aCSF infusions. (T) Basal arteriole diameter of penetrating arteries after vehicle infusion (x-axis) versus CP-99994 infusion (y-axis) showing no significant difference (5.4 ± 23.6%, LME p<0.53 n = 6 mice, 11 vessels). (U) Population locomotion-triggered averages after vehicle (black) and CP-99994 (red) infusion (LME p<1, n = 6 mice, 11 arterioles in FL/HL representation). (V) Basal arteriole diameter of penetrating arteries after vehicle infusion (x-axis) versus Substance P infusion (y-axis) showing diameter was significantly increased by Substance P (23.3 ± 22.3%, LME p<1.6×10⁻³ n = 6 mice, 13 vessels). (W) Population locomotion-triggered averages after vehicle (black) and Substance P (red) infusion (LME p<0.05, n = 6 mice, 13 arterioles in FL/HL representation).
Figure 1—figure supplement 3
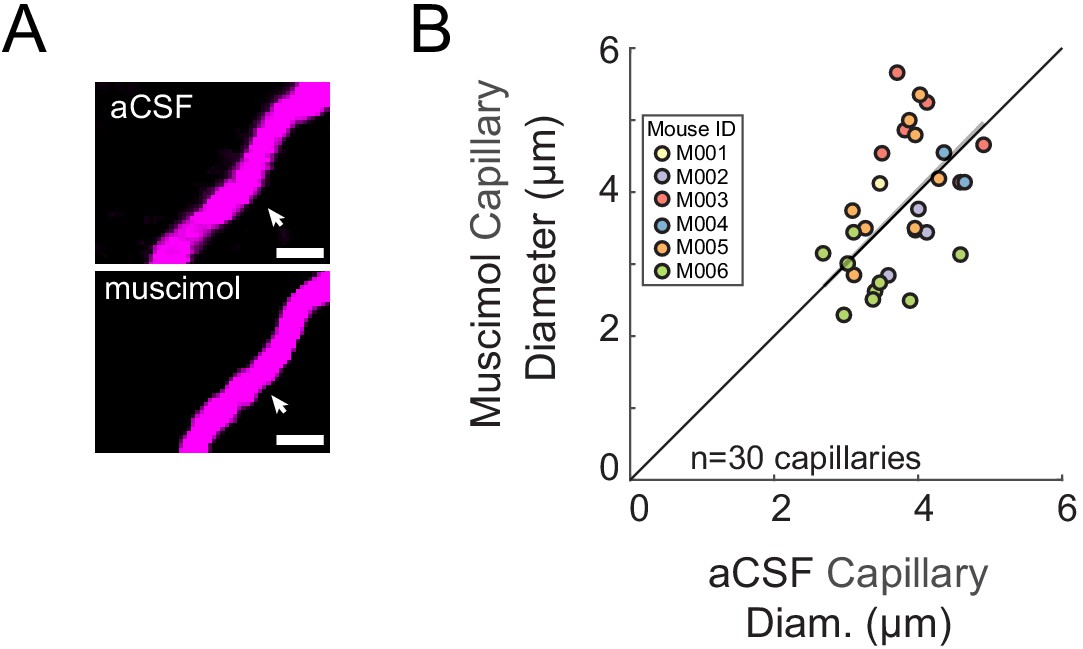
Muscimol infusion did not significantly affect capillary diameter.
(A) Representative images of the same capillary after vehicle infusion (left) and after muscimol infusion (right). Scale bar 5 μm. (B) Capillary diameter measured after vehicle infusion (x-axis) vs. after muscimol infusion (y-axis) showed no significant changes (0.03 ± 0.85 µm LME p<0.94, n = 6 mice, 30 capillaries). The point outlined in green is representative image from A.
Figure 1—figure supplement 4

Muscimol infusion did not significantly affect basal arteriole diameter variance.
(A) Scatter plot of basal arteriole diameter variance during stationary periods following vehicle infusion (x-axis) versus muscimol infusion (y-axis). There was no significant change in arterial diameter variance. The variance measurements are from the same vessels in Figure 1H. (B) Locomotion induces rapid dilation in pial arterioles that is attenuated by muscimol infusion. Arteriole diameter measured after vehicle infusion (black) and after muscimol infusion (red). The tick marks denote periods of locomotion.
Figure 1—figure supplement 5
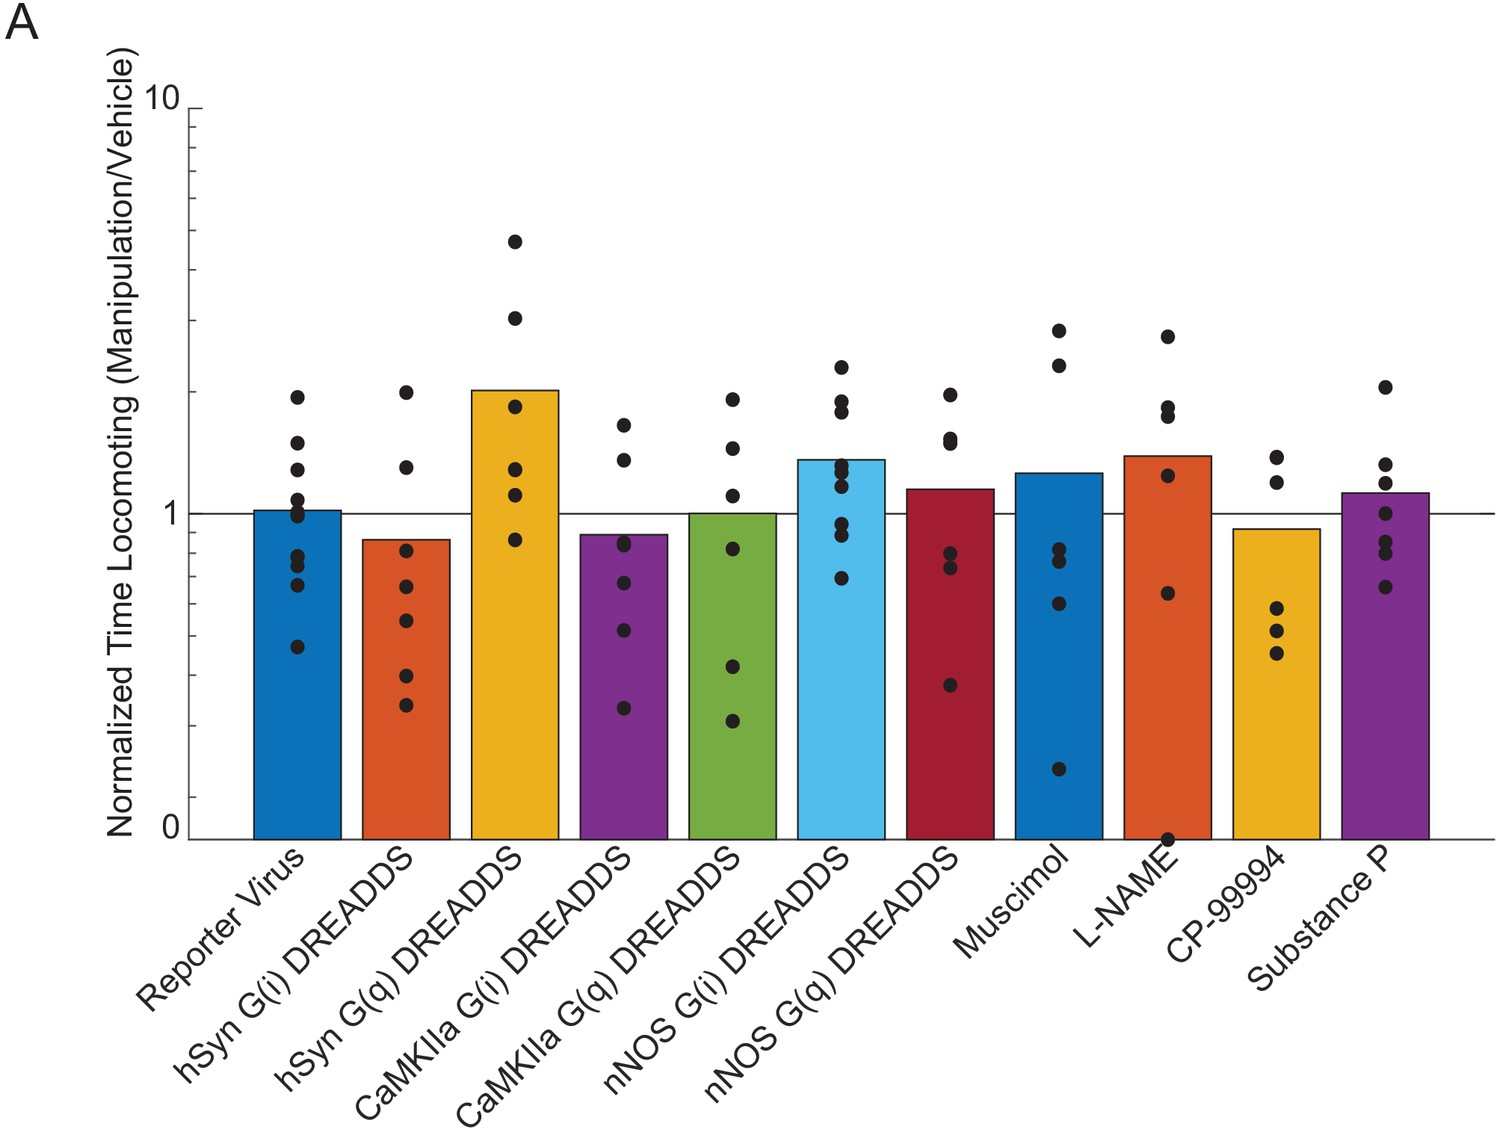
Effects of chemogenetic and pharmacological manipulation on locomotion behavior.
Plot showing the amount of time locomoting during 2PLSM imaging for each manipulation normalized by the amount of time locomoting with the vehicle. No manipulation resulted in a significant change in the behavior (LME, all p-values were Bonferroni corrected by the number of different viruses used or by the number of different drugs infused: Reporter Virus p<1, n = 12 mice; muscimol p<1, n = 6 mice; hSyn-G(i) DREADDs p<1, n = 7 mice; hSyn-G(q) DREADDs p<0.3, n = 7 mice; CaMKIIa-G(i) DREADDs p<1, n = 7 mice; CaMKIIa-G(q) DREADDs p<1, n = 6 mice; nNOS-G(i) DREADDs p<0.2, n = 9 mice; nNOS-G(q) DREADDs p<1, n = 6 mice; L-NAME p<1, n = 6 mice; CP-99994 p<1 n = 7 mice; Substance P p<1, n = 7 mice).
Figure 2 with 2 supplements
Neural activity bidirectionally controls basal arteriole diameter.
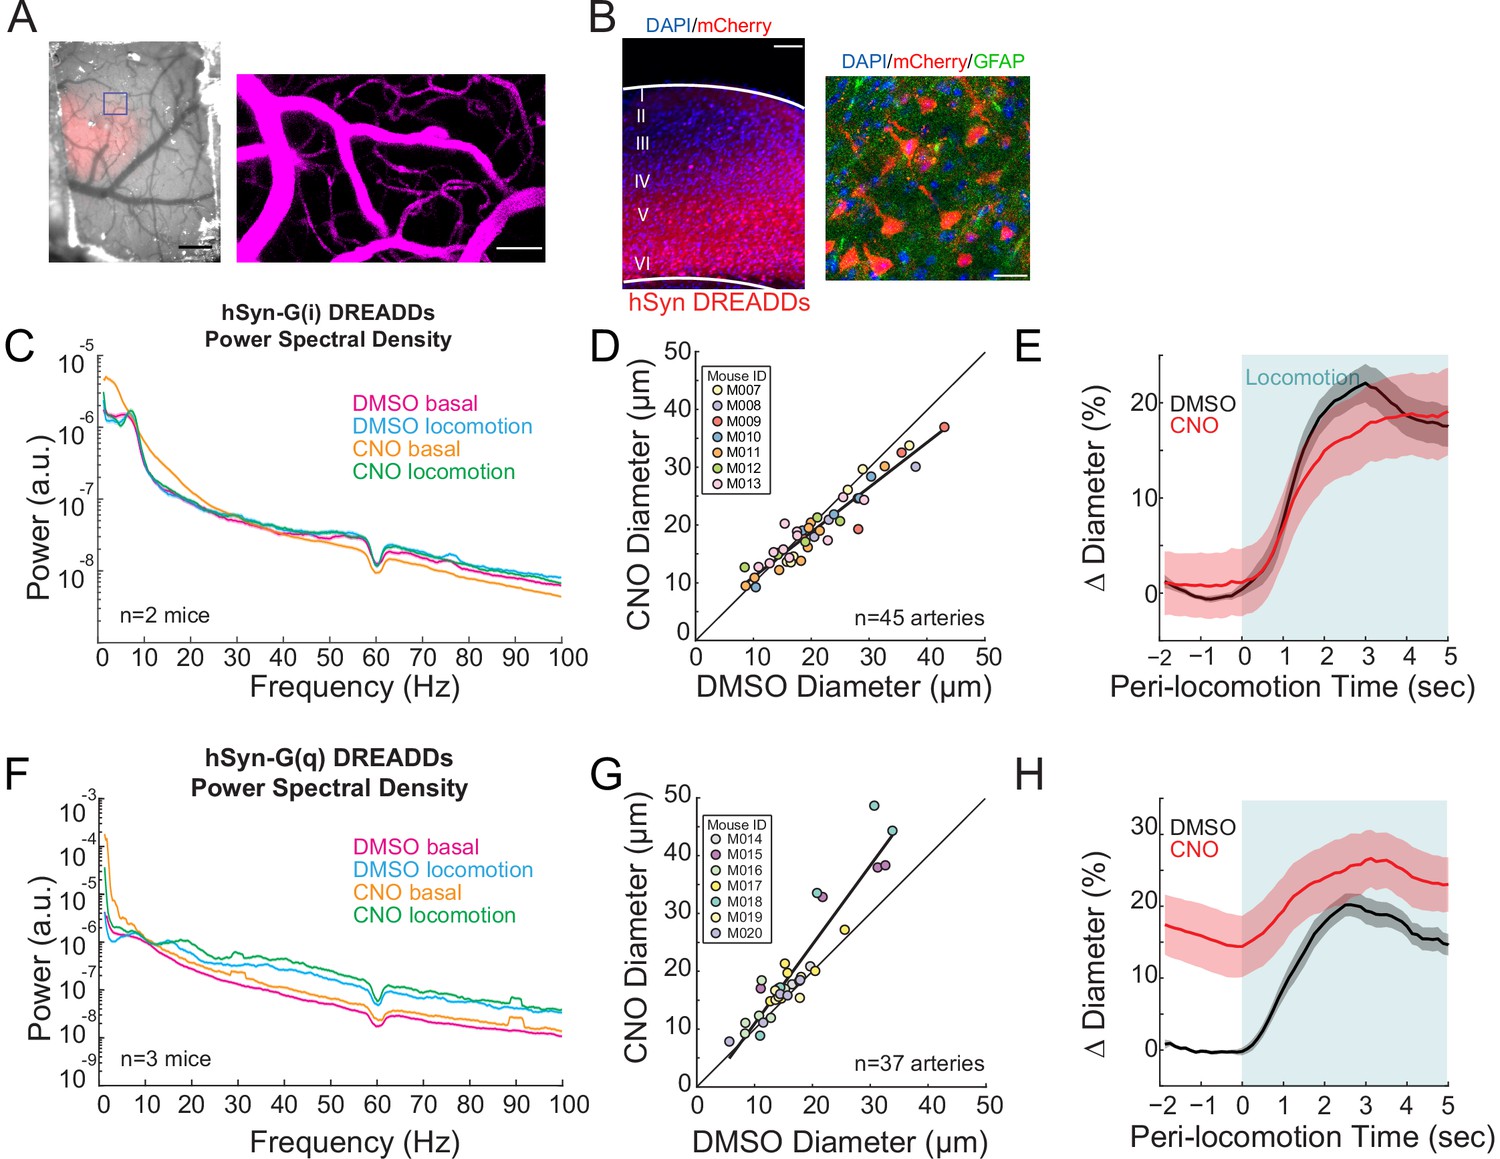
(A) Left, image through the polished and reinforced thinned-skull window showing AAV expression (red) in the somatosensory cortex (scale bar 1 mm). Right, vasculature within box of A. (B) Representative image of AAV-hSYN-HA-hM3D(Gq)-mCherry expressing cortex. Left is wide field image of hSyn-mCherry DREADDs virus (red) in cortex with DAPI (blue) staining (scale bar 100 μm). Right is magnified image of hSyn-mCherry DREADDs virus (red) in cortex with DAPI (blue) and GFAP (green) staining (scale bar 30 μm), showing the virus was not expressed in astrocytes. Data in (C–E) are from mice injected with AAV-hSYN-HA-hM4D(Gi)-mCherry, data in (F–H) is from mice injected with AAV-hSYN-HA-hM3D(Gq)-mCherry. (C) LFP power spectra during stationary periods (basal) and locomotion after CNO injection in hSyn G(i) DREADDs mice, normalized to stationary periods during vehicle injection in the same animal. (D) Plot of basal arteriole diameter after vehicle injection (x-axis) versus CNO injection (y-axis). (E) Population locomotion-triggered averages for vessels ≤ 25 µm in diameter after vehicle and CNO injections. (F) LFP power spectra during stationary periods (basal) and locomotion after CNO injection in hSyn G(q) DREADDs mice, normalized to stationary periods during vehicle injection of the same mouse. (G) Plot of basal arteriole diameter after vehicle injection (x-axis) versus CNO injection (y-axis). (H) Population locomotion-triggered averages in response to locomotion after vehicle and CNO injections.
Figure 2—figure supplement 1
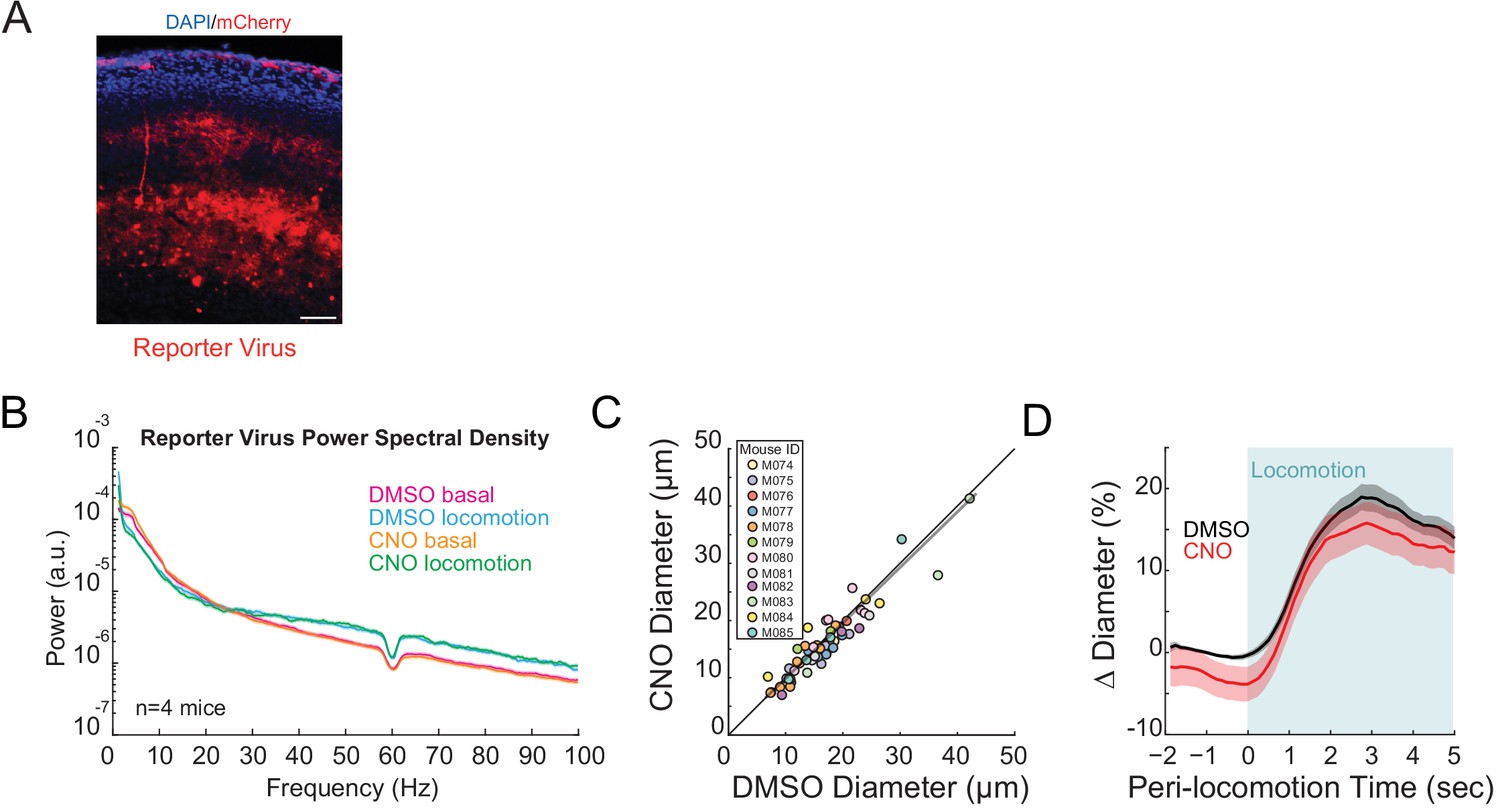
No significant effect of CNO on basal arteriole diameters or neural activity.
(A) Representative cortical sections showing mCherry expressing neurons (red) and cell nuclei (DAPI, blue). Scale bar is 100 μm. Data in B-D are from mice injected with AAV-CMV-TurboRFP-WPRE-rBG (fluorescent reporter virus). (B) LFP power spectra during stationary periods (basal) and locomotion after CNO injection, normalized to vehicle injection in the same mouse. CNO injection in mice infected with fluorescent reporter virus did not significantly change neural activity in the gamma band (basal −4.2 ± 5.0%, p<0.40; locomotion, +3.0 ± 2.3%, p<0.23, n = 4). (C) Plot of basal arteriole diameter after vehicle injection (x-axis) versus CNO injection (y-axis). There were no significant changes in basal diameter (−3.2 ± 14.5%, LME p<0.46 n = 12 mice, 56 vessels). (D) Locomotion-triggered averages after vehicle (black, 17.7 ± 1.5%) and CNO (red, 14.6 ± 2.6%) injections (LME p<1, n = 12 mice, 39 arterioles in FL/HL representation) for arterioles ≤ 25 µm in basal diameter.
Figure 2—figure supplement 2
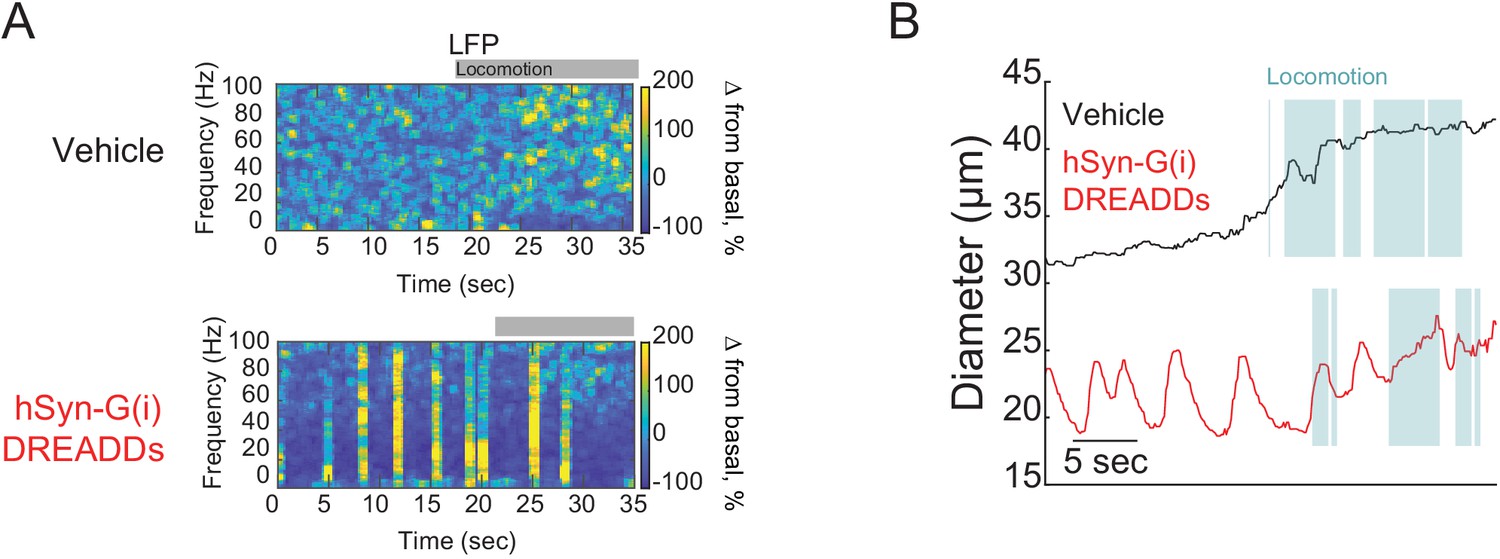
hM4D-G(i) DREADDs cause bursts on neural activity.
(A) Representative trial after vehicle (top) or CNO (bottom) injection in hSyn-G(i) DREADDs mice. The gamma band power of the local field potential (LFP) showed that the CNO induced bursting activity every few seconds in hSyn-G(i) DREADDs mice. (B) Plot of arteriole diameters after vehicle injection (black) and after CNO injection (red). CNO caused intermittent dilations of arteries in periods without locomotion at a similar frequencies as the burst seen in the LFP.
Figure 3

Activity, but not of pyramidal neurons, bidirectionally controls basal arteriole diameter.
(A) Representative image of AAV-CaMKIIa-hM3D(Gq)-mCherry infected cortex, where DREADDs are expressed under a CaMKIIa promoter. Top image is wide field image of CaMKIIa-mCherry DREADDs virus (red) in cortex with DAPI (blue) staining. Scale bar 100 μm. Bottom is a magnified image of CaMKIIa-mCherry DREADDs (red) expressed in cortex with DAPI (blue) and αCaMKII (green) staining showing expression in excitatory neurons. Scale bar 30 μm. (B) Representative LFP spectrograms of CaMKIIa-G(i) DREADD expressing mouse after vehicle (left) or CNO (right) injection. Locomotion events are denoted by shading. (C) Representative LFP spectrograms of CaMKIIa-G(q) DREADD expressing mouse (expression in pyramidal neurons) after vehicle (left) or CNO (right) injection. Data in D-F are from mice injected with AAV-CaMKIIa-hM4D(Gi)-mCherry, data in G-H is from mice injected with AAV-CaMKIIa-hM4D(Gq)-mCherry (expression in pyramidal neurons). (D) LFP power spectra during stationary periods (basal) and locomotion after CNO injection in CaMKIIa G(i) DREADDs mice, normalized to stationary periods during vehicle injection of the same mouse. (E) Plot of basal arteriole diameter after vehicle injection (x-axis) versus CNO injection (y-axis). (F) Population locomotion-triggered averages after vehicle and CNO injections for arterioles ≤ 25 µm in basal diameter. (G) LFP power spectra during stationary (basal) and locomotion periods after CNO injection in CaMKIIa G(q) DREADDs mice, normalized to stationary periods during vehicle injection of the same mouse. (H) Plot of basal arteriole diameter after vehicle injection (x-axis) versus CNO injection (y-axis). (I) Population locomotion-triggered averages after vehicle and CNO injections.
Figure 4 with 1 supplement
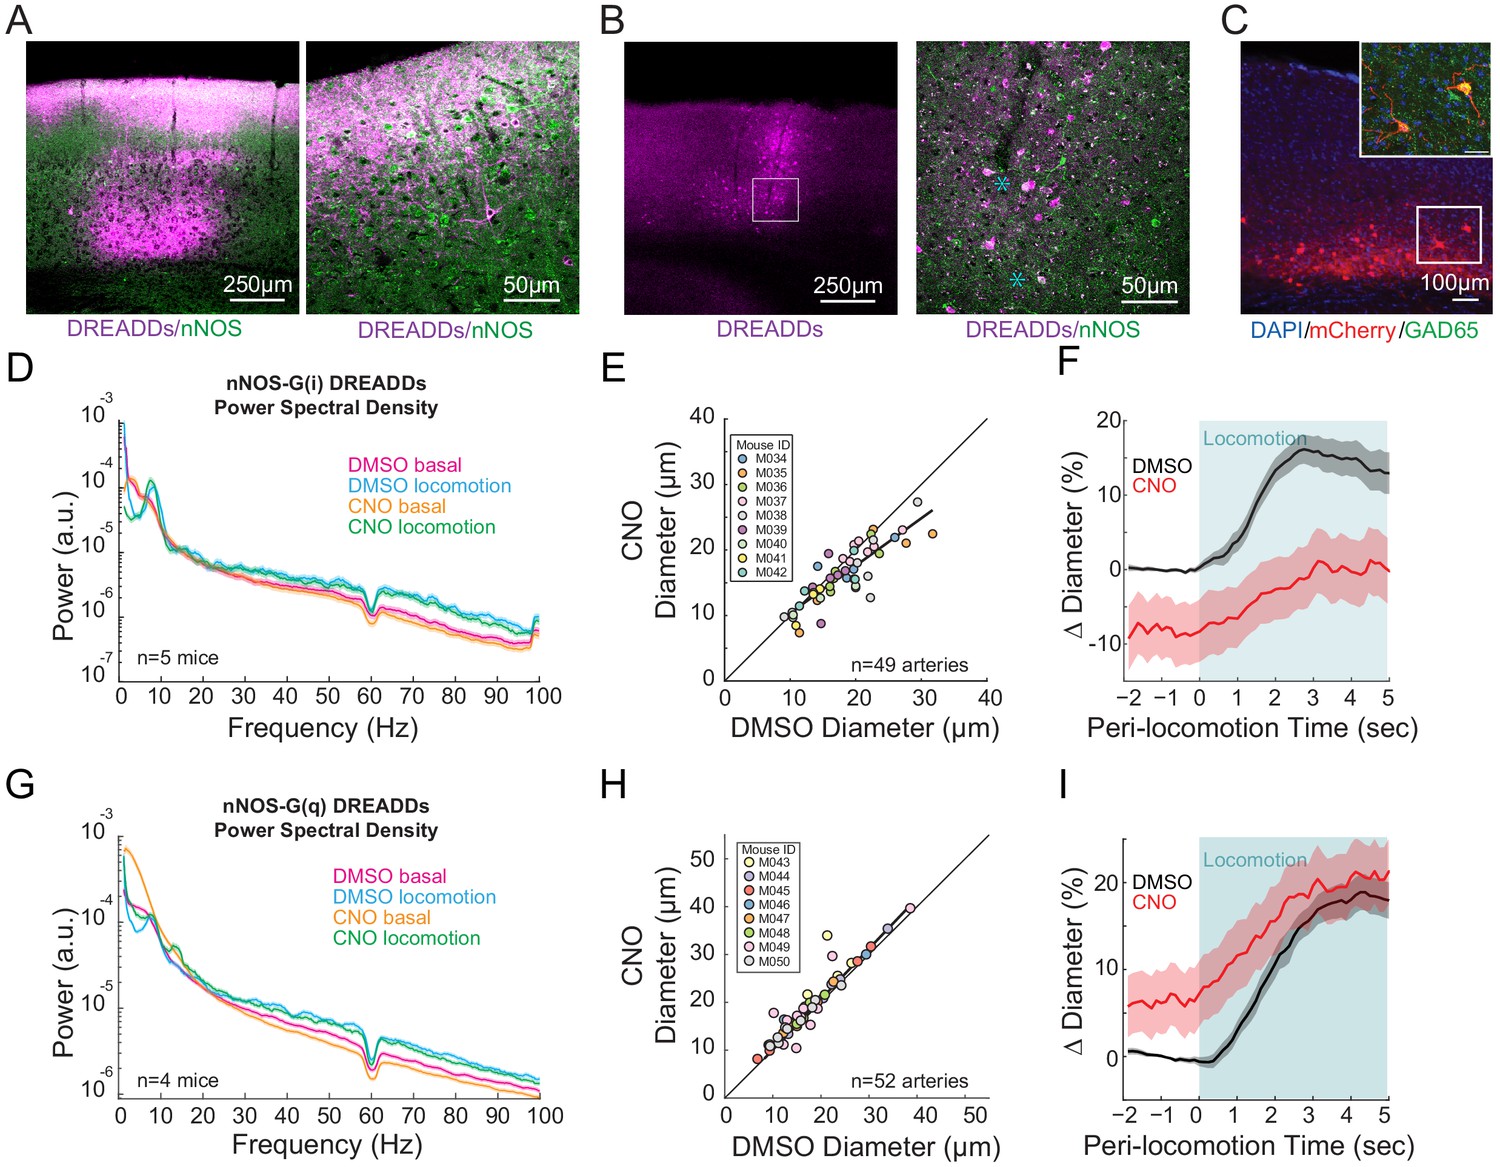
nNOS expressing neurons controls arteriole diameter independent of overall neural activity.
(A) Representative image of cortex taken of AAV-hSyn-DIO-hM3D(Gq)-mCherry in nNOS-cre mice, where DREADDs expressed in nNOS+ cells. The mCherry label is magenta, nNOS antibody is green. Co-labeling in processes in cell bodies shows up as white. Blue asterixis denote putative type 1 nNOS neurons. Dark vertical streaks are blood vessels. (B) Left, wide-field image of DREADD-infected somatosensory cortex. Right, enlargement of area in the white box, showing expression around blood vessel. (C) Left image is wide-field image of nNOS-mCherry DREADDs expression (red) in cortex with DAPI (blue) staining. Scale bar 100 μm. Right image is zoomed image of nNOS-mCherry DREADDs virus (red) in cortex with DAPI (blue) and GAD65 (green) staining, Scale bar 30 μm. Data in D-F are from nNOS-cre mice injected with AAV-hSyn-DIO-hM4D(Gi)-mCherry, data in G-I is from nNOS-cre injected with AAV-hSyn-DIO-hM4D(Gq)-mCherry. (D) LFP power spectra during stationary periods (basal) and locomotion after CNO injection in nNOS G(i) DREADDs mice, normalized to vehicle injection of the same mouse. (E) Plot of basal arteriole diameter after vehicle injection (x-axis) versus CNO injection (y-axis). (F) Population locomotion-triggered diameter averages after vehicle and CNO injections for arterioles ≤ 25 µm in basal diameter. (G) LFP power spectra during stationary periods (basal) and locomotion after CNO injection in nNOS G(q) DREADDs mice. (H) Plot of basal arteriole diameter after vehicle injection (x-axis) versus CNO injection (y-axis). (I) Population locomotion-triggered averages after vehicle and CNO injections for arterioles ≤ 25 µm in basal diameter.
Figure 4—figure supplement 1

NO produced by nNOS expressing neurons controls arteriole diameter independent of overall neural activity.
Data in A-C are from mice after local L-NAME infusions through a chronically implanted cannula. (A) LFP power spectra during stationary (basal) and locomotion periods after L-NAME infusion, normalized to vehicle infusion in the same mouse. (B) Plot of basal arteriole diameter after vehicle (x-axis) versus L-NAME infusion (y-axis). L-NAME caused a significant decrease in arterial diameter. (C) Population locomotion-triggered average after vehicle and L-NAME infusions for vessels ≤ 25 µm in baseline diameter. For both cases, the diameters are normalized by the average basal diameter of the vessel after vehicle infusion. (D) Histograms of the percentage change in basal arteriole diameter after treatment with L-NAME (n = 6 mice, 36 vessels) and nNOS-G(i) DREADDs after CNO injection (n = 9 mice, 49 vessels) relative to vehicle controls (aCSF infusions and vehicle injection, respectively). There was no significant difference between the groups.
Figure 5 with 2 supplements
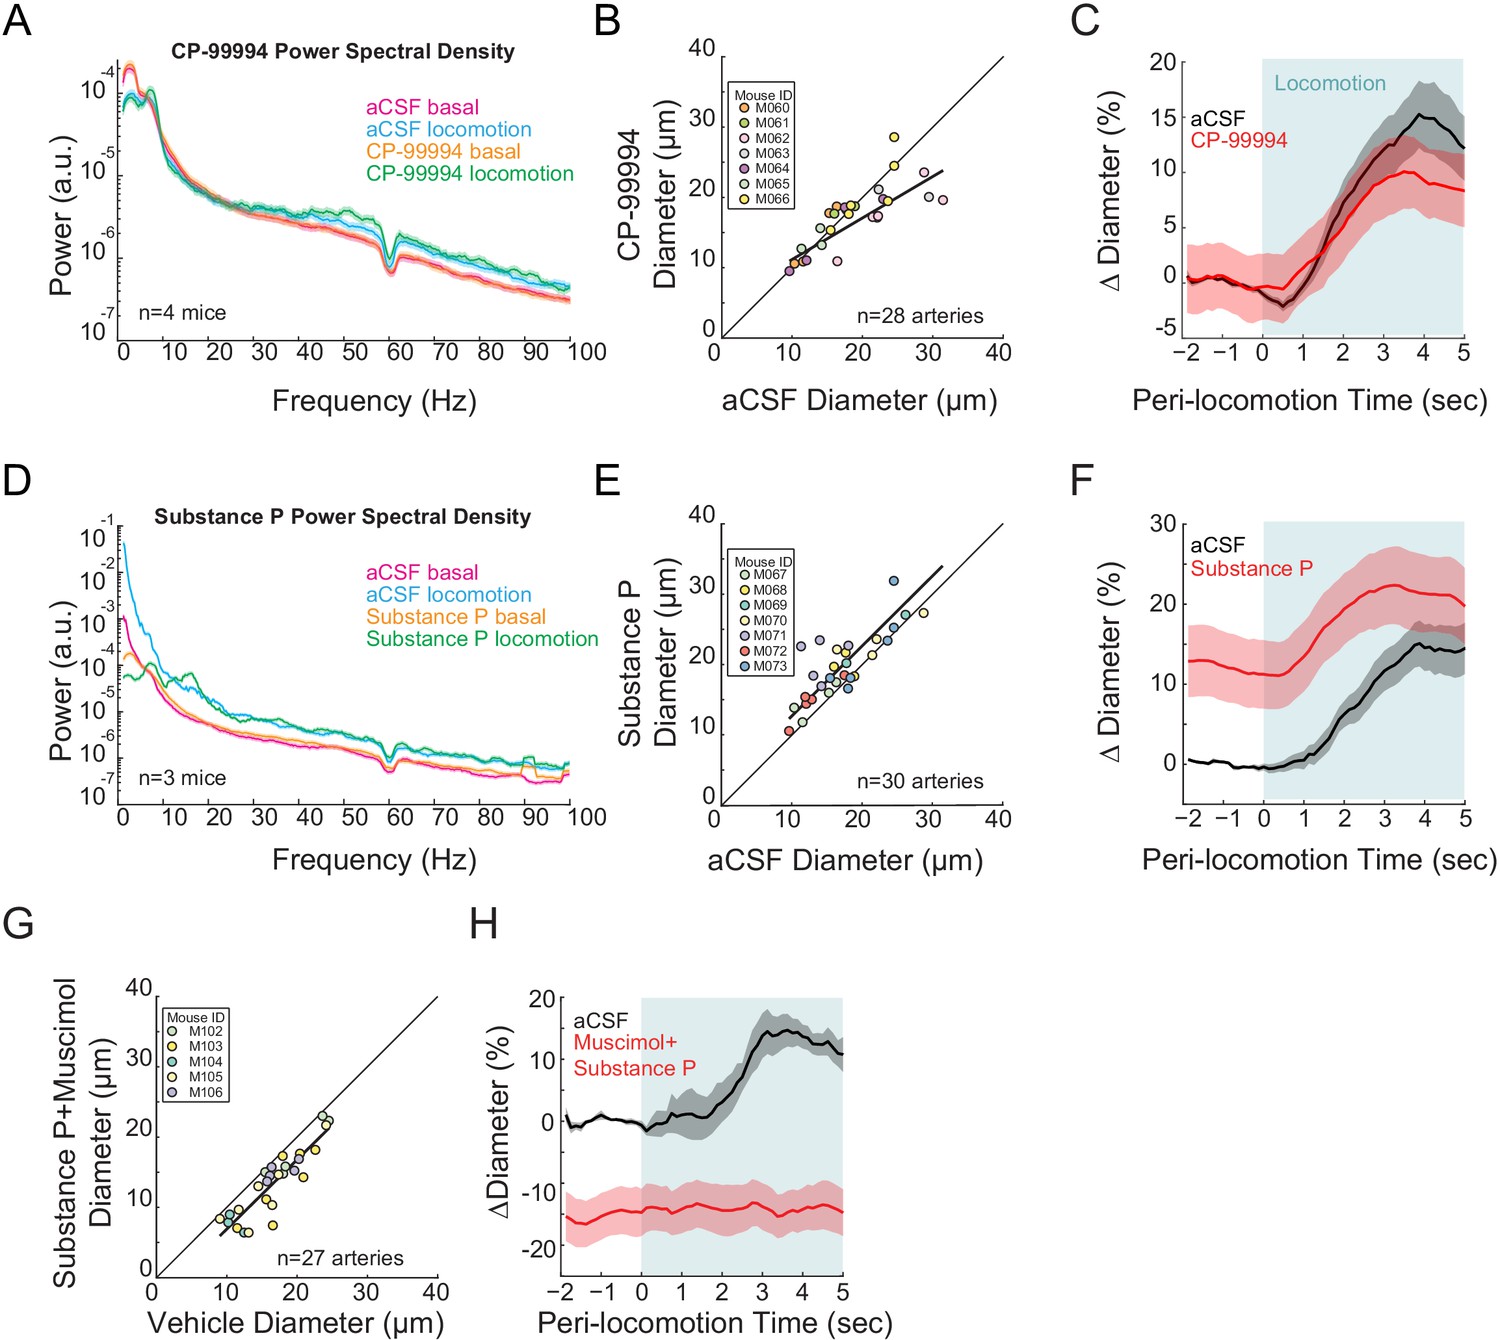
Type I nNOS expressing neurons control basal arteriole diameter.
Data in A-C are from mice after local CP-99994 infusions, which will block the excitatory Substance P receptors on type1 nNOS neurons, data in D-E is from mice after Substance P infusions, which will excite Type1 nNOS neurons. (A) LFP power spectra during stationary (basal) and locomotion periods after CP-99994 infusion, normalized to vehicle infusion in the same mouse. (B) Plot of basal arteriole diameter after vehicle (x-axis) versus CP-99994 infusion (y-axis). (C) Population locomotion-triggered averages after vehicle or CP-99994 infusions for arterioles ≤ 25 µm in basal diameter. (D) LFP power spectra during stationary (basal) and locomotion periods after Substance P infusion, normalized to vehicle infusion in the same mouse. (E) Plot of basal arteriole diameter after vehicle infusion (x-axis) versus Substance P infusion (y-axis). (F) Population locomotion-triggered averages after vehicle or Substance P infusions for arterioles ≤ 25 µm in basal diameter. (G) Plot of basal arteriole diameter after vehicle infusion (x-axis) versus muscimol and Substance P infusion (y-axis). (H) Locomotion-triggered averages after vehicle or muscimol/Substance P infusions for arterioles ≤ 25 µm in basal diameter.
Figure 5—figure supplement 1
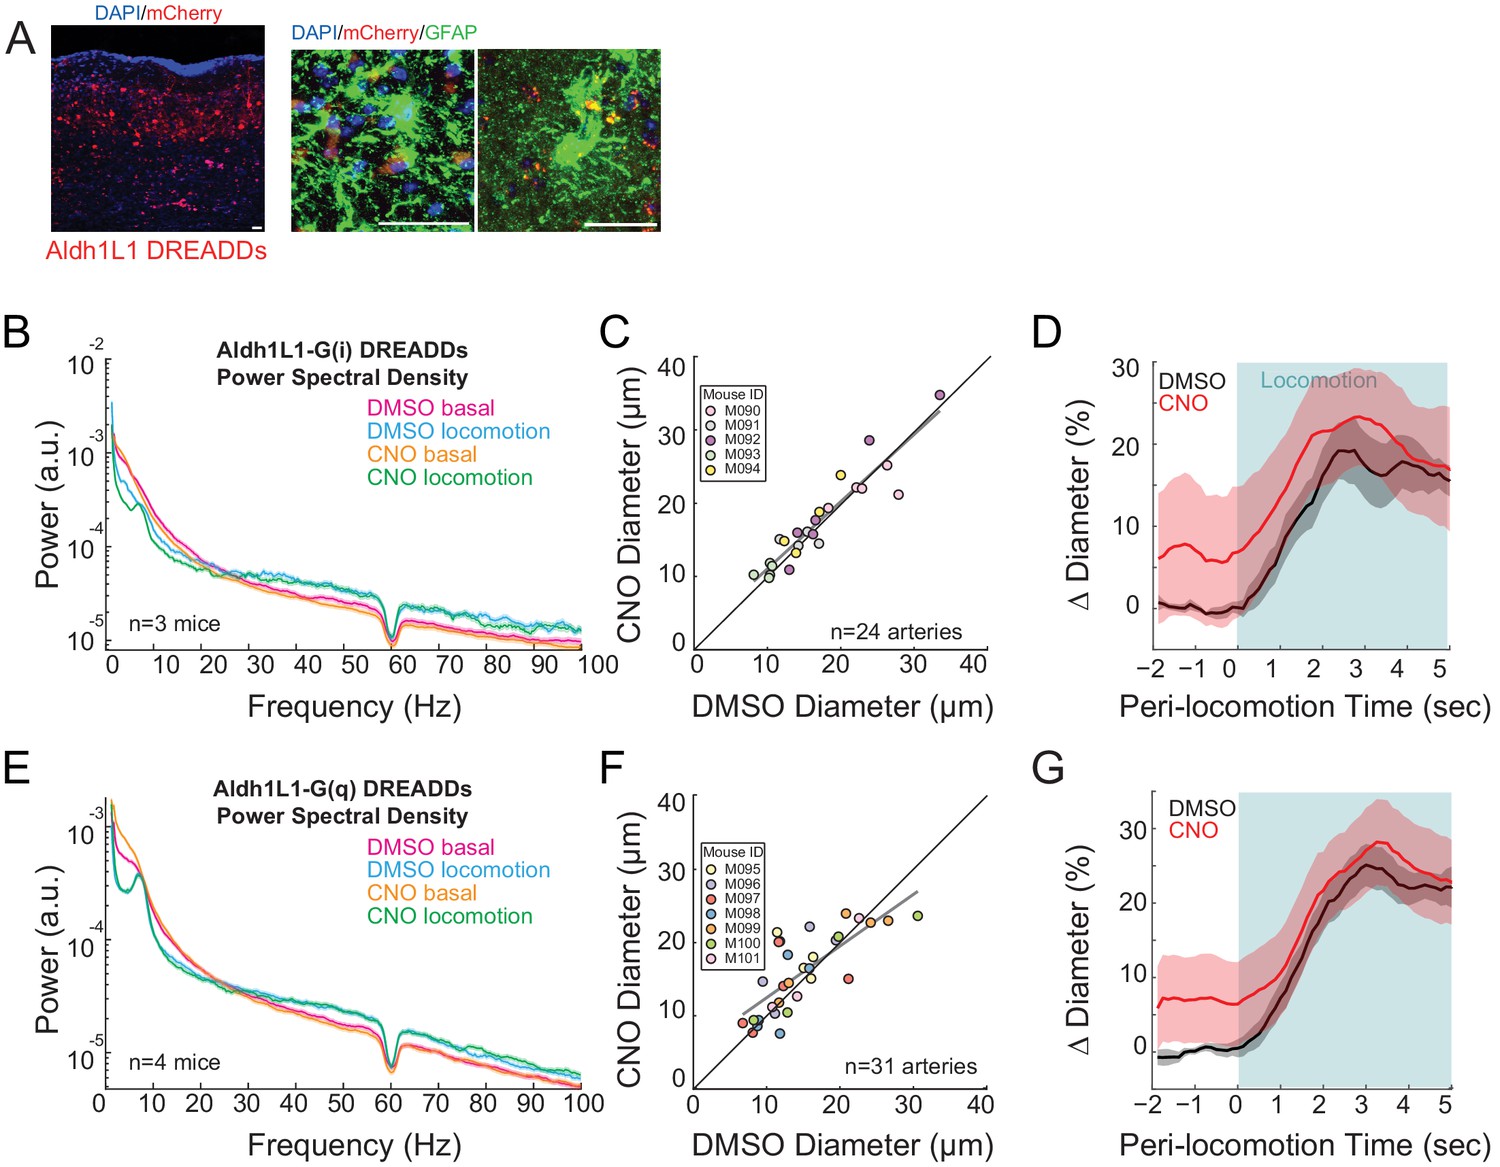
No significant effect of chemogenetic manipulation of astrocytes on basal vessel diameter or neural activity.
(A) Representative cortical sections showing mCherry expressing cells (red), GFAP staining (green), and cell nuclei (DAPI, blue). Scale bar is 100 μm. AAV-hSyn-DIO-hM3D(Gq)-mCherry in Aldh1L1-cre mice, where DREADDs are expressed in astrocytes. Data in B-D are from mice injected with AAV-hSyn-DIO-hM3D(Gi)-mCherry in Aldh1L1-cre mice, where DREADDs are expressed in astrocytes. (B) LFP power spectra during stationary periods (basal) and locomotion after CNO injection, normalized to vehicle injection in the same mouse. The fluorescent reporter virus does not significantly change neural activity in the gamma band (basal −20 ± 32.4%, p<0.53; locomotion, −5.2 ± 16.0%, p<0.3, n = 3). (C) Plot of basal arteriole diameter after vehicle injection (x-axis) versus CNO injection (y-axis). There were no significant changes in basal diameter (+4.3 ± 13.2%, LME p<0.64, n = 5 mice, 24 vessels). (D) Locomotion-triggered averages after vehicle (black, 17.0 ± 3.7%) and CNO (red, 21.4 ± 6.4%) injections (LME p<1, n = 5 mice, 19 arterioles in FL/HL representation) for arterioles ≤ 25 µm in basal diameter. Data in E-G are from mice injected with AAV-hSyn-DIO-hM3D(Gq)-mCherry in Aldh1L1-cre mice, where DREADDs expressed in astrocytes. (E) LFP power spectra during stationary periods (basal) and locomotion after CNO injection, normalized to vehicle injection in the same mouse. The CNO injection did not significantly change neural activity in the gamma band (basal −7.6 ± 3.6%, p<0.09; locomotion, +4.2 ± 4.2%, p<0.56, n = 4). (F) Plot of basal arteriole diameter after vehicle injection (x-axis) versus CNO injection (y-axis). There were no significant changes in basal diameter (+9.7 ± 28.9%, LME p<0.44 n = 7 mice, 31 vessels). (G) Locomotion-triggered averages after vehicle (black, 23.7 ± 2.8%) and CNO (red, 27.1 ± 5.6%) injections (LME p<1, n = 7 mice, 20 arterioles in FL/HL representation) for arterioles ≤ 25 µm in basal diameter.
Figure 5—figure supplement 2
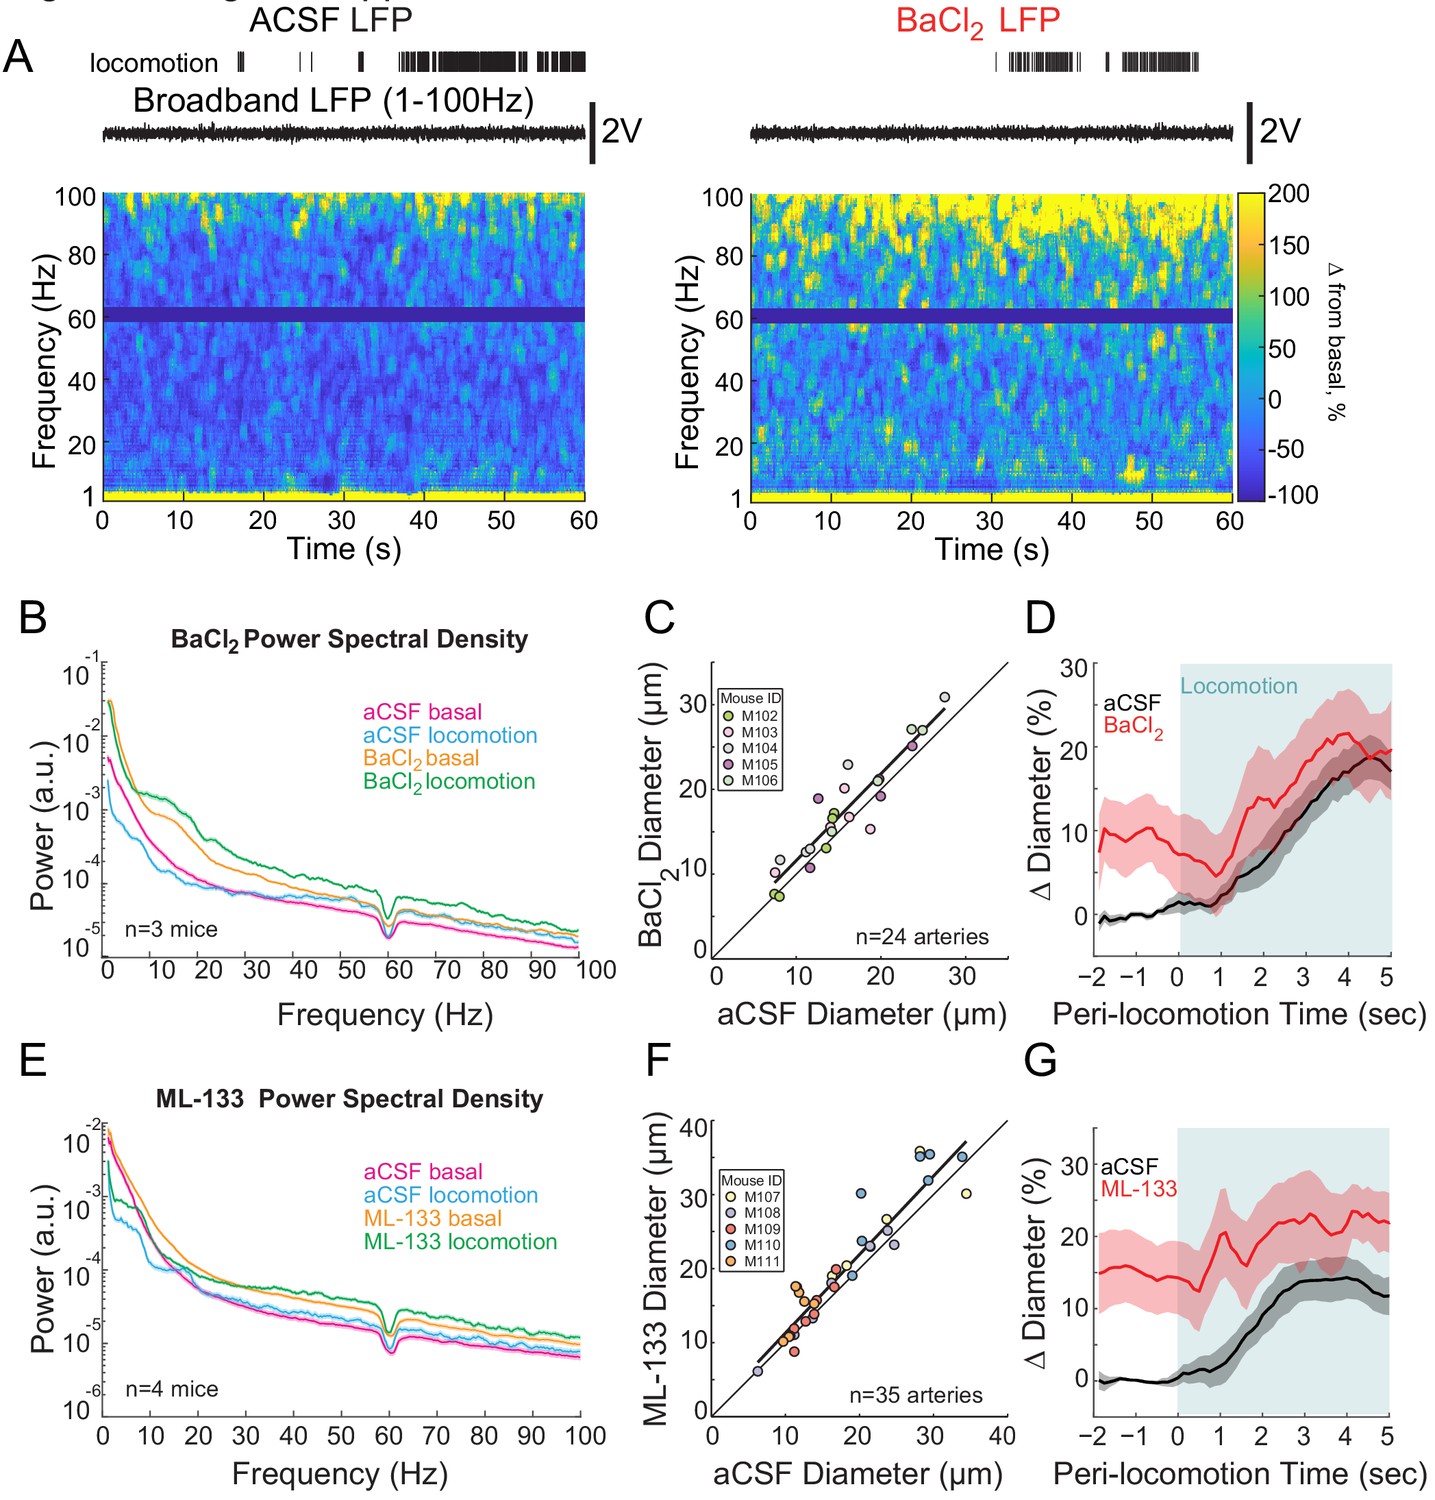
Kir-channel blockers increase in neural activity and basal arterial diameter.
(A) Representative trial after vehicle (left) or BaCl2 (right) infusion (Kir-channel blocker). BaCl2 infusion-induced epileptic-like activity. Locomotion events are denoted with shading. (B) LFP power spectra during stationary periods (basal) and locomotion after BaCl2 infusion, normalized to vehicle infusion in the same mouse. (C) Plot of basal arteriole diameter after vehicle infusion (x-axis) versus BaCl2 infusion (y-axis). The linear regression (black) was significantly different from the unity line. (D) Population locomotion-triggered average after vehicle (black) and BaCl2 (red) infusions for arterioles ≤ 25 µm in basal diameter. For both cases, the diameters were normalized by the average basal diameter of the vessel after vehicle infusion. (E) LFP power spectra during stationary periods (basal) and locomotion after ML-133 infusion, normalized to vehicle infusion in the same mouse. (F) Plot of basal arteriole diameter after vehicle infusion (x-axis) versus ML-133 infusion (y-axis). The linear regression (black) is significantly different from the unity line. (G) Locomotion-triggered averages after vehicle (black) and ML-133 (red) infusions for arterioles ≤ 25 µm in basal diameter. For both cases, the diameters were normalized by the average basal diameter of the vessel after vehicle infusion.
Figure 6 with 2 supplements
Comparisons of the effects of various manipulations on the basal diameters of pial and penetrating arterioles.
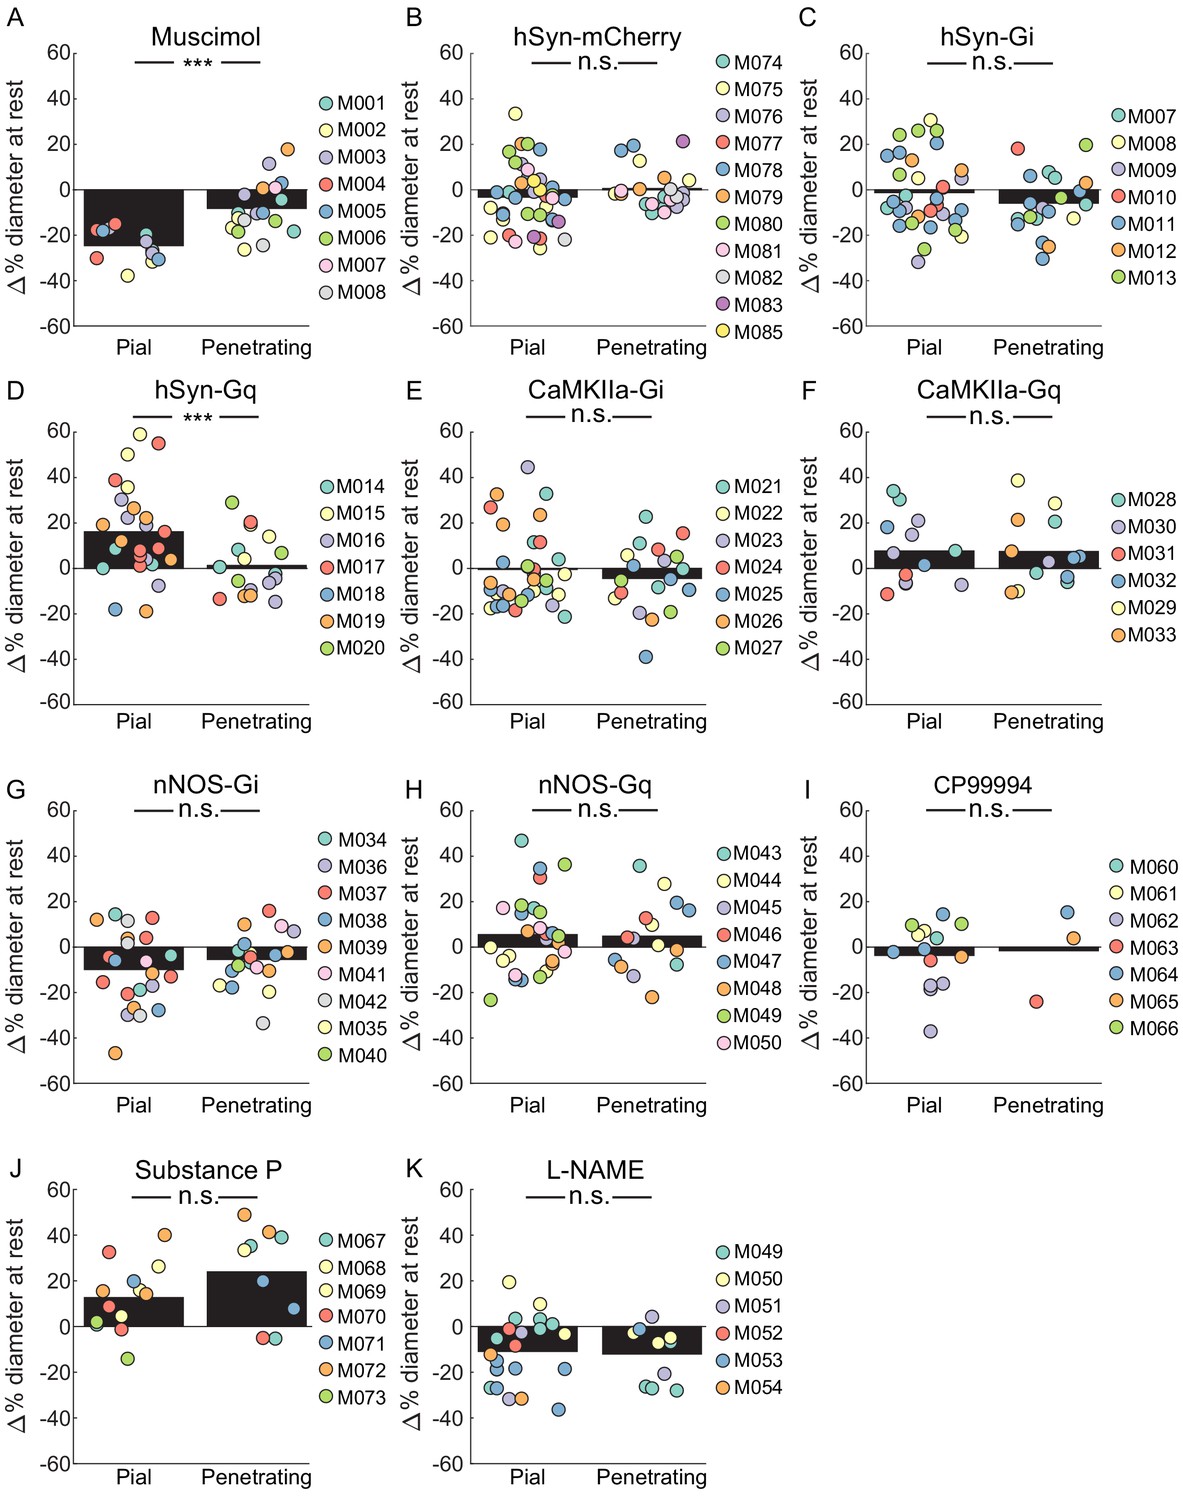
(A) Comparison of change in resting vessel diameter in penetrating and pial arteries after Muscimol infusion. There was a significant difference in the change of baseline diameter between pial and penetrating arteries with pial arteries displaying a larger change. (LME p<1.5 × 10⁻⁶, n = 8 mice, 12 pial, 18 penetrating vessels). (B) Comparison of change in resting vessel diameter in penetrating and pial arteries in hSyn-mCherry-expressing animals after CNO infusion. No significant difference was observed in change in baseline diameter between pial and penetrating arteries (LME p<0.25, n = 11 mice, 40 pial, 22 penetrating vessels). (C) Comparison of change in resting vessel diameter in penetrating and pial arteries in hSyn-Gi expressing animals after CNO infusion. No significant difference was observed in change in baseline diameter between pial and penetrating arteries. (LME p<0.3, n = 7 mice, 33 pial, 20 penetrating vessels). (D) Comparison of change in resting vessel diameter in penetrating and pial arteries in hSyn-Gq expressing animals after CNO infusion. There was a significant difference between the change in baseline diameter between pial and penetrating arteries with pial arteries displaying a larger change (LME p<0.001, n = 7 mice, 25 pial, 17 penetrating vessels). (E) Comparison of change in resting vessel diameter in penetrating and pial arteries in CaMKIIa-Gi expressing animals after CNO infusion. No significant difference was observed in change in baseline diameter between pial and penetrating arteries. (LME p<0.5, n = 7 mice, 33 pial, 20 penetrating vessels). (F) Comparison of change in resting vessel diameter in penetrating and pial arteries in CaMKIIa-Gq expressing animals after CNO infusion. No significant difference was observed in change in baseline diameter between pial and penetrating arteries. (LME p<1, n = 6 mice, 13 pial, 13 penetrating vessels). (G) Comparison of change in resting vessel diameter in penetrating and pial arteries in nNOS-Gi expressing animals after CNO infusion. No significant difference was observed in change in baseline diameter between pial and penetrating arteries. (LME p<0.3, n = 9 mice, 22 pial, 19 penetrating vessels). (H) Comparison of change in resting vessel diameter in penetrating and pial arteries in nNOS-Gq expressing animals after CNO infusion. No significant difference was observed in change in baseline diameter between pial and penetrating arteries. (LME p<1, n = 8 mice, 28 pial, 15 penetrating vessels). (I) Comparison of change in resting vessel diameter in penetrating and pial arteries after CP99994 infusion. No significant difference was observed in change in baseline diameter between pial and penetrating arteries (LME p<1, n = 7 mice, 14 pial, three penetrating vessels). (J) Comparison of change in resting vessel diameter in penetrating and pial arteries after Substance P infusion. No significant difference was observed in change in baseline diameter between pial and penetrating arteries (LME p<0.15, n = 7 mice, 13 pial, 9 penetrating vessels). (K) Comparison of change in resting vessel diameter in penetrating and pial arteries after L-NAME infusion. No significant difference was observed in change in baseline diameter between pial and penetrating arteries (LME p<0.5, n = 6 mice, 22 pial, 10 penetrating vessels).
Figure 6—figure supplement 1
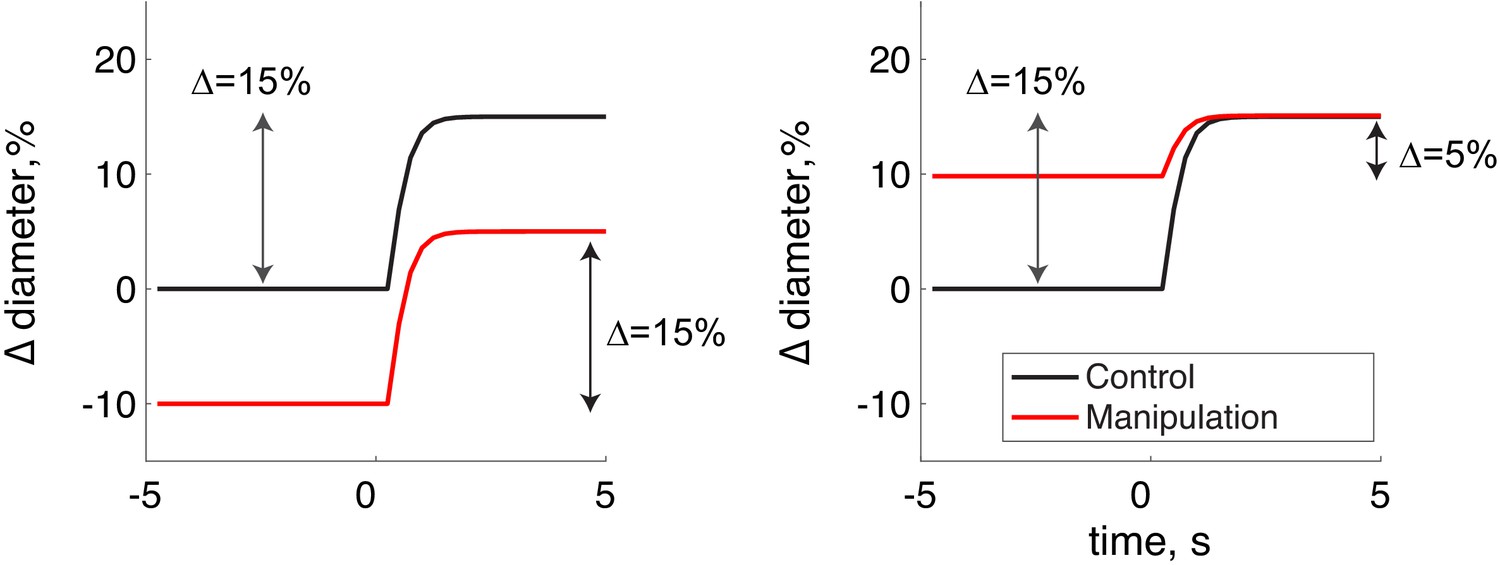
Schematic showing the calculation of the locomotion-evoked component of the diameter change.
In this schematic, the locomotion-evoked diameter change from the pre-locomotion is shown. Left, the manipulation causes an 10% baseline constriction relative to the control. During locomotion, in the manipulation condition the diameter rises 5% above the control baseline diameter, while it rises 15% in the locomotion condition. Using the change from pre-stimulus baseline, both control and manipulation show a 15% diameter change. Right, the case where the manipulation causes a 10% dilation in the baseline and a 15% dilation during locomotion gives a 5% change. This metric is used in the plots in Figure 6—figure supplement 2.
Figure 6—figure supplement 2
Locomotion triggered average diameter changes relative to locomotion diameter.
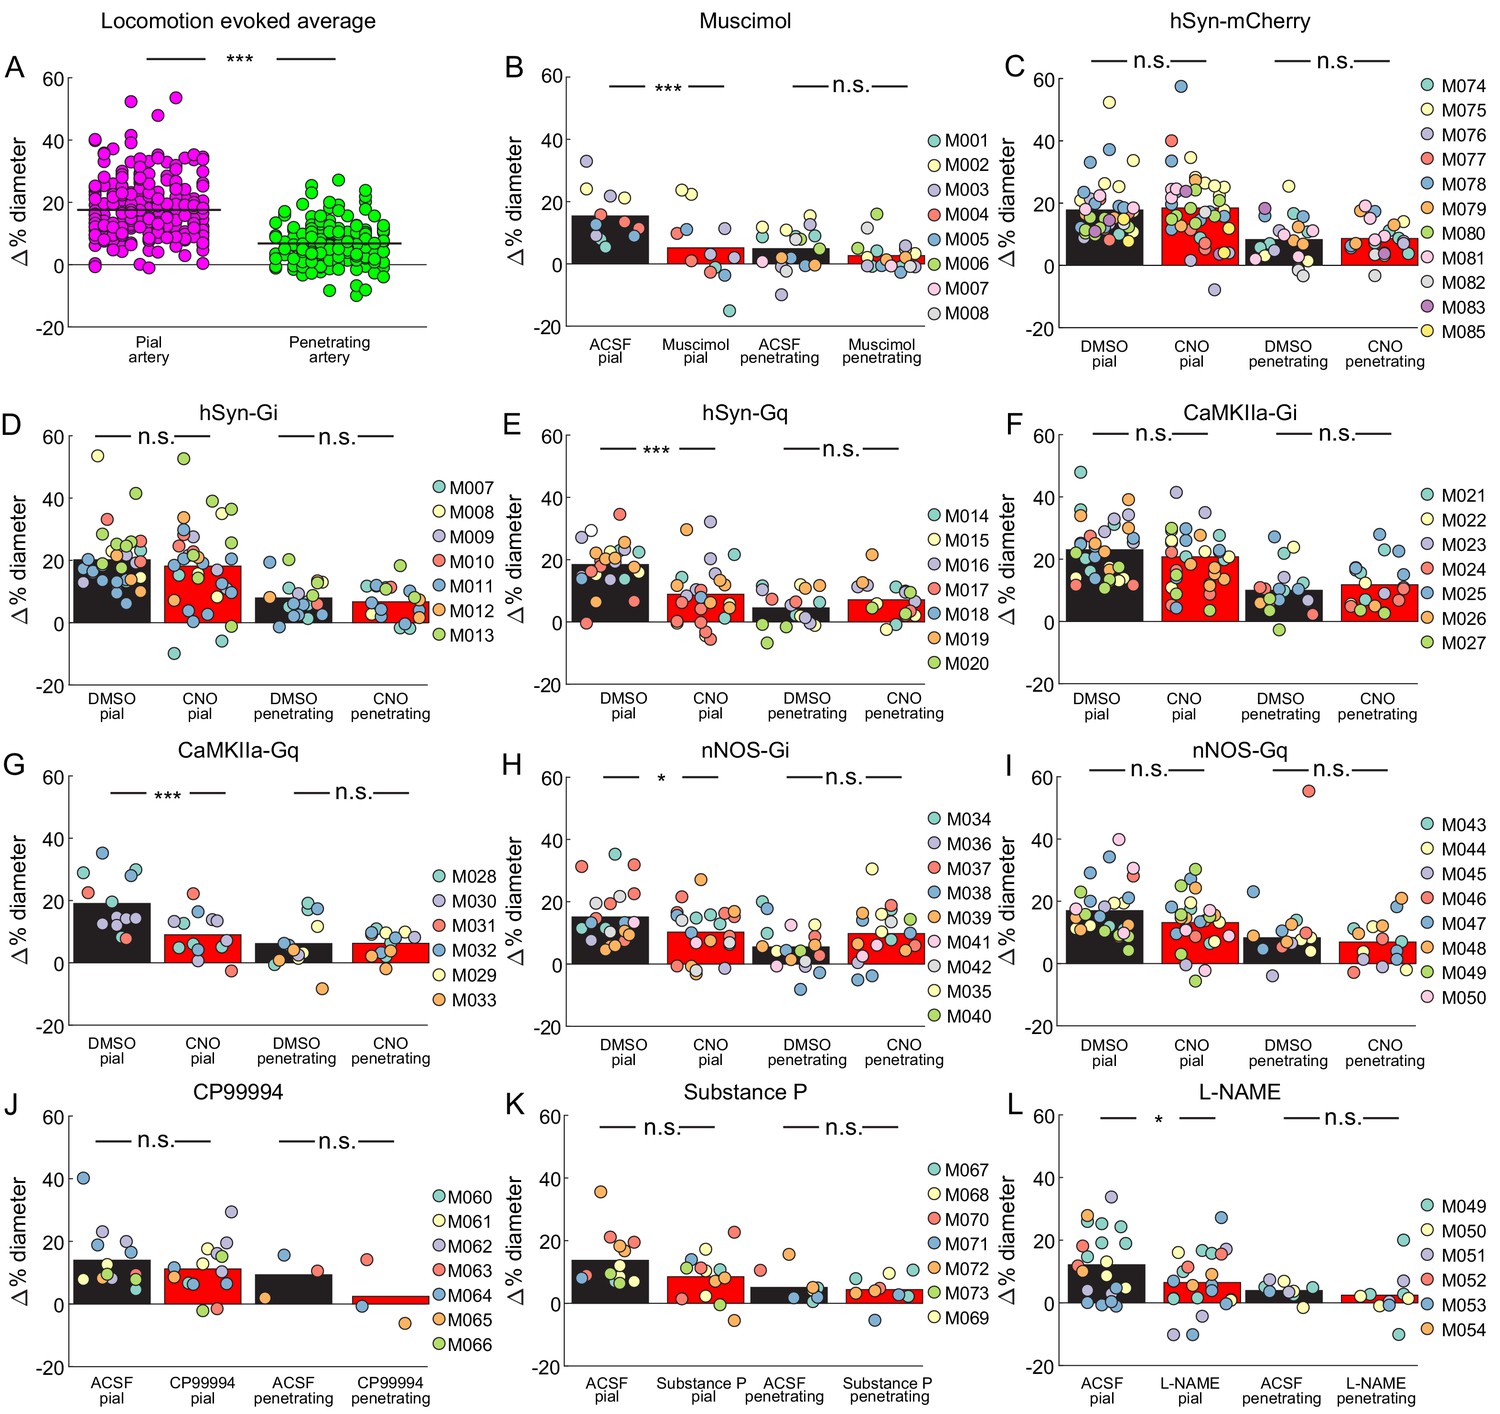
Baseline diameters for both vehicle and treatment conditions were calculated as the average diameter over the 2 s prior to locomotion onset for pial and penetrating arterioles. The steady-state locomotion-evoked response was calculated as the average vessel diameter for 1 s from 3 to 4 s after locomotion onset. Percentage change in vessel diameter was calculated as a percentage of the within treatment group baseline value. Results are reported as % change ± standard deviation for vehicle and treatment conditions, respectively. n.s.- p>0.05, *p<0.05,***p<0.005. (A) Comparison of locomotion-evoked vessel diameter change in pial (n = 72 animals, 255 vessels) and penetrating (n = 66 animals, 166 vessels) arteries. There was a significant difference in the locomotion-evoked change of diameter between pial and penetrating arteries with pial arteries displaying a larger change (17.57 ± 9.35% pial vs. 6.79 ± 6.54% penetrating LME p<8e-37). (B-I). Comparison of vehicle or treatment delivered locomotion-evoked diameter change in penetrating and pial arteries. (B) Muscimol infusion results in a significant decrease in locomotion-evoked response in pial (n = 5 animals, 12 vessels, 15.37 ± 8.11% vs. 5.14 ± 11.09%, LME p<0.001) but not penetrating vessels (n = 8 animals, 18 vessels, 4.90 ± 6.49% vs. 2.66 ± 4.80%, LME p<0.197) compared to ACSF infusion. (C) hSyn-mCherry, CNO infusion results in no significant change in locomotion-evoked response in pial (n = 11 animals, 40 vessels, 17.79 ± 8.94% vs. 18.46 ± 11.61%, LME p<0.736) or penetrating vessels (n = 8 animals, 22 vessels, 8.30 ± 7.25% vs. 8.62 ± 5.56%, LME p<0.857) compared to DMSO infusion. (D) hSyn-Gi, CNO infusion results in no significant change in locomotion-evoked response in pial (n = 7 animals, 33 vessels, 20.19 ± 9.41% vs. 18.14 ± 13.56%, LME p<0.428) or penetrating vessels (n = 7 animals, 20 vessels, 7.92 ± 5.73% vs. 6.70 ± 5.45%, LME p<0.446) compared to DMSO infusion. (E) hSyn-Gq, CNO infusion results in a significant decrease in locomotion-evoked response in pial (n = 6 animals, 25 vessels, 18.42 ± 7.49% vs. 8.87 ± 9.74%, LME p<10−4) but not penetrating vessels (n = 6 animals, 17 vessels, 4.51 ± 5.68% vs. 7.13 ± 5.93%, LME p<0.112) compared to DMSO infusion. (F) CaMKIIa-Gi, CNO infusion results in no significant change in locomotion-evoked response in pial(n = 7 animals, 33 vessels, 23.03 ± 9.20% vs. 20.76 ± 11.50%, LME p<0.314) or penetrating vessels (n = 7 animals, 20 vessels, 9.99 ± 7.26% vs. 11.80 ± 7.38%, LME p<0.336) compared to DMSO infusion. (G) CaMKIIa-Gq. CNO infusion results in a significant decrease in locomotion-evoked response in pial(n = 4 animals, 13 vessels, 19.05 ± 9.00% vs. 9.01 ± 6.93%, LME p<0.003) but not penetrating vessels (n = 5 animals, 13 vessels, 6.17 ± 8.04% vs. 6.24 ± 3.97%, LME p<0.974) compared to DMSO infusion. (H) nNOS-Gi. CNO infusion results in a significant decrease in locomotion-evoked response in pial(n = 7 animals, 22 vessels, 15.12 ± 8.75% vs. 10.23 ± 8.20%, LME p<0.044) but not penetrating vessels (n = 9 animals, 19 vessels, 5.49 ± 6.96% vs. 9.80 ± 8.58%, LME p<0.074) compared to DMSO infusion. (I) nNOS-Gq, CNO infusion results in no significant change in locomotion-evoked response in pial (n = 8 animals, 28 vessels, 16.98 ± 8.74% vs. 13.14 ± 8.39%, LME p<0.093) or penetrating vessels (n = 6 animals, 15 vessels, 8.30 ± 5.83% vs. 6.91 ± 7.18%, LME p<0.510) compared to DMSO infusion. (J) CP99994 infusion results in no significant change in locomotion-evoked response in pial (n = 7 animals, 14 vessels, 13.99 ± 9.34% vs. 11.22 ± 8.31%, LME p<0.373) or penetrating vessels (n = 3 animals, three vessels, 9.36 ± 6.93% vs. 2.43 ± 10.52%, LME p<0.217) compared to ACSF infusion. (K) Substance P infusion results in no significant change in locomotion-evoked response in pial(n = 6 animals, 13 vessels, 13.72 ± 8.39% vs. 8.49 ± 7.63%, LME p<0.096) or penetrating vessels (n = 5 animals, nine vessels, 5.05 ± 5.01% vs. 4.40 ± 4.78%, LME p<0.760) compared to ACSF infusion. (L) L-NAME infusion results in a significant decrease in locomotion-evoked response in pial (n = 6 animals, 22 vessels, 12.14 ± 10.70% vs. 6.46 ± 9.30%, LME p<0.045) but not penetrating vessels (n = 4 animals, 10 vessels, 3.92 ± 2.47% vs. 2.45 ± 7.56%, LME p<0.547) compared to ACSF infusion.
Figure 7 with 3 supplements
Locomotion-evoked Ca2+ signals in neurons.
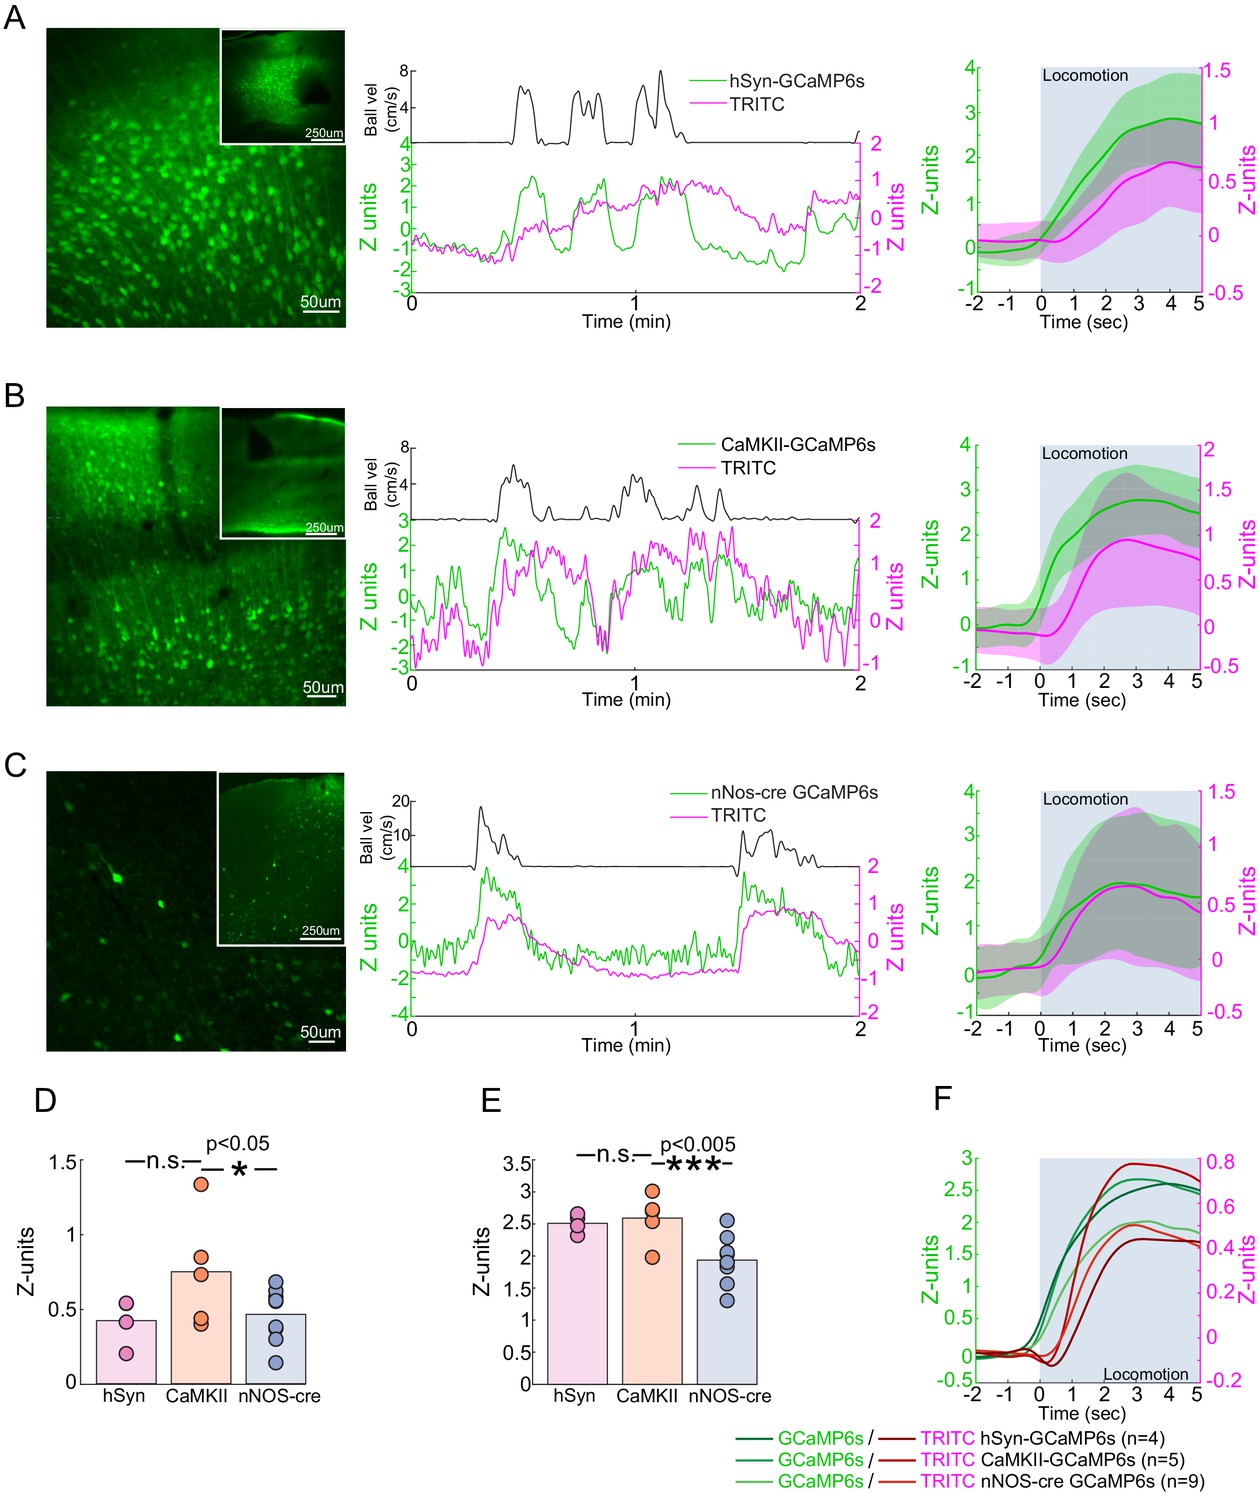
(A–C) Left, a representative image of cortex taken of AAV-hSyn-GCaMP6s in C57BL/6J mice (A), AAV-CaMKII-GCaMP6s in C57BL/6J mice (B) and AAV-Syn-FLEX-GCaMP6s in nNOS-cre mice. Note that there are substantially fewer cells labeled in AAV-Syn-FLEX-GCaMP6s in nNOS-cre mice. Center, a representative trace of TRITC (blood volume - magenta) and GCaMP6s (green) changes evoked by a single locomotion event (black trace above). Right, average locomotion-evoked blood volume and GCaMP6s changes of events >5 s and <10 s in duration from the example animal. Locomotion period shaded in blue. (D) Population average locomotion-evoked blood volume change. Bars are population mean of each GCaMP6s sub-type; circles are individual animal averages. (E) Population average locomotion-evoked GCaMP6s fluorescence change. Bars are population mean of each GCaMP6s sub-type; circles are individual animal averages. (F) Population average trace of locomotion-evoked changes in blood volume (red) and GCaMP (green) fluorescence. Period of locomotion is shaded in blue.
Figure 7—figure supplement 1
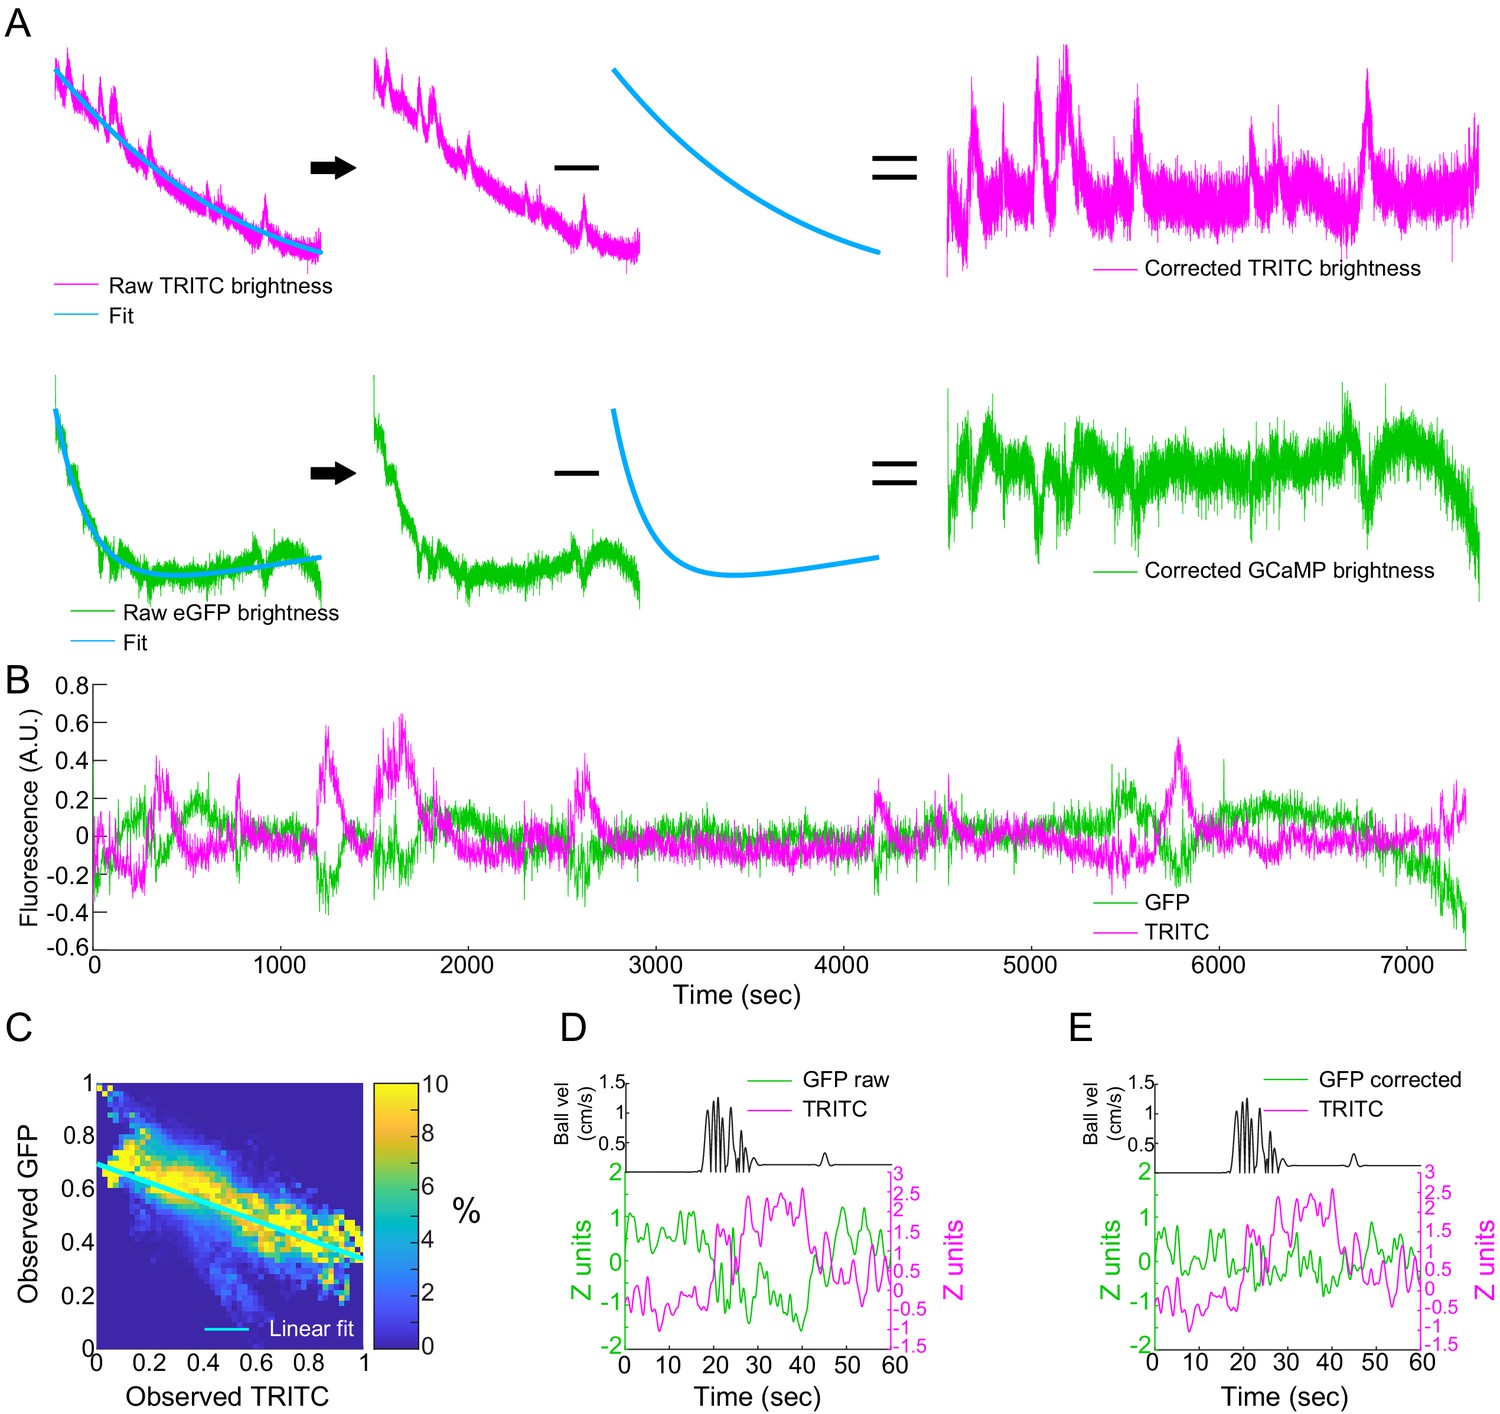
Locomotion-evoked Ca2+ signals in nNOS neurons, correction of photobleaching and hemodynamic attenuation of GCaMP signals.
(A) Representative example of raw GFP (green) and TRITC (magenta) fluorescence obtained using fiber photometry in B6.CAG-eGFP mice, which express GFP ubiquitously in their tissues. TRITC fluorescence will track blood volume. The decay of the signal is fit as a sum of two exponential functions and this fit is subtracted from raw signals. (B) A representative trace of blood volume (magenta) and GFP (green) changes after correction for slow signal intensity decay prior to correction of blood volume induced attenuation of GFP signal intensity. (C) Histogram showing the relationship between TRITC (x-axis) and GFP fluorescence (y-axis). Color shows % of events within a column in each bin. Linear fit of GFP-TRITC relationship (blue line) is used to scale CBV signal prior to subtraction from GFP/GCaMP6s signals in all animals. (D) Single locomotion event evoked changes in GFP (green) and blood volume (magenta) signal intensity prior to correction of GFP signal. (E) Single locomotion event evoked changes in GFP (green) and TRITC (magenta) signal intensity after correction of blood volume induced changes in eGFP fluorescence.
Figure 7—figure supplement 2
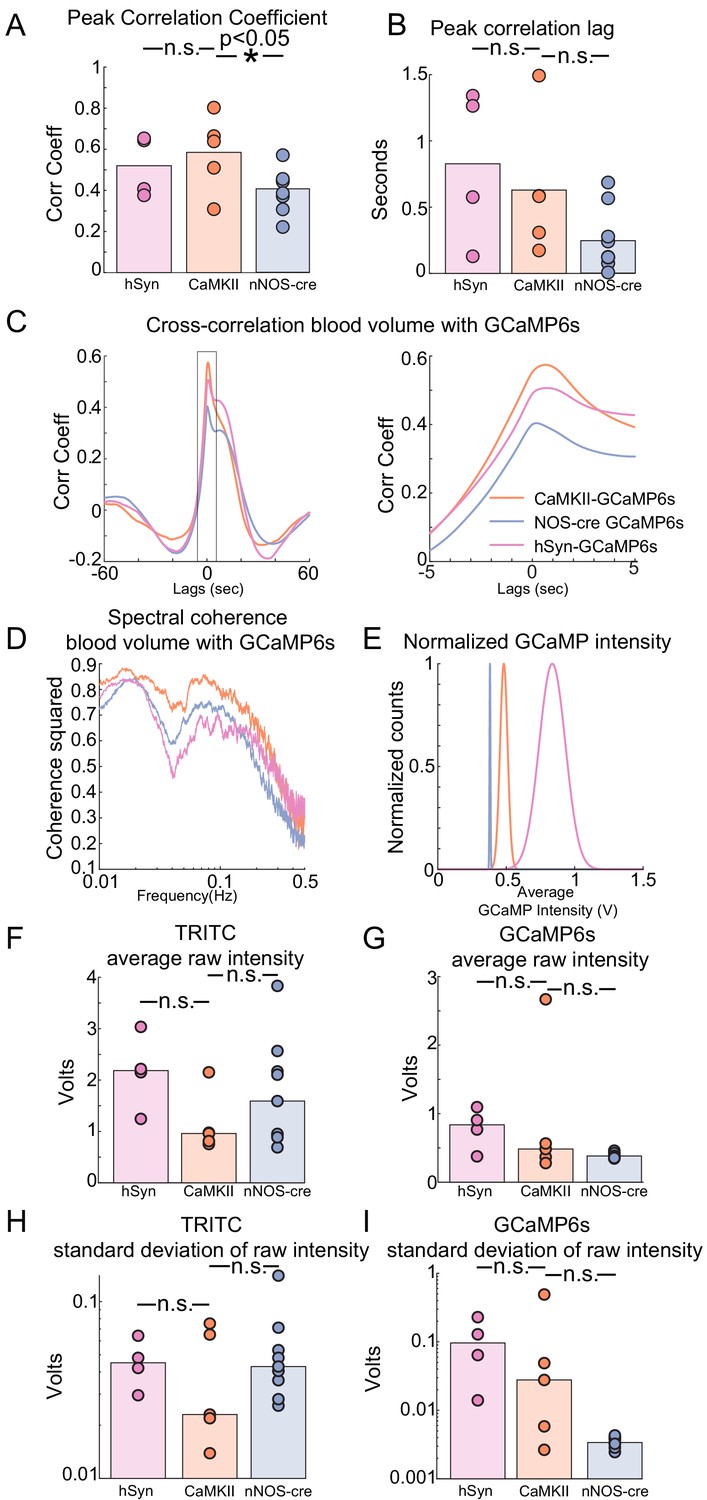
Cross-correlation, coherence, and signal-to-noise comparisons for fiber photometry signals.
(A) Population averaged peak correlation coefficient between blood volume and GCaMP6s fluorescence signals across all behaviors. Bars are population mean of each GCaMP6s sub-type; circles are individual animal averages. hSyn: 0.54 ± 0.14, LME difference from CaMKII: p<0.7, CaMKII: 0.60 ± 0.17, nNOS: 0.43 ± 0.11, LME difference from CaMKII: p<0.02. (B) Population average, lag time of peak correlation coefficient between blood volume and GCaMP6s fluorescence signals across all behaviors. Bars are population mean of each GCaMP6s sub-type; circles are individual animal averages. hSyn: 0.79 ± 0.57 s, LME difference from CaMKII: p<0.60 CaMKII: 0.60 ± 0.52 s, nNOS: 0.24 ± 0.23 s, LME difference from CaMKII: p<0.09. (C) Population average traces of time lagged cross correlation between blood volume and GCaMP of ±60 s and ±5 s windows. (D) Population average traces of cross spectral frequency coherence between blood volume and GCaMP6s fluorescence signals. (E) Population average traces of normalized gaussian distribution of GCaMP6s fluorescence signals based on sub-type. (F) Population median of, average raw blood volume intensity across all behaviors. Bars are population median of each GCaMP6s sub-type; circles are individual animal averages. hSyn: 2.16 ± 0.73, LME difference from CaMKII: p<0.07 CaMKII: 1.13 ± 0.58, nNOS: 1.75 ± 1.03, LME difference from CaMKII: p<0.18. (G) Population median of, average raw GCaMP6s intensity across all behaviors. Bars are population median of each GCaMP6s sub-type; circles are individual animal averages. hSyn: 0.79 ± 0.30, LME difference from CaMKII: p<0.81 CaMKII: 0.87 ± 1.01, nNOS: 0.39 ± 0.04, LME difference from CaMKII: p<0.1. (H) Population median of, standard deviation of raw blood volume intensity across all behaviors. Bars are population median of each GCaMP6s sub-type; circles are individual animal averages. hSyn: 0.05 ± 0.01 s, LME difference from CaMKII: p<0.56, CaMKII: 0.04 ± 0.00.03, nNOS: 0.05 ± 0.04 s, LME difference from CaMKII: p<0.33. (I) Population median of, standard deviation of raw GCaMP intensity across all behaviors. Bars are population median of each GCaMP6s sub-type; circles are individual animal averages. hSyn: 0.11 ± 0.09, LME difference from CaMKII: p<0.68 CaMKII: 0.16 ± 0.21, nNOS: 0.003 ± 6×10⁻⁴, LME difference from CaMKII: p<0.08.
Figure 7—figure supplement 3
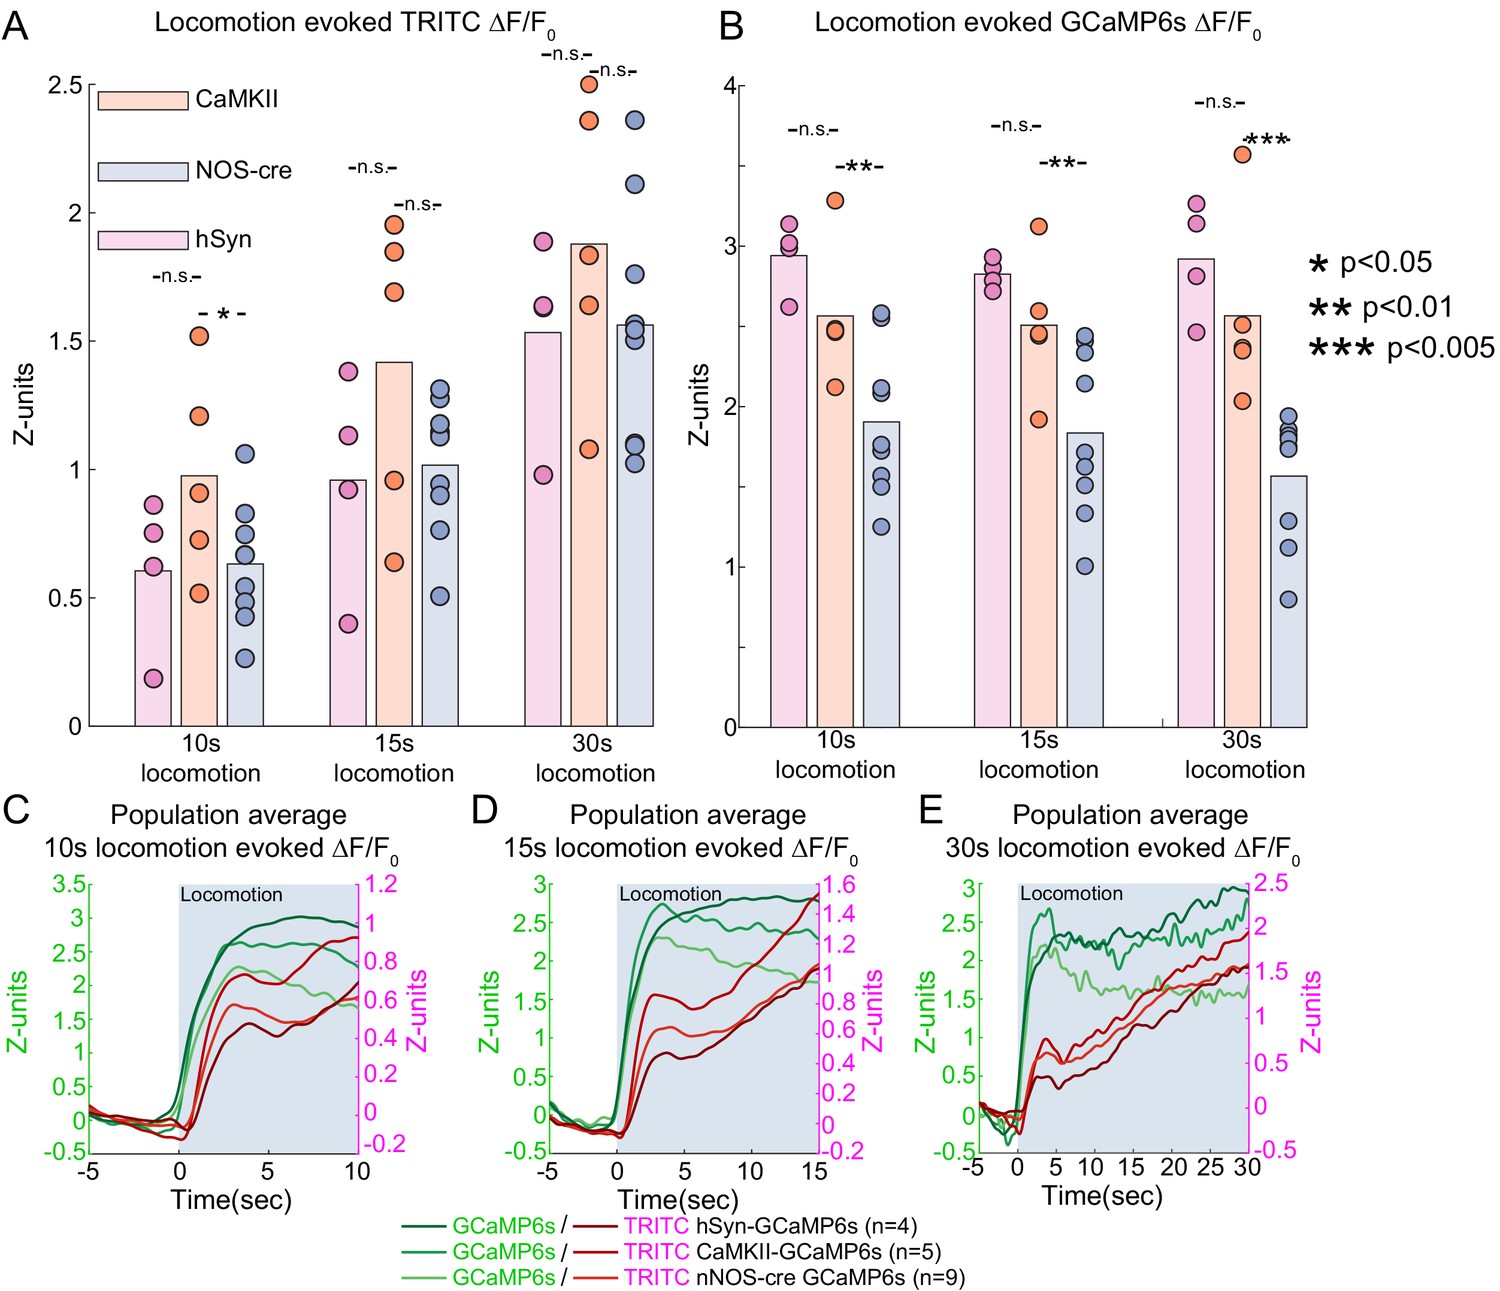
Sustained locomotion-evoked Ca2+ signals in nNOS neurons during long duration locomotion events.
(A) Population average locomotion-evoked blood volume change of events of increasing duration. Bars are population mean of each GCaMP6s sub-type; circles are individual animal averages. Population TRITC intensity change (z-units), hSyn- 10 s:0.61 ± 0.30, 15 s: 0.96 ± 0.42, 30 s: 1.53 ± 0.39; CaMKII- 10 s:0.98 ± 0.40, 15 s: 1.42 ± 0.58, 30 s: 1.88 ± 0.57; nNOS- 10 s:0.63 ± 0.24, 15 s: 1.02 ± 0.26, 30 s: 1.56 ± 0.46. (B) Population average locomotion-evoked GCaMP6s fluorescence change. Bars are population mean of each GCaMP6s sub-type; circles are individual animal averages. Population GCaMP intensity change (z-units), hSyn- 10 s:2.94 ± 0.22, 15 s: 2.83 ± 0.09, 30 s: 2.92 ± 0.36; CaMKII- 10 s:2.56 ± 0.43, 15 s: 2.50 ± 0.43, 30 s: 2.57 ± 0.59; nNOS- 10 s:1.90 ± 0.46, 15 s: 1.84 ± 0.52, 30 s: 1.57 ± 0.40. (C–E) Population average traces of locomotion-evoked blood volume (red) and GCaMP (green) fluorescence changes for 10, 15, and 30 s minimum periods of locomotion. Period of locomotion is shaded in blue.
Figure 8 with 3 supplements
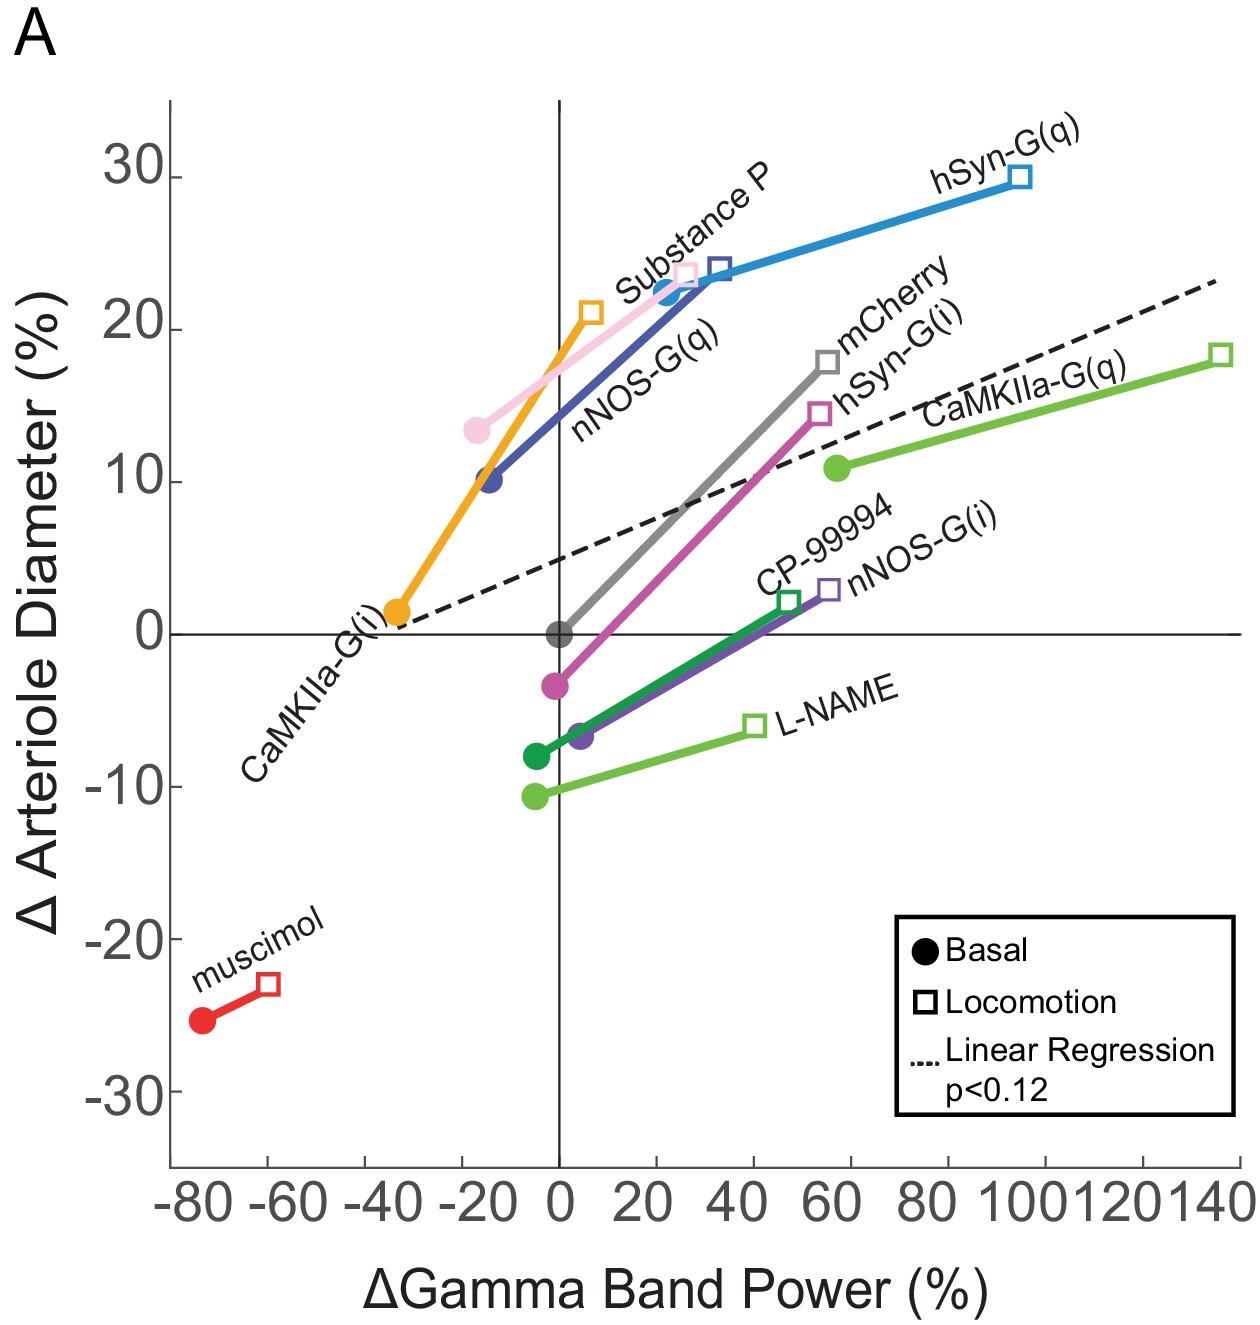
Relationship between neural activity and arterial diameter.
(A) Summary showing the gamma-band power vs. arteriole diameter, normalized to the relevant vehicle control for each condition. Lines connect mean basal and locomotion neural/arterial responses for each condition. Note the large differences in arterial diameter for similar levels of neural activity (e.g. nNOS-G(q) vs. nNOS-G(i)). A linear regression of all the points in the physiologically-relevant range (excluding muscimol), was not significant (p<0.12). For chemogenetic manipulations, neural activity and basal arterial dilation have been shifted so that the reporter virus expressing animals (mCherry) are centered at the origin.
Figure 8—figure supplement 1
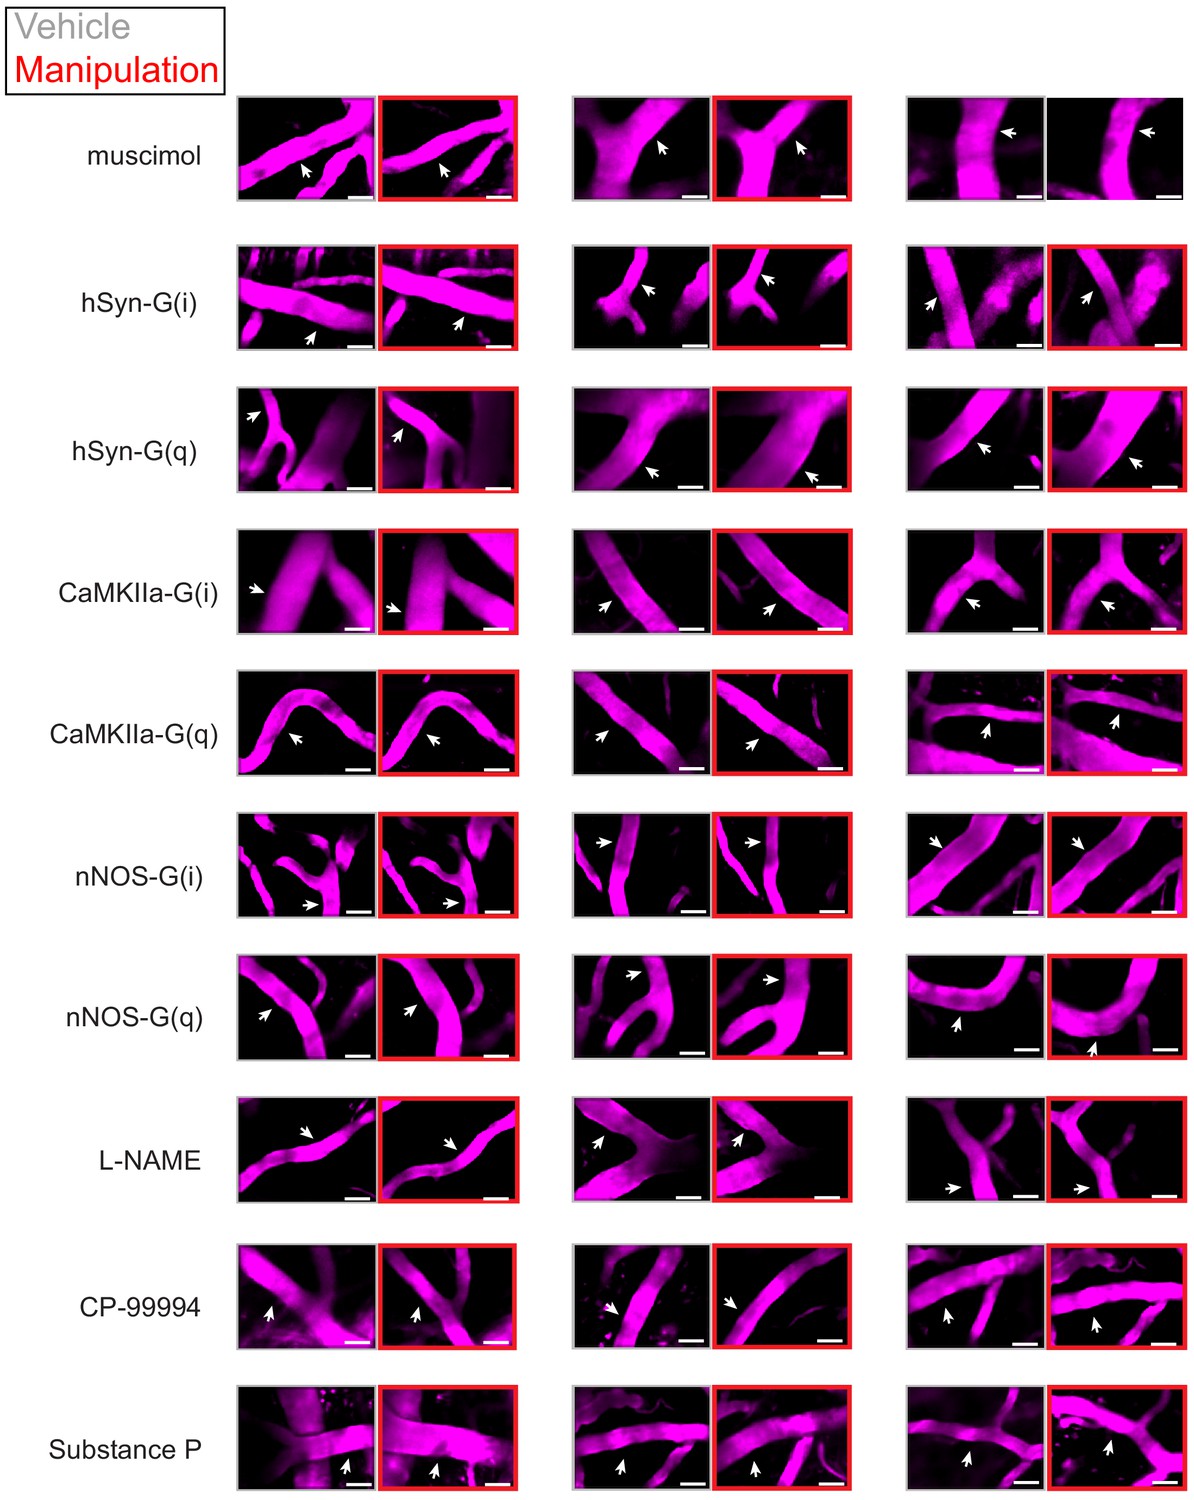
Examples of chemogenetic and pharmacological effects on arteriole diameters.
Examples of two-photon images of arterioles (scale bar 30 μm) after vehicle treatment (gray box) and after chemogenetic/pharmacological treatment (red box). The white arrow shows region where the diameter measurement was made.
Figure 8—figure supplement 2
Relationship between arterial diameter and LFP power at lower frequencies.
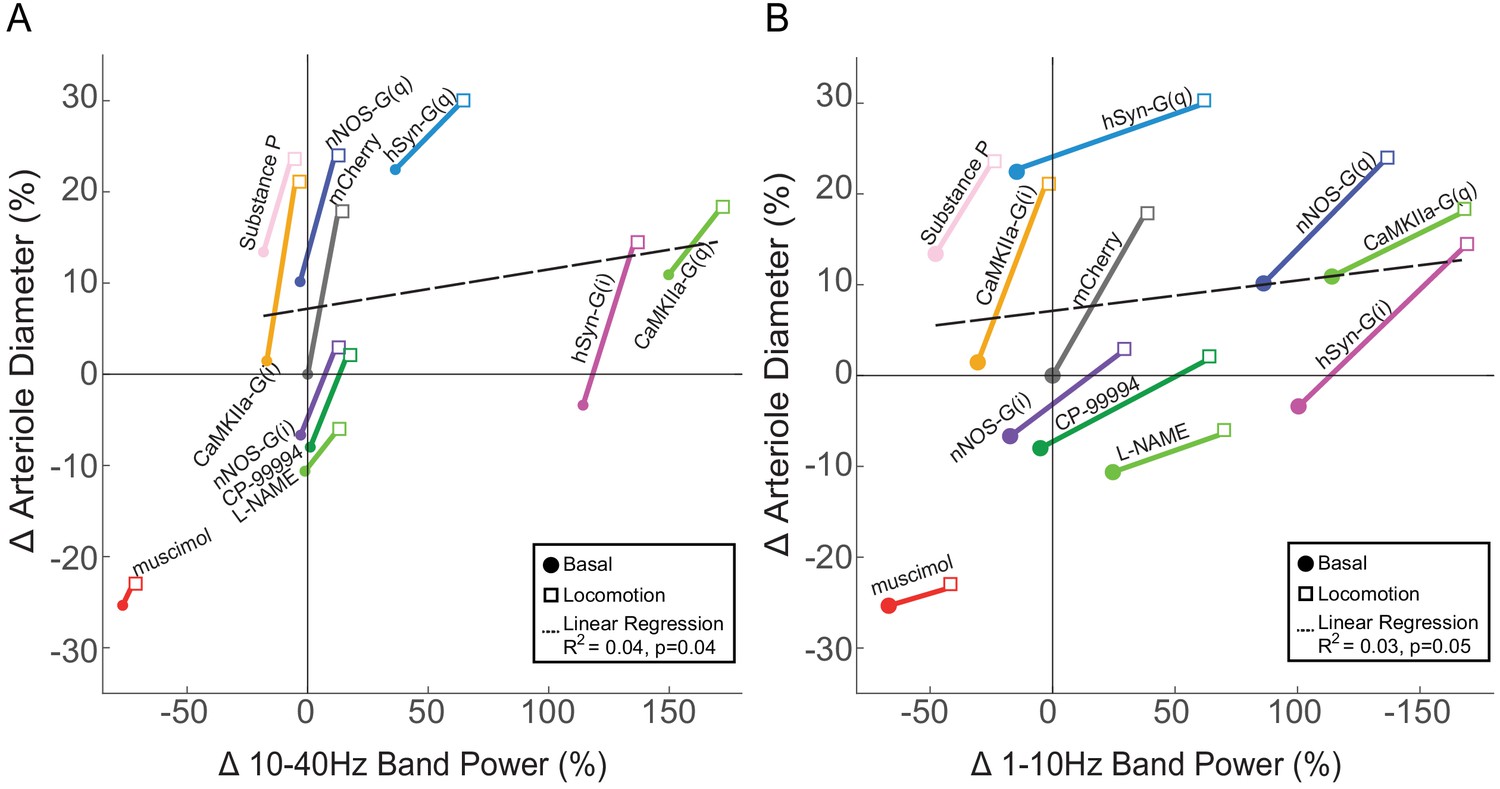
(A) Summary showing the change in 10–40 Hz band power vs. arteriole diameter, normalized to the relevant vehicle control for each condition. Lines connect basal and locomotion for each condition. A linear regression of all the points in the physiologically relevant range (excluding muscimol) (R2 = 0.04, p<0.04). For chemogenetic manipulations, neural activity and basal arterial dilation have been shifted so that the reporter virus expressing animals (mCherry) are centered at the origin. (B) Summary showing the change in 1–10 Hz band power vs. arteriole diameter, normalized to the relevant vehicle control for each condition. Lines connect basal and locomotion for each condition. A linear regression of all the points in the physiologically relevant range (excluding muscimol) (R2 = 0.03, p<0.05). For chemogenetic manipulations, neural activity and basal arterial dilation have been shifted so that the reporter virus expressing animals (mCherry) are centered at the origin.
Figure 8—figure supplement 3
The effects of chemogenetic and pharmacological infusions on evoked arterial diameter changes normalized to the baseline within condition.
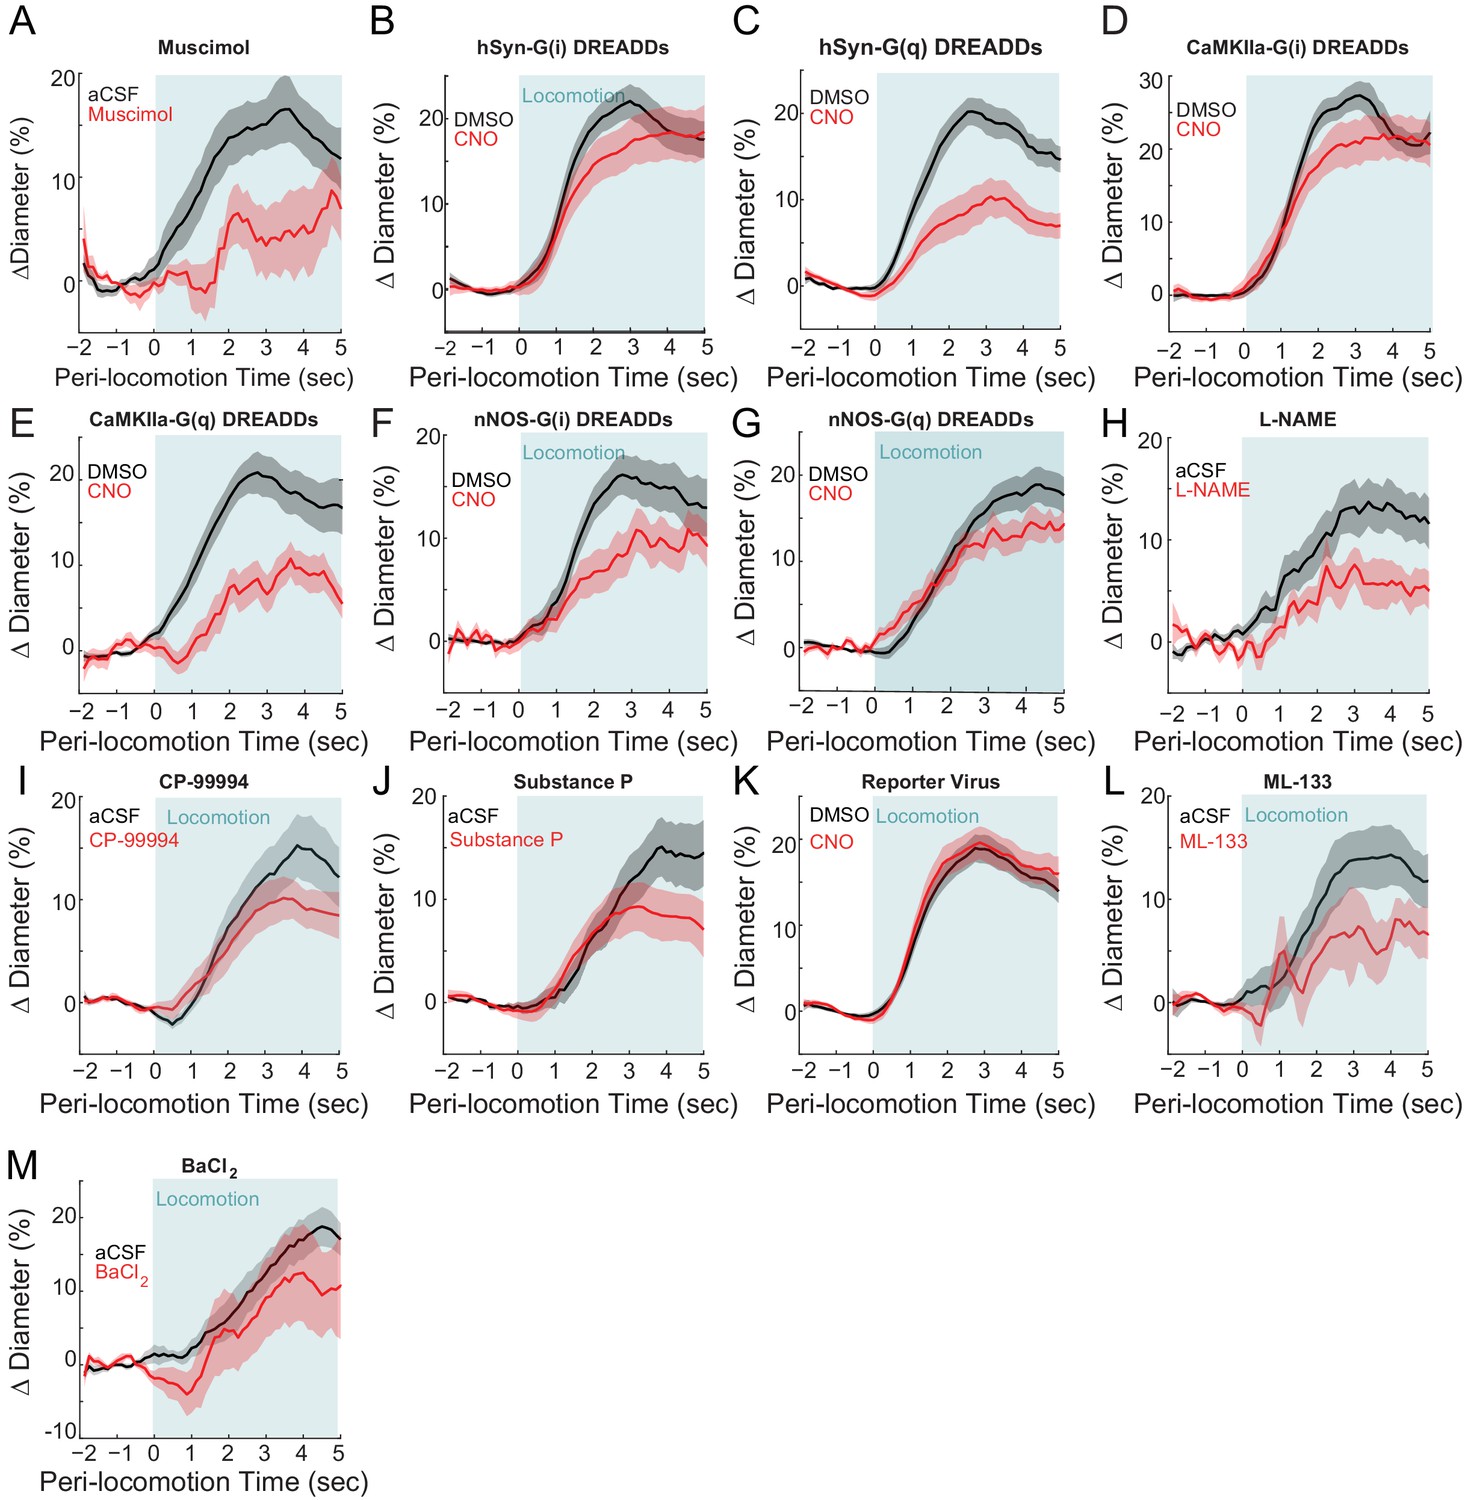
For the locomotion-triggered averages here, instead of being normalized to the arteriole baseline for the vehicle condition, the baseline dimeter during the manipulation (e.g. CNO or drug) was used. Baseline changes can mask changes in evoked amplitude when measure ratiometrically. (A) muscimol, vehicle 15.8 ± 2.7%, muscimol 4.4 ± 0.3%, LME p<0.04, n = 6 mice. (B) hSyn-G(i) DREADDs, vehicle 20.5 ± 2.0%, CNO 17.8 ± 2.8%, LME p<1, n = 7 mice. (C) hSyn-G(q) DREADDs, vehicle 18.6 ± 1.7%, CNO 9.7 ± 2.1%, LME p<7.1×10⁻³, n = 7 mice. (D) CaMKIIa-G(i) DREADDs, vehicle 25.3 ± 1.9%, CNO 21.4 ± 3.0%, LME p<1, n = 7 mice. (E) CaMKIIa-G(q) DREADDs, vehicle 19.1 ± 2.3%, CNO 9.0 ± 2.1%, LME p<0.06, n = 6 mice. (F) nNOS-G(i) DREADDs, vehicle 15.3 ± 2.0%, CNO 9.8 ± 2.1%, LME p<0.26, n = 9 mice. (G) nNOS-G(q) DREADDs, vehicle 17.4 ± 1.8%, CNO 13.1 ± 1.8%, LME p<0.94, n = 6 mice. (H) L-NAME, vehicle 13.1 ± 2.3%, L-NAME 6.1 ± 2.2%, LME p<0.5, n = 6 mice. (I) CP-99994, vehicle 13.7 ± 2.6%, CP-99994 9.8 ± 2.1%, LME p<1, n = 7 mice. (J) Substance P, vehicle 13.0 ± 2.2%, Substance P 8.7 ± 2.3%, LME p<1, n = 7 mice. (K) Reporter virus, vehicle 17.7 ± 1.5%, CNO 18.3 ± 1.9%, LME p<1, n = 12 mice. (L) ML-133, vehicle 14.0 ± 3.0%, ML-133 6.0 ± 3.3%, LME p<1, n = 5 mice. (M) BaCl2, vehicle 15.1 ± 2.7%, BaCl211.1 ± 5.5%, LME p<1, n = 5 mice.
Videos
Video 1
Locomotion produces a rapid dilation in pial arterioles.
This movie shows in vivo imaging of a surface arteriole diameter in the somatosensory cortex through the PoRTs window using two-photon microscopy. Left, behavioral camera. Right, FITC-filled arteriole diameter (region marked by white arrow) was plotted versus time in green.
Video 2
Locomotion produces a rapid dilation in pial arterioles.
This movie shows in vivo imaging of a surface arteriole diameter in the somatosensory cortex through the PoRTs window using two-photon microscopy. Left, behavioral camera. Right, FITC-filled arteriole diameter (region marked by white arrow) was plotted versus time in green.
Tables
Key resources table
| Reagent type (species) or resource | Designation | Source or reference | Identifiers | Additional information |
|---|---|---|---|---|
| Strain, strain background (Mus musculus) | C57BL/6J | Jackson Labs | #000664 | |
| Strain, strain background (Mus musculus) | B6.129-Nos1tm1(cre)Mgmj/J | Jackson Labs | #017526 | |
| Strain, strain background (Mus musculus) | FVB-Tg(Aldh1l1-cre/ERT2) 1Khakh/J | Jackson Labs | #023748 | |
| Strain, strain background (Mus musculus) | C57BL/6-Tg(CAG-EGFP) 131Osb/LeySopJ | Jackson Labs | #006567 | |
| Genetic reagent (Adeno-associated virus) | AAV5-CMV-Turbo RFP-WPRE-rBG | UNC vector core | ||
| Genetic reagent (Adeno-associated virus) | AAV8-hSYN-HA-hM3D (Gq)-mCherry | Addgene | #50474-AAV8 | |
| Genetic reagent (Adeno-associated virus) | AAV5-hSYN-HA-hM4D (Gi)- mCherry | UNC Vector Core | ||
| Genetic reagent (Adeno-associated virus) | AAV5-CaMKIIa-hM3D (Gq)- mCherry | Addgene | #50476-AAV5 | |
| Genetic reagent (Adeno-associated virus) | AAV5-CaMKIIa-hM4D (Gi)- mCherry | UNC Vector Core | ||
| Genetic reagent (Adeno-associated virus) | AAV8-DIO-hM3D (Gq)-mCherry | Addgene | #44361-AAV8 | |
| Genetic reagent (Adeno-associated virus) | AAV8-DIO-hM4D (Gi)-mCherry | Addgene | #44362-AAV8 | |
| Genetic reagent (Adeno-associated virus) | AAV9-CaMKII-GCaMP6s | Addgene | #107790-AAV9 | |
| Genetic reagent (Adeno-associated virus) | AAV8-syn-GCaMP-WPRE | Vigene | AAV8-syn-GCaMP-WPRE | |
| Genetic reagent (Adeno-associated virus) | AAV9-CaMKII-GCaMP6s | Addgene | #107790-AAV9 Viagene | |
| Antibody | Mouse monoclonal GAD-65 Antibody (A-3) | Santa Cruz Biotechnology | sc-377145 | (1:200) |
| Antibody | Mouse monoclonal CaMKII Antibody (G-1) | Santa Cruz Biotechnology | sc-5306 | (1:200) |
| Antibody | Rabbit polyclonal to GFAP | Abcam | ab7260 | (1:200) |
| Antibody | Alexa Fluor 488 Goat Anti-Mouse IgG H and L | Abcam | ab150113 | (1:500) |
| Antibody | Goat Anti-Rabbit IgG H and L | Abcam | ab6702 | (1:500) |
| Antibody | Goat polyclonal nNOS | Abcam | ab1376 | (1:200) |
| Chemical compound, drug | muscimol | Sigma-Aldrich | M1523 | 10 mM |
| Chemical compound, drug | L-NAME | Sigma-Aldrich | N5751 | 1 mM |
| Chemical compound, drug | Substance P | Tocris | 1156 | 1 mM |
| Chemical compound, drug | CP-99994 | Tocris | 3417 | 8 mM |
| Chemical compound, drug | ML-133 | Sigma-Aldrich | SML0190 | 10 µM |
| Chemical compound, drug | DMSO | Sigma-Aldrich | D8418 | 1% |
| Chemical compound, drug | BaCl2 | EMD Millipore | B1493816 | 100 µM |
| Chemical compound, drug | CNO | Sigma-Aldrich | C0832 | 2.5 mg/kg |
| Chemical compound, drug | FITC-dextran 70 kDa | Sigma-Aldrich | 46945 | 50 µL at 5% |
| Chemical compound, drug | TRITC dextran 70kD | Sigma-Aldrich | T1162 | 50 µL at 5% |
| Software, algorithm | Pial vessel dimeter measurements | https://github.com/DrewLab/ Surface-Vessel-FWHM-Diameter | ||
| Software, algorithm | Penetrating vessel dimeter measurements | https://github.com/DrewLab/ Thresholding_in_Radon_Space | ||
| Software, algorithm | Red blood cell velocity measurements | https://github.com/ DrewLab/MCS_Linescan | ||
| Software, algorithm | 2 P microscope control software | MCS, Sutter Instruments, Novato CA | ||
| Software, algorithm | MATLAB | Mathworks, Natick MA | ||
| Software, algorithm | Doric Neuroscience Studio | Doric Lenses, Quebec, Quebec Canada |
Table 1
AAV-injected mice.
| AAV-injected mice | # mice (vessels) for 2-photon imaging | # mice for chronic electrophysiology | Immunohistochemistry | Fiber photometry |
|---|---|---|---|---|
| C57BL/6J: AAV5-CMV-TurboRFP-WPRE-rBG (UNC Vector Core) | 12 mice (56 vessels) | Four mice | Three mice | |
| C57BL/6J: AAV8-hSYN-HA-hM3D(Gq)-mCherry (Addgene #50474-AAV8) | Seven mice (37 vessels) | Three mice | Three mice | |
| C57BL/6J: AAV5-hSYN-HA-hM4D(Gi)- mCherry (UNC Vector Core) | Seven mice (45 vessels) | Three mice | Two mice | |
| C57BL/6J: AAV5-CaMKIIa-hM3D(Gq)- mCherry (Addgene # 50476-AAV5) | Six mice (41 vessels) | Four mice | Two mice | |
| C57BL/6J: AAV5-CaMKIIa-hM4D(Gi)- mCherry (UNC Vector Core) | Seven mice (38 vessels) | Five mice | Two mice | |
| B6.129-Nos1tm1(cre)Mgmj/J: AAV8-DIO-hM3D(Gq)-mCherry in nNOS-cre mice (Addgene #44361-AAV8) | Eight mice (52 vessels) | Four mice | Two mice | |
| B6.129-Nos1tm1(cre)Mgmj/J: AAV8-DIO-hM4D(Gi)-mCherry in nNOS-cre mice (Addgene #44362-AAV8) | Nine mice (49 vessels) | Five mice | Two mice | |
| B6;FVB-Tg(Aldh1l1-cre/ERT2)1Khakh/J: AAV8-DIO-hM4D(Gi)-mCherry in astrocyte-cre mice (Addgene #44362-AAV8) | Five mice (24 vessels) | Three mice | Two mice | |
| B6;FVB-Tg(Aldh1l1-cre/ERT2)1Khakh/J: AAV8-DIO-hM4D(Gi)-mCherry in astrocyte -cre mice (Addgene #44362-AAV8) | Seven mice (31 vessels) | Four mice | Two mice | |
| C57BL/6J: AAV9-CaMKII-GCaMP6s (Addgene) | Five mice | |||
| C57BL/6J: AAV8-syn-GCaMP-WPRE (Vigene) | Four mice | |||
| B6.129-Nos1tm1(cre)Mgmj/J: AAV9-CaMKII-GCaMP6s (Addgene) | Nine mice | |||
| C57BL/6-Tg(CAG-EGFP)131Osb/LeySopJ (Jackson Labs) | Three mice |
Table 2
Infused mice.
| Infused mice | # mice (vessels) for two-photon imaging | # mice for chronic Electrophysiology |
|---|---|---|
| C57BL/6J: Muscimol (10 mM) | Nine mice (26 vessels) | Three mice |
| C57BL/6J: L-NAME (1 mM) | Six mice (36 vessels) | Five mice |
| C57BL/6J: Substance P (1 µM) | Seven mice (30 vessels) | Four mice |
| C57BL/6J: CP-99994 (8 mM) | Seven mice (28 vessels) | Four mice |
| C57BL/6J: ML-133 (10 µM) | Five mice (36 vessels) | Four mice |
| C57BL/6J: BaCl2 (100 µM) | Five mice (24 vessels) | Three mice |
Additional files
Download links
A two-part list of links to download the article, or parts of the article, in various formats.
Downloads (link to download the article as PDF)
Open citations (links to open the citations from this article in various online reference manager services)
Cite this article (links to download the citations from this article in formats compatible with various reference manager tools)
nNOS-expressing interneurons control basal and behaviorally evoked arterial dilation in somatosensory cortex of mice
eLife 9:e60533.
https://doi.org/10.7554/eLife.60533


