Frontal eye field and caudate neurons make different contributions to reward-biased perceptual decisions
- Department of Neuroscience and Neuroscience Graduate Group, University of Pennsylvania, United States
Figures
Figure 1
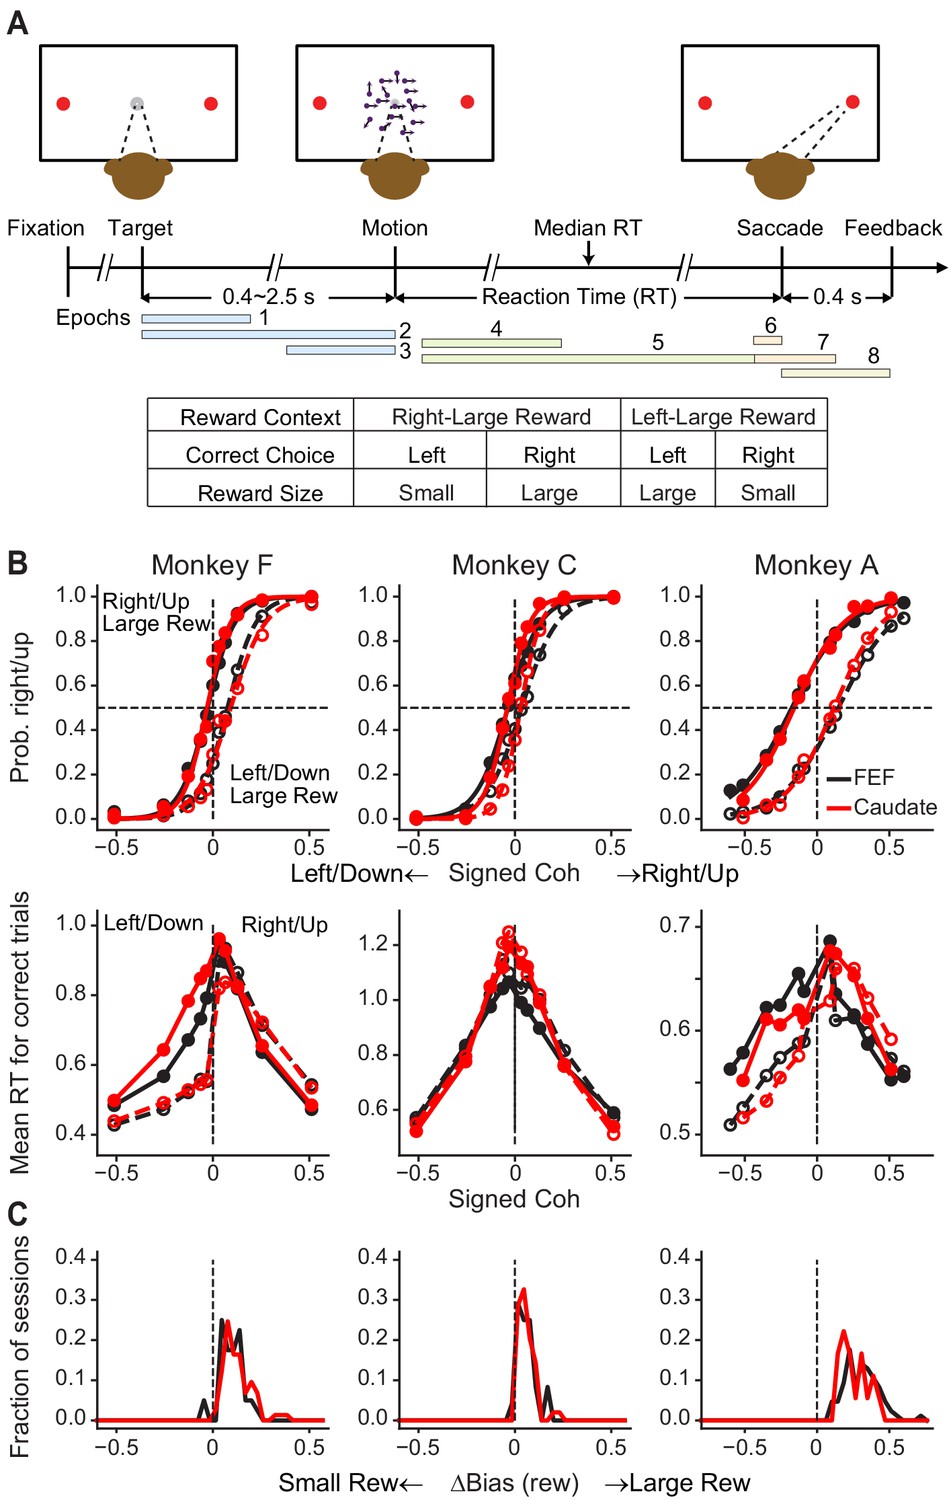
Monkeys biased toward choices associated with large reward.
(A) Task design and timeline. Monkeys reported the perceived motion direction with a saccade to one of the two choice targets. The motion stimulus was turned off upon detection of the saccade. Correct trials were rewarded based on the reward context. Error trials were not rewarded. The color bars in the timeline indicate epoch definitions for the regression analysis of neural firing rates in Equation 1. (B) Average choice (top) and RT (bottom) behavior of three monkeys for sessions with FEF and caudate recordings. The FEF dataset (black) included 16,561 trials from 33 sessions for monkey F, 7924 trials from 23 sessions for monkey C, and 24,419 trials from 69 sessions for monkey A. The caudate dataset (red) included 26,614 trials from 69 sessions for monkey F, 21,076 trials from 44 sessions for monkey C, and 6309 trials from 17 sessions for monkey A. Filled and open circles: data from the two reward contexts. Similar results were reported previously for sessions with caudate recordings (Doi et al., 2020). (C) Histograms of reward bias for all sessions, estimated using logistic fits to choice data. Note that the bias magnitude varied in magnitude across monkeys and sessions, depending on the large:small reward ratio, the motion-coherence levels used in a given session, and the monkeys’ inherent perceptual sensitivity (Fan et al., 2018).
Figure 2 with 1 supplement
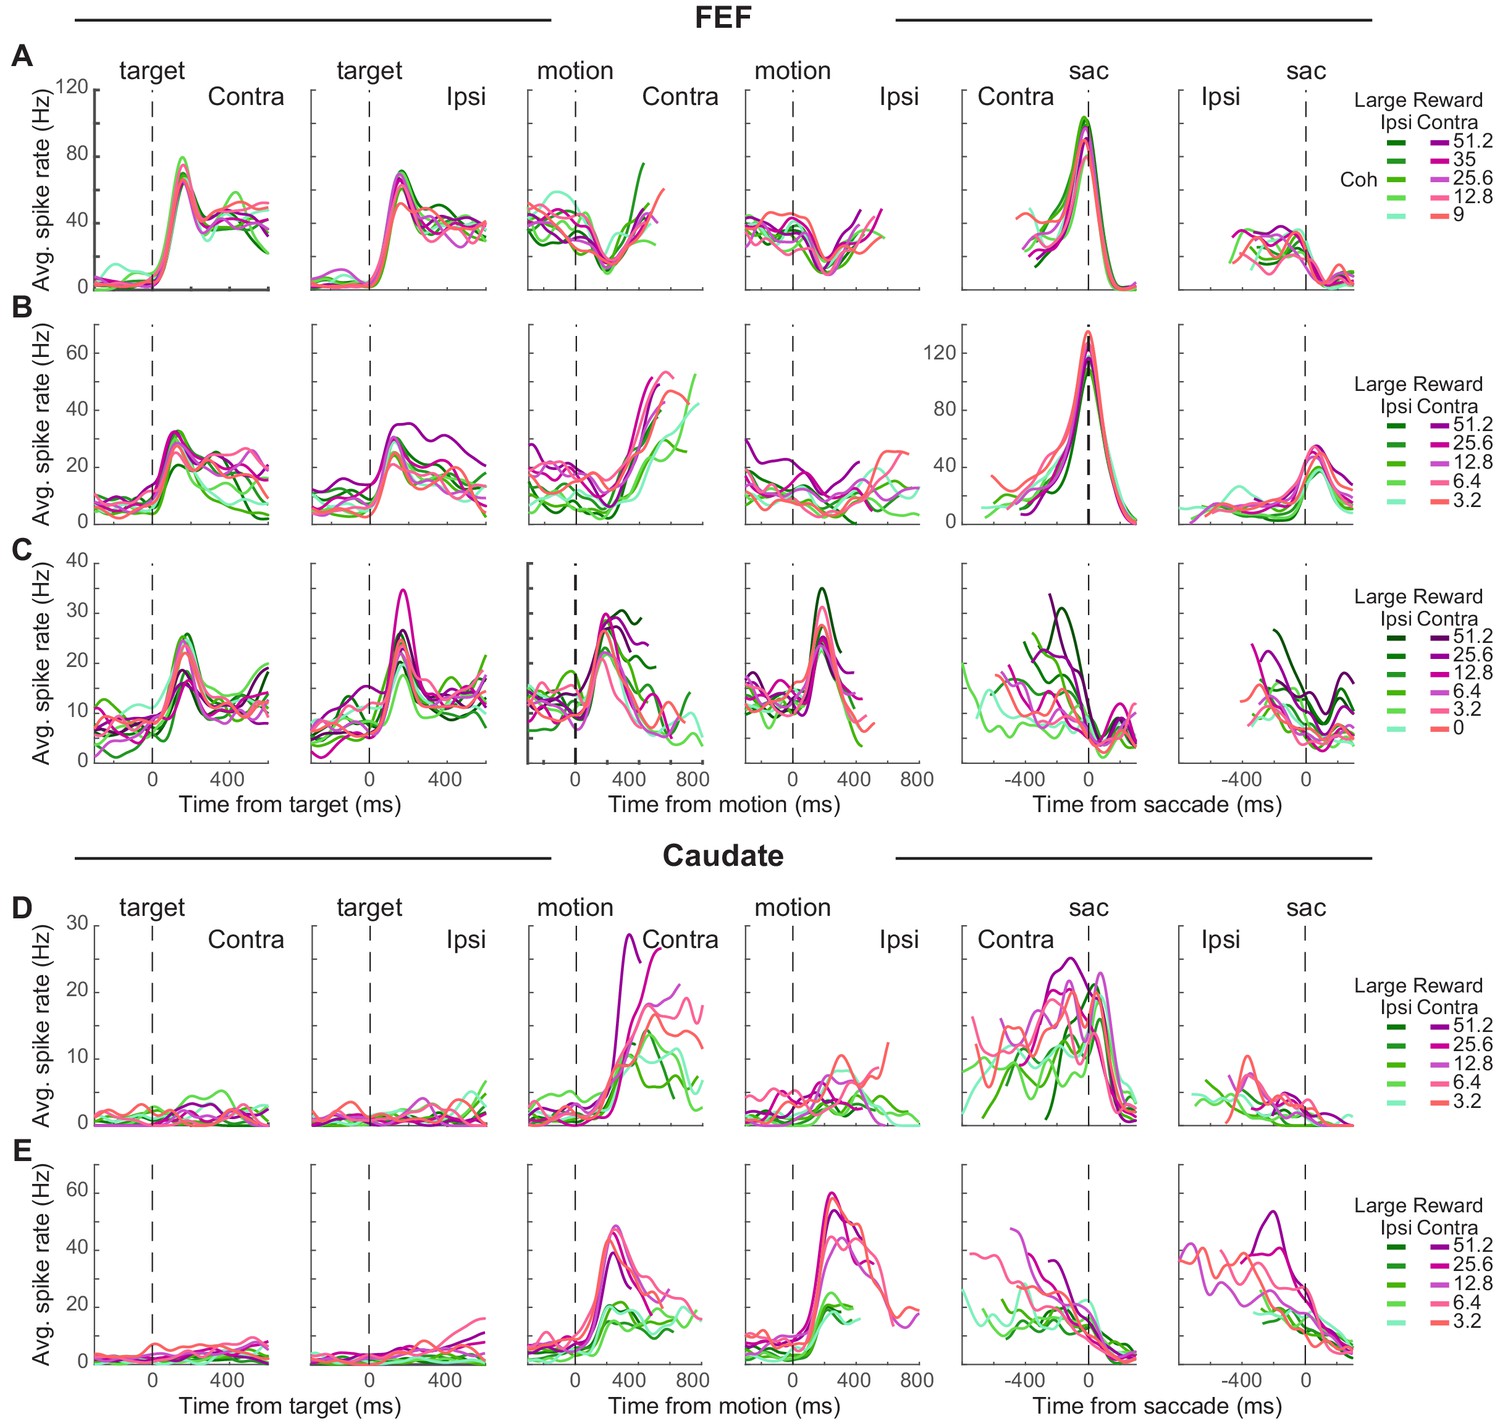
Task-related activity in FEF and caudate neurons.
(A-C) Activity of three example FEF neurons. For display purposes, average spike count was measured for correct trials only and convolved with a Gaussian kernel (sd = 40 ms). Green colors: large reward was paired with the ipsilateral choice. Red colors: large reward was paired with the contralateral choice. Shades: coherence levels. For alignment to motion onset, activity was truncated at 100 ms before the median reaction time. For alignment to saccade onset, activity was truncated at 200 ms after the median time for motion onset. (D-E) Activity of two example caudate neurons. Same format as A.
Figure 2—figure supplement 1
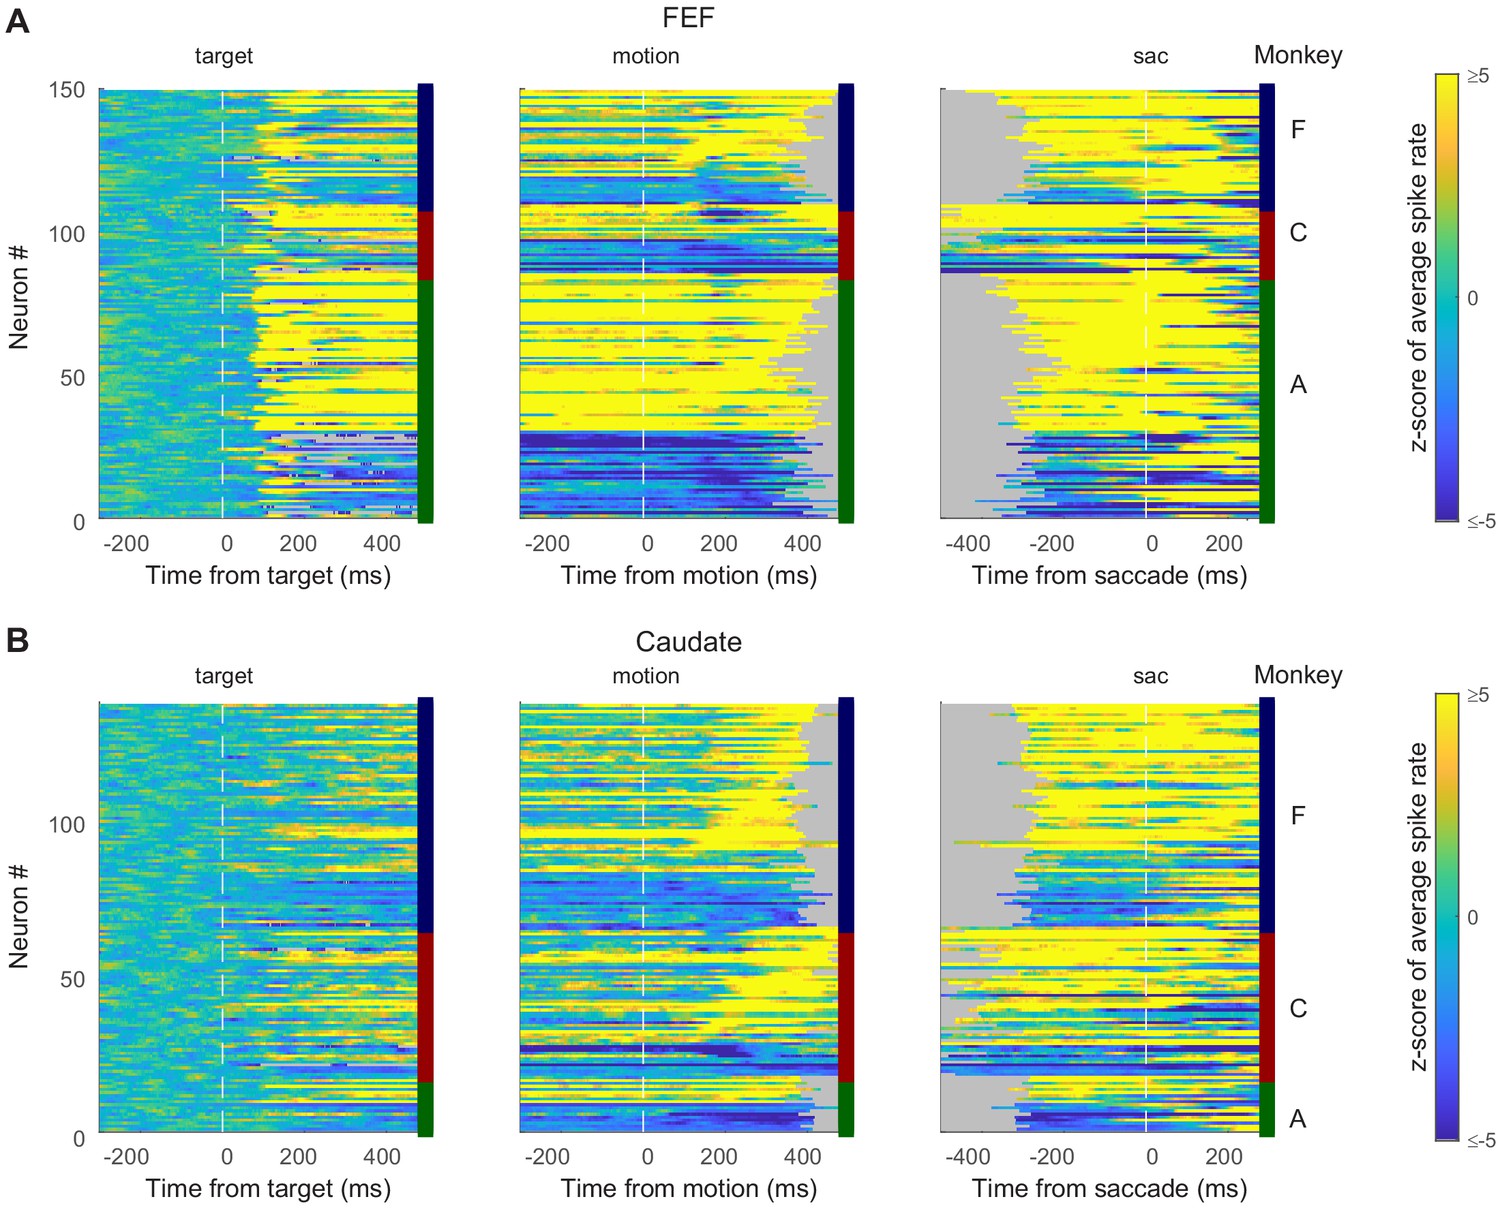
Summary of activity patterns.
(A) Summary of average activity for each time point during a trial for all FEF neurons (n = 149). Activity was averaged between the two choices and z-scored to baseline activity (average activity in a 300 ms window before target onset). Non-gray colors: z-score as in the color bar, bounded at ±5. Gray: truncated data as in Figure 2. The bars to the right of each panel indicate the monkey identities for the neurons. Neurons are sorted by the timing and sign of peak modulation in the middle column, separately for each monkey. (B) Summary for caudate neurons (n = 140). Same format as A.
Figure 3 with 7 supplements
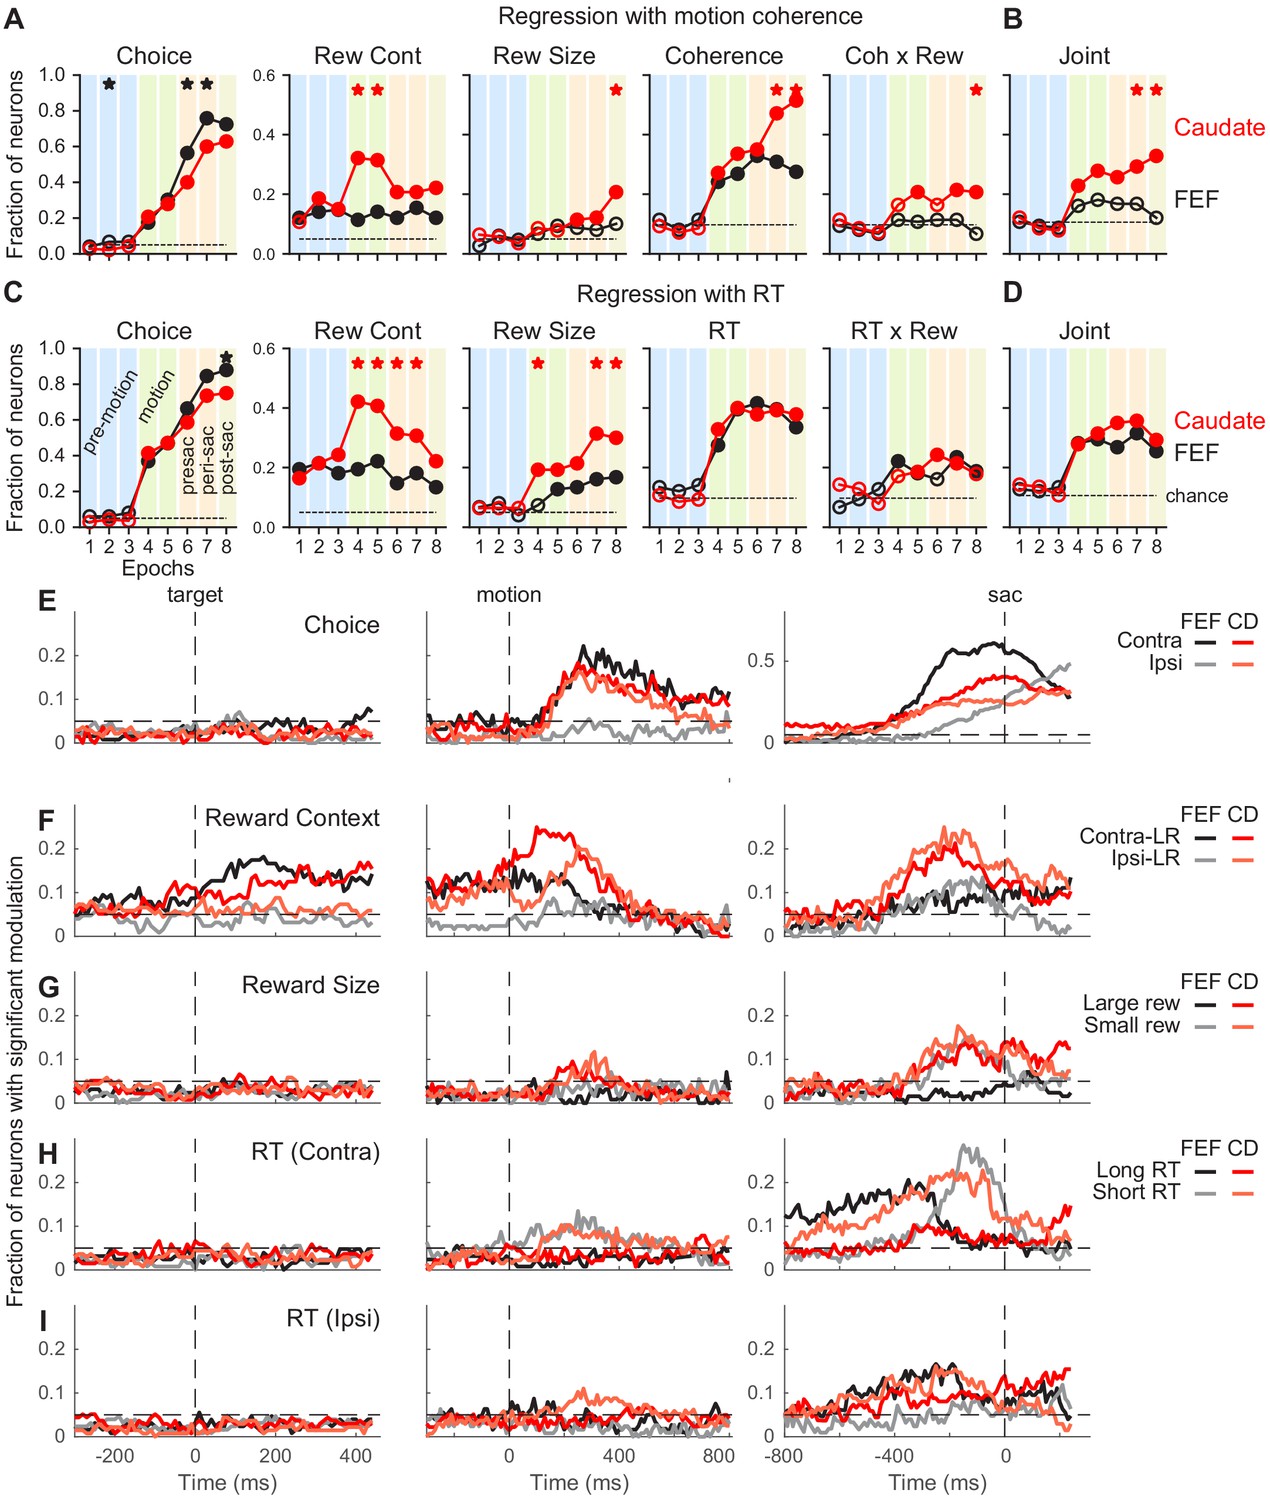
Comparison of task-related modulation of FEF and caudate activity.
(A) Fractions of FEF (black) and caudate (red) neurons showing significant regression coefficients in the multiple linear regression in Equation 2. Criterion: t-test, p<0.05. Dashed lines: chance level, adjusted for the number of comparisons. Filled circles: the fraction was significantly greater than chance level (Chi-square test, p<0.05/72 (8 epochs x nine comparisons)). ‘Coherence’ and ‘Coh x Rew’: neurons with significant coefficients for either choice. Vertical color bars indicate epochs defined in Figure 1A. Stars indicate epochs in which the fractions differed between FEF and caudate populations (Chi-square test, p<0.05/72). (B) Fraction of neurons with joint modulation by coherence and reward-related terms. Same format as A. (C, D) Fractions of neurons showing significant regression coefficients in the multiple linear regression in Equation 3. Same format as A and B. (E-I) Fractions of neurons showing significant non-zero regression coefficients for different regressors (Equation 3). Results from RT-reward interaction terms were omitted because both regions showed near chance-level fractions. Dashed horizontal lines: chance level. Only neurons tested with non-vertical motion stimuli were included (n = 126 and 136 for FEF and caudate, respectively).
-
Figure 3—source data 1
Source data for Figure 3A–D.
- https://cdn.elifesciences.org/articles/60535/elife-60535-fig3-data1-v1.csv
-
Figure 3—source data 2
Source data for Figure 3E–I: FEF activity aligned to target onset.
- https://cdn.elifesciences.org/articles/60535/elife-60535-fig3-data2-v1.csv
-
Figure 3—source data 3
Source data for Figure 3E–I: caudate activity aligned to target onset.
- https://cdn.elifesciences.org/articles/60535/elife-60535-fig3-data3-v1.csv
-
Figure 3—source data 4
Source data for Figure 3E–I: FEF activity aligned to motion onset.
- https://cdn.elifesciences.org/articles/60535/elife-60535-fig3-data4-v1.csv
-
Figure 3—source data 5
Source data for Figure 3E–I: caudate activity aligned to motion onset.
- https://cdn.elifesciences.org/articles/60535/elife-60535-fig3-data5-v1.csv
-
Figure 3—source data 6
Source data for Figure 3E–I: FEF activity aligned to saccade onset.
- https://cdn.elifesciences.org/articles/60535/elife-60535-fig3-data6-v1.csv
-
Figure 3—source data 7
Source data for Figure 3E–I: caudate activity aligned to saccade onset.
- https://cdn.elifesciences.org/articles/60535/elife-60535-fig3-data7-v1.csv
Figure 3—figure supplement 1
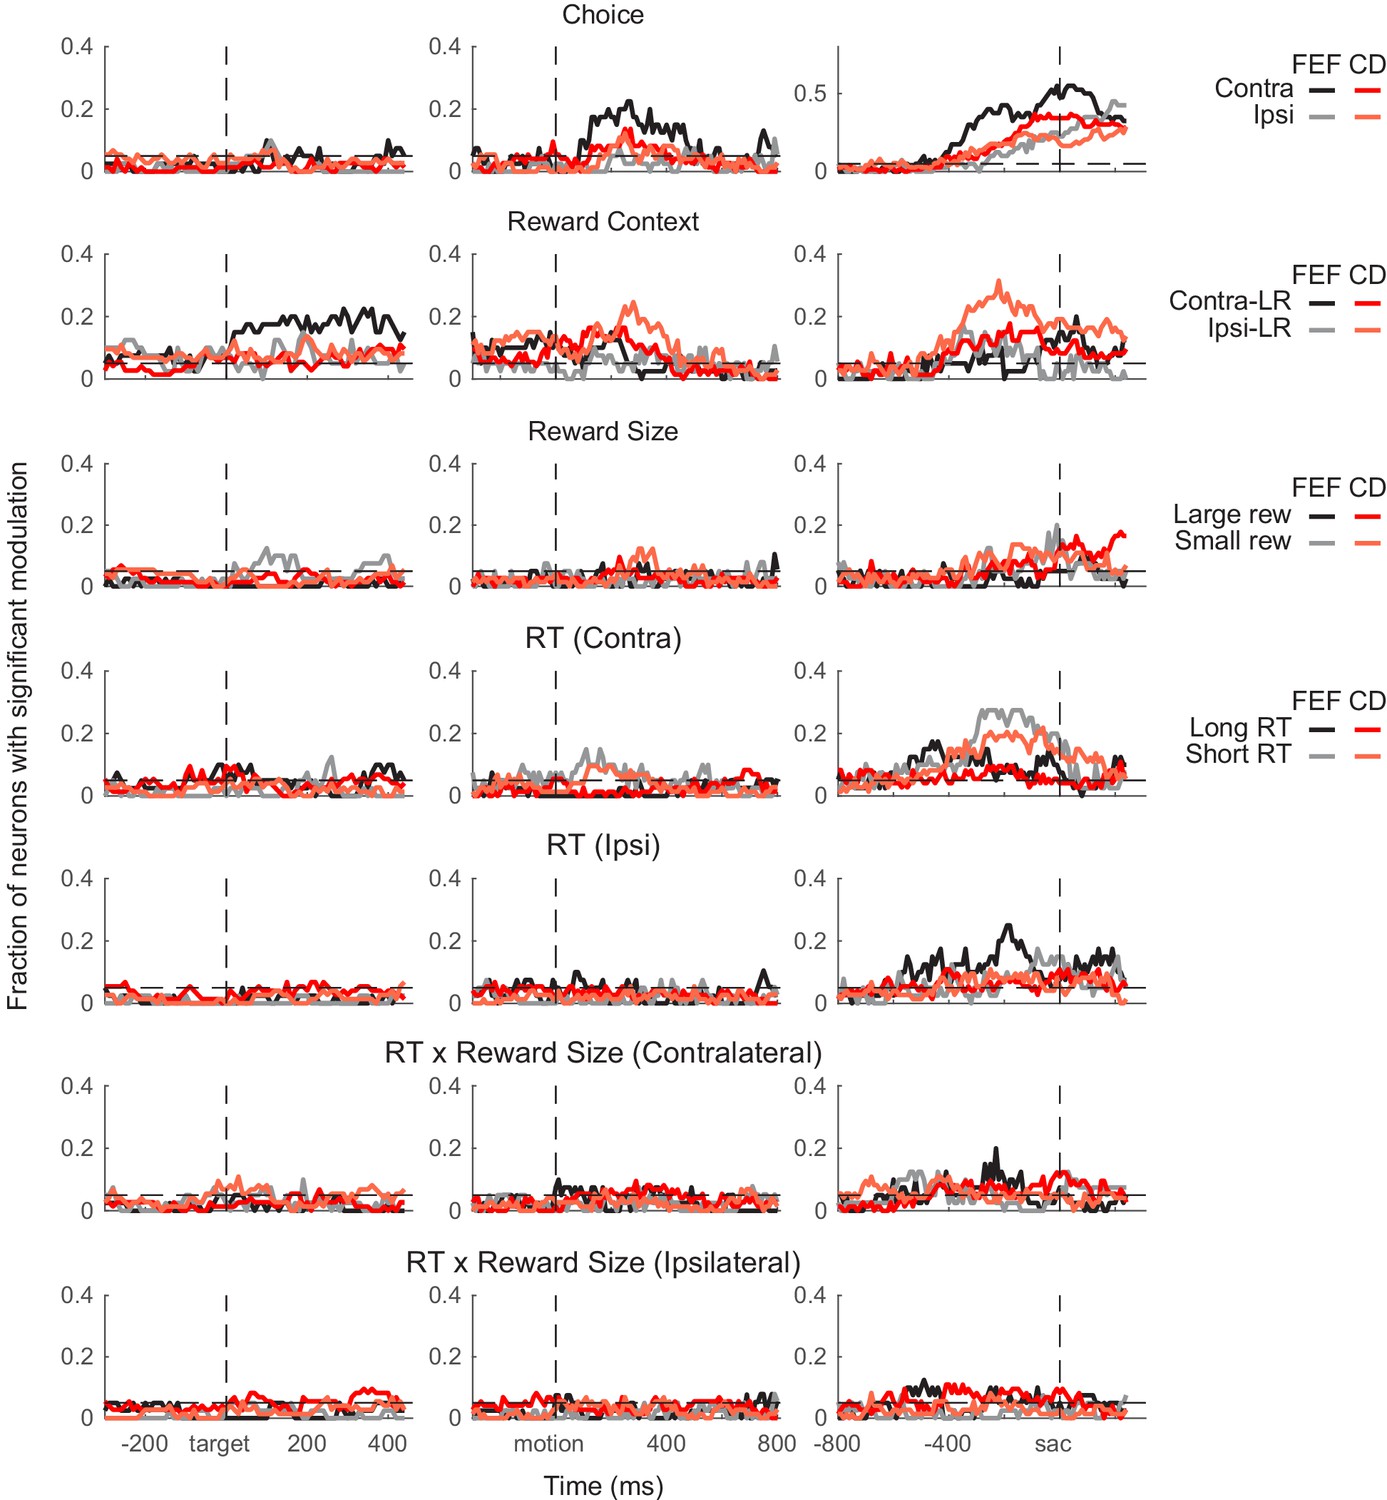
Comparison of the time course of task-related modulation of FEF and caudate activity in monkey F.
Fractions of neurons showing significant non-zero regression coefficients for different regressors (Equation 3). Same format as Figure 3E. N = 40 and 73 for FEF and caudate, respectively.
Figure 3—figure supplement 2
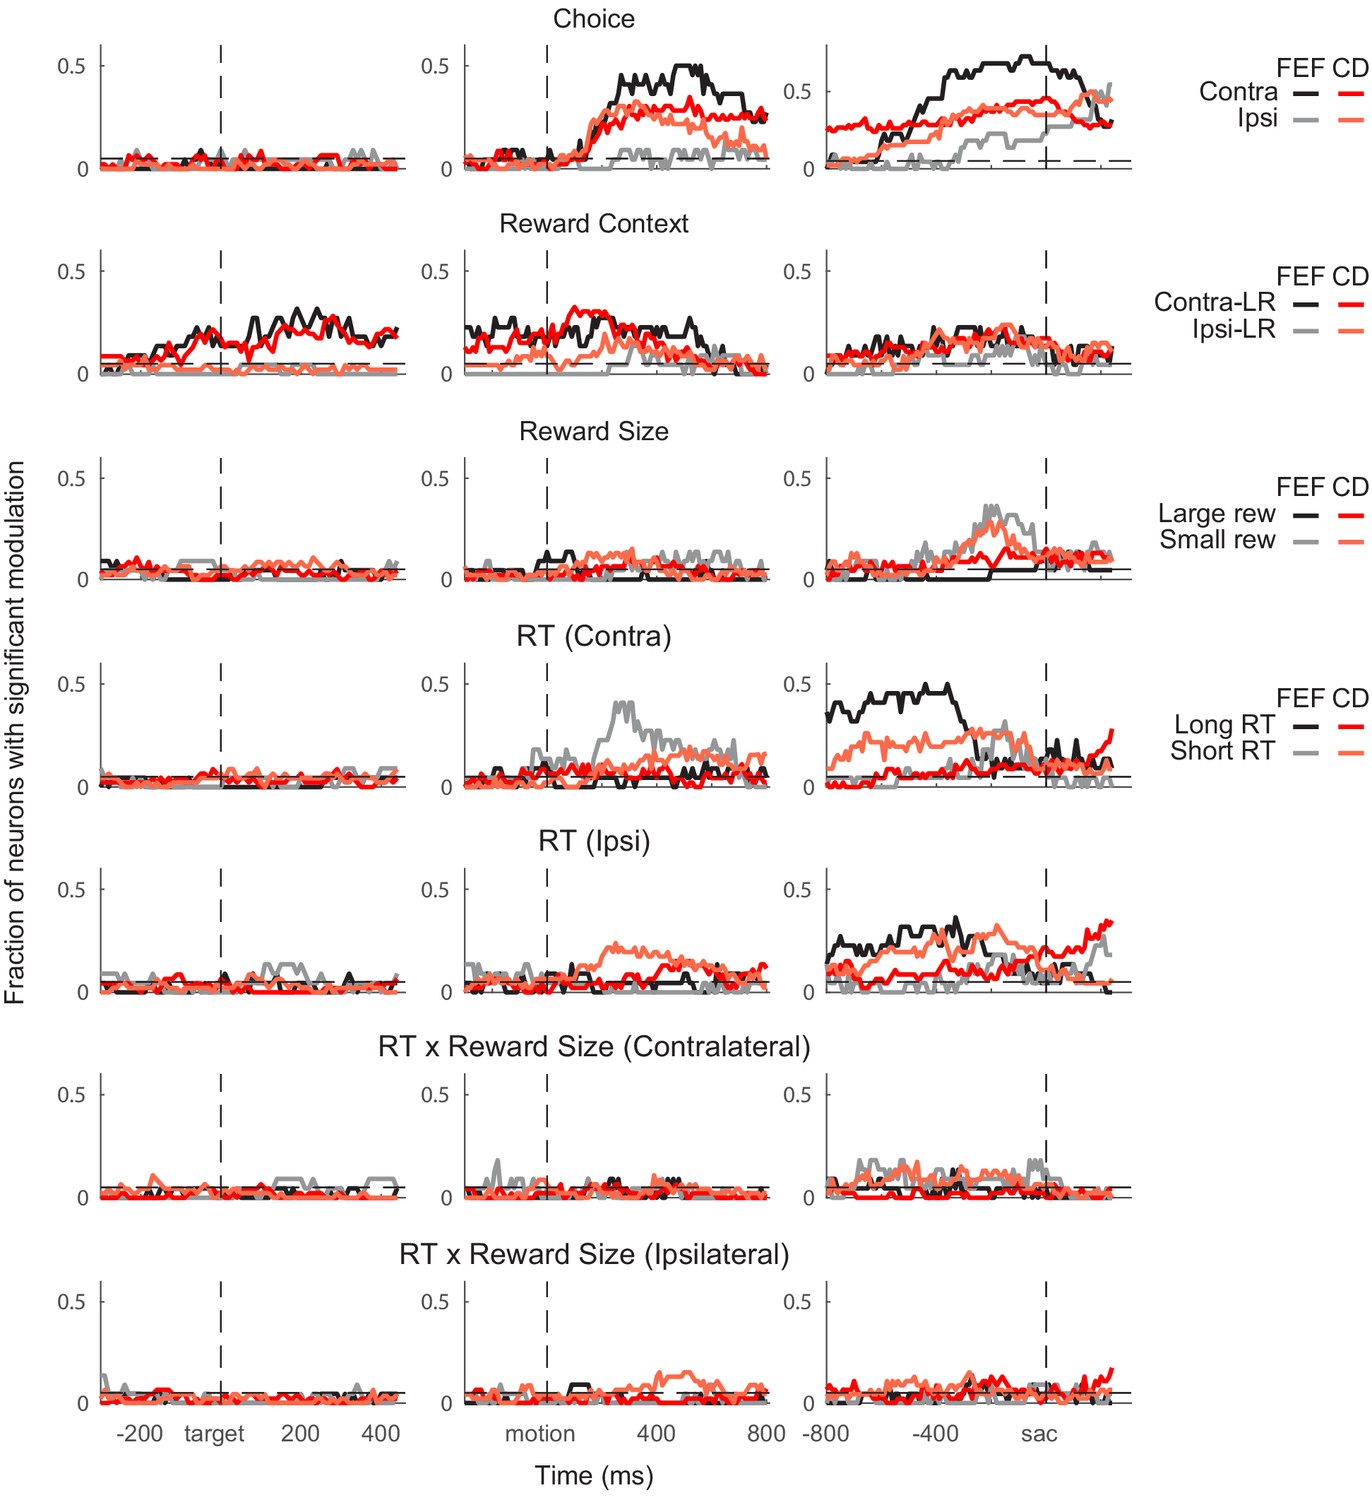
Comparison of the time course of task-related modulation of FEF and caudate activity in monkey C.
Fractions of neurons showing significant non-zero regression coefficients for different regressors (Equation 3). Same format as Figure 3E. N = 22 and 46 for FEF and caudate, respectively.
Figure 3—figure supplement 3
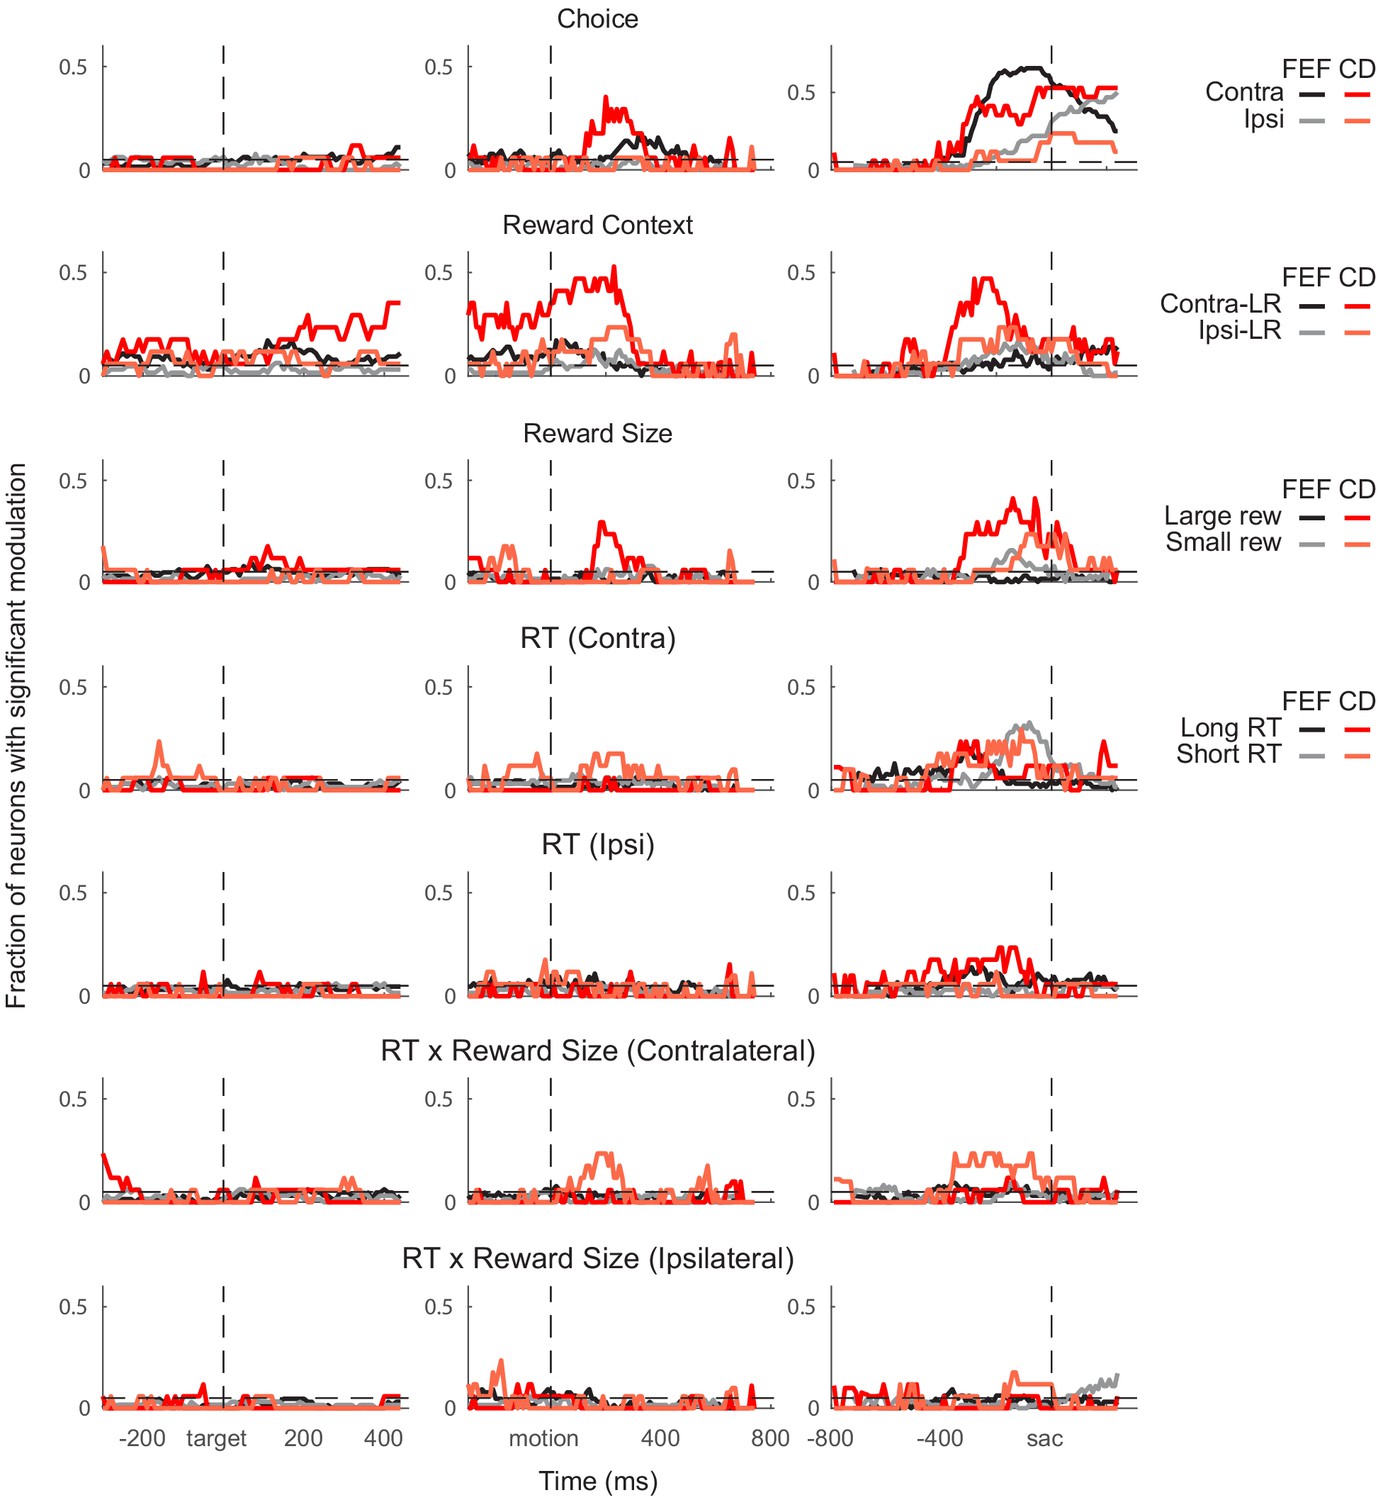
Comparison of the time course of task-related modulation of FEF and caudate activity in monkey A.
Fractions of neurons showing significant non-zero regression coefficients for different regressors (Equation 3). Same format as Figure 3E. N = 64 and 17 for FEF and caudate, respectively.
Figure 3—figure supplement 4

dPCA results for FEF activity aligned to motion onset.
(A) Cumulative variance explained by PCA (black) and dPCA (red) by the first 15 components. (B) Percentage of explained variance by different dPCA components, marginalized by task parameters. (C) Top 10 dPCA components with the highest explained variance (exlucding condition-independent components). In each subplot, the data were projected onto the respective dPCA decoder axis, with 16 lines corresponding to 16 conditions (see legend). The ordinal numbers of the components are shown in the colored circles. The percent explained variance for each component is shown at the left bottom corner.
Figure 3—figure supplement 5

dPCA results for FEF activity aligned to saccade onset.
Same format as Figure 3—figure supplement 4.
Figure 3—figure supplement 6
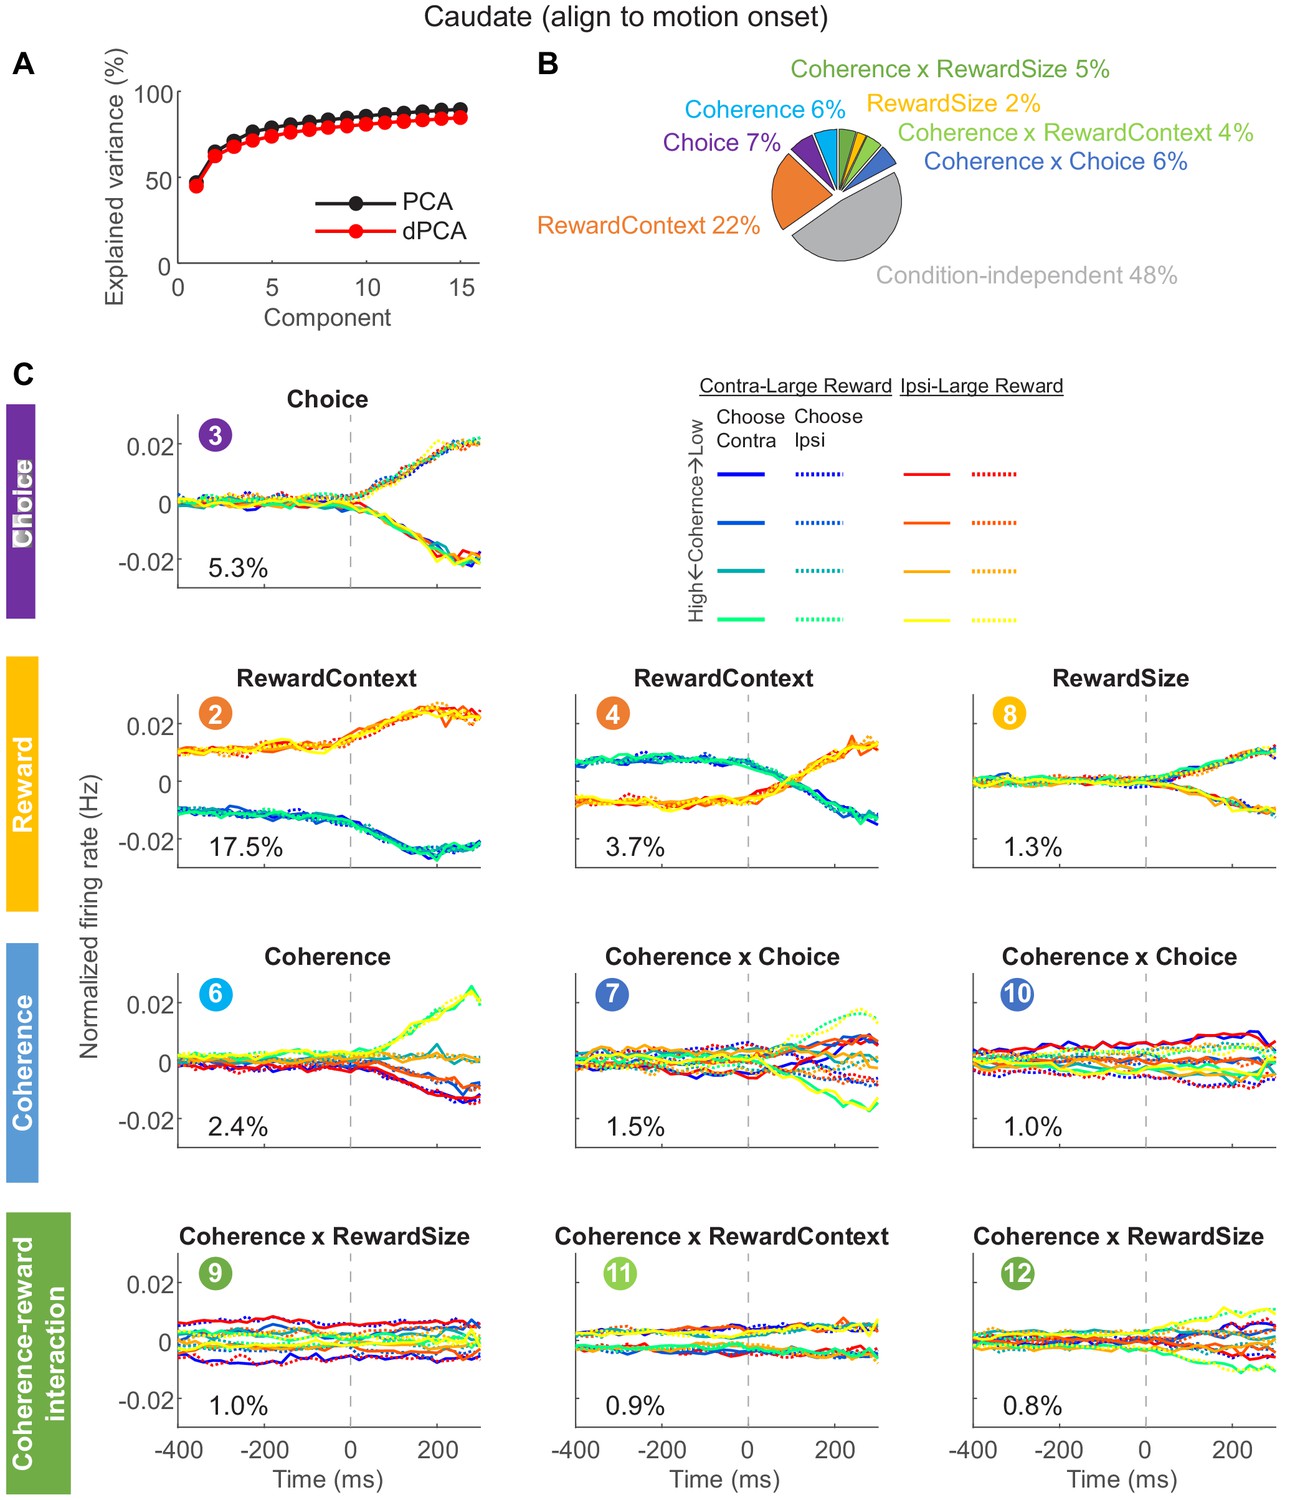
dPCA results for caudate activity aligned to motion onset.
Same format as Figure 3—figure supplement 4.
Figure 3—figure supplement 7
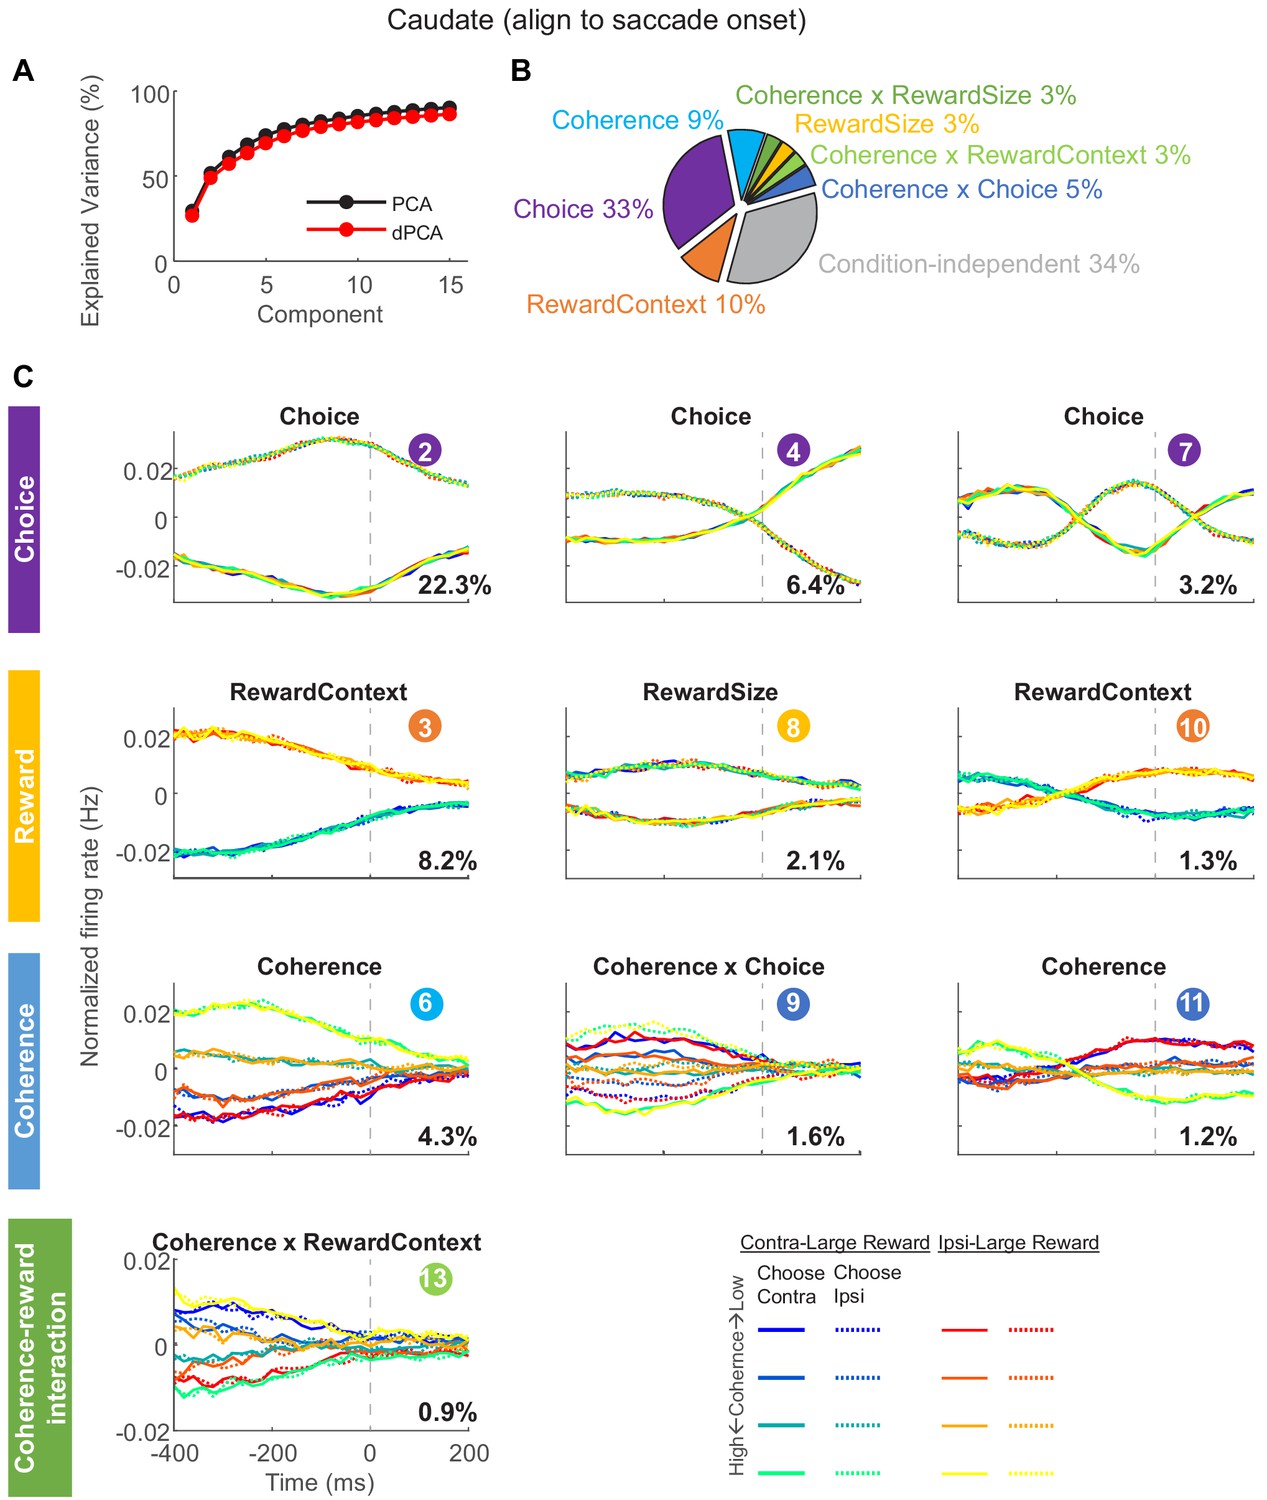
dPCA results for caudate activity aligned to saccade onset.
Same format as Figure 3—figure supplement 4.
Figure 4
DDM illustration and fitted reward bias terms.
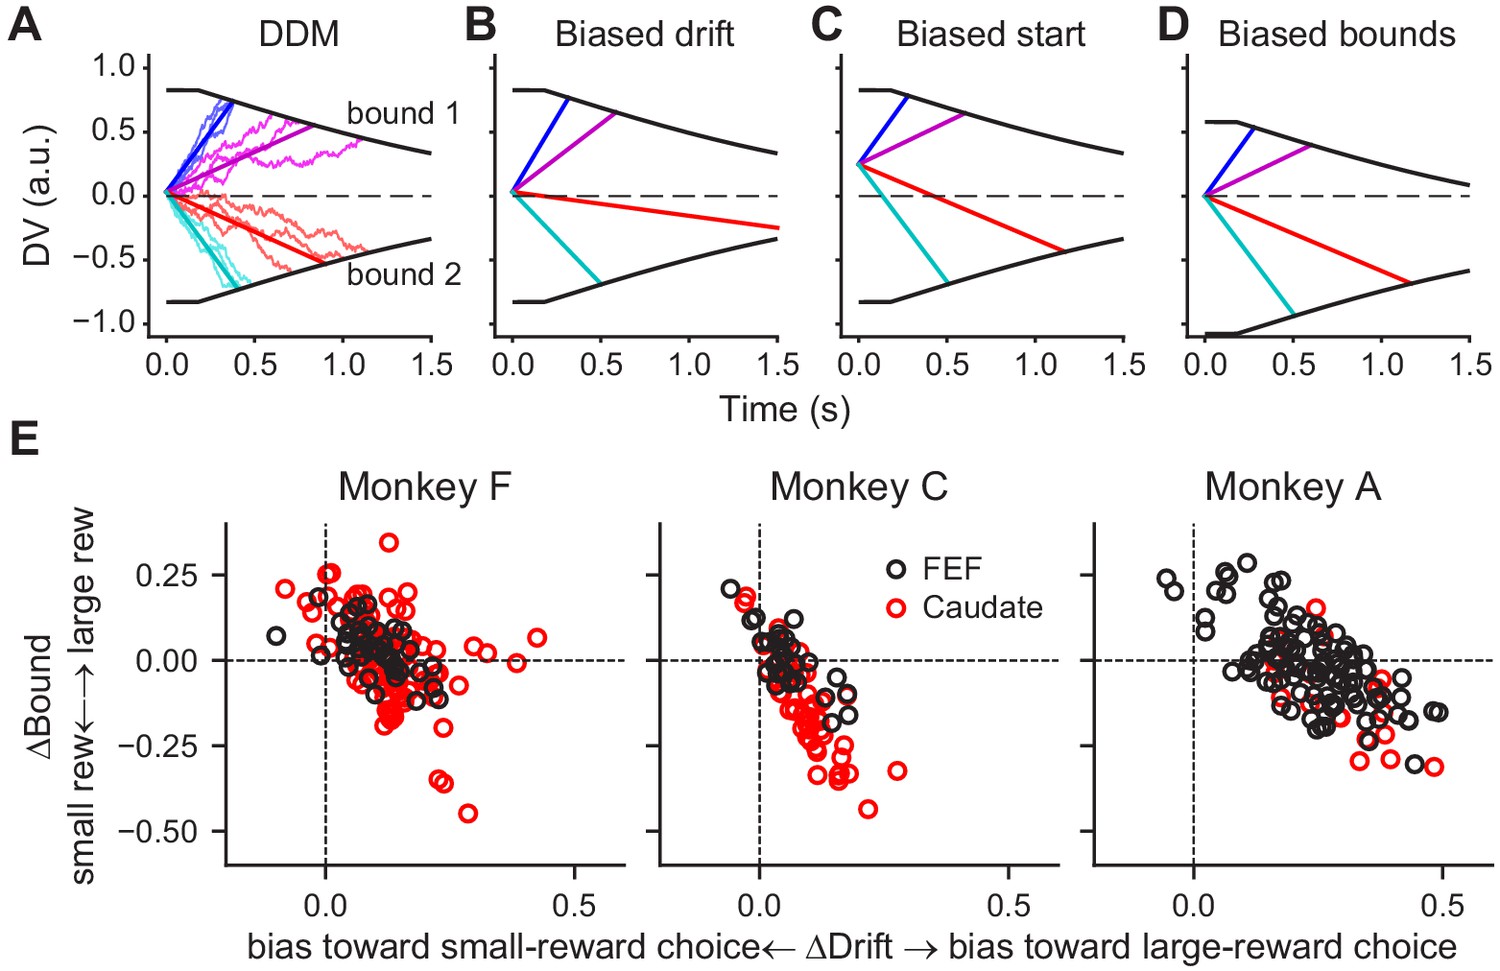
(A) Drift-diffusion model (DDM). Evidence is accumulated over time into a decision variable (DV). A decision is made when DV crosses either collapsing bound. Thin noisy lines represent simulated DVs for two coherence levels and two motion directions (three trials for each combination). The straight lines represent the average DVs. (B-D) Illustration of different implementations of a bias favoring the upper-bound choice. (B) Drift rates are biased by adding a constant positive value to the evidence, resulting in steeper slopes for motion to the upper-bound choice and shallower slopes for motion to the lower-bound choice. (C) The accumulation begins with a positive starting value. (D) The accumulation ends at a lower absolute value for upper-bound choices than for lower-bound choices. (E) Summary of reward biases in drift and bound terms from DDM fits for the three monkeys. Positive values indicate biases toward the large-reward choice. Black and red data points represent sessions with FEF and caudate recordings, respectively.
Figure 5
Average activity for neuron categories.
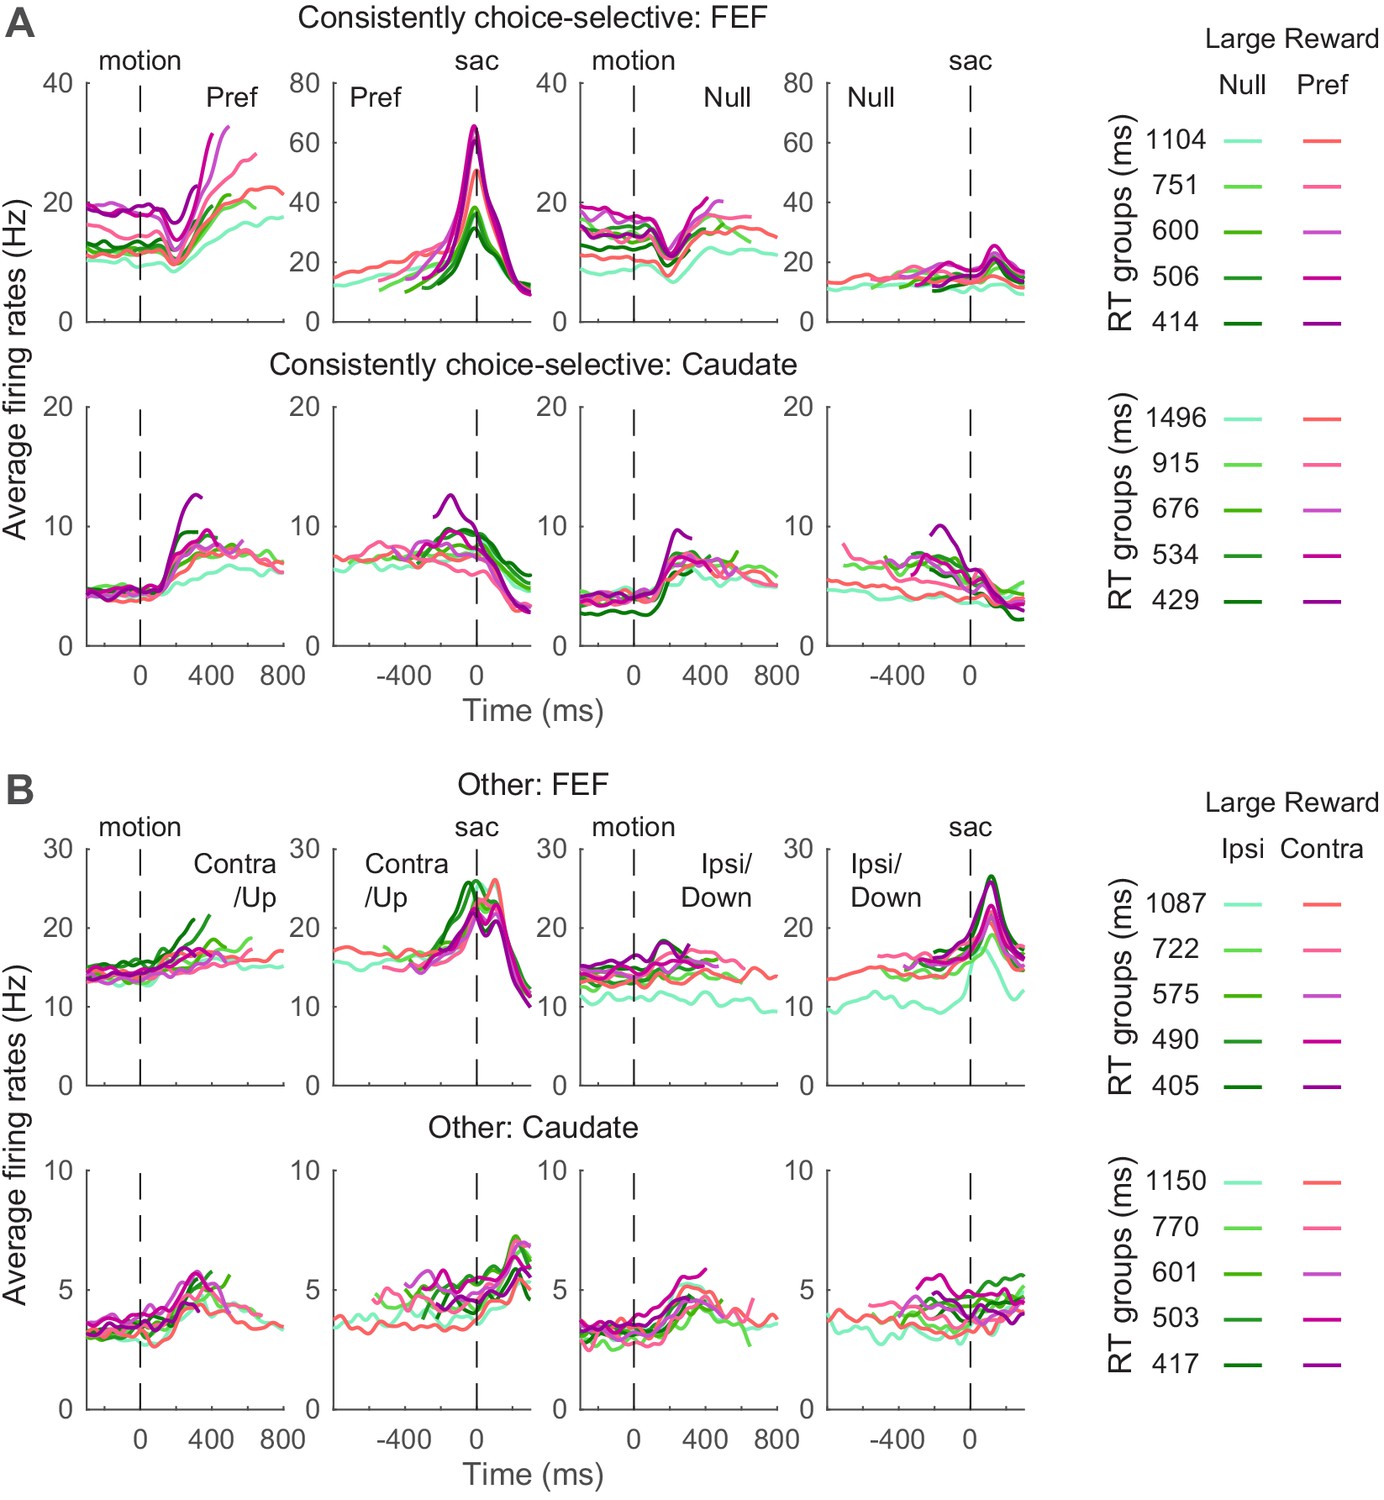
(A) Average firing rates of neurons with significant and consistent choice selectivity. See Table 1 for number of neurons in each category. Trials were grouped by choice (left and right rows), reward context (magenta/green), and RT quintiles (shade). Activity was aligned to motion and saccade onsets for the top and bottom rows, respectively. Only correct trials were included. For motion onset alignment, firing rates were truncated at the median RT minus 100 ms for each group. For saccade onset alignment, firing rates were truncated before median motion onset plus 200 ms for each group. For display purposes, firing rates were convolved with a Gaussian kernel (sigma = 25 ms). (B) Average firing rates of other neurons. Same format as A.
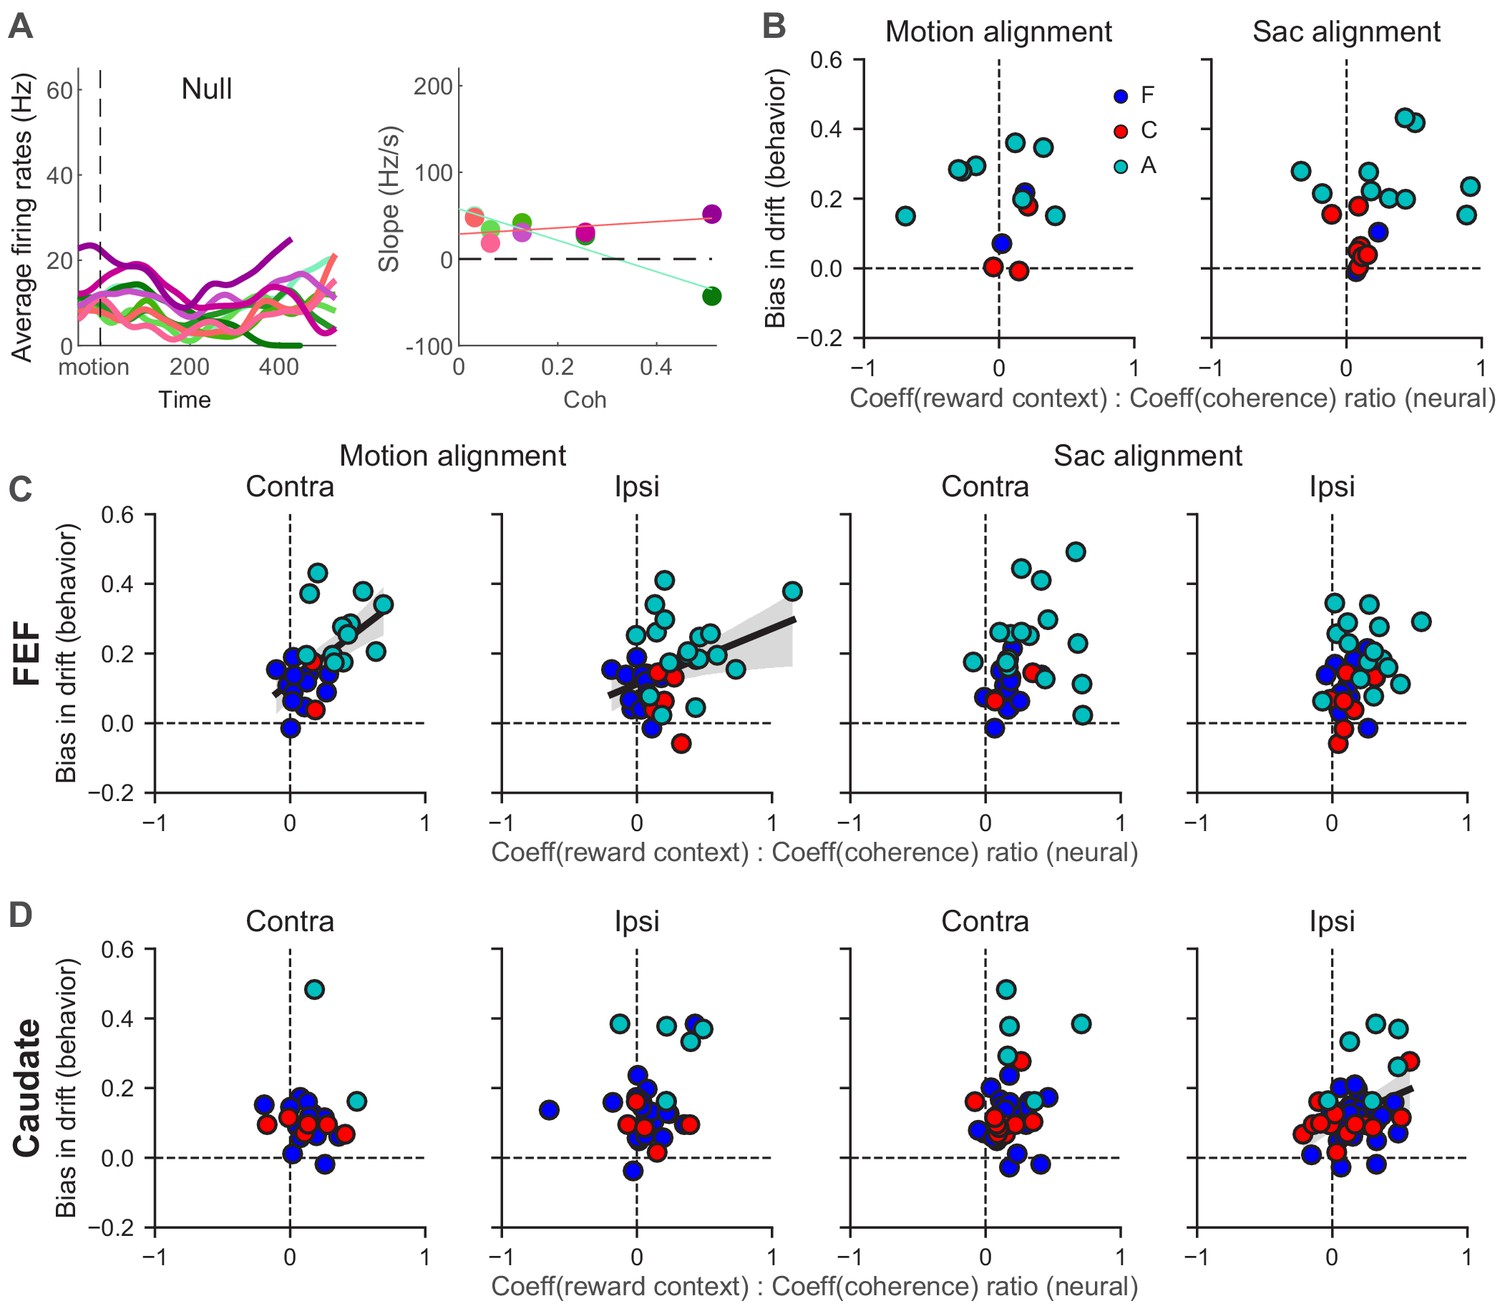
Figure 6 with 2 supplements
Reward-context modulation of the rate of change in FEF more closely reflected reward bias in drift rates.
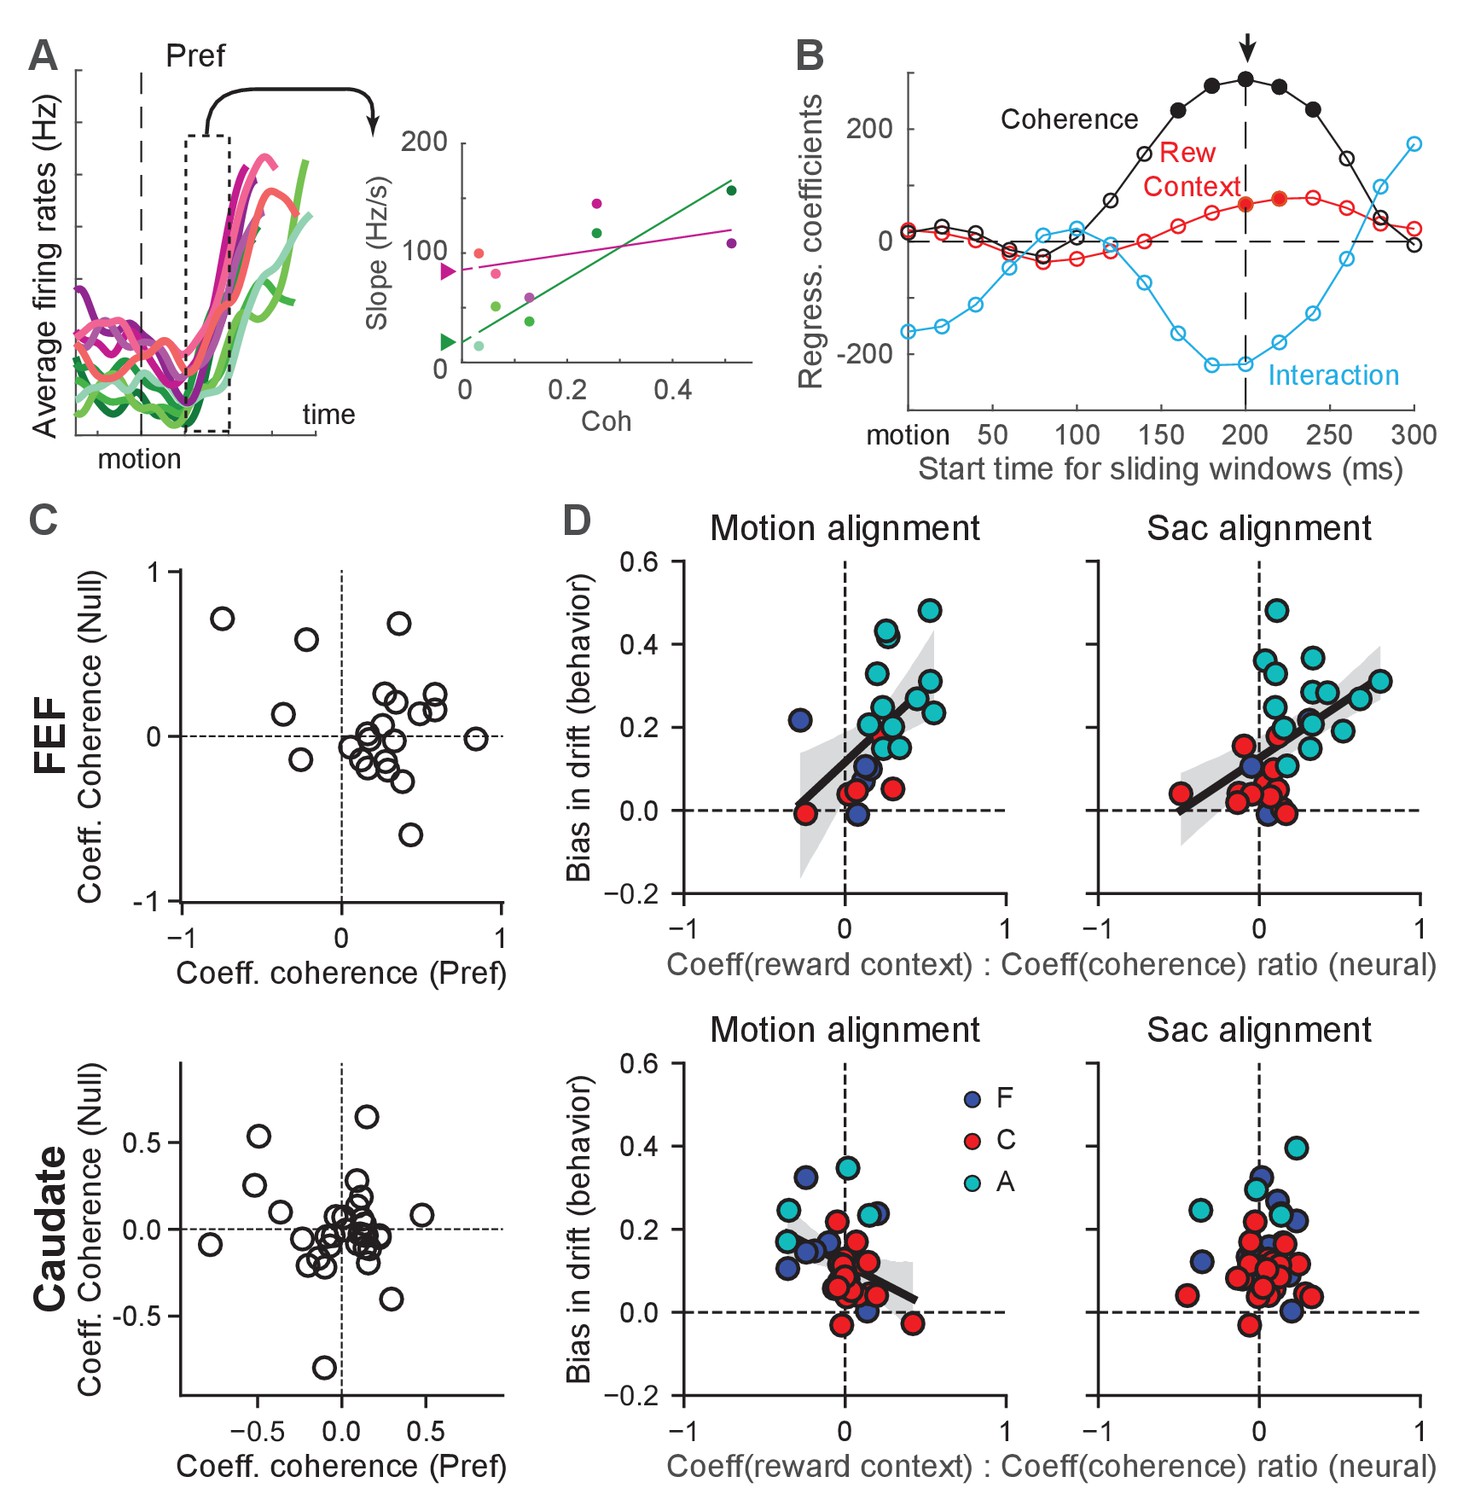
(A) Illustration of measurements of different modulations of the rate of change for a single neuron. Left: average firing rates of the example neuron in Figure 2B for its preferred choice and aligned to motion onset. In 200 ms sliding windows, linear regressions were performed to estimate the slope of firing-rate changes as a function of time, coherence, reward context and their combination. Right: slope values for the sliding window in the left panel. A multiple linear regression was performed with coherence, reward context and their interaction as the regressors (lines). The offset between the two reward contexts at zero coherence (filled triangles) represents the magnitude of reward-context modulation in the regression. (B) The regression coefficients of the linear regression for different sliding windows for the example neuron. Filled circle: coefficient was significantly different from zero (t-test, p<0.05). For each neuron, the time with the largest absolute coherence modulation was identified (arrow). For the alignment to motion onset, a minimum 100 ms visual latency was imposed. (C) Coefficient values for FEF (top) and caudate (bottom) neurons with significant coherence-modulated slope values for trials with the preferred choices. (D) Scatter plots of the ratio of regression coefficients for reward context and coherence modulation (abscissa) and the behavioral bias in drift rates (from DDM fits, ordinate), for FEF (top) and caudate (bottom) neurons with significant coherence modulation. Preferred choice only. Slope values were measured from activity aligned to motion (left) and saccade (right) onset. Line and shaded area: linear regression with significant non-zero slope (t-test, p<0.05) and 95% confidence interval. Colors indicate neurons from the three monkeys.
-
Figure 6—source data 1
Source data for Figure 6D: FEF activity aligned to motion onset.
- https://cdn.elifesciences.org/articles/60535/elife-60535-fig6-data1-v1.csv
-
Figure 6—source data 2
Source data for Figure 6D: FEF activity aligned to saccade onset.
- https://cdn.elifesciences.org/articles/60535/elife-60535-fig6-data2-v1.csv
-
Figure 6—source data 3
Source data for Figure 6D: caudate activity aligned to motion onset.
- https://cdn.elifesciences.org/articles/60535/elife-60535-fig6-data3-v1.csv
-
Figure 6—source data 4
Source data for Figure 6D: caudate activity aligned to saccade onset.
- https://cdn.elifesciences.org/articles/60535/elife-60535-fig6-data4-v1.csv
Figure 6—figure supplement 1
Slope measurements from trials with the non-preferred choices and from neurons without consistent choice selectivity.
(A) Results from trials with the non-preferred (null) choice for the same FEF neuron as in Figure 6A. Same format as Figure 6A. (B) Results from trials with null choices for FEF neurons with significant coherence modulation of the slope of firing rates and consistent choice selectivity. Same format as Figure 6D. (C) Results from FEF neurons without consistent choice selectivity. Same format as Figure 6D, except that trials were separated by contralateral/upward choices and ipsilateral/downward choices. (D) Results from caudate neurons without consistent choice selectivity. Same format as C.
Figure 6—figure supplement 2
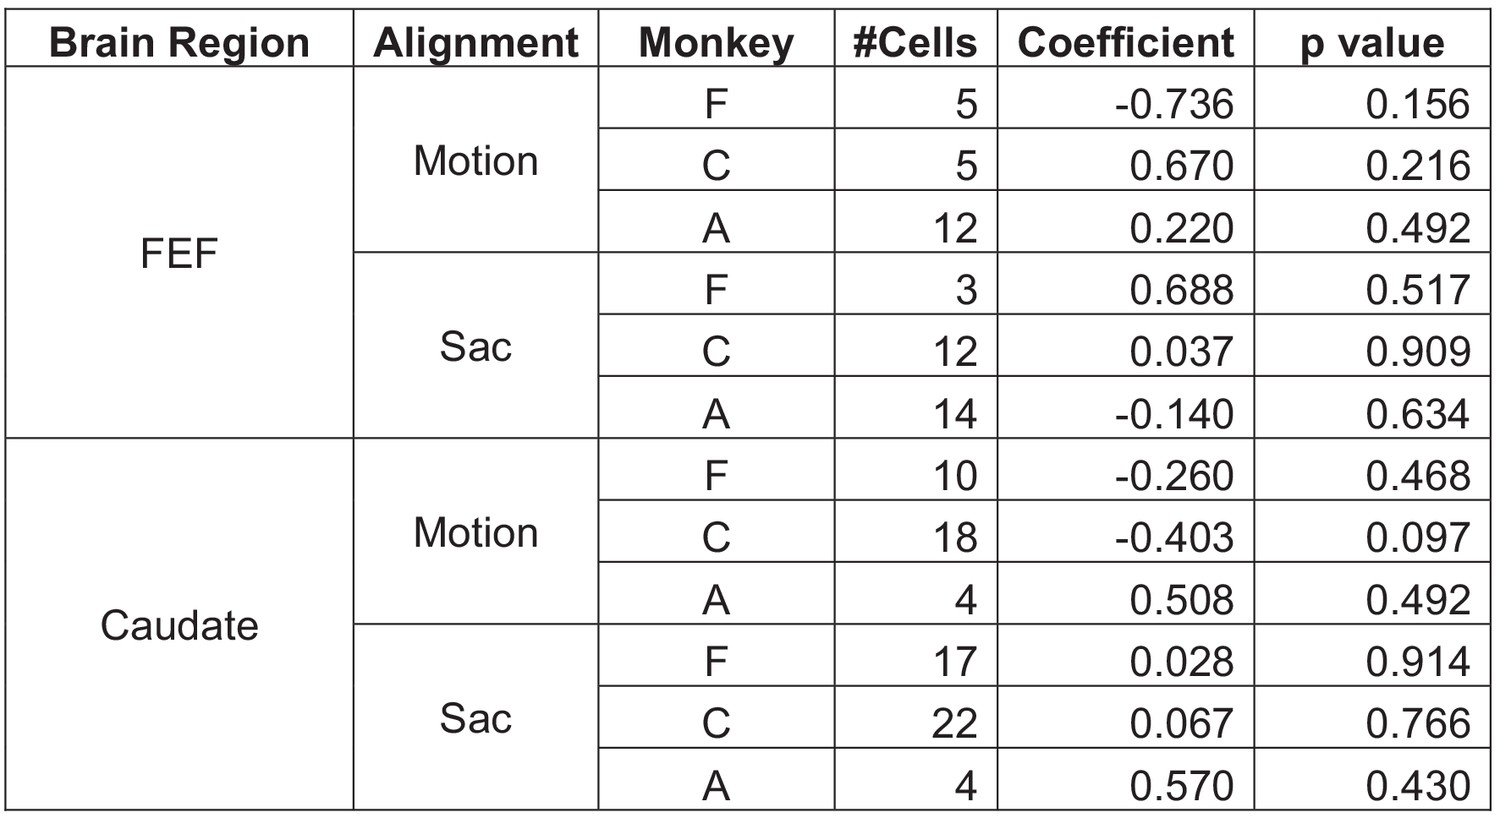
Results of correlation analysis as used in Figure 6D, for the three monkeys separately.
Only neurons with consistent choice selectivity and significant coherence selectivity during the motion/saccade epoch were included.
Figure 7 with 2 supplements
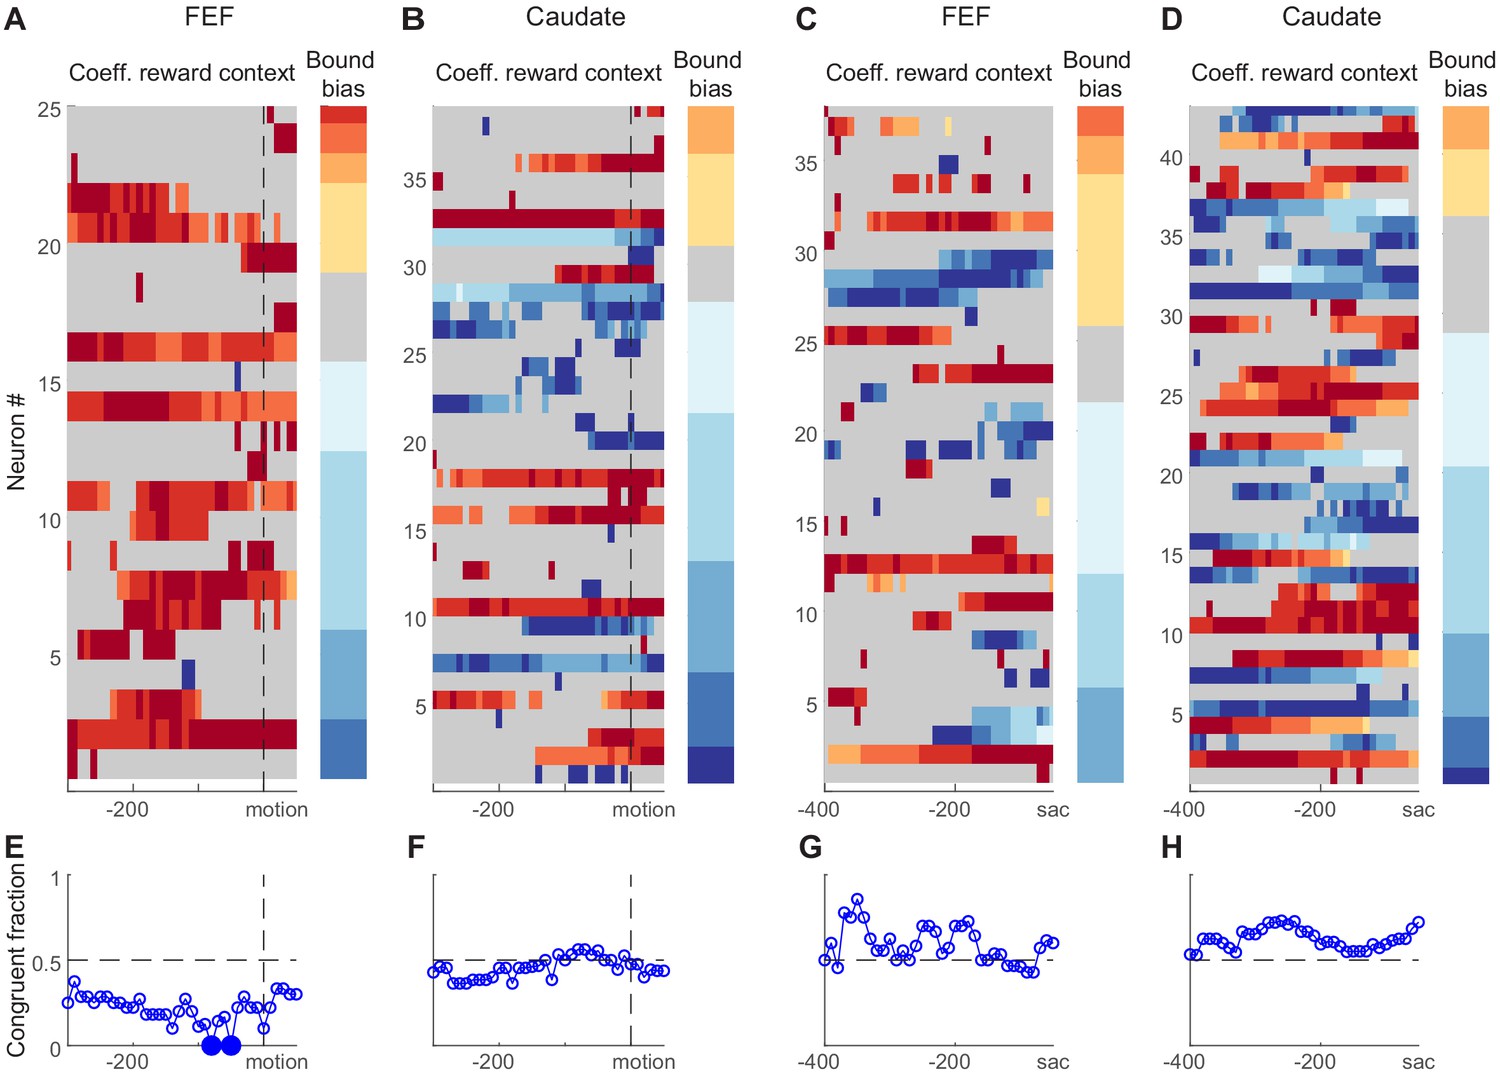
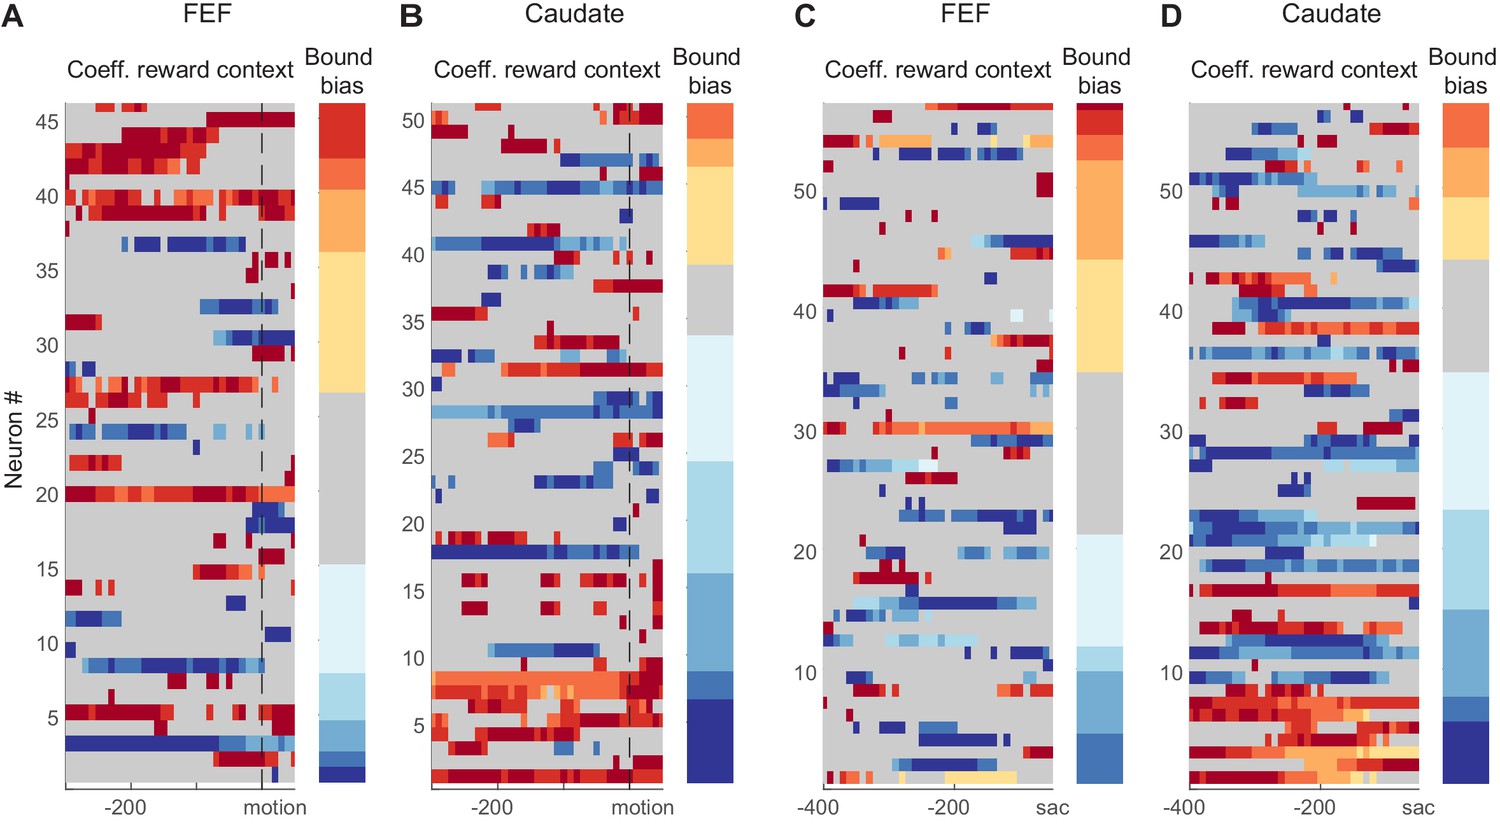
Reward-context modulation of neural activity did not conform to predictions of reward bias in relative bound heights.
(A,B) Heatmaps of normalized regression coefficients for choice-selective FEF (A) and caudate (B) neural activity before/around motion onset (Equation 3). Only neurons with significant modulation in at least one time bin are shown (t-test, p<0.05). Neurons were sorted by bound bias values (color bar to the right), measured with DDM fits. Coefficients were normalized by the maximal absolute value for each neuron for better visualization. For the heatmaps, warm colors indicate stronger activity when the neuron’s preferred choice was paired with large reward, cool colors indicate stronger activity when the null choice was paired with large reward, and gray indicates bins without significant reward context modulation. For the color bars, warm colors indicate bound biases that favored the large-reward choice, cool colors indicate bound biases that favored the small-reward choice. (C,D) Heatmaps of normalized regression coefficients for activity before saccade onset. Same format as A and B. (E-H) Fractions of neurons showing reward context modulation that was congruent with the behaviorally measured bound bias for panels (A-D), respectively. Filled circles indicate fractions that were significantly different from chance level (0.5; chi-square test, 0 < 0.05).
Figure 7—figure supplement 1
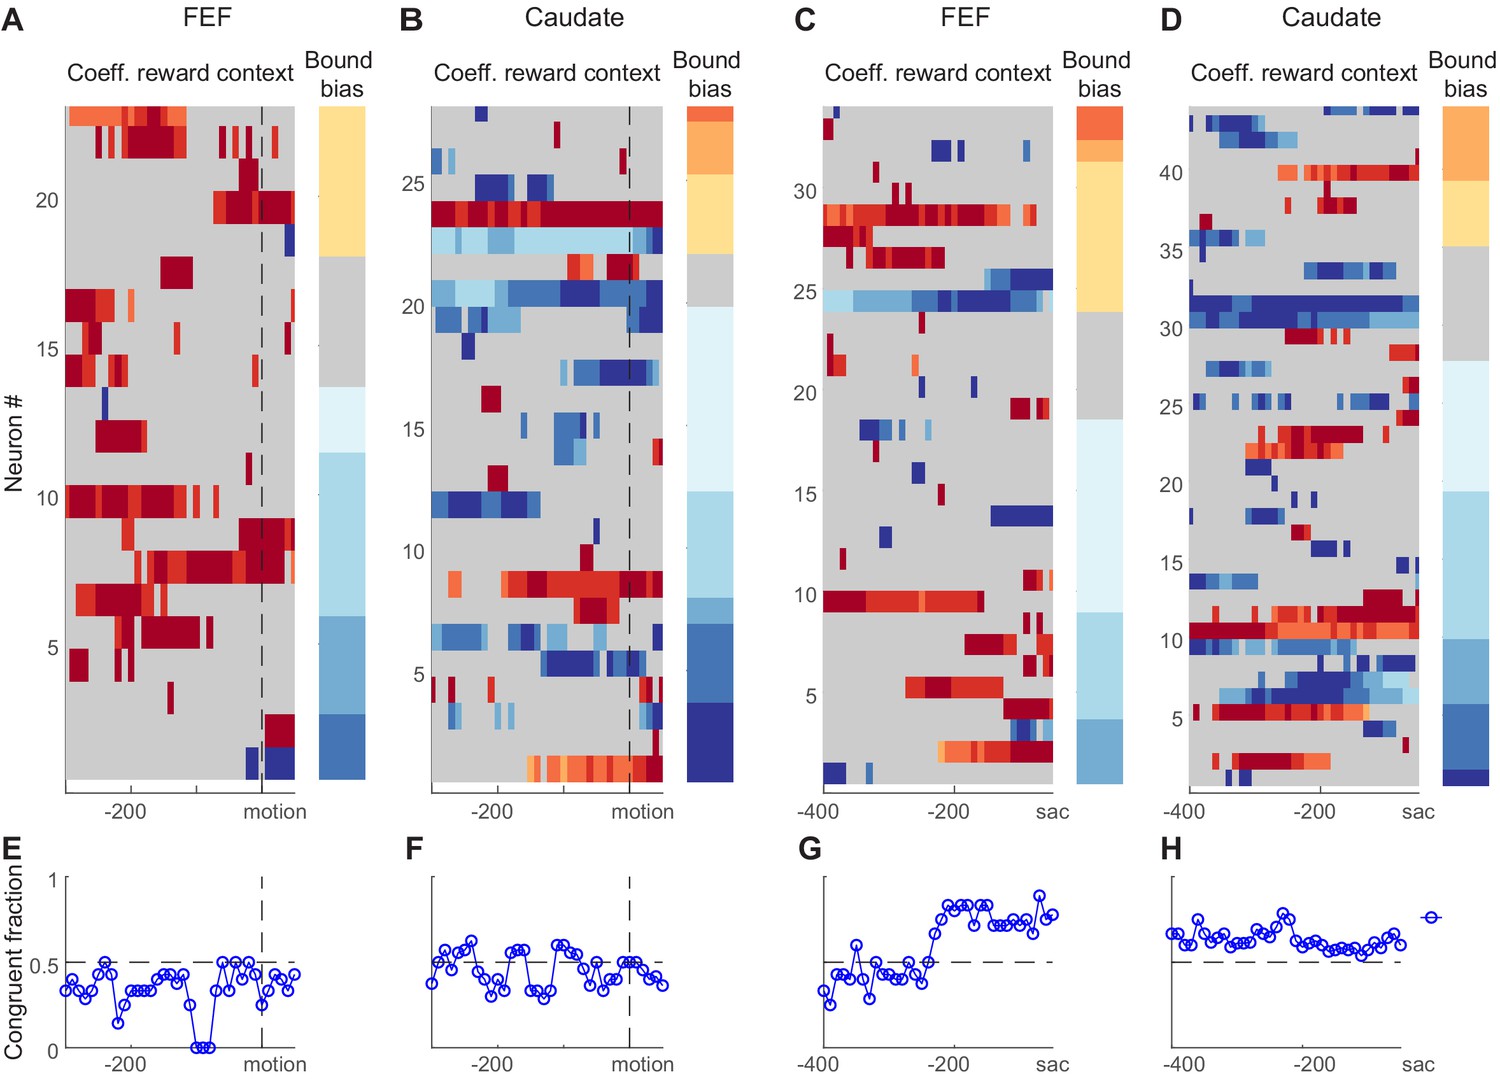
Reward-context modulation of neural activity did not conform to predictions of reward bias in relative bound heights.
Same format as Figure 7, except for using coherence-based regression (Equation 2).
Figure 7—figure supplement 2
Reward-context modulation of neural activity in not-consistently-choice-selective neurons.
Same format as Figure 7A–D, except for the color codes in heatmaps: warm colors indicate stronger activity when the contralateral/up choice was paired with large reward, cool colors indicate stronger activity when the ipsilateral/down choice was paired with large reward, and gray indicates bins without significant reward context modulation. Note also that there is no meaningful definition of congruency due to these neurons’ lack of choice selectivity.
Figure 8
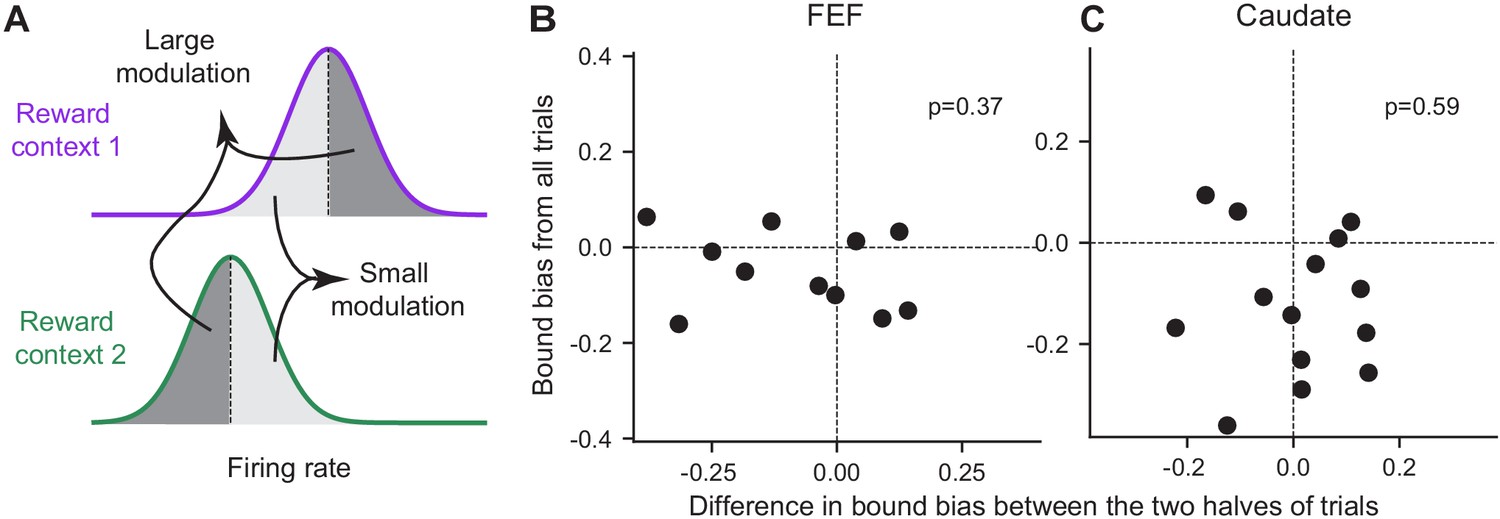
The magnitude of reward bias in relative bound heights did not vary with reward-context modulation of neural activity.
(A) Trials for each reward context were split into two halves based on a neuron’s average activity before motion onset (epoch #3). Reward bias in relative bound heights were measured for trials with large/small reward-context modulation of activity (dark gray/light gray). If the neural activity reflects the behavioral bias, the trials with large modulation were expected to show a larger behavioral bias. (B,C) Scatter plots of the difference in reward bias in relative bound heights between large and small-modulation trials and the bias measured from all trials for FEF (B) and caudate (C) neurons with consistent choice selectivity and significant reward context modulation. P values are from t-test (H0: the mean difference of the x-axis values is zero).
Tables
Table 1
Summary of counts/percentages for neurons with task-modulated activity.
| FEF | Caudate | |||||
|---|---|---|---|---|---|---|
| Monkey A | Monkey C | Monkey F | Monkey A | Monkey C | Monkey F | |
| Total | 85 | 24 | 40 | 18 | 49 | 73 |
| Consistently choice-selective | 35 | 14 | 7 | 6 | 31 | 21 |
| 41% | 58% | 18% | 33% | 63% | 29% | |
| Coherence-modulated slope of firing rate during motion viewing | 44 | 12 | 26 | 10 | 33 | 41 |
| 52% | 50% | 65% | 56% | 67% | 56% | |
| Reward context-modulated slope of firing rate during motion viewing | 21 | 5 | 3 | 2 | 9 | 15 |
| 25% | 21% | 8% | 11% | 18% | 21% | |
| Reward context-modulated activity before motion onset | 38 | 12 | 19 | 15 | 34 | 39 |
| 45% | 50% | 48% | 83% | 69% | 53% | |
| Reward context-modulated activity just before saccade onset | 51 | 16 | 26 | 15 | 34 | 49 |
| 60% | 67% | 65% | 83% | 69% | 67% | |
Key resources table
| Reagent type (species) or resource | Designation | Source or reference | Identifiers | Additional information |
|---|---|---|---|---|
| Software, algorithm | MATLAB | Mathworks | RRID:SCR_001622 | https://www.mathworks.com |
| Software, algorithm | Python 3.5 | Python Software Foundation | RRID:SCR_008394 | https://www.python.org/ |
| Software, algorithm | Psychophysics Toolbox | Pelli, 1997; Kleiner, 2007 | RRID:SCR_002881 | http://psychtoolbox.org/ |
| Software, algorithm | Pandas v0.19.2 | Python Data Analysis Library | RRID:SCR_018214 | https://pandas.pydata.org/ |
| Software, algorithm | Scikit-learn v0.18.1 | scikit-learn.org | RRID:SCR_002577 | https://scikit-learn.org/stable/ |
| Software, algorithm | Statsmodels v0.8.0 | Statsmodels.org | RRID:SCR_016074 | https://www.statsmodels.org/stable/index.html |
| Software, algorithm | Scipy v0.18.1 | SciPy.org | RRID:SCR_008058 | https://docs.scipy.org/doc/scipy/reference/stats.html |
| Software, algorithm | PyMC 2.3.6 | http://github.com/pymc-devs/pymc | http://github.com/pymc-devs/pymc | |
| Software, algorithm | dPCA | Kobak et al., 2016 | https://github.com/machenslab/dPCA/tree/master/matlab |
Additional files
Download links
A two-part list of links to download the article, or parts of the article, in various formats.
Downloads (link to download the article as PDF)
Open citations (links to open the citations from this article in various online reference manager services)
Cite this article (links to download the citations from this article in formats compatible with various reference manager tools)
Frontal eye field and caudate neurons make different contributions to reward-biased perceptual decisions
eLife 9:e60535.
https://doi.org/10.7554/eLife.60535


